Article

A Smart Decision Support Framework for Sustainable and Resilient Supplier Selection and Order Allocation in the Pharmaceutical Industry

by
Saheeb Ahmed Kayani
*,
Salman Sagheer Warsi
and
Raja Awais Liaqait
Department of Mechanical Engineering, Capital University of Science and Technology, Islamabad 44000, Pakistan
*
Author to whom correspondence should be addressed.
Sustainability 2023, 15(7), 5962; https://doi.org/10.3390/su15075962
Submission received: 22 December 2022 / Revised: 16 March 2023 / Accepted: 24 March 2023 / Published: 29 March 2023

Abstract

:
Supplier selection and order allocation (SS-OA) are two of the most important strategic decisions for supply chain network design and operation. If sustainability and resilience criteria are taken into consideration together and a holistic sustainable and resilient SS-OA is carried out, it may enable the supply chain network to perform better when subjected to disruption scenarios. In this research paper, a novel comprehensive multi-phase, multi-period sustainable, and resilient SS-OA decision support framework has been proposed. This framework integrates fuzzy multi-criteria decision-making (MCDM) techniques with a fuzzy multi-objective mixed integer nonlinear programming (MOMINLP) mathematical model to optimize triple bottom line (TBL) sustainability and resilience criteria simultaneously for a multi-modal, multi-echelon supply chain network. The proposed framework has been implemented using real-time data collected from the pharmaceutical industry. The results show that among the TBL sustainability criteria, product price, past business, innovative capability, and information disclosure rank as the most significant sub-criteria for the DMs in the pharmaceutical industry, while robustness and flexibility are considered the most valued attributes for potential suppliers as far as the resilience criterion is concerned. An assessment of the results has revealed that transfer cost and custom clearance cost together comprise more than two-thirds of the overall cost of the supply chain network. It has also been noted that inland transportation of goods is dominated by rail as the most preferred mode of transport. Transportation by rail is particularly preferred by suppliers located in geographically contiguous countries.

1. Introduction

Sustainability can be defined as creating and maintaining conditions under which humans and nature co-exist in productive harmony thus ensuring the future of present and coming generations. Sustainable manufacturing refers to the development of manufactured products through processes that are economically sound, have minimal environmental impact, and are firmly based on the principles of energy and natural resource conservation. It essentially includes employee, community, and product safety, and leads to a positive societal impact. Supply chain management is a vital component of any manufacturing operation. Thus, supply chain sustainability may be defined as the management of supply chains where all three dimensions or aspects of sustainability, i.e., economic (or profit), environmental (or planet), and social (or people), the so called “triple bottom line” or TBL, are taken into consideration [1].
Sustainable supply chain management aims for voluntary integration of the three dimensions of sustainability as referred to above with key inter-organizational business systems designed for effective and efficient management of material, information, and capital flows associated with the procurement, production, and distribution of products [2]. The primary objective of this integration is to achieve an optimal combination of the three dimensions of sustainability with supply chain network operations. There is considerable practical evidence around the world and reported in the literature that sustainable supply chains usually offer superior logistics performance and resources utilization [3]. Thus, sustainability and adherence to sustainability practices usually serve as a source of competitive advantage for any organization engaged in international business or trade.
Supplier selection is the process by which firms identify, evaluate, and contract with suppliers. The main objective of the supplier selection process is to reduce purchase risk, maximize overall value to the purchaser, and develop long-term relationships between buyers and suppliers [4]. Supplier selection is divided into two main categories: single sourcing, where only one supplier is able to fulfill an organization’s demands, and multiple sourcing, where more than one supplier is selected as no one supplier is single-handedly capable of meeting the demand requirements of the enterprise. In cases of single sourcing, the decision makers (DMs) have to choose and select only one supplier where as in the case of multiple sourcing the task of the DMs is more challenging as they have to select the best suppliers out of many and then allocate optimal quantities to each supplier in order to create an environment of fair play and genuine competition, while maximizing returns for their own organization at the same time. Usually, the practice of multiple sourcing is preferred due to its inherent characteristics of ensuring order flexibility, capacity, and timely delivery, given the variation that may exist in the orders that can be placed by any organization [5].
Supplier selection is a complex phenomenon and a multi-criteria decision-making (MCDM) process that requires assessment and evaluation of various conflicting criteria, i.e., cost, product quality, delivery time, service level, etc., that need to be taken into consideration in order to select consistent suppliers [6,7]. Supplier selection and order allocation (SS-OA) has been traditionally carried out using only economic or so-called conventional criteria, but the growing concern for sustainability issues in manufacturing and supply chain management in recent years has shifted the focus towards inclusion of environmental and social criteria in this process as well. This integration of TBL sustainability criteria with supplier selection and order allocation leads to adding more complexity to the supplier selection and order allocation problem [8]. In sustainable supplier selection and order allocation (SSS-OA), the suppliers are selected using TBL sustainability criteria whereas the order allocation is carried out using a multiple sourcing strategy.
Resilience is defined as the intrinsic ability of an organization, system, or network to keep or recover a steady state, thereby allowing it to continue normal operations after facing a disruptive event [9]. Supply chain resilience may be referred to as the ability of a supply chain network to both resist disruptions and to recover operational capability after disruptions have occurred. A sustainable supply chain, though efficient, will always be vulnerable against unexpected natural or manmade disasters such as earthquakes, floods, global pandemics, territorial conflicts, terrorist activities, and many other similar scenarios. Selecting suppliers that have been evaluated and allocating optimal order quantities that have been determined based on criteria that incorporates both TBL sustainability dimensions and resilience aspects concurrently will not only ensure an adequately performing sustainable supply chain but will also significantly reduce the likelihood of performance degradation and disruption propagation in the form of supply chain quantity downscaling when disrupted [10].
The study presented in this article is motivated by the research gap that exists due to the lack of a methodological framework that combines TBL sustainability and resilience criteria in both supplier selection and order allocation parts of the SS-OA problem. In order to address this research gap, a novel comprehensive multi-phase, multi-period sustainable and resilient SS-OA decision support framework has been proposed. This framework integrates fuzzy MCDM techniques with a fuzzy multi-objective mixed integer nonlinear programming (MOMINLP) mathematical model to optimize TBL sustainability and resilience criteria simultaneously for a multi-modal, multi-echelon supply chain network. The proposed framework has been implemented using data from the pharmaceutical industry, which has emerged as one of the most critical industry sectors when taken into consideration with regards to the impact of the COVID-19 pandemic globally.
The rest of this article is organized as follows: Section 2 presents a detailed and contextual overview of the existing literature related to the sustainable and resilient supplier selection and order allocation problem. Section 3 briefly describes the structure and components of the problem that has been addressed in this research work. Section 4 presents the complete methodology, i.e., the decision support framework, the mathematical model, and the solution approach. Section 5 includes the details of the results of the application of the proposed methodology to a case study. A brief discussion and analysis of the results has been included in Section 6, while Section 7 presents managerial implications of the research work. Finally, Section 8 presents the conclusions and avenues for future research.

2. Literature Review

In SS-OA, selecting the right criteria for evaluating suppliers and assigning orders is considered a key issue. The earliest reported criteria for supplier evaluation by Dickson is comprised of 23 different attributes [11]. This research work identified product price, quality, on time delivery, and supplier’s effectiveness, etc., as important criteria for single supplier selection. Weber et al. [12] presented net price as the main evaluation criteria for any decision-making process concerning supplier selection. Hong and Hayya [13] conductedempirical research and determined that sourcing from multiple suppliers can reduce the overall purchasing and inventory cost in a just-in-time manufacturing setup. Wilson [14] analyzed the relative preference of each supplier selection criteria and concluded that product price, product quality, product delivery, and supplier service are the key characteristics for single supplier selection. A survey by Swift [15] reported that product price, product availability, product design, supplier reputation, and product reliability are the critical factors for evaluation of single or multiple suppliers. It was reported by Vonderembse and Tracey [16] that in the manufacturing industry, product quality, product availability, product reliability, and product performance are the key evaluation criteria for supplier selection. Ghodsypour and O’Brien [17] used total cost of purchasing and product quality as evaluation criteria to highlight the significance of single and multiple sourcing. A comprehensive review on multiple sourcing presented by Minner [18] highlighted that the practice of selecting more than one supplier can potentially increase the negotiation power of the buyer. Multiple suppliers can help the buyer to successfully mitigate risks or disruption scenarios and offer competitive advantages between potential suppliers. Ho et al. [19] analyzed the existing literature on supplier selection and determined that product price, quality, and delivery are the most important selection criteria. Chang et al. [20] carried out a study of the literature to point out that cost, flexibility, quality, delivery reliability, capacity of related facilities, technology capability, lead time, reduction on demand change, environmental control, and service level are the top ten criteria taken into consideration during the supplier selection process. Four supplier evaluation and selection criteria, i.e., cost, quality, service, and capacity, have been identified by Kazemi et al. [21] while developing a mathematical programming model for supplier selection that incorporates uncertainty. It can be seen from the above discussion that over the years different evaluation and selection criteria have been identified and used by various authors in the published literature for SS-OA.

2.1. Sustainable Supplier Selection

The principles and practices of TBL sustainability have been integrated with supply chain management for many years past. Several research studies have been carried out in order to understand and highlight the utility and significance of integrating sustainability criteria with supply chain management [22]. Owing to the multifarious nature of TBL sustainability, MCDM techniques have been frequently used to evaluate sustainable supply chain network performance. A framework for green supplier selection has been presented by Lee et al. [23] in which an MCDM technique has been used for supplier evaluation based on product quality, supplier technical capability, product life cycle cost, carbon footprint, environmental management system, recycling capability, and supplier green competency as major criteria. A ranking model for sustainable supplier selection has been proposed by Amindoust et al. [24] based on cost, quality, technology capability, pollution, resource consumption, and information disclosure as the main sustainability attributes. A two-phase hybrid model for green supplier selection has been proposed by Govindan and Sivakumar [25]. This model evaluated the potential suppliers using criteria such as product cost, product quality, on time delivery, recycling capacity, and greenhouse gas emissions control. Mohammed et al. [26] have presented a framework for evaluating sustainable livestock suppliers on the basis of criteria such as cost, technical capability, delivery reliability, environmental and waste management systems, pollution production, supplier safety, and staff development. Lo et al. [27] have used a combination of ten sustainability criteria for supplier performance evaluation. This research work highlighted the relative preferences of criteria for various departments in an electronics goods manufacturing industry. Gören [28] has used thirteen different sub-criteria for the evaluation of potential suppliers with regards to TBL aspects of sustainability. The sub-criteria were evaluated using MCDM techniques in order to determine the relative preferences of DMs. An MCDM technique coupled with a fuzzy approach has been used by Memari et al. [29] to evaluate suppliers based on sustainability attributes such as cost, quality, service, pollution reduction, green competency, and employment practices. This research work has been implemented using data from an automotive parts manufacturing industry. Khoshfetrat et al. [30] have used criteria such as price, technology level, environmental management system, green design, respect for law, and workers’ and shareholders’ rights for supplier evaluation and order allocation. An MCDM technique has been used for supplier selection while a fuzzy approach has been incorporated in the order allocation part of this research work to account for the effects of the uncertainty encountered in actual supply chain network operations. Tirkolaee et al. [31] have used multiple MCDM techniques to evaluate suppliers engaged with an electronic goods supply chain using sustainability criteria such as cost, automation, product shelf life, environmental pollution, customer status, trust and communication, and human rights. A dynamic decision support system for sustainable supplier selection has been proposed by Alavi et al. [32] for the petrochemical industry. This research work has employed multiple TBL sustainability criteria, i.e., cost, quality, flexibility, waste and environmental management systems, occupational health and safety management, and child and forced labor issues for supplier assessment. This review of the published literature has highlighted that while economic and environmental criteria have been incorporated in modeling for supplier selection and order allocation extensively, the social criteria and their impact has been relatively less explored.
Various MCDM techniques and mathematical modeling approaches have been used for sustainable supplier evaluation and selection, i.e., Analytical Hierarchy Process (AHP), Analytic Network Process (ANP), Technique for Order of Preference by Similarity to Ideal Solution (TOPSIS), Quality Function Deployment (QFD), Data Envelopment Analysis (DEA), Decision Making Trial and Evaluation Laboratory (DEMATEL), Visekriterijumska Optimizacija i Kompromisno Resenje (VIKOR), Delphi method, Adaptive Neuro-Fuzzy Inference System (ANFIS), and Additive Ratio Assessment (ARAS) method, etc.
In the extant literature, a combination of two or more MCDM techniques has been usually employed for criteria weighting and for evaluating the priority or ranking of sustainable suppliers. For instance, Zhou and Xu [33] have proposed an integrated MCDM model based on DEMATEL, ANP, and VIKOR for sustainable supplier selection in the retail industry. Hoseini et al. [34] have employed fuzzy BWM for determining the weights of sustainability criteria followed by weighted FIS for the ranking of suppliers in the construction industry. Boz et al. [35] have used a combination of fuzzy BWM and fuzzy ARAS method for sustainable supplier selection in the healthcare sector with a focus on optimizing logistics performance of the supply chain during COVID-19.Zhang et al. [36] have proposed a framework for combining rough DEMATEL and fuzzy VIKOR for calculating weights of sustainability criteria and identifying the most suitable supplier. They have demonstrated the proposed framework with the help of a numerical case study.
Out of all the MCDM techniques listed above, AHP and TOPSIS or any variations of these are the most frequently used for addressing the sustainable supplier selection problem [7,37]. A few instances from the literature are presented here for illustrating the wide spectrum of application of these techniques. Awasthi et al. [38] have developed a multi-stage framework based on fuzzy TOPSIS for the selection of suppliers using an environmental criterion. Büyüközkan and Cifci [39] have used a hybrid framework augmented with fuzzy DEMATEL, fuzzy ANP, and fuzzy TOPSIS to evaluate green suppliers. Kannan et al. [6] have used fuzzy TOPSIS augmented with ad hoc weights to solve the green supplier selection problem. Freeman and Chen [40] have applied TOPSIS augmented with entropy and AHP to evaluate the relative importance of sustainable suppliers. An AHP and VIKOR method-based sustainable supplier evaluation and ranking approach has been proposed by Luthra et al. [41]. Mohammed et al. [26] have applied fuzzy AHP and fuzzy TOPSIS for supplier selection in a livestock supply chain network based on TBL sustainability criteria. Yadavalli et al. [42] have used fuzzy TOPSIS for sustainable supplier assessment and selection aimed at the home appliances manufacturing industry. Mohammed et al. [43] have proposed a multi-objective optimization model that employs fuzzy AHP and Fuzzy TOPSIS for evaluation of suppliers based on sustainability criteria. An integrated Delphi method, fuzzy TOPSIS, and multi-objective programming approach has been presented by Rabieh et al. [44] for evaluating suppliers using TBL sustainability attributes. Okwu and Tartibu [45] have proposed a combined TOPSIS and ANFIS methodology for sustainable supplier selection to be used in the consumer goods supply chain. It is evident from the above description that AHP and TOPSIS are two of the most flexible and diversely-used quantitative multi-attribute assessment and decision-making techniques employed for sustainable supplier selection.

2.2. Sustainable Order Allocation

Order allocation is a complex multi-variate decision problem. Over the years different mathematical models have been developed and solved using various optimization techniques [5]. Faez et al. [46] have proposed a scenario-based mixed-integer linear programming (MILP) model for order allocation and solved it using LINGO optimization modeling software. A fuzzy MILP model under variable price and product uncertainty conditions has been proposed by Nazari-Shirkouhi et al. [47]. This model has been solved using an exact algorithm for determining optimal order quantities. A MILP model has been presented by Torabi et al. [48] for taking into account uncertainty and disruption risks. This model has been optimized using Augmented ε-Constraint Method (AUGMECON) and Differential Evolution Algorithm (DEA). Cebi and Otay [49] have developed a MILP model with multi-product uncertainty and quantity discounts and optimized it using augmented maximum-minimum and fuzzy Goal Programming (GP) algorithms to determine order allocation quantities. A weighted fuzzy multi-objective linear programming (MOLP) model has been presented by Bodaghi et al. [50]. This model addresses the integrated supplier selection, order allocation, and customer order scheduling problem for a make-to-order manufacturing system. An algorithm has also been proposed in this research work to solve the model and implemented using a numerical problem.
Sustainable order allocation is usually carried out using well-defined and distinct objectives such as cost, travel time, environmental impact, or any social criterion. Depending on the nature of the order allocation problem, single or multi-objective models may be formulated. A multi-objective mathematical programming model has been developed by Azadnia et al. [51] that minimizes total cost and maximizes total social score, environmental impact, and total economic qualitative score for optimal order allocation to selected suppliers. Govindan and Sivakumar [25] used TOPSIS and a linear programming model to minimize total cost, quality rejection, late delivery, recycle waste, and greenhouse gas emissions. A mixed-integer nonlinear programming (MINLP) model has been proposed by Hamdan and Cheaitou [52] as part of a framework that maximizes total value and minimizes total cost. Goren [28] employed fuzzy DEMATEL to calculate the weights of the sustainability criteria included in the mathematical model in order to minimize total cost and maximize total value of sustainable purchasing. Moheb-Alizadeh and Handfield [53] have developed a multi-objective MILP model that incorporates total cost, carbon emissions, and social responsibility as the three principal objective functions where cost and emissions are to be minimized while social responsibility is to be maximized. You et al. [54] have proposed a MOLP model that minimizes total cost, defective item rate, and late delivery while at the same time maximizing the total value of sustainable purchasing. They have used the Pivot Pairwise Relative Criteria Importance Assessment (PIPRECIA) method for calculating the weights of the selection criteria and ranked the candidate sustainable suppliers using extended Decision Field Theory (DFT). A multi-objective integer linear programming (MOILP) model has been presented byBeiki et al. [55] that minimizes total cost and carbon emissions while maximizing the total value of purchasing. This research work employs Language Entropy Weight Method (LEWM) for supplier evaluation and selection.
A variety of exact, heuristic, and meta-heuristic problem-solving algorithms have been used for evaluating and optimizing objective functions for sustainable order allocation. AUGMECON, Weighted Sum Method, Weighted Additive Model, Goal Programming, Dynamic Programming, Genetic Algorithm (GA), and DEA are some of the frequently used techniques reported in the published literature [56].

2.3. Sustainable and Resilient Supplier Selection and Order Allocation

Different approaches have been adopted by researchers for evaluating supply chain performance under the influence of accidents or unforeseen events. The response of the supply chain when subjected to such mishaps is almost always associated with the inherent resilience of the supply chain network and its components. Resilience can be considered as performance evaluation criteria alongside TBL sustainability in SS-OA problems and its sub-criteria can be identified in the same manner as economic, environmental, or social sub-criteria. As the combination of TBL sustainability with SS-OA transformed it into a sustainable supplier selection and order allocation or SSS-OA problem, the grouping of resilience with sustainability criteria will transform it into a sustainable and resilient supplier selection and an order allocation or SRSS-OA problem.
A resilience-based supplier selection approach has been presented by Rajesh and Ravi [57] using Grey Relational Analysis (GRA), AHP, and ANP. Supply chain velocity, supply chain visibility, supply chain vulnerability, and supply chain continuity management are some of the resilience sub-criteria included in this research work. Hosseini et al. [10] have evaluated the resilient supplier selection and order allocation problem using sub-criteria such as backup supplier, surplus and restorative capacity, and supplier segregation. They have used stochastic bi-objective mixed-integer programming (MIP) for both supplier selection and order allocation. Mohammed et al. [58] have integrated resilience with economic and environmental criteria for network design in a livestock supply chain using MCDM techniques and fuzzy multi-objective programming (MOP). Social sub-criteria have not been considered in this research work. Yavari and Zaker [59] have developed a supply chain network by combining economic, environmental, and resilience criteria using MILP. The social dimension of sustainability has been excluded in this research work and only one resilience sub-criterion has been considered, i.e., power disruption. A supplier selection approach has been presented by Xiong et al. [60] based only on environmental and resilience criteria. In this research work Weighted Aggregated Sum Product Assessment (WASPAS), Best Worst Method (BWM), and TOPSIS have been used to evaluate suppliers using surplus inventory, factory segregation, and reorganization as resilience sub-criteria. In this research work, the social criterion has been omitted as well.
From the literature review and discussion presented above, it is observed that SSS-OA has been mostly studied separately from resilient supplier selection and order allocation. In recent times, the emergence and global spread of the COVID-19 pandemic has highlighted the shortcomings of this approach as it is not always the case that a sustainable supplier will be a resilient supplier as well. The performance of such a supplier will mostly be far from ideal under the impact of supply chain network disruptions. Furthermore, even if sustainability and resilience have been considered together, resilience sub-criteria have usually been incorporated in the supplier selection process only and rarely in the order allocation part. It has also been noted that resilience sub-criteria considered in many research studies are vague or inadequately defined with limited scope and application, e.g., general disruption, general risk, etc., which limits their usefulness for evaluating the dynamics of supply chain network operations under the influence of disruption scenarios. The current literature on SRSS-OA lacks application of objective, quantitative MCDM techniques for supplier selection and presents very little effort towards the development of detailed mathematical models for order allocation based on combined sustainability and resilience criteria (Table 1). The research work included in the present research paper builds upon and extends the decision support framework and the model developed for sustainable supplier selection and order allocation by Liaqait et al. [61,62] by incorporating resilience criteria in all phases of the decision process and by implementing the proposed decision support framework for the pharmaceutical industry, which has emerged as one of the most critical industry sectors when taken into consideration with regards to the impact of the COVID-19 pandemic globally.

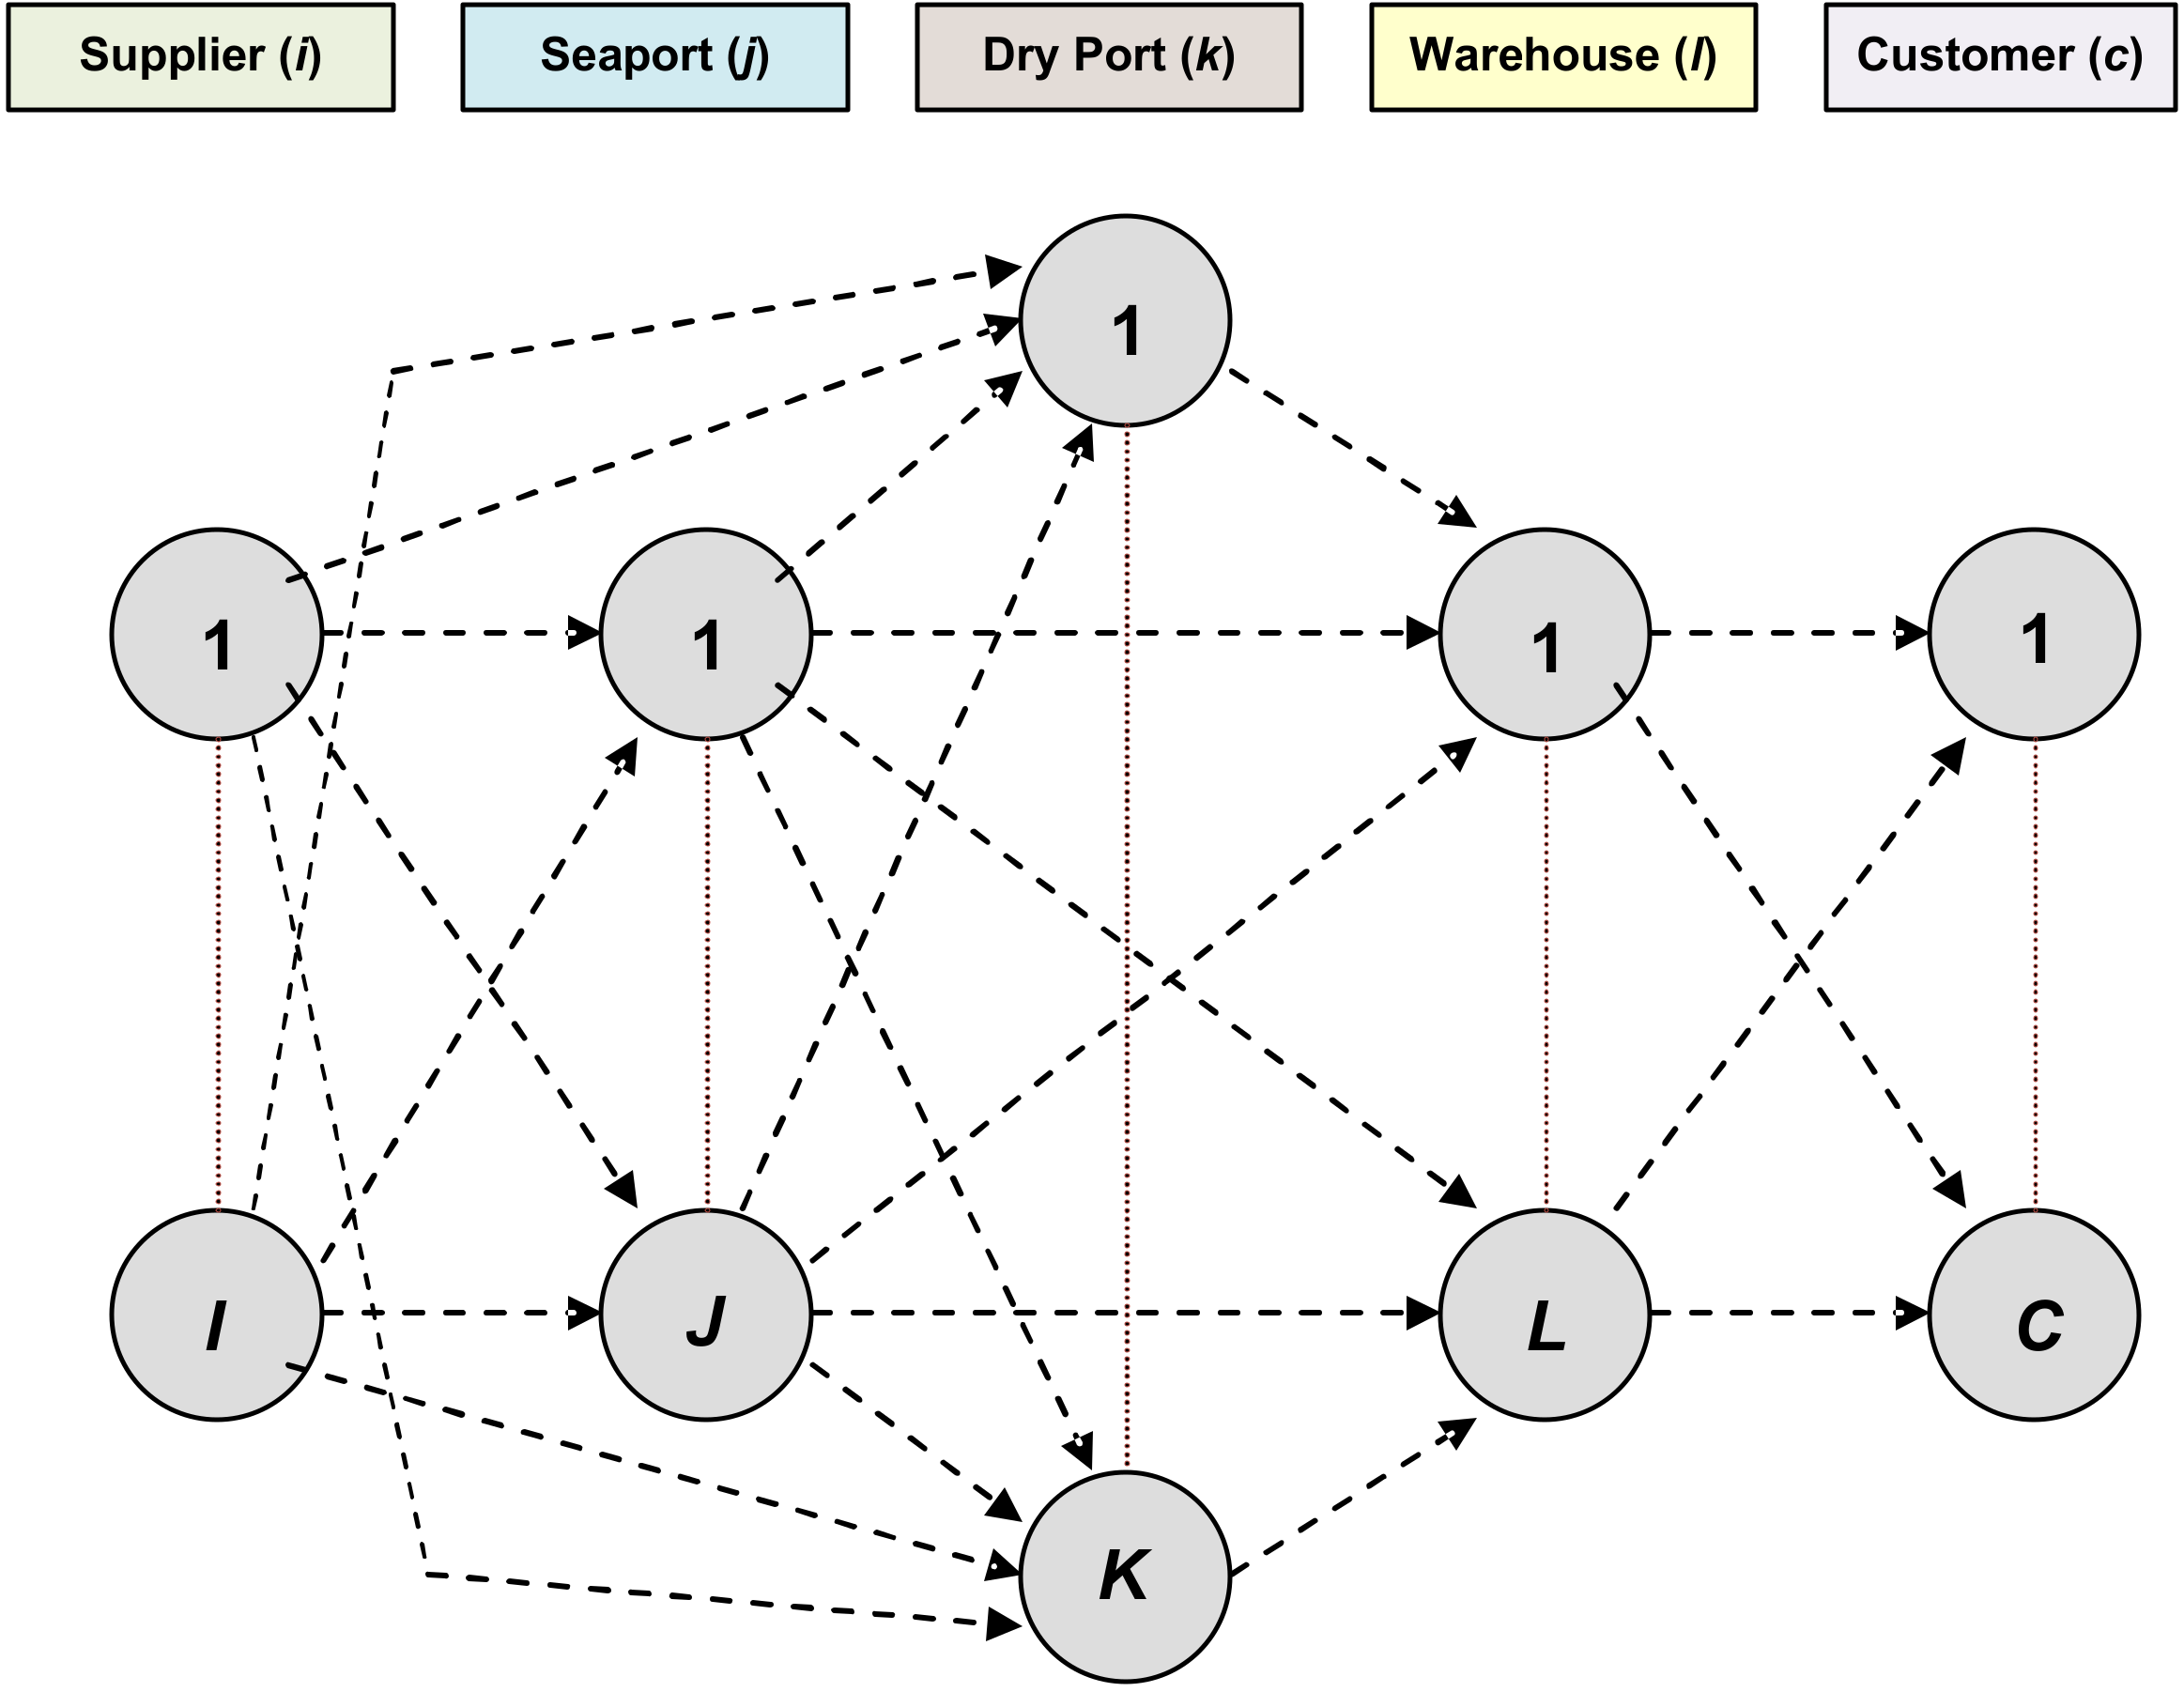
3. Problem Description
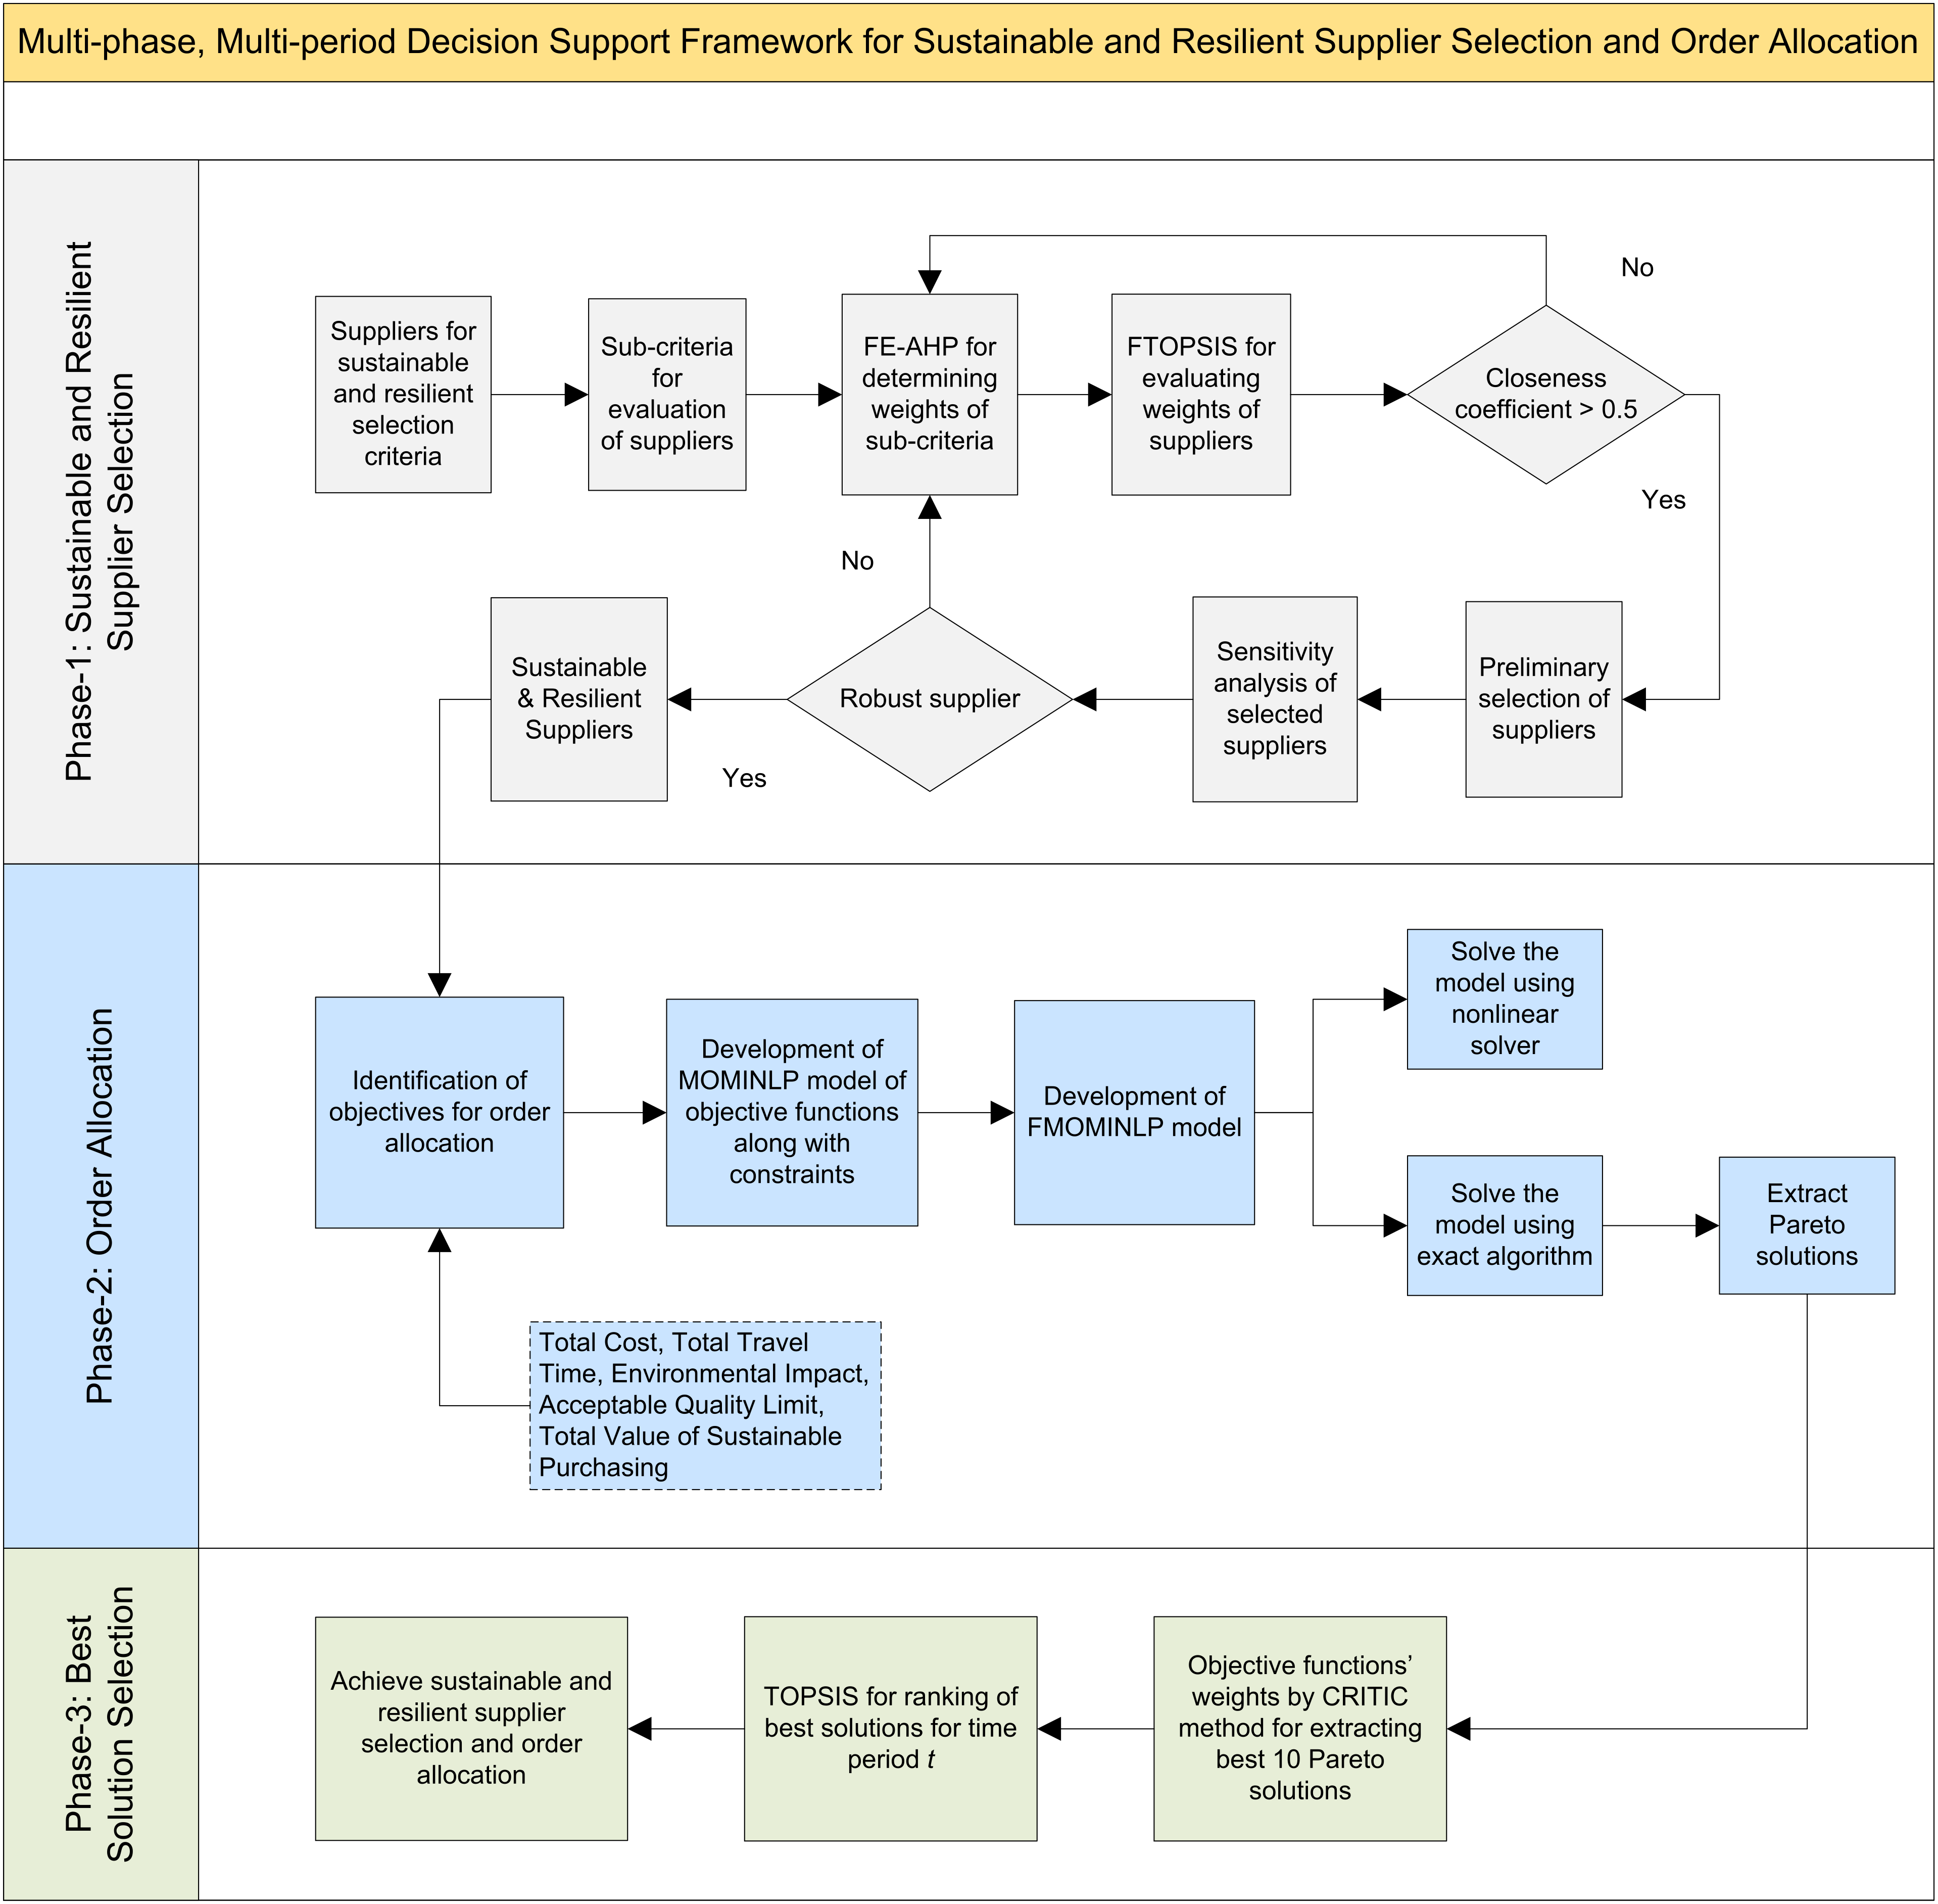
A multi-modal, multi-echelon supply chain network has been considered for the pharmaceutical industry in Figure 1 above. The supply chain network consists of supplier “i”, seaport “j”, dry port “k”, warehouse “l”, and customer “c”. The suppliers can ship order quantities either through seaport or dry port depending upon their geographical location through various transportation modes “m” at any time period “t”. The supply chain network is evaluated to determine optimal order quantities for the selected suppliers based on sustainability and resilience criteria and demand and capacity uncertainties by employing a fuzzy multi-objective mixed integer nonlinear programming (FMOMINLP) mathematical model. The inclusion of the dry port in the supply chain network along with the usual seaport provides a means to take into account all those suppliers that are located in such geographical proximity, i.e., suppliers located in a neighboring country where transportation of order quantities through rail or road is considered more feasible or economical as compared to transportation by sea.

4. Methodology

A multi-phase, multi-period decision support framework has been proposed for addressing the issue of sustainable and resilient supplier selection and order allocation in the pharmaceutical industry. The schematic of the proposed framework has been included below as Figure 2. The framework has been divided into three phases. In the first phase, the MCDM techniques fuzzy extended AHP (FE-AHP) and fuzzy TOPSIS (FTOPSIS) have been used to evaluate the potential suppliers in the context of TBL sustainability and resilience criteria. A fuzzy multi-objective, mixed-integer nonlinear programming (FMOMINLP) mathematical model has been developed in the second phase for optimal order allocation to the selected suppliers. This model has been solved by using a suitable nonlinear solver and an exact algorithm, i.e., Augmented ε-Constraint Method 2 (AUGMECON2), simultaneously for extracting a candidate list of best solutions. TOPSIS augmented with objective function weights determined using Criteria Importance through Intercriteria Correlation (CRITIC) method has been applied in the third phase to rank and select the best solutions. A brief description of the steps involved in each phase of the decision support framework has been included below:
  • Phase 1: Sustainable and Resilient Supplier Selection
Step-1: Potential suppliers are evaluated based on TBL sustainability (economic, environment, social) and resilience criteria.
Step-2: Selection of sub-criteria for each sustainability and resilience criterion. (The sub-criteria have been included in Table 2.)
Step-3: Application of FE-AHP method to evaluate the relative weights of each supplier’s selection criteria.
Step-4: Application of FTOPSIS to rank the suppliers. (The linguistic variables used for calculating criteria weights and developing rankings of the suppliers are included in Table 3.)
Step-5: Preliminary selection of suppliers on the basis of defined thresholds of the closeness coefficient.
Step-6: A sensitivity analysis is performed to evaluate the robustness of the selected suppliers using the method identified by Forghani et al. [69].
  • Phase 2: Order Allocation
Step-7: Identification of objectives for allocating optimal quantities to the potential suppliers. (The objectives are total cost, total travel time, environmental impact, acceptable quality limit, total value of sustainable purchasing.)
Step-8: Development of MOMINLP mathematical model along with demand, resource, and capacity constraints.
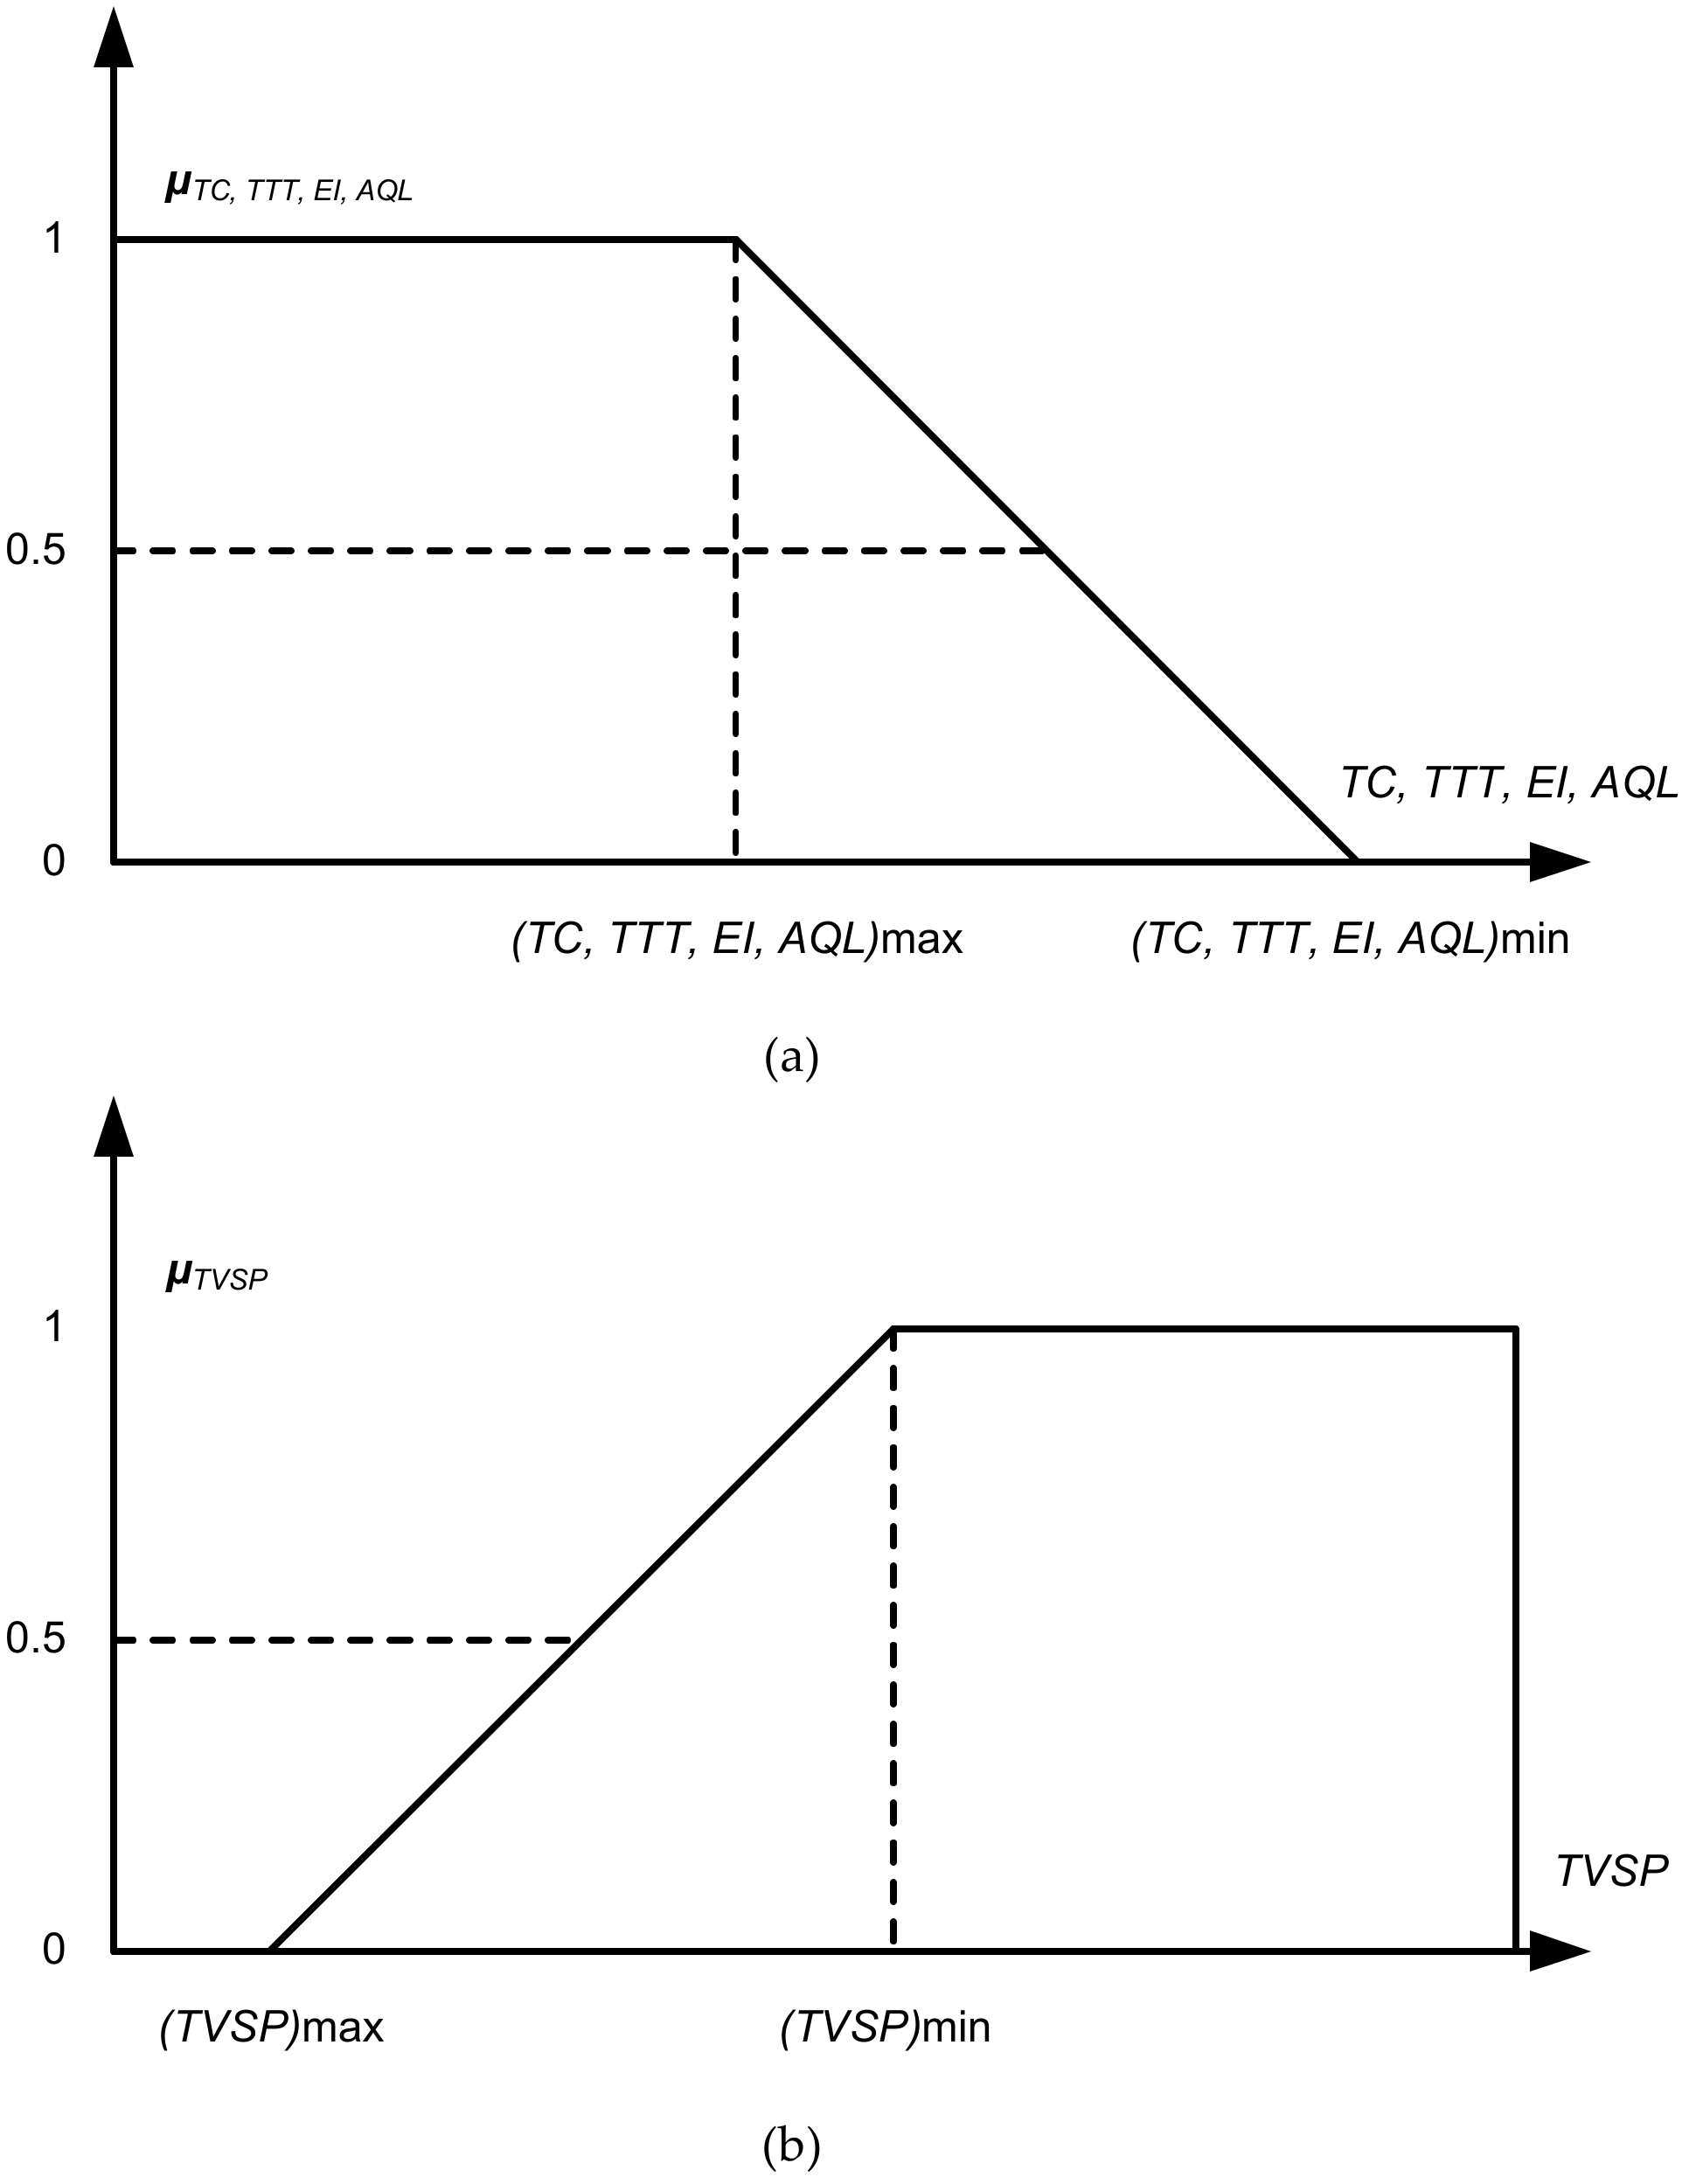
Step-9: Include uncertainty by developing the fuzzy MOMINLP mathematical model.
Step-10: Solve the model using nonlinear solver to determine minimum and maximum values of objective functions.
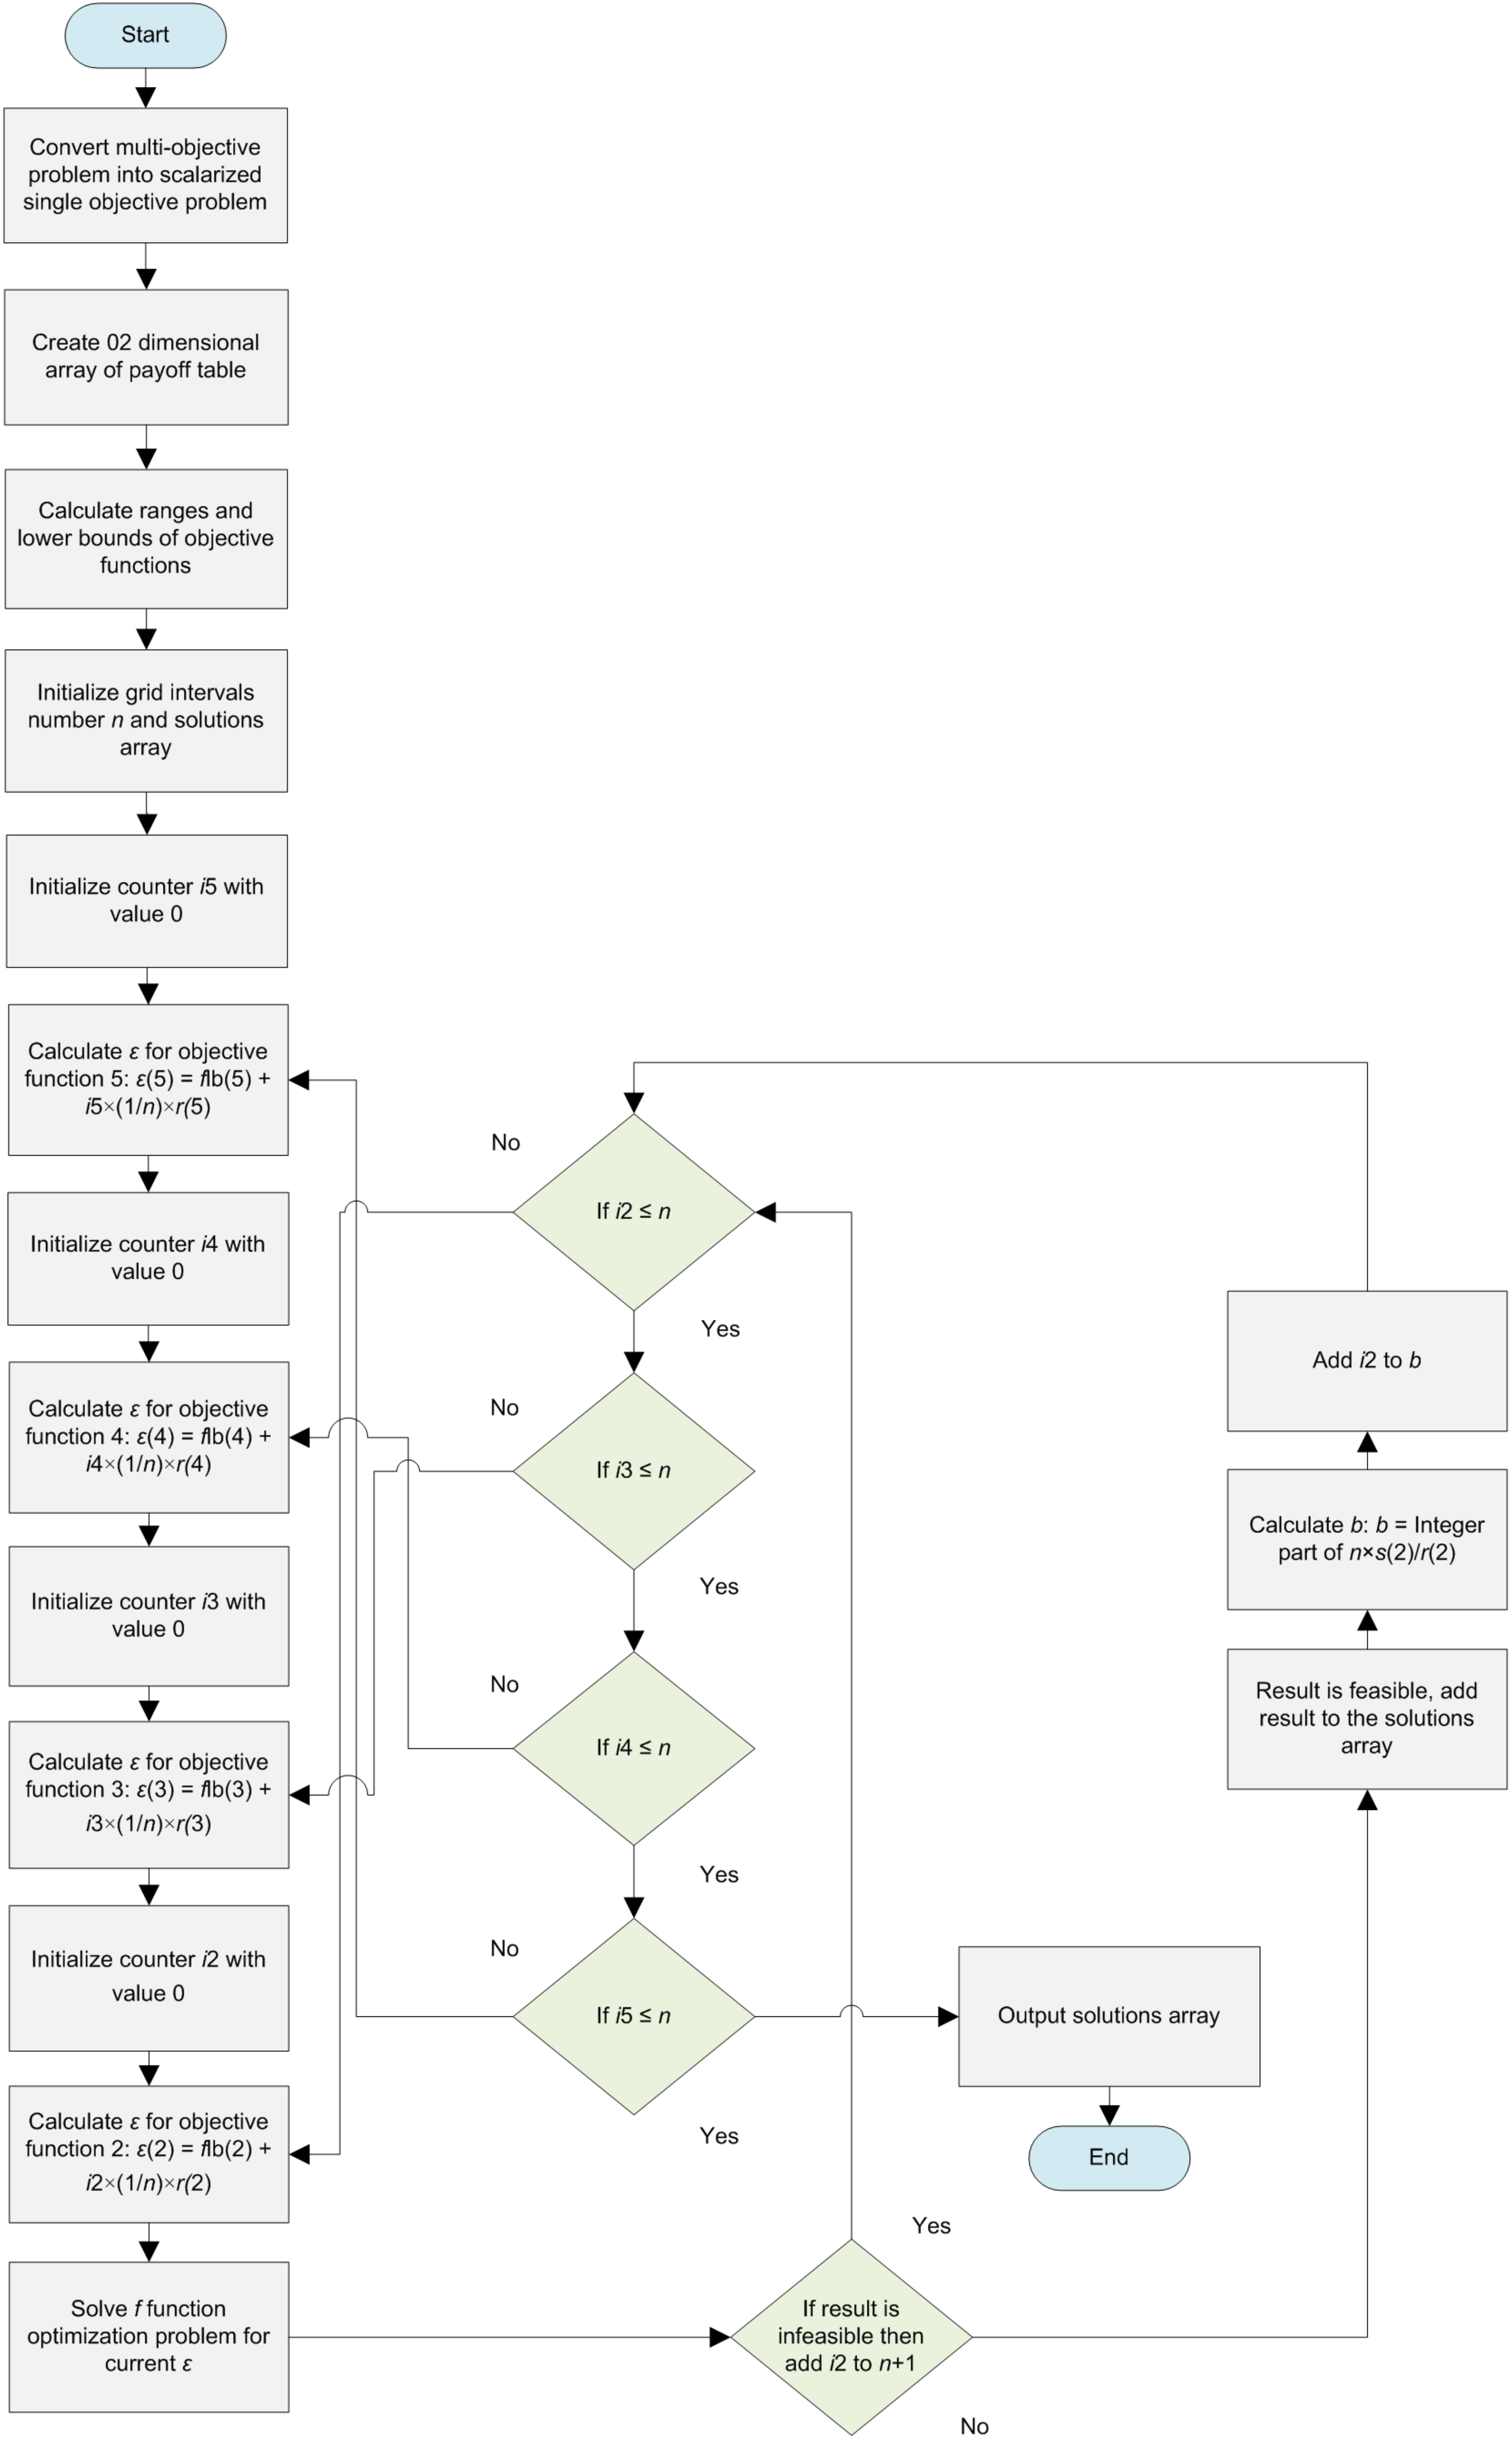
Step-11: Solve the model using AUGMECON2 and extract Pareto solutions.
  • Phase 3: Best Solution Selection
Step-12: Use CRITIC method for determining objective functions’ weights for extracting best 10 Pareto solutions.
Step-13: Apply TOPSIS for the ranking of the best solutions for the time period considered.
Table 2. Criteria and sub-criteria for sustainable and resilient supplier ranking.
CriteriaSub-Criteria
EconomicProduct Price
Payment Terms
Product Quality
Use of Technology
Volume Flexibility
Vendor’s Reputation
Responsiveness
Product Mix
Past Business
EnvironmentEnvironmental Management System
Energy Consumption
Waste Management System
Innovative Capability
SocialEmployee Health & Safety
Staff Personal & Technical Development
Information Disclosure
ResilienceRobustness
Agility
Leanness
Flexibility
Table 3. Linguistic variables used for FE-AHP and FTOPSIS (Adapted from [70]).
Performance Ranking of AlternativesImportance of Criteria
Linguistic VariableFuzzy NumberLinguistic VariableFuzzy Number
Very Low (VL)(1, 1, 3)Weakly Important (WI)(0.1, 0.1, 0.3)
Low (L)(1, 3, 5)Moderately Important (MI)(0.1, 0.3, 0.5)
Medium (M)(3, 5, 7)Important (I)(0.3, 0.5, 0.7)
High (H)(5, 7, 9)Strongly Important (SI)(0.5, 0.7, 0.9)
Very High (VH)(7, 9, 10)Extremely Important (EI)(0.7, 0.9, 1)

4.1. Development of Fuzzified Mathematical Model for Order Allocation

This section presents the development of the FMOMINLP mathematical model for the pharmaceutical industry. Fuzzy Set Theory (FST) has been applied to address the dynamic nature of the input data in terms of cost, capacity, and demand and to incorporate real world uncertainty in the mathematical model. The assumptions, sets, parameters, and variables used in the mathematical model have been included below:
  • Assumptions
The assumptions of the mathematical model are as follows:
The model is a multi-period model.
The shipments are considered as less than container load (LCL) shipments.
The transfer cost and transfer time can only be applied at the nodes.
The custom clearance cost and time can only be applied while moving through port.
Custom clearance can only take place at one port for a shipment, i.e., either at seaport or dry port.
Sets
i = 1 , 2 , 3 , , I Set of suppliers
j = 1 , 2 , 3 , , J Set of seaports
k = 1 , 2 , 3 , , K Set of dry ports
l = 1 , 2 , 3 , , L Set of warehouses
c = 1 , 2 , 3 , , C Set of customers
t = 1 , 2 , 3 , , T Set of time periods
m = 1 , 2 , 3 , , M Set of transportation modes n = 1 , 2 , 3 , , N Set of transportation modes } Used for interchangeable transport transfer decisions
Parameters
C i t p = Purchasing cost per kg from supplier i for time period t
O i t = Ordering cost incurred   by   customer for i th supplier for time period t
H o t = Inventory holding cost per kg incurred   by   customer for time period t
T C m t = Transportation   cost   per   kilometer   for   mode m for time period t
T r C m n t = Transfer cost from mode m to mode n for time period t
C C i j t = Custom clearance cost while moving from supplier i to seaport j for time period t
C C i k t = Custom clearance cost while moving from supplier i to dry   port k for time period t
T r T m n t = Transfer time from mode m to mode n for time period t
C C T i j t = Custom clearance time from supplier i to seaport j for time period t
C C T i k t = Custom clearance time from supplier i to dry   port k for time period t
d i j m = Distance from supplier i to seaport j through mode m
d j l m = Distance from seaport j to warehouse l through mode m
d l c m = Distance from warehouse l to customer c through mode m
d i k m = Distance from supplier   i   to   dry   port   k   through   mode   m
d k l m = Distance from dry   port   k   to   warehouse   l   through   mode   m
d j k m = Distance from seaport   j to dry   port   k   through mode m
w i e c o = Weights of economic   criteria   obtained   from   fuzzy   E - AHP for   supplier   i
w i e = Weights of environmental criteria   obtained   from   fuzzy   E - AHP for   supplier   i
w i s = Weights of social criteria   obtained   from   fuzzy   E - AHP for   supplier   i
W i E c o n o m i c = Weights of supplier i from fuzzy TOPSIS for economic criteria
W i E n v i r o n m e n t a l = Weights of supplier i from fuzzy TOPSIS for environmental criteria
W i S o c i a l = Weights of supplier i from fuzzy TOPSIS for social criteria
w i R i s k = Risk   weight   of   supplier   i normalized   by   results   of   risk   expectation   value
C O 2 i j m t = Carbondioxide emissions in gram per km while traveling from supplier i to seaport j through mode m for time period t
C O 2 j l m t = Carbondioxide emissions in gram per km while traveling from seaport j to warehouse l through mode m for time period t
C O 2 l c m t = Carbon dioxide emissions in gram per km while traveling from warehouse l to customer c through mode   m for time period t
C O 2 i k m t = Carbondioxide emissions in gram per km while traveling from supplier i to dryport k through mode m for time period t
C O 2 k l m t = Carbondioxide emissions in gram per km while traveling from dryport k t o warehouse l through mode m for time period t
C O 2 j k m t = Carbondioxide emissions in gram per km while traveling from seaport j to dryport k through mode m for time period t
S i t = Maximum capacity of i th supplier   for   time   period   t
D c t = Demand of c th customer for   time   period   t
α i t = Acceptable   quality   limit   of   i th   supplier   for   time   period   t
C A P w l t = Capacity of l th warehouse for   time   period   t
v m = Velocity of mode m
C a p m t = Capacity of vehicle used while moving through mode m for time period t
C a p ( m = 2 ) t = Minimum capacity of train for time period t
C a p ( m = 3 ) t = Minimum capacity of road for time period t
Integer Variables
X i j m t = Quantity shipped from supplier i to seaport j through mode m   for   time   period   t
X j l m t = Quantity shipped from seaport j to warehouse l through mode m for   time   period   t
X l c m t = Quantity shipped from warehouse l to customer c through mode m for   time   period   t
X i k m t = Quantity shipped from supplier i to dryport k through mode m for   time   period   t
X k l m t = Quantity shipped from dry port k to warehouse l through mode m for   time   period   t
X j k m t = Quantity shipped from seaport j to dry port k through mode m for   time   period   t
Binary Variables
Y i t = { 1 if supplier i is selected , 0 otherwise
Z l t = { 1 if warehouse l is selected , 0 otherwise
a j t = { 1 if tranfer from mode m to n at node j , 0 otherwise
a k t = { 1 if tranfer from mode m to n at node k , 0 otherwise
a l t = { 1 if tranfer from mode m to n at node l , 0 otherwise
Objective Function 1: Total Cost (TC)
This objective function minimizes the sum of purchasing cost, ordering cost, inventory holding cost, transportation cost, transfer cost, and the custom clearance cost that takes place throughout the supply chain network. Transfer cost is the labor cost incurred when goods are transferred from one mode of transport to another while custom clearance cost is the cost of preparation and processing of custom entry documents at the port. In order to incorporate the effects of resilience criteria in order allocation, risk weights for ordering from each supplier are determined and included in the objective function.
M i n TC = i = 1 I j = 1 J k = 1 K m = 1 M t = 1 T ( C i t P X i j m t + C i t P X i k m t ) ( 1 + w i R i s k ) Y i t + i = 1 I t = 1 T O i t Y i t + i = 1 I j = 1 J k = 1 K m = 1 M t = 1 T X i j m t + X i k m t 2 ( H o t ) + i = 1 I j = 1 J m = 1 M t = 1 T T C m t d i j m X i j m t C a p m t ( 1 + w i R i s k ) Y i t + i = 1 I k = 1 K m = 1 M t = 1 T T C m t d i k m X i k m t C a p m t ( 1 + w i R i s k ) Y i t + j = 1 J k = 1 K m = 1 M t = 1 T T C m t d j k m X j k m t C a p m t + j = 1 J l = 1 L m = 1 M t = 1 T T C m t d j l m X j l m t C a p m t + k = 1 K l = 1 L m = 1 M t = 1 T T C m t d k l m X k l m t C a p m t + l = 1 L c = 1 C m = 1 M t = 1 T T C m t d l c m X l c m t C a p m t + j = 1 J k = 1 K m = 1 M n = 1 N t = 1 T T r C m n t a j t X j k m t + j = 1 J l = 1 L m = 1 M n = 1 N t = 1 T T r C m n t a j t Z l t X j l m t + k = 1 K l = 1 L m = 1 M n = 1 N t = 1 T T r C m n t a k t Z l t X k l m t + l = 1 L c = 1 C m = 1 M n = 1 N t = 1 T T r C m n t a l t Z l t X l c m t + i = 1 I j = 1 J m = 1 M t = 1 T C C i j t X i j m t Y i t + i = 1 I k = 1 K m = 1 M t = 1 T C C i k t X i k m t Y i t
Objective Function 2: Total Travel Time (TTT)
This objective function minimizes the total travel time from the supplier to the customer. Total travel time is given as a sum of transportation time, transfer time, and custom clearance time. The impact of resilience criteria is incorporated by including risk weights for each supplier in this objective function as well.
M i n TTT = i = 1 I j = 1 J m = 1 M t = 1 T d i j m X i j m t v m C a p m t ( 1 + w i R i s k ) Y i t + i = 1 I k = 1 K m = 1 M t = 1 T d i k m X i k m t v m C a p m t ( 1 + w i R i s k ) Y i t + j = 1 J k = 1 K m = 1 M t = 1 T d j k m X j k m t v m C a p m t + j = 1 J l = 1 L m = 1 M t = 1 T d j l m X j l m t v m C a p m t + k = 1 K l = 1 L m = 1 M t = 1 T d k l m X k l m t v m C a p m t + l = 1 L c = 1 C m = 1 M t = 1 T d l c m X l c m t v m C a p m t + j = 1 J m = 1 M n = 1 N t = 1 T T r T m n t X j l m t C a p m t + k = 1 K m = 1 M n = 1 N t = 1 T T r T m n t X k l m t C a p m t + j = 1 J m = 1 M n = 1 N t = 1 T T r T m n t X j k m t C a p m t + l = 1 L m = 1 M n = 1 N t = 1 T T r T m n t X l c m t C a p m t + i = 1 I j = 1 J m = 1 M t = 1 T C C T i j t X i j m t Y i t C a p m t + i = 1 I k = 1 K m = 1 M t = 1 T C C T i k t X i k m t Y i t C a p m t
Objective Function 3: Environmental Impact (EI)
This objective function minimizes the total carbon dioxide emissions throughout the transportation process for all three transportation modes, i.e., sea, rail, and road.
M i n EI = i = 1 I j = 1 J m = 1 M t = 1 T C O 2 i j m t [ X i j m t C a p m t ] d i j m + i = 1 I k = 1 K m = 1 M t = 1 T C O 2 i k m t [ X i k m t C a p m t ] d i k m + j = 1 J k = 1 K m = 1 M t = 1 T C O 2 j k m t [ X j k m t C a p m t ] d j k m + j = 1 J l = 1 L m = 1 M t = 1 T C O 2 j l m t [ X j l m t C a p m t ] d j l m + k = 1 K l = 1 L m = 1 M t = 1 T C O 2 k l m t [ X k l m t C a p m t ] d k l m + l = 1 L c = 1 C m = 1 M t = 1 T C O 2 l c m t [ X l c m t C a p m t ] d l c m
Objective Function 4: Acceptable Quality Limit (AQL)
This objective function minimizes the acceptable quality limit of the selected suppliers based on different types of defects and their ranges usually employed for order lot size quality assurance.
M i n AQL = i = 1 I j = 1 J m = 1 M t = 1 T α i t X i j m t Y i t + i = 1 I k = 1 K m = 1 M t = 1 T α i t X i k m t Y i t
Objective Function 5: Total Value of Sustainable Purchasing (TVSP)
This objective function maximizes the total value of purchased goods by maximizing the economic, environmental, and social criteria weights. The TBL sustainability criteria weights determined using FE-AHP are multiplied by the suppliers’ weights calculated using FTOPSIS and the ordered quantity from the supplier.
M a x TVSP = i = 1 I j = 1 J m = 1 M t = 1 T ( W i E c o n o m i c w i e c o X i j m t + W i E n v i r o n m e n t a l w i e X i j m t + W i S o c i a l w i s X i j m t ) + i = 1 I k = 1 K m = 1 M t = 1 T ( W i E c o n o m i c w i e c o X i k m t + W i E n v i r o n m e n t a l w i e X i k m t + W i S o c i a l w i s X i k m t )
Constraints
j = 1 J k = 1 K m = 1 M t = 1 T ( X i j m t + X i k m t ) S i t Y i t i I
i = 1 I m = 1 M t = 1 T ( X i j m t + X i k m t ) = D c t j J , k K
i = 1 I m = 1 M t = 1 T ( X i j m t + X i k m t ) = l = 1 L m = 1 M t = 1 T ( X j l m t + X k l m t ) j J , k K
l = 1 L m = 1 M t = 1 T ( X j l m t + X k l m t ) = c = 1 C m = 1 M t = 1 T X l c m t j J , k K
l = 1 L m = 1 M t = 1 T ( X j l m t + X k l m t ) = D c t j J , k K
l = 1 L m = 1 M t = 1 T ( X j l m t + X j k m t + X k l m t ) = c = 1 C m = 1 M t = 1 T X l c m t j J , k K
c = 1 C m = 1 M t = 1 T X l c m t = D c t l L
i = 1 I j = 1 J t = 1 T X i j ( m = 1 ) t C a p ( m = 1 ) t m M
j = 1 J k = 1 K t = 1 T X j k ( m = 2 ) t C a p ( m = 2 ) t m M
j = 1 J k = 1 K t = 1 T X j k ( m = 3 ) t C a p ( m = 3 ) t m M
j = 1 J l = 1 L t = 1 T X j l ( m = 2 ) t C a p ( m = 2 ) t m M
j = 1 J l = 1 L t = 1 T X j l ( m = 3 ) t C a p ( m = 3 ) t m M
l = 1 L c = 1 C t = 1 T X l c ( m = 2 ) t C a p ( m = 2 ) t m M
l = 1 L c = 1 C t = 1 T X l c ( m = 3 ) t C a p ( m = 3 ) t m M
i = 1 I k = 1 K t = 1 T X i k ( m = 2 ) t C a p ( m = 2 ) t m M
i = 1 I k = 1 K t = 1 T X i k ( m = 3 ) t C a p ( m = 3 ) t m M
k = 1 K l = 1 L t = 1 T X k l ( m = 2 ) t C a p ( m = 2 ) t m M
k = 1 K l = 1 L t = 1 T X k l ( m = 3 ) t C a p ( m = 3 ) t m M
j = 1 J m = 1 M t = 1 T X j l m t C A P w l t Z l t l L
k = 1 K m = 1 M t = 1 T X k l m t C A P w l t Z l t l L
c = 1 C m = 1 M t = 1 T X l c m t C A P w l t Z l t l L
X i j m t , X j l m t , X l c m t , X i k m t , X k l m t , X j k m t 0 i , j , k , l , c , m
Y i t , Z l t , a j t , a k t , a l t { 0 , 1 } i , l
The constraints above should be satisfied with a confidence value φ determined by the DMs. Using FST helps to address the uncertainty of human judgment and enables a more precise and objective representation of real-world systems. Based on fuzzy formulation, each objective function corresponds to an equivalent linear membership function, whose value can be calculated by using Equation (29).
μ b = { 1 i f Z b M a x b M a x b Z b M a x b M i n b       i f M i n b Z b M a x b 0 i f Z b M i n b
In the above equation, Zb represents the value of the bth objective function, and Maxb and Minb represent the maximum and minimum values of the bth objective function, respectively.
The maximum and minimum values of the membership functions for the objectives have been further illustrated in Figure 3 below.

4.2. Solving Algorithm for Order Allocation

Augmented ε-Constraint 2 (AUGMECON2) has been used for solving the FMOMINLP mathematical model [71]. This solving algorithm is an improved version of the ε-Constraint method proposed by Mavrotas [72]. This method transforms a multi-objective problem into a mono-objective problem by considering one of the objectives as the main or principal objective while treating other objectives as constraints subject to certain ε values. The algorithm introduces slack variables at each iteration to adequately address and handle the complexities of discrete variables and non-convex problems. A generalized representation of the method has been included in Figure 4.
m a x ( f 1 ( x ) + e p s ( S 2 r 2 + ( ( 10 1 ) S 3 r 3 ) + + ( 10 ( n 2 ) S n r n ) ) )
subject to
f 2 ( x ) S 2 = ε 2 f 3 ( x ) S 3 = ε 3 f n ( x ) S n = ε n
where ε2, ε3, …, εn are the right-hand side values for each objective function, S2, S3, …, Sn are the slack variables, r2, r3, …, rn are the ranges of n objective functions, and eps [ 10 6 ,   10 3 ] .
In order to generate exact Pareto sets, AUGMECON2 facilitates lexicographic optimization of objective functions f2, f3, …, fn. The mathematical model is transformed as presented below to generate the Pareto solutions. For the purpose of this research work, TC has been considered as the main objective function.
M i n Z = M i n T C
Subject to Equations (6)–(28), and:
M i n T T T ε 2 [ M i n T T T ] min ε 2 [ M i n T T T ] max M i n E I ε 3 [ M i n E I ] min ε 3 [ M i n E I ] max M i n A Q L ε 4 [ M i n A Q L ] min ε 4 [ M i n A Q L ] max M a x T V S P ε 5 [ M a x T V S P ] min ε 5 [ M a x T V S P ] max

4.3. Selection of Best Pareto Solution

CRITIC method has been used to calculate objective function weights in order to select the best 10 Pareto solutions generated using AUGMECON2 [73]. Four best solutions for each confidence value φ are determined. This is followed by TOPSIS for ranking and identification of the best Pareto optimal solution for each time period t.

5. Application Case Study

This section applies the proposed methodology using data from the pharmaceutical industry. In the wake of the COVID-19 pandemic, the pharmaceutical industry has emerged as one of the most important and critical contributors to the global health care system. Around the world, pharmaceutical firms have developed complex, international supply chain networks susceptible to disruptions. While sustainable supplier selection and order allocation ensures the wellbeing of the pharmaceutical industry under ordinary circumstances, incorporating resilience in this activity can help mitigate the adverse effects of disruptions, natural or otherwise, to the supply chain network. All data related to the number of suppliers, warehouses, transportation modes, capacity, and demand, etc., was acquired from reputable firms engaged in manufacturing pharmaceutical items for many decades and has been made available online through Supplementary Material S1 [74]. The pharmaceutical supply chain considered comprises five suppliers, one seaport, one dry port, three warehouses, and two customers. FE-AHP and FTOPSIS have been implemented using MS Excel (2021) while Python 3.7 has been used for solving the FMOMINLP mathematical model. Both software packages were run using a Core i5/2.5 GHz/8.0 GB RAM personal computer.

5.1. Sustainability and Resilience Criteria Weighting

FE-AHP has been used for determining the weights of the sustainability and resilience criteria and sub-criteria based on the preferences of four DMs associated with the pharmaceutical industry. The value of the consistency ratio was calculated for all criteria collectively and for all sub-criteria entries within each criterion in order to ensure the soundness of the DMs’ responses. The global and local weights of the criteria and sub criteria along with the ranking of the sub-criteria have been included in Table 4 below.
The sustainability and resilience criteria were presented as economic > environment > social along with resilience as an additional parameter for evaluation to the DMs. Economic criteria were ranked as most important followed by social, resilience, and environment criteria. For the economic sub-criteria, past business and product mix have been identified as the most significant sub-criteria. Innovative capability has been ranked as the highest environment sub-criterion, while information disclosure has been considered the most important social sub-criterion. The DMs have ranked robustness and flexibility as the most important resilience sub-criteria. This discernable ranking of sub-criteria based on DMs’ responses serves as an aid for making informed decisions and to select only those suppliers that fulfill the sustainability and resilience criteria at the same time.

5.2. Sustainable and Resilient Supplier Ranking

The weights of the sustainability and resilience criteria calculated in the previous sub-section have been used to evaluate the potential suppliers. FTOPSIS has been employed for ranking the potential suppliers based on the responses collected from four DMs from different pharmaceutical industry units. The closeness coefficient threshold for selecting the suppliers was set at 0.5 and based on this value Supplier 1, Supplier 2, and Supplier 3 have been selected for optimum order allocation.
A sensitivity analysis was performed to evaluate the robustness of the selected suppliers based on multiple sub-criteria within each sustainability and resilience criterion, i.e., economic (product price, payment terms, responsiveness, vendor’s reputation), environment (environmental management system, innovative capability), social (information disclosure), and resilience (flexibility). No change has been observed in the ranking of the selected suppliers after the sensitivity analysis was performed. The final ranking of the potential suppliers has been presented in Table 5 above.

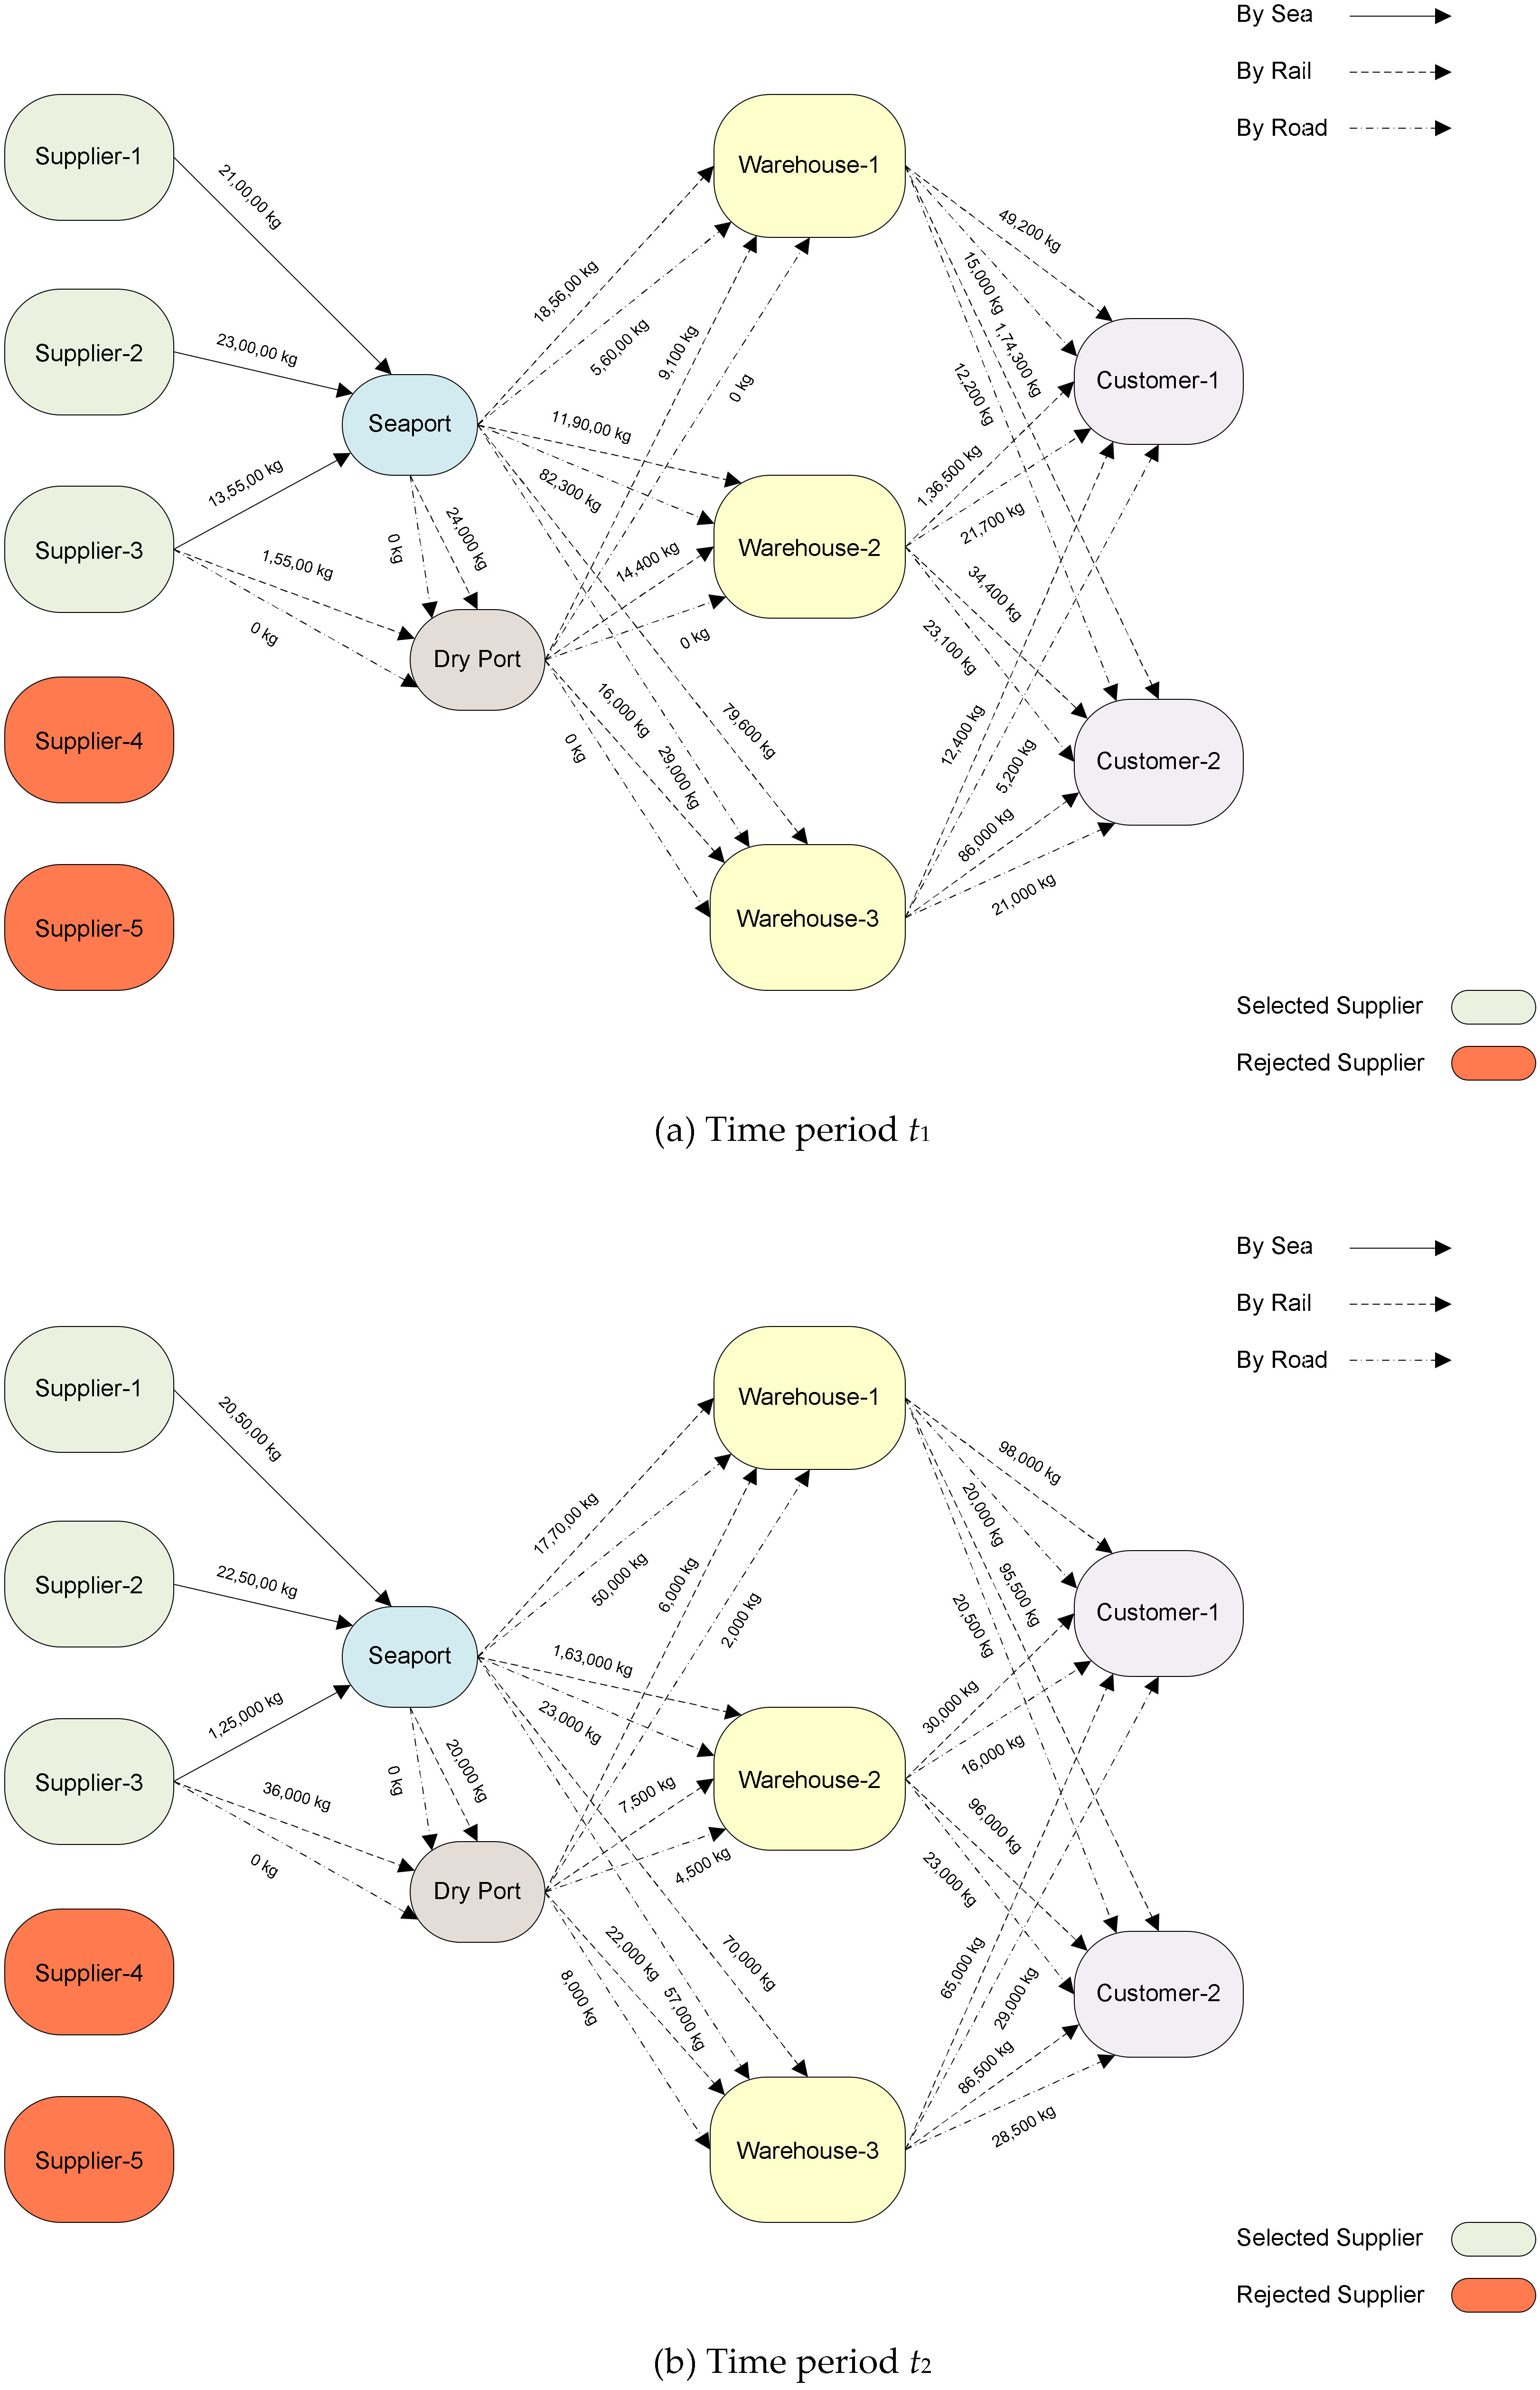
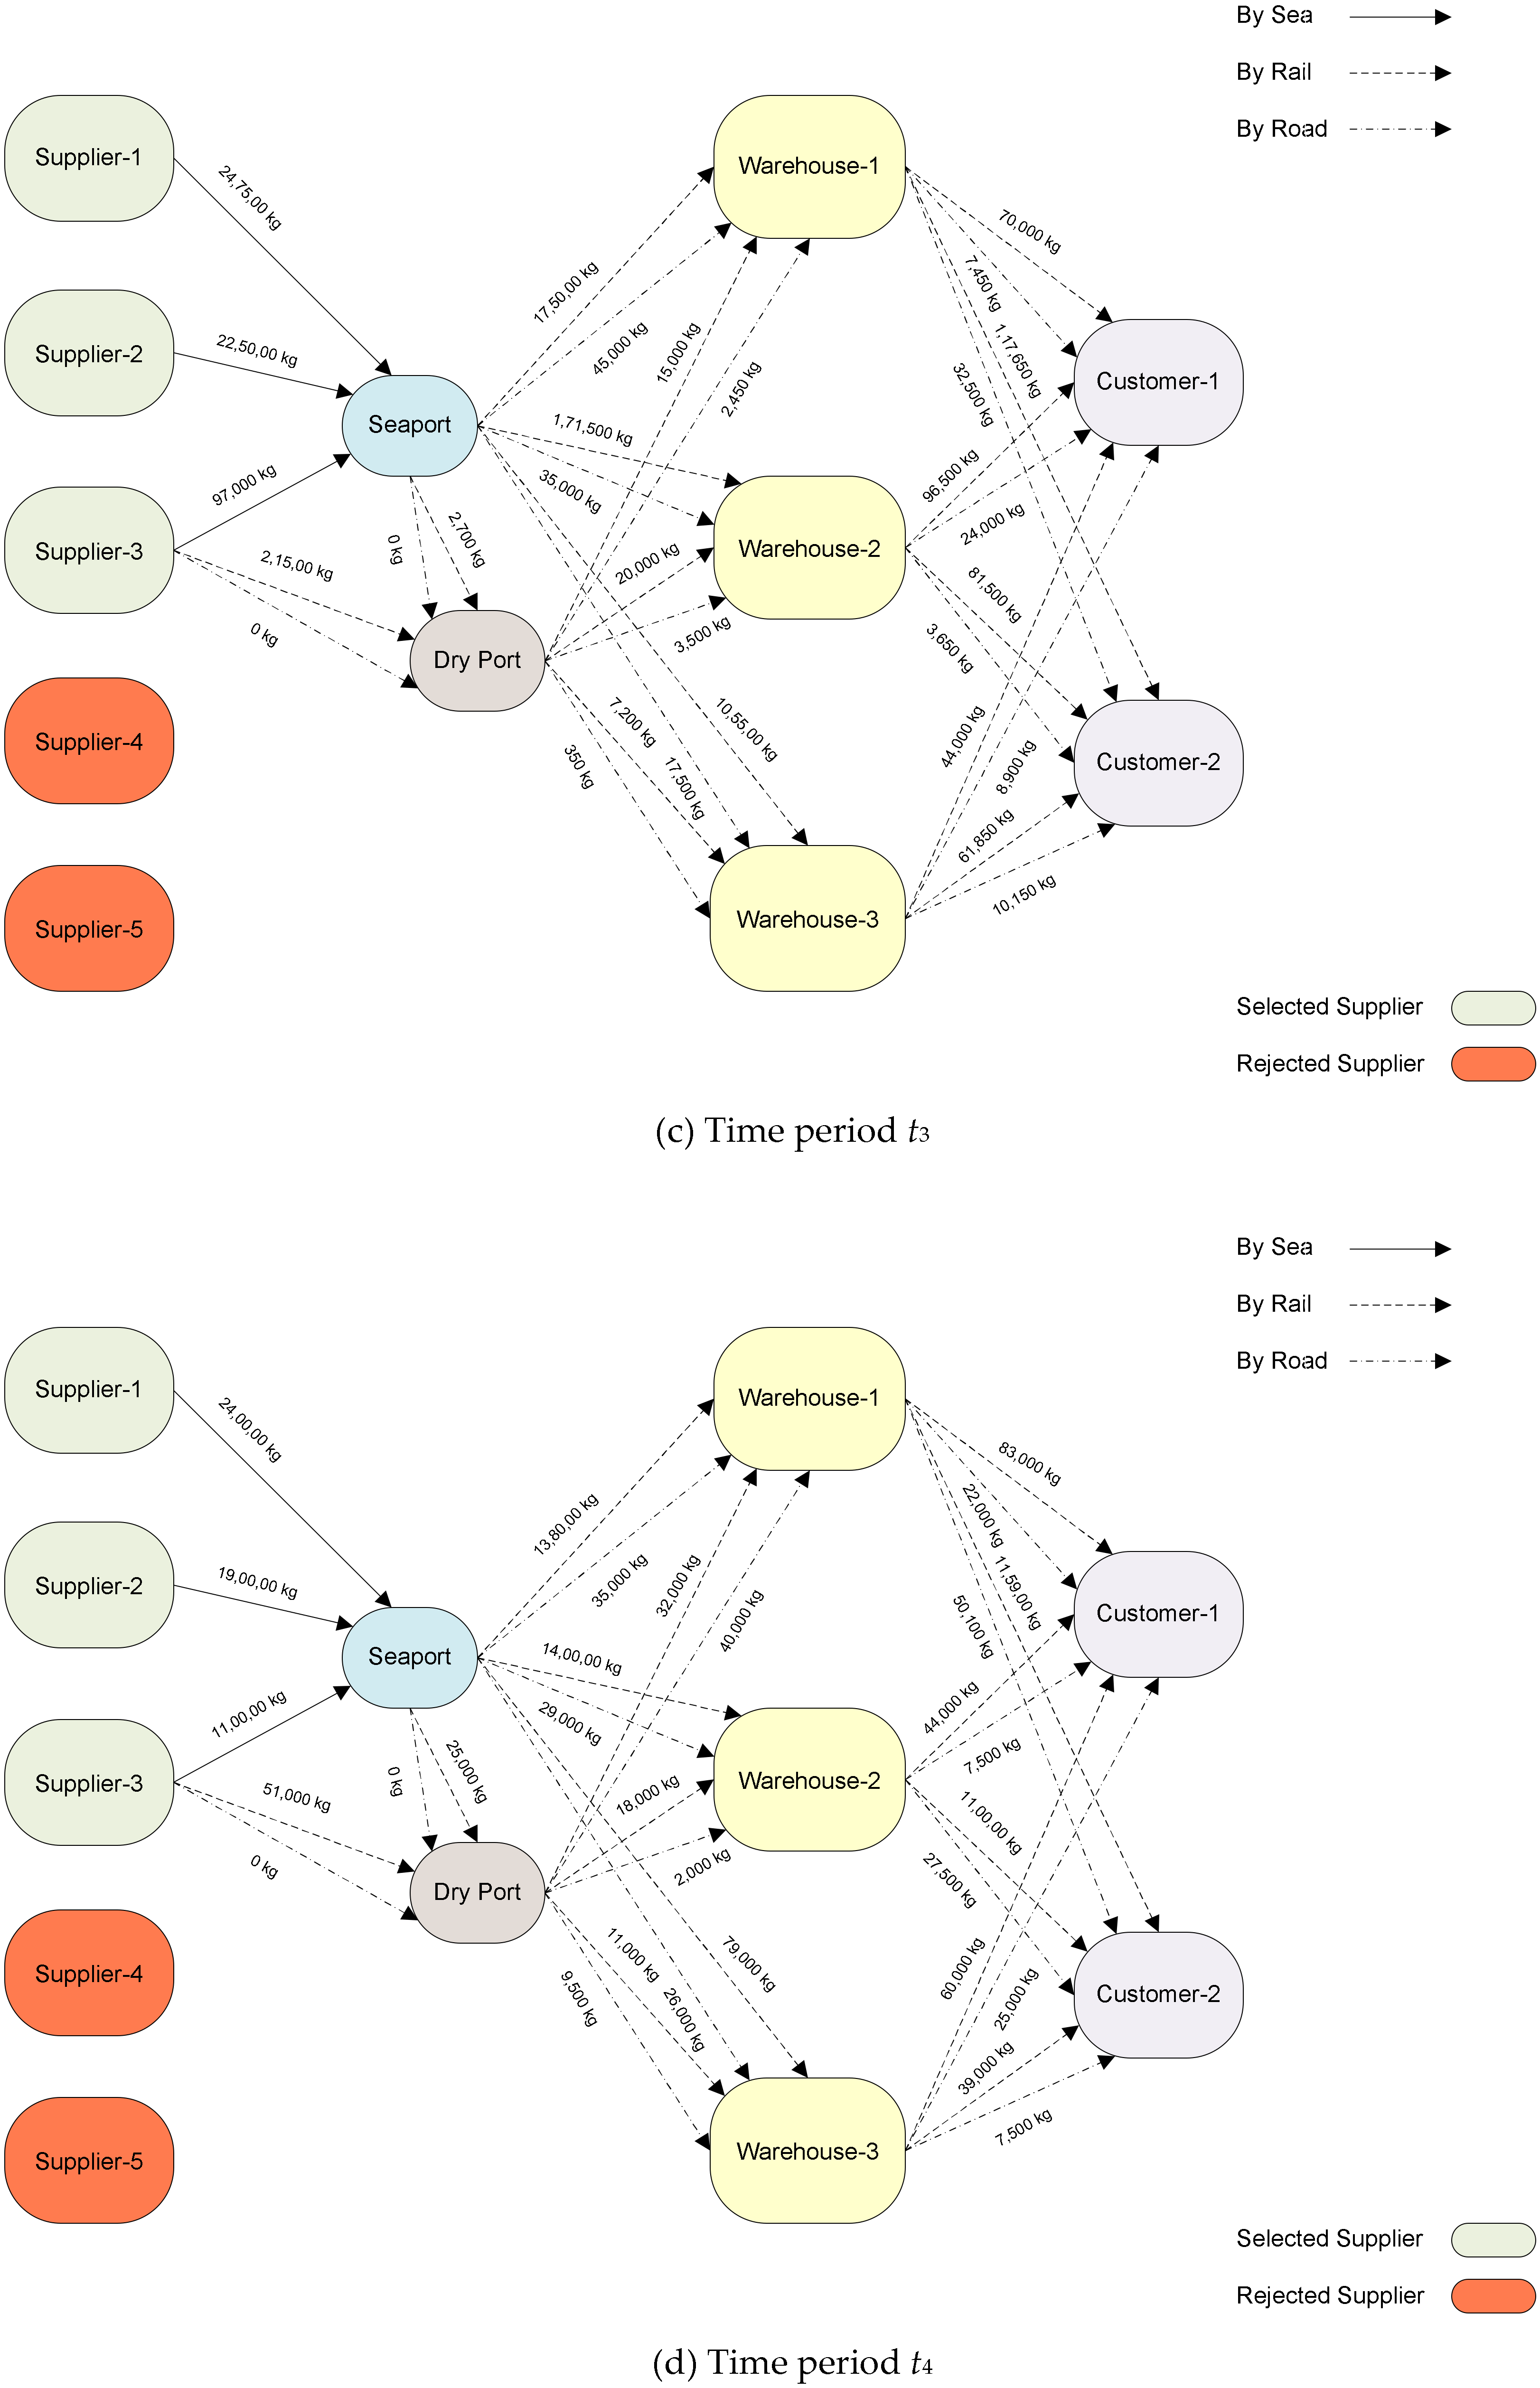
5.3. Sustainable and Resilient Order Allocation

The FMOMINLP mathematical model has been solved in two phases. First, each objective function has been optimized individually using a suitable nonlinear solver and ideal solutions have been determined as included in Table 6 below. In the second phase, AUGMECON2 has been employed for solving all objective functions simultaneously. Pareto solutions have been generated for each time period considered in order to determine the optimal order quantity for all selected suppliers using the fuzzified input data as included in the Supplementary Material S1.
In order to perform multi-objective optimization, AUGMECON2 first generates a payoff table for each time period t. The minimum/maximum values of all objective functions are calculated by solving Equations (1)–(28) and the results have been included in Table 7 and Table 8. In the next step, the minimum and maximum values are divided into 10 segments and each segment is individually assigned to ε2, ε3, ε4, and ε5 with the step interval of 2 by using Equation (30). These values have been presented in Table 9.
The DMs have assigned 04 φ levels i.e., 0.25, 0.5, 0.75, and 1.0 for each solution with an incremental step of 0.25. The algorithm will run for every combination of ε values for all φ levels in order to generate Pareto optimal solutions. The maximum number of iterations allowed is 50,000.
The last step in the sustainable and resilient order allocation process is the selection of the best solution from the set of Pareto optimal solutions generated by AUGMECON2. This step is carried out by employing TOPSIS. The objective function weights were calculated using the CRITIC method and these values have been presented in Table 10. Only one solution can be selected by the DMs for each time period. The values of the relative closeness coefficient for the best 10 Pareto optimal solutions for the time periods t1-t4 have been included in Table 11. The best solution for each time period has been presented in Table 12.

6. Discussion

A graphical representation of the order allocation to the selected suppliers has been presented in Figure 5 below for all time periods considered. The Pareto optimal solutions generated through multi-objective optimization have close similarity to the ideal solutions calculated using the nonlinear solver. Multi-objective optimization is computationally more challenging as compared to solving each objective function individually. Yet it has been observed that AUGMECON2 as a solving algorithm can handle the complexity of the extensive supply chain network presented in Figure 1 above fairly easily without any specialized computational resources required. The combination of sustainability and resilience criteria for supplier selection and the inclusion of resilience criteria weights in the FMOMINLP mathematical model enables a more holistic evaluation of the sustainable and resilient supplier selection and order allocation problem in the context of the pharmaceutical industry.

7. Managerial Insight

The implications and usefulness of the results presented in the preceding sections from a managerial perspective is included below:
(a)
A multi-phase, multi-period smart decision support framework has been proposed for sustainable and resilient supplier selection and order allocation. The proposed framework has been demonstrated using real-time data collected from the pharmaceutical industry.
(b)
A combination of TBL sustainability and resilience criteria has been employed for supplier selection and order allocation that leads to a more comprehensive and thorough evaluation of the sustainable and resilient supplier selection and order allocation problem.
(c)
A detailed fuzzified mathematical model has been developed for order allocation. As demonstrated by the results presented in the preceding sections, this mathematical model can successfully handle real-life uncertainty of decision variables during supply-chain operations.

8. Conclusions and Future Recommendations

In this research paper, a multi-phase, multi-period smart decision support framework has been proposed for sustainable and resilient supplier selection and order allocation. The proposed framework has been applied using real-time data collected from the pharmaceutical industry. The following conclusions may be drawn from the research work presented in the preceding sections:
(a)
Among the TBL sustainability criteria, product price, past business, innovative capability, and information disclosure rank as the most significant sub-criteria for the DMs in the pharmaceutical industry.
(b)
Robustness and flexibility are considered the most valued attributes in the potential suppliers as far as the resilience criterion is concerned.
(c)
The transfer cost and custom clearance cost comprise 69.4% of the total cost of the supply chain network. On the other hand, transfer time and custom clearance time comprise only 24.7% of the total transportation time.
(d)
Transportation by sea has the least impact on environment (8.2%) while transportation by rail has the highest rate of environmental impact (62.5%) followed by transportation by road (29.5%).
(e)
Inland transportation of goods is dominated by rail as the most preferred mode of transport. Transportation by rail is also preferred by potential suppliers located in geographically contiguous countries.
The uncertainty encountered in actual supply chain network operations has been incorporated both in the supplier selection and the order allocation parts of the proposed methodology. The input data collected from the industry has also been fuzzified in order to make the modeling more realistic and closer to real-time scenarios. DMs’ preferences play a major role during evaluation of the sustainability and resilience sub-criteria.
The SRSS-OA problem has previously been addressed by many researchers in the extant literature but with certain limitations. For example, Sen et al. [63] and Mahmoudi et al. [68] have considered environmental and resilience criteria for the purposes of supplier selection but the remaining TBL sustainability criteria and the order allocation part of the SRSS-OA problem has been ignored. Amindoust [64], Jabbarzadeh et al. [65], and Fallahpour et al. [66] have employed TBL sustainability and resilience criteria for supplier selection but order allocation has not been taken into account in any of these research studies. Hosseini et al. [10] have presented a mathematical model for order allocation based only on economic and resilience criteria and the supplier selection part has not been considered in this research work. This tendency of selective evaluation of TBL sustainablity and resilience criteria and including or excluding either supplier selection or order allocation from the anlaysis is a major shortcoming of the published literature dealing with the SRSS-OA problem. A significant contribution of our research work is that it addresses this shortcoming and presents a comprehensive and holistic decision support framework for supplier selection and order allocation based on TBL sustainability and resilience criteria. In order to demonstrate the utility and potential of the proposed framework, we have implemented it using data from the pharmaceutical industry, which has not been carried out earlier in any of the research works highlighted here.
In future applications of the proposed methodology, different sustainability and resilience sub-criteria should be identified either by conducting a literature review or an industry survey. The effectiveness of the proposed methodology can be examined further by incorporating the effects of natural or manmade disruptions (contingency scenarios) for evaluating the performance of the supply chain network and by extending the application of the proposed decision support framework to various other industry sectors, i.e., electrical power generation and transmission, food production/processing and distribution, telecommunication networks infrastructure, or medical/surgical goods manufacturing industries, etc. A limitation of the decision support framework presented in this research paper is its inability to handle more than one product at any one time period considered. This issue can be remedied by modifying and improving the decision framework to incorporate multi-product scenarios.

Supplementary Materials

Supplementary Material S1 can be downloaded at: https://www.mdpi.com/article/10.3390/su15075962/s1.

Author Contributions

Conceptualization, S.A.K., S.S.W. and R.A.L.; methodology, S.A.K., S.S.W. and R.A.L.; investigation, S.A.K.; formal analysis, S.A.K.; resources, S.A.K., S.S.W. and R.A.L.; writing—original draft preparation, S.A.K.; writing—review and editing, S.A.K. and S.S.W.; supervision, S.S.W. All authors have read and agreed to the published version of the manuscript.

Funding

This research received no external funding.

Informed Consent Statement

Not applicable.

Data Availability Statement

Not applicable.

Acknowledgments

S.A.K. thanks supply chain, import, procurement, and finance managers of various pharmaceutical industries for their input and help regarding the collection of data that has been used in the application case study section of this research paper. The administrative and technical support received from the Capital University of Science and Technology is acknowledged without which this research work would not have been possible.

Conflicts of Interest

The authors declare no conflict of interest.

Abbreviations

AUGMECON2Augmented ε-Constraint 2
CRITICCriteria Importance through Intercriteria Correlation
DMDecision Maker
EIEnvironmental Impact
FE-AHPFuzzy Enhanced Analytical Hierarchy Process
FMOMINLPFuzzy Multi-objective Mixed Integer Nonlinear Programming
FSTFuzzy Set Theory
FTOPSISFuzzy Technique for Order of Preference by Similarity to Ideal Solution
LCLLess than Container Load
MCDMMulti-criteria Decision Making
MILPMixed-integer Linear Programming
MINLPMixed-integer Nonlinear Programming
MIPMixed-integer Programming
MOILPMulti-objective Integer Linear Programming
MOLPMulti-objective Linear Programming
SS-OASupplier Selection and Order Allocation
SSS-OASustainable Supplier Selection and Order Allocation
SRSS-OASustainable and Resilient Supplier Selection and Order Allocation
TCTotal Cost
TTTTotal Travel Time
TVSPTotal Value of Sustainable Purchasing
TBLTriple Bottom Line

References

  1. Ciliberti, F.; Pontrandolfo, P.; Scozzi, B. Investigating Corporate Social Responsibility in Supply Chains: A SME Perspective. J. Clean. Prod. 2008, 16, 1579–1588. [Google Scholar] [CrossRef]
  2. Ahi, P.; Searcy, C. Assessing Sustainability in the Supply Chain: A Triple Bottom Line Approach. Appl. Math. Model. 2015, 39, 2882–2896. [Google Scholar] [CrossRef]
  3. Khan, S.A.R.; Yu, Z.; Golpira, H.; Sharif, A.; Mardani, A. A State-of-the-Art Review and Meta-Analysis on Sustainable Supply Chain Management: Future Research Directions. J. Clean. Prod. 2021, 278, 123357. [Google Scholar] [CrossRef]
  4. Alkahtani, M.; Kaid, H. Supplier Selection in Supply Chain Management: A Review Study. Int. J. Bus. Perform. Supply Chain Model. 2018, 10, 107–130. [Google Scholar] [CrossRef]
  5. Aissaoui, N.; Haouari, M.; Hassini, E. Supplier Selection and Order Lot Sizing Modeling: A Review. Comput. Oper. Res. 2007, 34, 3516–3540. [Google Scholar] [CrossRef]
  6. Kannan, D.; Khodaverdi, R.; Olfat, L.; Jafarian, A.; Diabat, A. Integrated Fuzzy Multi Criteria Decision Making Method and Multiobjective Programming Approach for Supplier Selection and Order Allocation in a Green Supply Chain. J. Clean. Prod. 2013, 47, 355–367. [Google Scholar] [CrossRef]
  7. Govindan, K.; Rajendran, S.; Sarkis, J.; Murugesan, P. Multi Criteria Decision Making Approaches for Green Supplier Evaluation and Selection: A Literature Review. J. Clean. Prod. 2015, 98, 66–83. [Google Scholar] [CrossRef]
  8. Vahidi, F.; Torabi, S.A.; Ramezankhani, M.J. Sustainable Supplier Selection and Order Allocation under Operational and Disruption Risks. J. Clean. Prod. 2018, 174, 1351–1365. [Google Scholar] [CrossRef]
  9. Sahebjamnia, N.; Torabi, S.A.; Mansouri, S.A. Building Organizational Resilience in the Face of Multiple Disruptions. Int. J. Prod. Econ. 2018, 197, 63–83. [Google Scholar] [CrossRef]
  10. Hosseini, S.; Morshedlou, N.; Ivanov, D.; Sarder, M.D.; Barker, K.; Khaled, A. Al Resilient Supplier Selection and Optimal Order Allocation under Disruption Risks. Int. J. Prod. Econ. 2019, 213, 124–137. [Google Scholar] [CrossRef]
  11. Dickson, G.W. An Analysis of Vendor Selection Systems and Decisions. J. Purch. 1966, 2, 5–17. [Google Scholar] [CrossRef]
  12. Weber, C.A.; Current, J.R.; Benton, W.C. Vendor Selection Criteria and Methods. Eur. J. Oper. Res. 1991, 50, 2–18. [Google Scholar] [CrossRef]
  13. Hong, J.D.; Hayya, J.C. Just-In-Time Purchasing: Single or Multiple Sourcing? Int. J. Prod. Econ. 1992, 27, 175–181. [Google Scholar] [CrossRef]
  14. Wilson, E.J. The Relative Importance of Supplier Selection Criteria: A Review and Update. Int. J. Purch. Mater. Manag. 1994, 30, 34–41. [Google Scholar] [CrossRef]
  15. Swift, C.O. Preferences for Single Sourcing and Supplier Selection Criteria. J. Bus. Res. 1995, 32, 105–111. [Google Scholar] [CrossRef]
  16. Vonderembse, M.A.; Tracey, M. The Impact of Supplier Selection Criteria and Supplier Involvement on Manufacturing Performance. J. Supply Chain Manag. 1999, 35, 33–39. [Google Scholar] [CrossRef]
  17. Ghodsypour, S.H.; O’Brien, C. The Total Cost of Logistics in Supplier Selection, under Conditions of Multiple Sourcing, Multiple Criteria and Capacity Constraint. Int. J. Prod. Econ. 2001, 73, 15–27. [Google Scholar] [CrossRef]
  18. Minner, S. Multiple-Supplier Inventory Models in Supply Chain Management: A Review. Int. J. Prod. Econ. 2003, 81–82, 265–279. [Google Scholar] [CrossRef]
  19. Ho, W.; Xu, X.; Dey, P.K. Multi-Criteria Decision Making Approaches for Supplier Evaluation and Selection: A Literature Review. Eur. J. Oper. Res. 2010, 202, 16–24. [Google Scholar] [CrossRef]
  20. Chang, B.; Chang, C.W.; Wu, C.H. Fuzzy DEMATEL Method for Developing Supplier Selection Criteria. Expert Syst. Appl. 2011, 38, 1850–1858. [Google Scholar] [CrossRef]
  21. Kazemi, N.; Ehsani, E.; Glock, C.H.; Schwindl, K. A Mathematical Programming Model for a Multi-Objective Supplier Selection and Order Allocation Problem with Fuzzy Objectives. Int. J. Serv. Oper. Manag. 2015, 21, 435. [Google Scholar] [CrossRef]
  22. Seuring, S. A Review of Modeling Approaches for Sustainable Supply Chain Management. Decis. Support Syst. 2013, 54, 1513–1520. [Google Scholar] [CrossRef]
  23. Lee, A.H.I.; Kang, H.Y.; Hsu, C.F.; Hung, H.C. A Green Supplier Selection Model for High-Tech Industry. Expert Syst. Appl. 2009, 36, 7917–7927. [Google Scholar] [CrossRef]
  24. Amindoust, A.; Ahmed, S.; Saghafinia, A.; Bahreininejad, A. Sustainable Supplier Selection: A Ranking Model Based on Fuzzy Inference System. Appl. Soft Comput. 2012, 12, 1668–1677. [Google Scholar] [CrossRef]
  25. Govindan, K.; Sivakumar, R. Green Supplier Selection and Order Allocation in a Low-Carbon Paper Industry: Integrated Multi-Criteria Heterogeneous Decision-Making and Multi-Objective Linear Programming Approaches. Ann. Oper. Res. 2016, 238, 243–276. [Google Scholar] [CrossRef]
  26. Mohammed, A.; Setchi, R.; Filip, M.; Harris, I.; Li, X. An Integrated Methodology for a Sustainable Two-Stage Supplier Selection and Order Allocation Problem. J. Clean. Prod. 2018, 192, 99–114. [Google Scholar] [CrossRef] [Green Version]
  27. Lo, H.W.; Liou, J.J.H.; Wang, H.S.; Tsai, Y.S. An Integrated Model for Solving Problems in Green Supplier Selection and Order Allocation. J. Clean. Prod. 2018, 190, 339–352. [Google Scholar] [CrossRef]
  28. Gören, H.G. A Decision Framework for Sustainable Supplier Selection and Order Allocation with Lost Sales. J. Clean. Prod. 2018, 183, 1156–1169. [Google Scholar] [CrossRef]
  29. Memari, A.; Dargi, A.; Akbari Jokar, M.R.; Ahmad, R.; Abdul Rahim, A.R. Sustainable Supplier Selection: A Multi-Criteria Intuitionistic Fuzzy TOPSIS Method. J. Manuf. Syst. 2019, 50, 9–24. [Google Scholar] [CrossRef]
  30. Khoshfetrat, S.; Rahiminezhad Galankashi, M.; Almasi, M. Sustainable Supplier Selection and Order Allocation: A Fuzzy Approach. Eng. Optim. 2020, 52, 1494–1507. [Google Scholar] [CrossRef]
  31. Tirkolaee, E.B.; Mardani, A.; Dashtian, Z.; Soltani, M.; Weber, G.-W. A Novel Hybrid Method Using Fuzzy Decision Making and Multi-Objective Programming for Sustainable-Reliable Supplier Selection in Two-Echelon Supply Chain Design. J. Clean. Prod. 2020, 250, 119517. [Google Scholar] [CrossRef]
  32. Alavi, B.; Tavana, M.; Mina, H. A Dynamic Decision Support System for Sustainable Supplier Selection in Circular Economy. Sustain. Prod. Consum. 2021, 27, 905–920. [Google Scholar] [CrossRef]
  33. Zhou, X.; Xu, Z. An Integrated Sustainable Supplier Selection Approach Based on Hybrid Information Aggregation. Sustainability 2018, 10, 2543. [Google Scholar] [CrossRef] [Green Version]
  34. Hoseini, S.A.; Fallahpour, A.; Wong, K.Y.; Mahdiyar, A.; Saberi, M.; Durdyev, S. Sustainable Supplier Selection in Construction Industry through Hybrid Fuzzy-Based Approaches. Sustainability 2021, 13, 1413. [Google Scholar] [CrossRef]
  35. Boz, E.; Çizmecioğlu, S.; Çalık, A. A Novel MCDM Approach for Sustainable Supplier Selection in Healthcare System in the Era of Logistics 4.0. Sustainability 2022, 14, 13839. [Google Scholar] [CrossRef]
  36. Zhang, J.; Yang, D.; Li, Q.; Lev, B.; Ma, Y. Research on Sustainable Supplier Selection Based on the Rough DEMATEL and FVIKOR Methods. Sustainability 2020, 13, 88. [Google Scholar] [CrossRef]
  37. Chai, J.; Liu, J.N.K.; Ngai, E.W.T. Application of Decision-Making Techniques in Supplier Selection: A Systematic Review of Literature. Expert Syst. Appl. 2013, 40, 3872–3885. [Google Scholar] [CrossRef]
  38. Awasthi, A.; Chauhan, S.S.; Goyal, S.K. A Fuzzy Multicriteria Approach for Evaluating Environmental Performance of Suppliers. Int. J. Prod. Econ. 2010, 126, 370–378. [Google Scholar] [CrossRef]
  39. Büyüközkan, G.; Çifçi, G. A Novel Hybrid MCDM Approach Based on Fuzzy DEMATEL, Fuzzy ANP and Fuzzy TOPSIS to Evaluate Green Suppliers. Expert Syst. Appl. 2012, 39, 3000–3011. [Google Scholar] [CrossRef]
  40. Freeman, J.; Chen, T. Green Supplier Selection Using an AHP-Entropy-TOPSIS Framework. Supply Chain Manag. 2015, 20, 327–340. [Google Scholar] [CrossRef] [Green Version]
  41. Luthra, S.; Govindan, K.; Kannan, D.; Mangla, S.K.; Garg, C.P. An Integrated Framework for Sustainable Supplier Selection and Evaluation in Supply Chains. J. Clean. Prod. 2017, 140, 1686–1698. [Google Scholar] [CrossRef]
  42. Yadavalli, V.S.; Darbari, J.D.; Bhayana, N.; Jha, P.C.; Agarwal, V. An Integrated Optimization Model for Selection of Sustainable Suppliers Based on Customers’ Expectations. Oper. Res. Perspect. 2019, 6, 100113. [Google Scholar] [CrossRef]
  43. Mohammed, A.; Harris, I.; Govindan, K. A Hybrid MCDM-FMOO Approach for Sustainable Supplier Selection and Order Allocation. Int. J. Prod. Econ. 2019, 217, 171–184. [Google Scholar] [CrossRef]
  44. Rabieh, M.; Rafsanjani, A.F.; Babaei, L.; Esmaeili, M. Sustainable Supplier Selection and Order Allocation: An Integrated Delphi Method, Fuzzy TOPSIS, and Multi-Objective Programming Model. Sci. Iran. 2019, 26, 2524–2540. [Google Scholar] [CrossRef] [Green Version]
  45. Okwu, M.O.; Tartibu, L.K. Sustainable Supplier Selection in the Retail Industry: A TOPSIS- and ANFIS-Based Evaluating Methodology. Int. J. Eng. Bus. Manag. 2020, 12, 184797901989954. [Google Scholar] [CrossRef]
  46. Faez, F.; Ghodsypour, S.H.; O’Brien, C. Vendor Selection and Order Allocation Using an Integrated Fuzzy Case-Based Reasoning and Mathematical Programming Model. Int. J. Prod. Econ. 2009, 121, 395–408. [Google Scholar] [CrossRef]
  47. Nazari-Shirkouhi, S.; Shakouri, H.; Javadi, B.; Keramati, A. Supplier Selection and Order Allocation Problem Using a Two-Phase Fuzzy Multi-Objective Linear Programming. Appl. Math. Model. 2013, 37, 9308–9323. [Google Scholar] [CrossRef]
  48. Torabi, S.A.; Baghersad, M.; Mansouri, S.A. Resilient Supplier Selection and Order Allocation under Operational and Disruption Risks. Transp. Res. Part E Logist. Transp. Rev. 2015, 79, 22–48. [Google Scholar] [CrossRef]
  49. Çebi, F.; Otay, İ. A Two-Stage Fuzzy Approach for Supplier Evaluation and Order Allocation Problem with Quantity Discounts and Lead Time. Inf. Sci. 2016, 339, 143–157. [Google Scholar] [CrossRef]
  50. Bodaghi, G.; Jolai, F.; Rabbani, M. An Integrated Weighted Fuzzy Multi-Objective Model for Supplier Selection and Order Scheduling in a Supply Chain. Int. J. Prod. Res. 2018, 56, 3590–3614. [Google Scholar] [CrossRef]
  51. Azadnia, A.H.; Saman, M.Z.M.; Wong, K.Y. Sustainable Supplier Selection and Order Lot-Sizing: An Integrated Multi-Objective Decision-Making Process. Int. J. Prod. Res. 2015, 53, 383–408. [Google Scholar] [CrossRef]
  52. Hamdan, S.; Cheaitou, A. Supplier Selection and Order Allocation with Green Criteria: An MCDM and Multi-Objective Optimization Approach. Comput. Oper. Res. 2017, 81, 282–304. [Google Scholar] [CrossRef]
  53. Moheb-Alizadeh, H.; Handfield, R. Sustainable Supplier Selection and Order Allocation: A Novel Multi-Objective Programming Model with a Hybrid Solution Approach. Comput. Ind. Eng. 2019, 129, 192–209. [Google Scholar] [CrossRef]
  54. You, S.-Y.; Zhang, L.-J.; Xu, X.-G.; Liu, H.-C. A New Integrated Multi-Criteria Decision Making and Multi-Objective Programming Model for Sustainable Supplier Selection and Order Allocation. Symmetry 2020, 12, 302. [Google Scholar] [CrossRef] [Green Version]
  55. Beiki, H.; Mohammad Seyedhosseini, S.; Ponkratov, V.V.; Zekiy, A.O.; Ivanov, S.A. Addressing a Sustainable Supplier Selection and Order Allocation Problem by an Integrated Approach: A Case of Automobile Manufacturing. J. Ind. Prod. Eng. 2021, 38, 239–253. [Google Scholar] [CrossRef]
  56. Rashidi, K.; Noorizadeh, A.; Kannan, D.; Cullinane, K. Applying the Triple Bottom Line in Sustainable Supplier Selection: A Meta-Review of the State-of-the-Art. J. Clean. Prod. 2020, 269, 122001. [Google Scholar] [CrossRef]
  57. Rajesh, R.; Ravi, V. Supplier Selection in Resilient Supply Chains: A Grey Relational Analysis Approach. J. Clean. Prod. 2015, 86, 343–359. [Google Scholar] [CrossRef]
  58. Mohammed, A.; Harris, I.; Soroka, A.; Nujoom, R. A Hybrid MCDM-Fuzzy Multi-Objective Programming Approach for a G-Resilient Supply Chain Network Design. Comput. Ind. Eng. 2019, 127, 297–312. [Google Scholar] [CrossRef]
  59. Yavari, M.; Zaker, H. An Integrated Two-Layer Network Model for Designing a Resilient Green-Closed Loop Supply Chain of Perishable Products under Disruption. J. Clean. Prod. 2019, 230, 198–218. [Google Scholar] [CrossRef]
  60. Xiong, L.; Zhong, S.; Liu, S.; Zhang, X.; Li, Y. An Approach for Resilient-Green Supplier Selection Based on WASPAS, BWM, and TOPSIS under Intuitionistic Fuzzy Sets. Math. Probl. Eng. 2020, 2020, 1761893. [Google Scholar] [CrossRef]
  61. Liaqait, R.A.; Warsi, S.S.; Zahid, T.; Ghafoor, U.; Ahmad, M.S.; Selvaraj, J. A Decision Framework for Solar PV Panels Supply Chain in Context of Sustainable Supplier Selection and Order Allocation. Sustainability 2021, 13, 13216. [Google Scholar] [CrossRef]
  62. Liaqait, R.A.; Warsi, S.S.; Agha, M.H.; Zahid, T.; Becker, T. A Multi-Criteria Decision Framework for Sustainable Supplier Selection and Order Allocation Using Multi-Objective Optimization and Fuzzy Approach. Eng. Optim. 2022, 54, 928–948. [Google Scholar] [CrossRef]
  63. Sen, D.K.; Datta, S.; Mahapatra, S.S. A TODIM-Based Decision Support Framework for G-Resilient Supplier Selection in Fuzzy Environment. Asia-Pac. J. Oper. Res. 2016, 33, 1650033. [Google Scholar] [CrossRef]
  64. Amindoust, A. A Resilient-Sustainable Based Supplier Selection Model Using a Hybrid Intelligent Method. Comput. Ind. Eng. 2018, 126, 122–135. [Google Scholar] [CrossRef]
  65. Jabbarzadeh, A.; Fahimnia, B.; Sabouhi, F. Resilient and Sustainable Supply Chain Design: Sustainability Analysis under Disruption Risks. Int. J. Prod. Res. 2018, 56, 5945–5968. [Google Scholar] [CrossRef]
  66. Fallahpour, A.; Nayeri, S.; Sheikhalishahi, M.; Wong, K.Y.; Tian, G.; Fathollahi-Fard, A.M. A Hyper-Hybrid Fuzzy Decision-Making Framework for the Sustainable-Resilient Supplier Selection Problem: A Case Study of Malaysian Palm Oil Industry. Environ. Sci. Pollut. Res. 2021, 1–21. [Google Scholar] [CrossRef]
  67. Fazlollahtabar, H.; Kazemitash, N. Design of Fazl-Tash Novel Method for Sustainable Resilient Comprehensive Supplier Selection Problem. Kybernetes 2022, 51, 275–301. [Google Scholar] [CrossRef]
  68. Mahmoudi, A.; Javed, S.A.; Mardani, A. Gresilient Supplier Selection through Fuzzy Ordinal Priority Approach: Decision-Making in Post-COVID Era. Oper. Manag. Res. 2022, 15, 208–232. [Google Scholar] [CrossRef]
  69. Forghani, A.; Sadjadi, S.J.; Farhang Moghadam, B. A Supplier Selection Model in Pharmaceutical Supply Chain Using PCA, Z-TOPSIS and MILP: A Case Study. PLoS ONE 2018, 13, e0201604. [Google Scholar] [CrossRef]
  70. Chen, C.-T. Extensions of the TOPSIS for Group Decision-Making under Fuzzy Environment. Fuzzy Sets Syst. 2000, 114, 1–9. [Google Scholar] [CrossRef]
  71. Mavrotas, G.; Florios, K. An Improved Version of the Augmented ε-Constraint Method (AUGMECON2) for Finding the Exact Pareto Set in Multi-Objective Integer Programming Problems. Appl. Math. Comput. 2013, 219, 9652–9669. [Google Scholar] [CrossRef]
  72. Mavrotas, G. Effective Implementation of the ε-Constraint Method in Multi-Objective Mathematical Programming Problems. Appl. Math. Comput. 2009, 213, 455–465. [Google Scholar] [CrossRef]
  73. Diakoulaki, D.; Mavrotas, G.; Papayannakis, L. Determining Objective Weights in Multiple Criteria Problems: The Critic Method. Comput. Oper. Res. 1995, 22, 763–770. [Google Scholar] [CrossRef]
  74. Resat, H.G.; Turkay, M. Design and Operation of Intermodal Transportation Network in the Marmara Region of Turkey. Transp. Res. Part E Logist. Transp. Rev. 2015, 83, 16–33. [Google Scholar] [CrossRef]
Figure 1. The multi-modal, multi-echelon supply chain network under evaluation.
Sustainability 15 05962 g001
Figure 2. Generalized framework for implementation of the proposed methodology.
Sustainability 15 05962 g002
Figure 3. (a) Membership function for TC, TTT, EI, and AQL (b) Membership function for TVSP.
Sustainability 15 05962 g003
Figure 4. Flowchart of the AUGMECON2 method.
Sustainability 15 05962 g004
Figure 5. Best optimal solutions for t1t4.
Sustainability 15 05962 g005aSustainability 15 05962 g005b
Table 1. A review of sustainable and resilient SS-OA literature.
Research PublicationSustainability CriteriaResilience CriteriaSS
Technique(s)
OA
Technique(s)
Application Case Study
EconomicEnvironmentSocial
Rajesh and Ravi [57] GRA, AHP, ANP Electronics devices manufacturing industry
Sen et al. [63] TODIM Numerical problem
Amindoust [64]FIS, AR (Assurance Region) DEA Alloy manufacturing industry
Jabbarzadeh et al. [65]Stochastic bi-objective optimization Plastic goods manufacturing industry
Mohammed et al. [58] Fuzzy AHP, TOPSISFuzzy multi-objective programmingFood supply chain
Hosseini et al. [10] Stochastic bi-objective mixed-integer programmingNumerical problem
Yavari and Zaker [59] Mixed-integer linear programming Dairy supply chain
Fallahpour et al. [66]Fuzzy
DEMATEL, Fuzzy ANP, Fuzzy BWM, FIS
Palm oil industry
Fazlollahtabar and Kazemitash [67]Authors’ custom technique, DEA Electrical equipment manufacturing industry
Mahmoudi et al. [68] Fuzzy Ordinal Priority Approach (OPA) Numerical problem
This research workFuzzy AHP, Fuzzy TOPSISFuzzy multi-objective mixed-integer nonlinear programmingPharmaceutical industry
Table 4. FE-AHP weights for sustainability and resilience criteria and sub-criteria.
CriteriaGlobal WeightsSub-CriteriaLocal WeightsRanking
Economic0.66Product Price0.025
Payment Terms0.025
Product Quality0.034
Use of Technology0.034
Volume Flexibility0.073
Vendor’s Reputation0.073
Responsiveness0.122
Product Mix0.151
Past Business0.151
Environment0.08Environmental Management System0.013
Energy Consumption0.022
Waste Management System0.022
Innovative Capability0.031
Social0.16Employee Health & Safety0.013
Staff Personal & Technical Development0.022
Information Disclosure0.131
Resilience0.1Robustness0.031
Agility0.022
Leanness0.022
Flexibility0.031
Table 5. Ranking of suppliers using FTOPSIS.
SupplierEconomic CriteriaEnvironment CriteriaSocial CriteriaResilience CriteriaOverall Closeness CoefficientRanking
Supplier 10.690.120.360.150.681
Supplier 20.680.160.140.150.6482
Supplier 30.640.230.540.920.5673
Supplier 40.50.30.680.610.4214
Supplier 50.20.870.860.420.2685
Table 6. Optimum solutions of objective functions for time period t using nonlinear solver.
Time PeriodObjective FunctionIdeal Solution
t1TC$91,136,983.38
TTT621.6 h
EI750,915.35 g
AQL18,680.02 kg
TVSP117,241.22
t2TC$93,435,628.21
TTT645.3 h
EI892,574.29 g
AQL18,721.19 kg
TVSP116,272.51
t3TC$95,265,437.07
TTT634.2 h
EI957,297.42 g
AQL19,938.52 kg
TVSP117,252.96
t4TC$96,521,876.81
TTT655.7 h
EI869,374.61 g
AQL19,132.52 kg
TVSP119,935.22
The symbol ‘$’ indicates that the value is an amount of money.
Table 7. Payoff table using AUGMECON2 for time period t.
Time
Period
Objective FunctionTCTTTEIAQLTVSP
t1TC92,804,282.45823.331,755,576.818,475105,930.56
TTT93,631,359.24608.86849,670.3819,475119,085.76
EI93,631,359.24608.86849,670.3819,475119,085.76
AQL93,631,340.95608.85849,652.8119,475119,085.76
TVSP95,162,050.42611.33850,116.4218,975119,485.76
t2TC91,254,980.23797.251,564,291.618,356143,597.22
TTT93,473,964.17657.61873,693.4318,929116,293.91
EI93,912,579.05629.43865,298.6619,574116,369.32
AQL93,624,579.66602.43869,764.3419,578116,297.49
TVSP97,253,427.49638.29868,265.5519,649115,679.64
t3TC92,673,456.22643.531,427,941.319,246152,457.87
TTT95,876,521.09687.47942,654.3919,925117,562.82
EI97,648,761.22678.32956,482.2119,643117,465.97
AQL95,790,352.62654.91954,278.2319,587117,790.11
TVSP96,542,752.79667.01957,267.2519,647117,025.09
t4TC97,825,790.25686.381,374,825.219,835137,923.34
TTT96,257,860.29652.71868,734.5619,897116,432.66
EI96,843,789.34652.82873,484.4319,642119,843.21
AQL96,894,392.55655.72862,564.5219,528119,532.62
TVSP96,654,872.46679.31865,782.3719,874119,376.01
Table 8. Maximum and minimum values of objective functions for t1–t4.
Objective Functiont1t2t3t4
MaxMinMaxMinMaxMinMaxMin
TC95,162,050.4292,804,282.4597,253,427.4991,254,980.239,7648,761.2292,673,456.2297,825,790.25962,57,860.29
TTT823.33608.85797.25602.43687.47643.53686.38652.71
EI1,755,576.8849,652.811,564,291.6865,298.661,427,941.3942,654.391,374,825.2862,564.52
AQL19,4751847519,64918,35619,64719,24619,89719,528
TVSP119,485.76105,930.56143,597.22116,293.91152,457.87117,025.09137,923.34116,432.66
Table 9. ε-values of TTT, EI, AQL, and TVSP.
Time
Period
ε-Values
ε2ε3ε4ε5
1t1608.85849,852.8118,475105,930.56
t2716.09849,652.7118,425109,831.37
t3823.33849,652.2118,375110,718.26
t4608.851,302,614.818,475115,701.11
2t1608.851,302,614.818,375105,930.16
t2716.09849,652.8119,575108,921.84
t3823.33849,652.8117,965112,222.01
t4608.85849,752.8117,985117,728.19
3t1608.851,302,614.818,355105,930.06
t2716.09859,252.8118,925111,392.11
t3823.33889,652.6118,765112,421.17
t4608.85819,652.0119,971116,133.15
4t1608.85859,652.8119,975105,930.06
t2823.33846,652.9119,673111,929.72
t3608.85849,752.8118,455114,441.06
t4823.331,302,614.819,415115,792.19
5t1823.331,302,614.819,815105,930.72
t2608.85849,652.3318,415109,431.82
t3823.33847,652.6119,121112,416.15
t4608.85845,652.0918,415115,719.82
6t1608.85849,652.8119,415105,930.28
t2608.85849,752.9119,411106,931.65
t3716.09848,652.2918,471114,563.12
t4823.33849,752.8119,471115,708.11
7t1608.85889,652.8619,915105,930.52
t2716.09848,652.8119,915105,930.86
t3823.33889,652.8819,915112,518.15
t4608.851,302,614.819,915114,401.26
8t1823.331,755,576.818,915105,930.26
t2608.85849,652.8619,975107,531.52
t3823.33848,652.8119,915114,478.12
t4608.85889,652.9719,414117,719.11
9t1823.33849,672.8118,425105,930.23
t2608.85848,652.9118,415104,948.35
t3823.33859,652.8819,371114,545.11
t4608.851,755,576.819,275118,715.16
10t1823.331,755,576.818,415105,930.15
t2608.85849,652.8618,585110,943.54
t3823.33848,652.8119,471111,927.14
t4608.85839,672.6919,475117,934.29
Table 10. CRITIC weights for objective functions for t1t4.
Objective FunctionWeight
t1t2t3t4
TC0.210.210.20.25
TTT0.10.10.150.15
EI0.10.10.170.12
AQL0.250.220.20.18
TVSP0.340.370.280.3
Table 11. Relative closeness coefficient (CC) matrix for Pareto solutions of AUGMECON2 for t1t4.
Time Period
t1t2t3t4
CC10.9440.7420.9610.958
20.8850.6920.8380.974
30.8510.8520.6590.862
40.7880.9520.2710.681
Table 12. Best optimal solution of each objective function for t1t4.
CCTCTTTEIAQLTVSP
t10.94493,224,195.91736.22849,670.3818,564108,357.88
t20.95294,678,327.81699.13887,235.2519,741112,319.02
t30.96192,675,287.52647.02957,162.4519,623115,791.21
t40.97496,589,852.26691.72878,519.3119,738117,301.06
Disclaimer/Publisher’s Note: The statements, opinions and data contained in all publications are solely those of the individual author(s) and contributor(s) and not of MDPI and/or the editor(s). MDPI and/or the editor(s) disclaim responsibility for any injury to people or property resulting from any ideas, methods, instructions or products referred to in the content.

