Article

A Study on the Effect of Medical Service Quality on Customer Satisfaction during COVID-19 for Foreigners in Korea

1
Department of Global Business, Kyungsung University, Busan 48434, Republic of Korea
2
School of Hospitality and Tourism Management, Kyungsung University, Busan 48434, Republic of Korea
3
Wellness & Tourism Big Data Research Institute, Kyungsung University, Busan 48434, Republic of Korea
*
Author to whom correspondence should be addressed.
Sustainability 2023, 15(7), 5953; https://doi.org/10.3390/su15075953
Submission received: 7 March 2023 / Revised: 24 March 2023 / Accepted: 27 March 2023 / Published: 29 March 2023

Abstract

:
With the increasing number of foreigners residing in Korea, there is a need for further research on medical service satisfaction for this demographic. Therefore, this study aimed to analyze the impact of medical service quality on customer satisfaction and revisit intention of foreigners in Korea during the COVID-19 pandemic. An online survey was conducted from 15 March to 15 May 2022 to gather data from foreign residents in Korea. A total of 201 questionnaires were analyzed using IBM SPSS Statistics 26.0 and Smart PLS3.0 for empirical analysis. The results of the study demonstrate that reliability, empathy, and COVID-19 regulations (excluding responsiveness, assurance, and tangibles) positively impact customer satisfaction with medical services. Additionally, customer satisfaction with medical services positively affects revisit intention. Furthermore, variables, such as nationality and medical department, show average differences. These findings suggest that hospitals should focus on COVID-19 prevention and the quality of medical services, while also taking into account unique characteristics, such as nationality and medical department. This study provides essential reference data for medical institutions exposed to infinite competition, informing management strategies to increase customer satisfaction and revisit intention during COVID-19.

1. Introduction

According to the Ministry of Justice, the number of foreigners residing in Korea throughout 2019 was 2,524,656, an increase of 6.6% from 2,367,607 in 2018. The proportion of foreigners living in Korea reached 5% of the total population, and long-term foreigners who live for more than three months are nearly 70% more than double the number of short-term foreigners. Due to COVID-19, the number of foreigners staying in Korea decreased in 2020 to 2,036,075; however, the Ministry of Justice [1] predicted that the number of foreigners staying in Korea will grow continuously.
As the number of foreigners staying in Korea increases, the number of foreigners using medical services in Korea is also increasing [2]. The number of foreign patients using Korean medical institutions steadily increased from 2010 to 2019, and in 2019, the number of foreign patients was 497,464. In 2020, the number of foreign patients plunged to 117,069 due to the ban on movement between countries and restrictions on entry due to the COVID-19 pandemic [3]. However, the number of foreign patients is expected to increase when the COVID-19 situation recovers. With that being said, foreigners will also be an important customer in Korean medical institutions.
There are more medical experts and institutions in Korea these days, and competition among them is inevitable. With that, the expectations for medical services are also rising due to the improvement of living standards, ease of access to various information, and increased interest in health [4,5]. Therefore, hospitals cannot survive in and maintain a supplier-oriented market, such as the medical industry in the past. Satisfaction with medical services is an important determinant in visiting medical institutions, and patients who are satisfied with medical services will visit again and will have a high intention of spreading word of mouth [6,7,8]. Hence, medical institutions need to make efforts to improve the quality of medical services so that patients will be satisfied with the medical services and visit the institutions again.
In order to ensure their survival, medical institutions must be aware of the level of satisfaction that foreigners have with the medical services they provide. Therefore, it is imperative to conduct a study on the satisfaction levels of foreigners. While there have been several studies on the satisfaction levels of medical services offered to Koreans, research targeting foreigners has been inadequate [9]. Furthermore, research on this subject has significantly decreased since 2017 and has become even more infrequent since the onset of the COVID-19 pandemic [
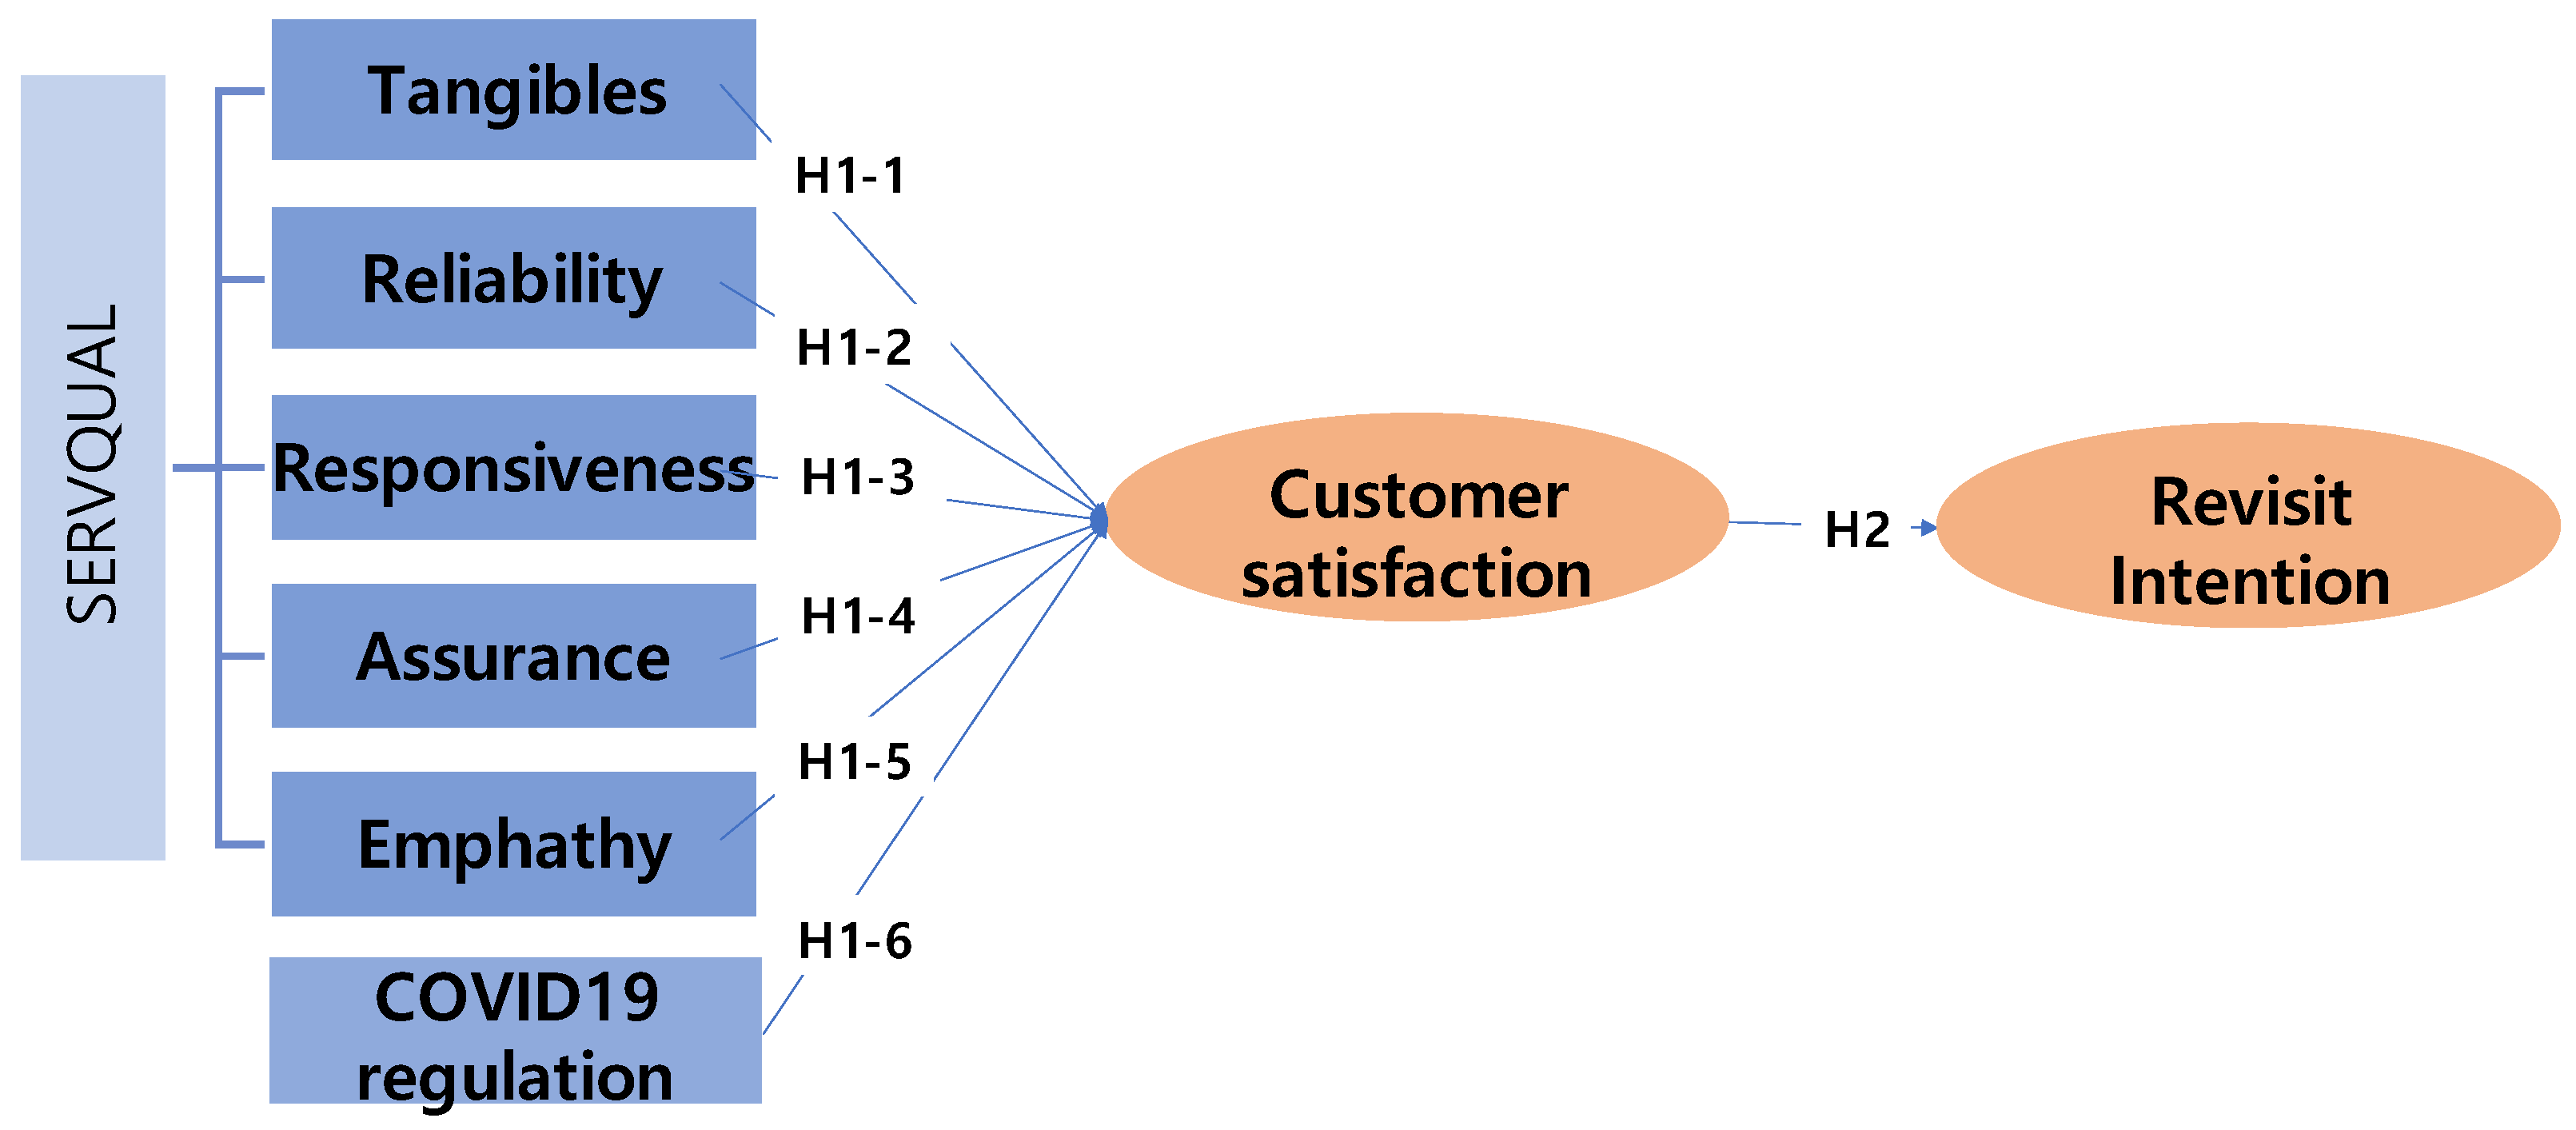
2]. Therefore, this study applies the SERVQUAL model of Parasuraman to medical services to measure the quality of medical services of foreigners staying in Korea post COVID-19 [10]. This study will provide useful information for the sustainability of the medical institutions by improving the quality of medical services and the satisfaction of foreign patients. This study was organized into several sections: Section 2 presents previous studies and research papers on medical service quality during COVID-19 to develop the hypothesis; Section 3 outlines the research methodology; Section 4 provides analytical results with explanatory tables, and Section 5 includes a discussion of the findings, study limitations, and suggestions for future research.

2. Literature Review

2.1. Medical Service Quality

As the importance of services is emphasized and types are diversified, each scholar defines service quality from various perspectives. Lewis and Booms [11] argued that service quality means a ‘measure of how well the service level delivered matches customer expectations’ and that providing quality service is consistently meeting customer expectations. Grönroos [12] defined service quality as ‘the result of a comparative evaluation of a customer’s expected service and perceived service.’ Parasuraman et al. [10] defined service quality as an overall evaluation of the difference between customer performance and expectations and a judgment or attitude on service excellence. Although the service evaluation criteria vary, Parasuraman et al.’s SERVQUAL model is the most representative standard. The SERVQUAL model consists of five dimensions: tangibles, reliability, responsiveness, assurance, and empathy [13].
The concept of quality of medical services varies widely from a series of activities aimed at improving health to an effort to increase the level of care limited to medical treatment [13,14,15]. Donabedian [14] defined a good medical service quality as being when the medical care provided increases the patient’s welfare to the highest level, while at the same time balancing the expected benefits and losses during the process of treatment. Bopp [15] described medical service quality as being very professional and technical and consisting of three factors: structure, process, and outcome. Lytle and Mokwa [16] explained that medical service quality is interpreted as satisfying the patient’s needs, and the patient evaluates service quality by service outcome, service process, and physical environment.
Despite the fact that medical services require more expertise than other services, they include most of the characteristics of general services, so the concepts and theories developed in service marketing can be applied [17]. There are many studies on patient satisfaction and revisit intention by using a SERVQUAL model in the medical service field [6,17,18,19,20,21]. Kim et al. [18] conducted multiple regression analyses to investigate the relationship among medical service quality, revisit intention, and word of mouth, and, as a result, they found that assurance, responsiveness, and tangibles affect revisit intention. Ji et al. [19] figured out that changes in perception of medical service quality have a positive effect on factors of patient satisfaction and revisit intention. Lee et al. [6] identified that assurance and empathy have a positive effect on revisit intention. Kim and Kim [20] measured the medical service quality of foreign medical tourists and found that assurance, reliability, and tangibles had a positive effect on customer satisfaction. Park and Shin [21] conducted a study on medical service quality for medical tourists and found that all aspects of service quality, except empathy, significantly contributed to customer satisfaction.

2.2. COVID-19 and Medical Service

COVID-19 is an infectious disease caused by the SARS-CoV-2 virus [22]. After COVID-19 was first discovered in Wuhan, China in December 2019, it spread rapidly around the world, and eventually, on 11 March 2020, the WHO declared a pandemic [23]. In Korea, the first confirmed COVID-19 case occurred on 20 January 2020, and as of May 2022, the cumulative number of confirmed cases exceeded 18 million [24]. Due to the impact of COVID-19, the number of people who used medical services at least once in the first half of 2020 was 59.1%, a decrease of 9.8 percentage points compared to the first half of 2019 [25]. In the first half of 2020, 15.6% of medical service users felt anxiety about infection while visiting hospitals and clinics, which is more than double the number in the first half of 2019.
Currently, the medical industry is prioritizing practical areas, such as studying new policy responses to adapt to the challenges of COVID-19 [26]. As a result, research on improving medical services and implementing changes is not currently the main focus. Thus, the Korean Institute for Health and Social Affairs [27] has distributed guidelines on measures to prevent the inflow of COVID-19 into medical institutions and to prevent the spread of COVID-19 within institutions. The guidelines include posting infection prevention rules, ventilation, social distancing, compliance with COVID-19 prevention rules, and confirmation of suspected symptoms related to COVID-19. According to Diego et al. [28], reliable safety from COVID-19 showed a direct and positive effect on service quality and customer satisfaction.

2.3. Customer Satisfaction and Revisit Intention

An evaluative judgement post consumption of a specific product or service is defined as satisfaction [29]. The initial study conducted with patient and caregiver satisfaction in the hospital was performed using content analysis of existing studies to infer its definition [30]. With that study, Kotler and Keller [31] defined satisfaction with medical services as the attitude reflecting the likability or unlikability of medical services provided by medical staff after the medical service has being completed. Other studies mentioned that customer satisfaction with medical services is the perceived value of the medical services before, during, and post services [32].
The reuse intention refers to the intention to revisit the institution where the service was used. Revisit intention means a customer’s planned future behavior; it also means the probability that an individual’s beliefs and attitudes will turn into an actual purchasing activity [33]. Revisit intention is measured as the judgment as to whether the user will return as an expectation of future service in comparison to the user’s previous experience [34].
Bitner [35] confirmed that satisfaction significantly affects reuse intention. Revisit intention of medical services was measured by the intention to revisit in order to confirm the correlation between revisit intentions and satisfaction with medical service quality [36]. As described in previous studies, this research defines the causal relationship among medical service quality, customer satisfaction, and revisit intention.

3. Methodology

3.1. Hypothesis Development

This study established an hypothesis to investigate the effect of medical service quality on customer satisfaction and revisit intention based on the results of previous studies utilizing SERVQUAL model [6,17,18,19,20,21]. This study also added another variable, which were COVID-19 regulations. During COVID-19, COVID-19 regulations were important in medical services [28]; so, in this study, COVID-19 regulation variables were measured along with other medical service qualities. Based on these considerations, the following hypothesis and research model were developed as shown in Figure 1.
H1: 
Medical service quality has a positive effect on customer satisfaction.
H1-1: 
Tangibles have a positive effect on customer satisfaction.
H1-2: 
Reliability has a positive effect on customer satisfaction.
H1-3: 
Responsiveness has a positive effect on customer satisfaction.
H1-4: 
Assurance has a positive effect on customer satisfaction.
H1-5: 
Empathy has a positive effect on customer satisfaction.
H1-6: 
COVID-19 regulations have a positive effect on customer satisfaction.
H2: 
Customer satisfaction has a positive effect on revisit intention.
Figure 1. Research Model.
Sustainability 15 05953 g001

3.2. Operation Definition and Measurement Items of Variables

In this study, the measurement items of each variable were set based on the previous studies. Each measurement item was modified and supplemented according to this study. Table 1 shows this study’s operation definition and measurement items of variables.

3.3. Data Analysis

This study employed an online survey using a Google form, which targeted foreigners who had experience with Korean medical services. The participants were selected through convenience sampling. Before officially distributing the survey, a pilot test was conducted with 30 respondents, and the results of this test were found to be significant. Based on these findings, an official survey was then distributed, and a total of 201 responses were collected over a two-month period from 15 March 2022 to 15 May 2022. For empirical analysis, the IBM SPSS Statistics 26.0 and Smart PLS 3.0 statistical programs were utilized.

4. Results and Data Analysis

4.1. Demographic Profile

Table 2 shows the demographic characteristics of 201 samples used in this study. Among the 201 respondents, 84 (41.8%) were women, and 117 (58.2%) were men. The age group of 20 to 29 (82.6 percent) accounted for the biggest portion of the sample. At the education level, about 66.7% had a bachelor’s degree, 27.4% had a master’s degree, and 6% had a doctorate degree. Most of the respondents were students (91.5%) and lived in Busan (89.1%). Among the respondents, 57 people were Nepalese (28.4%), followed by Bangladeshis 46 (22.9%) and Indonesians 35 (17.4%). Of the respondents, 98 (48.8%) went to the general hospital, 83 (41.3%) went to a clinic, and 18 (9%) went to university hospital. The number of visitors to internal medicine was 81 (40.3%), followed by dentist 27 (13.4%).

4.2. Measurement Model

The reliability and validity of the measurement items were evaluated as shown in Table 3. The model contained indicators, such as Cronbach’s alpha, average variance extracted (AVE), loadings, and composite reliability (CR). All factor loadings showed significant values of 0.5 or more. AVE, CR, and Cronbach’s alpha values were found to be greater than the recommended values of 0.50, 0.70, and 0.70, respectively [42].
The results of the verification of the hypothesis in this study were analyzed through the path coefficients of the PLS structural model, and the bootstrap method was used as a method for estimating the path coefficients. The bootstrap method is a method of estimating measured values with the same distribution from sample data by restoration extraction and is a method commonly used to evaluate the significance of path coefficients in the PLS path model [43].
According to Fornell and Larker [42], if the square root of the average variance extracted (AVE) of each factor is greater than the correlation coefficient between that factor and the other factor, the discriminant validity of the PLS measurement model is considered to exist. Therefore, as shown in Table 4, the discrimination validity was verified.
Table 5 shows the cross-loading values of the indicators related to the construction of the reflective measurement model. Indicators from the reflective measurement model need to have the highest load on the underlying latent structure compared to other indicators. Referring to Table 5, the index of the reflective measurement model with the bolded numbers shows that the load on each latent structure is higher than the load on the others. Therefore, these results satisfy the cross-loading evaluation criteria and provide sufficient evidence for the discriminant validity of the reflective measurement model.

4.3. Structural Model

The R2 value of customer satisfaction is 0.705, and the R2 value of revisit intention is 0.510. In the PLS structural model, the path coefficient and t-value of the structural model representing the causal relationship between latent variables are shown in Table 6. If the t-statistic is greater than ±1.96, it can be interpreted that the research hypothesis is adopted [44]. As a result of the test, five of the seven hypotheses were adopted except for H1-1 and H1-4. In the test between service quality and customer satisfaction, reliability, responsiveness, and empathy were found to have a positive (+) effect on customer satisfaction, and the added factor of COVID-19 regulations was also found to have a positive (+) effect on customer satisfaction. On the other hand, two of the SERVQUAL factors, tangibles and assurance, were found to not be significant toward customer satisfaction. This was followed by the next hypothesis, which was H2, and was proven to be highly significant.

4.4. ANOVA Analysis

ANOVA was conducted to analyze the average difference between the demographic factor and the mean of variables, and Duncan test was performed for post validation. The results are shown in Table 7 and Table 8. As a result of the analysis according to nationality, there was a significant difference in mean (M) of Assurance (A) and Empathy (E). In M_A, Nepal has the lowest average value, and Uzbekistan has the largest average value. In M_E, Nepal has the lowest average value, and the United Kingdom has the largest average value.
The average difference analysis according to the medical department showed significant results for average of Customer Satisfaction (CS), Reliability (Rb), and COVID-19 regulation, (CO). In M_CS, Other showed the smallest average value, and Ear, Nose, and Throat showed the largest average value. In M_Rb, general surgery showed the smallest average value, and like M_CS, Ear, Nose, and Throat had the largest average value. In M_CO, Psychiatry has the highest average value, and Other had the lowest average value.

5. Discussion

As a survival requirement for hospitals that are already experiencing difficulties in retaining patients, customer-oriented service quality management strategies have been identified as key to survival. Due to the rapid increase in foreign patients visiting domestic medical institutions, interest in the satisfaction of foreign patients is increasing for qualitative and continuous visits. The purpose of this study is to provide information for the sustainability of the medical industry by recognizing the relationship between the medical service quality factors of foreign patients on customer satisfaction and revisit intention. The discussions and implications of this study are discussed below.

5.1. Theoretical Implications

This research examined the ways in which medical service quality factors led to customer satisfaction. Among the quality of medical services, reliability, responsiveness, empathy, and COVID-19 regulations were found to have a positive (+) effect on customer satisfaction, and tangibles and assurance were found to have a negative effect on customer satisfaction. As it was a post COVID-19 study, the period is different from previous research, and the results are slightly different from it. The most dominant result being that COVID-19 regulations had a positive effect on customer satisfaction. With that being said, this is consistent with Diego et al.’s [28] research; hospitals should put more effort not only into service quality but also into COVID-19 regulations.
We discovered that customer satisfaction of medical services had a positive (+) effect on revisit intention. This is consistent with previous studies, when a positive attitude toward service quality is formed, customers are satisfied, and then the intention to reuse the service also increases [19,43,45]. However, the impact of tangibles on customer satisfaction is not significant, which differs from the results of previous studies conducted by Kim and Kim [20] and Wi et al. [5]. This may be due to the difference in the study subjects, as this research focused on foreigners, whereas the previous studies focused on Koreans only.
This study also uncovers differences on how specific groups of people perceived their customer satisfaction. For example, there was an average difference in assurance and empathy according to nationality. In addition, there are differences in the average of customer satisfaction, reliability, and COVID-19 regulations depending on the medical department.

5.2. Practical Implications

The COVID-19 pandemic had a negative impact on the medical industry; however, the current situation is slowly improving [46]. At this point, the medical industry has an opportunity to revive business and generate income. According to this study’s results, customer satisfaction had a high positive effect on revisit intention as in other previous studies. This study shows the dimensions of SERVQUAL affecting customer satisfaction in the hospital, and with that, this study provides many insights for hospital management strategies.
To maximize customer satisfaction, medical staff should focus on improving the quality of their medical services, specifically in the areas of reliability, responsiveness, empathy, and COVID-19 regulations. This study highlights the importance of providing accurate and timely services, as well as showing a genuine interest in resolving any issues that arise with patients.
Medical staff should also prioritize quick responses to patient needs and be willing to offer individualized attention to each patient. Hospitals must understand the unique needs of their customers and tailor their services accordingly. Finally, in light of the COVID-19 pandemic, hospitals must maintain a clean environment and enforce social distancing measures for patients. Temperature checks, hand sanitizing recommendations, and symptom checks for COVID-19 should also be implemented to ensure the safety of all patients.

6. Conclusions and Limitations

6.1. Conclusions

This study emphasizes the importance of customer-oriented service quality management strategies for the sustainability of the medical industry, particularly for foreign patients in the post COVID-19 era. The study found that reliability, responsiveness, empathy, and COVID-19 regulations have a positive effect on customer satisfaction, while tangibles and assurance have a negative effect on customer satisfaction. Customer satisfaction, in turn, has a positive effect on revisit intention. The study also highlights the importance of tailoring services to the unique needs of customers, particularly foreign patients. Medical staff should focus on providing accurate and timely services, showing a genuine interest in resolving issues and offering individualized attention to patients. Furthermore, hospitals should maintain a clean environment and enforce social distancing measures to ensure the safety of all patients. Overall, these findings provide useful insights for hospital management strategies to maximize customer satisfaction and promote sustainable business practices in the medical industry.

6.2. Limitations and Future Research

One of the limitations in this study is to represent all foreigners who visited Korean medical institutes. It is difficult to represent all foreigners because the sample of the survey was collected through convenience sampling, so the sample is not diverse. Most of the subjects of the survey are students living in Busan. Another limitation is that the COVID-19 regulations are constantly changing; therefore, this study was not able to reflect all the changes. In future research, research on foreigners of more diverse nationalities, occupations, and regions is needed, and research tailored to the rapidly changing COVID-19 situation is required.

Author Contributions

Conceptualization, S.K. and H.-S.K.; methodology, S.K. and H.-S.K.; analysis, S.K. and H.-S.K.; Writing—original draft, S.K.; writing—review and editing, S.K.; Supervision, H.-S.K. All authors have read and agreed to the published version of the manuscript.

Funding

This research was financially supported by the Ministry of Trade, Industry and Energy, Korea, under the “World Class Plus Program (R&D, P0020673)” supervised by the Korean Institute for Advancement of Technology (KIAT).

Institutional Review Board Statement

Not applicable.

Informed Consent Statement

Not applicable.

Data Availability Statement

Not applicable.

Conflicts of Interest

The authors declare no conflict of interest.

References

  1. Ministry of Justice. Current Status of Foreign Residents. Available online: https://kosis.kr/statHtml/statHtml.do?orgId=111&tblId=DT_1B040A6 (accessed on 26 September 2022).
  2. Tian, Y.; Yoon, H.; Choi, M. Quality of Medical Service and Satisfaction Perceived by Foreign Patients: A Systematic Review. Health Soc. Welf. Rev. 2021, 41, 177–194. [Google Scholar]
  3. Korean Health Industry Development Institue. Statistics on International Patients in Korea; Korean Health Industry Development Institue: Cheongju, Republic of Korea, 2021. [Google Scholar]
  4. Woo, S.; Choi, M. Medical Service Quality, Patient Satisfaction and Intent to Revisit: Case Study of Public Hub Hospitals in the Republic of Korea. PLoS ONE 2021, 16, e0252241. [Google Scholar] [CrossRef] [PubMed]
  5. Wi, H.S.; Choon, P.S.; Eun, P.J. Empirical Study on How the Quality of Medical Service Influences the Value of Medical Service and Customer Satisfaction. Korean Ind. Econ. Assoc. 2019, 32, 2491–2511. [Google Scholar]
  6. Lee, J.; Lee, S.Y.; Cheong, J.O. Hospital Choice: Which Type of Healthcare Service Quality Matter? Korean J. Hosp. Manag. 2017, 22, 31–45. [Google Scholar]
  7. Yoo, S.D.; In, S.H. The Effect of Customer Satisfaction on Intension of Maintaining Relationships in Relation to Medical Tourism in Korea: Focused on the Moderating Effect of Switching Costs. Korea J. Tour. Hosp. Res. 2013, 27, 53–68. [Google Scholar]
  8. Schoenfelder, T.; Klewer, J.; Kugler, J. Determinants of Patient Satisfaction: A Study among 39 Hospitals in an in-Patient Setting in Germany. Int. J. Qual. Health Care 2011, 23, 503–509. [Google Scholar] [CrossRef]
  9. Lee, D.; Kim, K.; Kwon, S. The Determinants of Health Care Utilization of International Students in Kore. Korean J. Health Econ. Policy 2021, 27, 121–148. [Google Scholar]
  10. Parasuraman, A.; Zeithaml, V.A.; Berry, L.L. A Conceptual Model of Service Quality and Its Implications for Future Research. J. Mark. 1985, 49, 41–50. [Google Scholar] [CrossRef]
  11. Lewis, R.; Booms, B. The Marketing Aspects of Service Quality, in Emerging Perspectives on Service Marketing; AMA: Chicago, IL, USA, 1983; pp. 99–104. [Google Scholar]
  12. Grönroos, C. A Service Quality Model and Its Marketing Implications. Eur. J. Mark. 1984, 18, 36–44. [Google Scholar] [CrossRef]
  13. Parasuraman, A.; Zeithaml, V.A.; Berry, L.L. SERVQUAL: A Multiple-Item Scale for Measuring Consumer Perceptions of Service Quality. J. Retail. 1988, 64, 12–40. [Google Scholar] [CrossRef]
  14. Donabedian, A. The Quality of Care: How Can It Be Assessed? JAMA J. Am. Med. Assoc. 1988, 260, 1743–1748. [Google Scholar] [CrossRef]
  15. Bopp, K.D. How Patients Evaluate the Quality of Ambulatory Medical Encounters: A Marketing Perspective. J. Health Care Mark. 1990, 10, 6–16. [Google Scholar] [PubMed]
  16. Lytle, R.S.; Mokwa, M.P. Evaluating Health Care Quality: The Moderating Role of Outcomes. J. Health Care Mark. 1992, 12, 460–469. [Google Scholar]
  17. Jeon, G., Ⅱ; Yi, H.; Lee, K.T. The Relationship between Medical Service Quality, Customer Satisfaction and Customer Loyalty. Korean Bus. Educ. Rev. 2014, 29, 416–438. [Google Scholar]
  18. Kim, K.H.; Chang, Y., Ⅱ; Jung, Y.S. A Study on Revisiting Intentions of Medical Institution Customers and Service Quality Factors Influencing Word-of-Mouth Effect. J. Korean Soc. Qual. Manag. 2001, 38, 15–23. [Google Scholar]
  19. Ji, K.J.; Park, C.M.; Lee, J.R. A Study of the Effects upon Satisfaction, Intention to Revisit and Perceived Value by Cerebrovascular Disease Patients through the Quality of Medical Services. Korean J. Health Serv. Manag. 2011, 37, 41–56. [Google Scholar] [CrossRef] [Green Version]
  20. Kim, D.G.; Kim, S.H. The Effect of Medical Service Quality Perceived by Medical Tourists on Customer Satisfaction: Focused on Daegu Metropolitan City. Korean J. Converg. Sci. 2020, 9, 468–480. [Google Scholar] [CrossRef]
  21. Park, G.-Y.; Shin, H.-S. A Study on the Effect of Quality of Medical Service on Service Value and Customer Satisfaction for Medical Tourists. Foodserv. Ind. J. 2021, 17, 157–171. [Google Scholar] [CrossRef]
  22. WHO. Coronavirus Disease (COVID-19). Available online: https://www.who.int/emergencies/diseases/novel-coronavirus-2019 (accessed on 29 September 2022).
  23. Katella, K. Our Pandemic Year—A COVID-19 Timeline. Available online: https://www.yalemedicine.org/news/covid-timeline (accessed on 29 September 2022).
  24. Korea Disease Control and Prevention Agency. Coronavirus (COVID-19), Republic of Korea. Available online: https://ncv.kdca.go.kr/ncov/ (accessed on 17 September 2022).
  25. Ministry of Health and Welfare. COVID-19 and Medical Service Experience. Available online: https://www.korea.kr/news/pressReleaseView.do?newsId=156497081 (accessed on 20 September 2022).
  26. You, J. Lessons from South Korea’s COVID-19 Policy Response. Am. Rev. Public Adm. 2020, 50, 801–808. [Google Scholar] [CrossRef]
  27. Korean Institute for Health and Social Affair. Prevention and Management of Infection in Medical Institutions; Korean Institute for Health and Social Affair: Sejong City, Republic of Korea, 2022. [Google Scholar]
  28. Diego, G.-C.; Paramio, A.; Cruces-Montes, S.; Marín-Dueñas, P.P. Impact of COVID-19 Prevention Measures on Health Service Quality, Perceived Value and User Satisfaction. A Structural Equation Modelling (SEM) Approach. Aten. Primaria 2022, 54, 102178. [Google Scholar] [CrossRef]
  29. Westbrook, R.A.; Oliver, R.L. The Dimensionality of Consumption Emotion Patterns and Consumer Satisfaction. J. Consum. Res. 1991, 18, 84–91. [Google Scholar] [CrossRef]
  30. Ware, J.E.J. Scales for Measuring General Health Perceptions. Health Serv. Res. 1976, 11, 396–415. [Google Scholar] [PubMed]
  31. Kotler, P.; Keller, K.L. Marketing Management, 12th ed.; Pearson: London, UK, 2006. [Google Scholar]
  32. Bearden, W.O.; Teel, J.E. Selected Determinants of Consumer Satisfaction and Complaint Reports. J. Mark. Res. 1983, 20, 21–28. [Google Scholar] [CrossRef]
  33. Engel, J.F.; Blackwell, R.W.; Miniard, P.W. Consumer Behavior; Dreyden Press: New York, NY, USA, 1993; pp. 1–9. [Google Scholar]
  34. Kim, S.H.; Oh, S.H. The Determinants of Repurchase Intentions in the Service Industry; Customer Satisfaction, Switching Costs, and Attractiveness of Alternatives. Korean J. Mark. 2002, 17, 25–55. [Google Scholar]
  35. Bitner, M.J. Evaluating Service Encounters: The Effects of Physical Surroundings and Employee Responses. J. Mark. 1990, 54, 69–82. [Google Scholar] [CrossRef]
  36. Woodside, A.G.; Frey, L.L.; Daly, R.T. Linking Service Quality, Customer Satisfaction, and Behavioral Intention. J. Health Care Mark. 1989, 9, 5–17. [Google Scholar] [PubMed]
  37. Kim, J. The Customer Experience of Railway Service during the COVID-19 Period. J. CEO Manag. Stud. 2021, 24, 255–268. [Google Scholar] [CrossRef]
  38. Lee, K.-S.; Yoo, Y.-H. The Effects of Quarantine Hygiene Activity in the Relationship among Service Quality, Perceived Value and Behavioral Intention in the Airline Business under the COVID-19 Pandemic Situation. J. Tour. Leis. Res. 2021, 33, 319–338. [Google Scholar] [CrossRef]
  39. Ware, J.E.; Hays, R. Method Formeasuring Patientsatisfaction Withspecificmedicalencounters. Med. Care 1988, 26, 393–402. [Google Scholar] [CrossRef]
  40. Dodds, W.; Monroe, K.; Grewal, D. Effect of Price, Brand and Store Informationon Subjective Product Evaluations. Adv. Consum. Res. 1991, 12, 85–90. [Google Scholar]
  41. Yi, Y. A Critical Review of Consumer Satisfaction. Rev. Mark. 1990, 4, 68–123. [Google Scholar]
  42. Fornell, C.; Larcker, D.F. Evaluating Structural Equation Models with Unobservable Variables and Measurement Error. J. Mark. Res. 1981, 18, 39–50. [Google Scholar] [CrossRef]
  43. Tenenhaus, M.; Vinzi, V.E.; Chatelin, Y.M.; Lauro, C. PLS Path Modeling. Comput. Stat. Data Anal. 2005, 48, 159–205. [Google Scholar] [CrossRef]
  44. Kim, G. Easy SEM with Smart PLS; Chungram: Seoul, Republic of Korea, 2013. [Google Scholar]
  45. Zeithaml, V.A.; Berry, L.L.; Parasuraman, A. The Behavioral Consequences of Service Quality. J. Mark. 1996, 60, 31–46. [Google Scholar] [CrossRef]
  46. Kim, Y.S. Last Year, the Number of Foreign Patients Increased by 24.6%. Partial Recovery in the Second Year of COVID-19. Yeonhap. June 2022. Available online: https://www.yna.co.kr/view/AKR2022062601500053 (accessed on 29 September 2022).
Table 1. Operation Definition and Measurement Items of Variables.
VariableOperation DefinitionMeasurement ItemsPrevious Study
TangiblesAppearance of physical facilities, equipment, and employeesHospital has modern-looking equipment/Hospital’s physical facilities are visually appealing/Employees look neat/Visual materials are easy to understandSERVQUAL model
[6,13,20]
ReliabilityAbility to perform the promised service dependably and accuratelyPromises to perform something by a certain time and does so/Shows a sincere interest in solving problem/Performs the service right the first time/Provides services at the promised time/Manages records safely
ResponsivenessWillingness to help customers and provide rapid prompt servicesTells exactly when services will be performed/Gives prompt service/Willing to help you/Responds quickly to the request
AssuranceKnowledge and courtesy of employees and their ability to communicate confidenceBehavior of employees gives confidence in customers/Feels confident in transactions with hospital/Employees are friendly/Employees have the knowledge to answer the questions
EmpathyCare and individual attention provided to customersGives individual attention/Operating hours are convenient to customers/Employees give personal attention/Has best interests at heart/Employees understand specific needs
COVID-19 regulationsOverall customer perception of COVID-19 prevention activitiesSanitary conditions of hospital facilities are well managed/Social distancing in hospitals is well managed/When entering the hospital, body temperature and possible COVID-19 symptoms are monitored and hand sanitizer is recommended/Information on COVID-19 regulations in hospitals can be easily found[27,37,38]
Customer satisfactionEvaluation of overall services perceived using medical servicesMedical staff informs well of treatment procedures and contents/Satisfied with medical service of the medical staff/ Satisfied with the administrative services/Satisfied with the hospital’s medical equipment and facilities/Generally satisfied with the services[36,39]
Revisit intentionThe extent to which consumers are able to reuse medical servicesWill continue to use this hospital even if it is more expensive than other hospitals/Willing to recommend this hospital to people around me/Willing to visit this hospital when another disease occurs[35,36,40,41]
Table 2. Demographic Factors of the Respondents (N=201).
VariablesFrequencyVariablesFrequency
GenderMale117 (58.2%)AgeBelow 208 (4.0%)
Female84 (41.8%)20–29166 (82.6%)
Nationality Nepalese57 (28.4%)30–3923 (11.4%)
Indonesian35 (17.4%)Above 404 (2.0%)
Vietnamese7 (3.5%)Education LevelBachelor134 (66.7%)
Chinese11 (5.5%)Master’s55 (27.4%)
Indian8 (4%)PhD12 (6.0%)
Uzbek13 (6.5%)OccupationOffice worker5 (2.5%)
Bangladeshi46 (22.9%)Student184 (91.5%)
British5 (2.5%)Professor7 (3.5%)
Other19 (9.5%)Other5 (2.5%)
DepartmentInternal Medicine81 (40.3%)Hospital TypeClinic83 (41.3%)
General Surgery22 (10.9%)General Hospital98 (48.8%)
Orthopedic Surgery9 (4.5%)University Hospital18 (9%)
Obstetrics and Gynecology9 (4.5%)Other2 (1%)
Ophthalmology8 (4.0%)Last Visitless than a month ago47 (23.4%)
Psychiatry5 (2.5%)1 month to 6 months ago95 (47.3%)
Ear, Nose, and Throat9 (4.5%)6 months to 1 year ago34 (16.9%)
Dermatology8 (4.0%)1 to 2 years ago19 (9.5%)
Dentist27 (13.4%)more than 2 years ago6 (3.0%)
Medical checkup10 (5.0%)CityBusan179 (89.1%)
Vaccination7 (3.5%) Seoul10 (5.0%)
Other6 (3.0%) Other12 (6.0%)
Table 3. Validity and Reliability Test.
ConstructsItemLoading VIF CRAVECronbach’s α
T10.791.590.830.560.73
TangiblesT20.801.66
T30.741.30
T40.651.22
Rb10.791.890.910.660.87
Rb20.791.91
ReliabilityRb30.862.55
Rb40.842.40
Rb50.761.76
Rp10.852.110.880.660.83
ResponsivenessRp20.791.86
Rp30.821.82
Rp40.771.65
A10.862.070.890.670.84
AssuranceA20.781.66
A30.811.90
A40.821.81
E10.802.050.890.620.85
E20.721.70
EmpathyE30.812.03
E40.801.90
E50.801.98
CO10.831.830.890.670.83
COVID-19CO20.711.49
RegulationsCO30.892.40
CO40.842.00
Note. VIF (Variance Inflation Factor), CR (Composite Reliability), and AVE (Average Variance Extracted).
Table 4. Discriminant Validity (Fornell–Larcker criterion).
ACOERbRpT
A0.82
CO0.650.71
E0.730.530.79
Rb0.670.600.600.81
Rp0.730.570.660.730.81
T0.620.630.590.620.590.74
Note. Values in bold represent the square root of the average variance extracted (AVE), and the values outside the diagonal represent the correlations between the constructs.
Table 5. Discriminant Validity (Cross-Loadings).
ItemsACOERbRpT
A10.860.550.630.600.620.52
A20.780.470.530.560.620.50
A30.810.430.580.490.580.45
A40.820.480.630.530.570.55
CO10.540.830.510.540.540.58
CO20.390.710.370.270.330.43
CO30.500.890.470.580.520.58
CO40.490.840.390.520.440.44
E10.620.410.800.500.520.52
E20.610.420.720.510.560.51
E30.500.380.810.460.490.40
E40.520.380.800.450.510.42
E50.610.500.800.460.540.49
Rb20.590.420.530.790.670.53
Rb30.560.550.490.860.620.52
Rb40.530.460.470.840.570.51
Rb50.560.530.400.760.550.51
Rp10.610.470.530.610.850.49
Rp20.550.430.490.540.790.46
Rp30.610.550.560.650.820.47
Rp40.600.390.570.550.770.49
T20.500.450.480.440.450.80
T30.450.510.420.560.440.74
T40.440.380.350.340.380.65
T10.470.510.500.480.460.79
Table 6. Results of the Hypothesis Test.
HypothesisVariablesPath CoefficientsSTEDt-Statisticsp-ValueResults
H1-1T->CS0.060.061.020.31NS
H1-2Rb->CS0.170.072.470.01S
H1-3Rp->CS0.200.082.450.01S
H1-4A->CS−0.060.090.600.55NS
H1-5E->CS0.300.074.09<0.001S
H1-6CO->CS0.330.065.52<0.001S
H2CS->RI0.710.0417.22<0.001S
Note. S—Supported, NS—Not supported.
Table 7. ANOVA—Nationality (MEAN ± SD).
M_CSM_TM_RbM_RpM_AM_EM_COM_RI
Nepal3.88 ± 0.583.85 ± 0.53.94 ± 0.533.79 ± 0.513.63 ± 0.59 a3.42 ± 0.59 a3.97 ± 0.663.64 ± 0.63
Indonesia3.88 ± 0.514 ± 0.503.94 ± 0.553.86 ± 0.593.85 ± 0.74 ab3.59 ± 0.54 a4.15 ± 0.603.53 ± 0.51
Vietnam4.37 ± 0.353.93 ± 0.194.17 ± 0.414.21 ± 0.344.04 ± 0.39 ab3.89 ± 0.50 ab4.32 ± 0.403.95 ± 0.45
China4.20 ± 0.734.11 ± 0.444.13 ± 0.684.07 ± 0.574.09 ± 0.66 ab3.75 ± 0.76 ab4.16 ± 0.623.88 ± 0.73
India3.70 ± 0.963.59 ± 0.723.78 ± 1.23.66 ± 0.573.84 ± 0.98 ab3.65 ± 0.8 a3.69 ± 0.883.38 ± 0.95
Uzbek4.15 ± 0.854.13 ± 0.554.06 ± 0.574.12 ± 0.654.31 ± 0.57 b3.92 ± 0.74 ab4.13 ± 0.663.85 ± 0.96
Bangladesh3.75 ± 0.683.71 ± 0.653.87 ± 0.763.74 ± 0.743.71 ± 0.64 ab3.47 ± 0.73 a3.89 ± 0.753.52 ± 0.76
UK4.28 ± 0.364.00 ± 0.564.40 ± 0.354.4 ± 0.634.15 ± 0.45 ab4.28 ± 0.33 b3.5 ± 0.594.2 ± 0.3
Other3.78 ± 0.853.78 ± 0.673.84 ± 0.654.00 ± 0.563.91 ± 0.75 ab3.75 ± 0.79 ab3.88 ± 0.743.51 ± 0.91
Total3.9 ± 0.673.87 ± 0.573.95 ± 0.643.87 ± 0.613.82 ± 0.67 ab3.59 ± 0.67 ab3.99 ± 0.683.62 ± 0.71
F-value1.6581.6830.7861.8202.193 *2.145 *1.3231.324
* p < 0.05, Duncan’s multiple range test a < b.
Table 8. ANOVA—Medical Department (MEAN ± SD).
M_CSM_TM_RbM_RpM_AM_EM_COM_RI
Internal Medicine3.79 ± 0.63 abc3.78 ± 0.63.86 ± 0.58 ab3.8 ± 0.543.74 ± 0.633.49 ± 0.633.9 ± 0.64 abc3.64 ± 0.71
General Surgery3.74 ± 0.5 abc3.75 ± 0.543.66 ± 0.66 a3.67 ± 0.813.61 ± 0.593.61 ± 0.613.65 ± 0.58 ab3.47 ± 0.65
Orthopedic Surgery4.02 ± 0.72 bc3.75 ± 0.544.07 ± 0.75 ab3.83 ± 0.573.83 ± 0.63.58 ± 0.723.97 ± 0.64 abc3.63 ± 0.54
Obstetrics and Gynecology4.22 ± 0.49 bc3.92 ± 0.44.2 ± 0.66 ab4.06 ± 0.613.92 ± 0.713.51 ± 0.634.14 ± 0.6 bc3.81 ± 0.63
Ophthalmology4.13 ± 0.98 bc3.94 ± 0.923.8 ± 0.89 ab4.19 ± 0.823.97 ± 0.973.88 ± 0.973.94 ± 1.05 abc3.92 ± 0.97
Psychiatry4.28 ± 0.39 bc4 ± 0.594.24 ± 0.65 ab4.25 ± 0.613.9 ± 0.843.72 ± 0.644.5 ± 0.61 c3.87 ± 0.69
Ear, Nose, and Throat4.42 ± 0.44 c4.17 ± 0.524.44 ± 0.31 b4.36 ± 0.384.39 ± 0.384.11 ± 0.694.42 ± 0.53 c4.04 ± 0.63
Dermatology3.68 ± 0.93 ab4 ± 0.713.68 ± 1.11 a3.53 ± 0.753.56 ± 1.123.43 ± 1.084.13 ± 0.95 bc3.67 ± 0.96
Dentist3.88 ± 0.71 abc3.98 ± 0.394.05 ± 0.53 ab3.9 ± 0.593.88 ± 0.633.67 ± 0.644.18 ± 0.66 bc3.53 ± 0.61
Medical checkup4.12 ± 0.52 bc4.03 ± 0.534.1 ± 0.54 ab4.08 ± 0.544.03 ± 0.743.72 ± 0.554.15 ± 0.71 bc3.63 ± 0.51
Vaccination4.4 ± 0.46 c4.25 ± 0.414.37 ± 0.6 b4.04 ± 0.594 ± 0.63.77 ± 0.524.36 ± 0.45 c3.57 ± 0.85
Other3.23 ± 0.78 a3.5 ± 0.393.83 ± 0.43 ab3.71 ± 0.293.83 ± 0.73.2 ± 0.723.38 ± 0.54 a2.78 ± 0.93
Total3.9 ± 0.673.87 ± 0.573.95 ± 0.643.87 ± 0.613.82 ± 0.673.59 ± 0.673.99 ± 0.683.62 ± 0.71
F-value2.569 *1.3251.935 *1.7771.2081.1642.272 *1.465
* p < 0.05, Duncan’s multiple range test a < b < c.
Disclaimer/Publisher’s Note: The statements, opinions and data contained in all publications are solely those of the individual author(s) and contributor(s) and not of MDPI and/or the editor(s). MDPI and/or the editor(s) disclaim responsibility for any injury to people or property resulting from any ideas, methods, instructions or products referred to in the content.

