
Dynamic Characteristics of Rock Holes with Gravel Sediment Drilled by Bit Anchor Cable Drilling
Abstract
:1. Introduction
2. Research Method
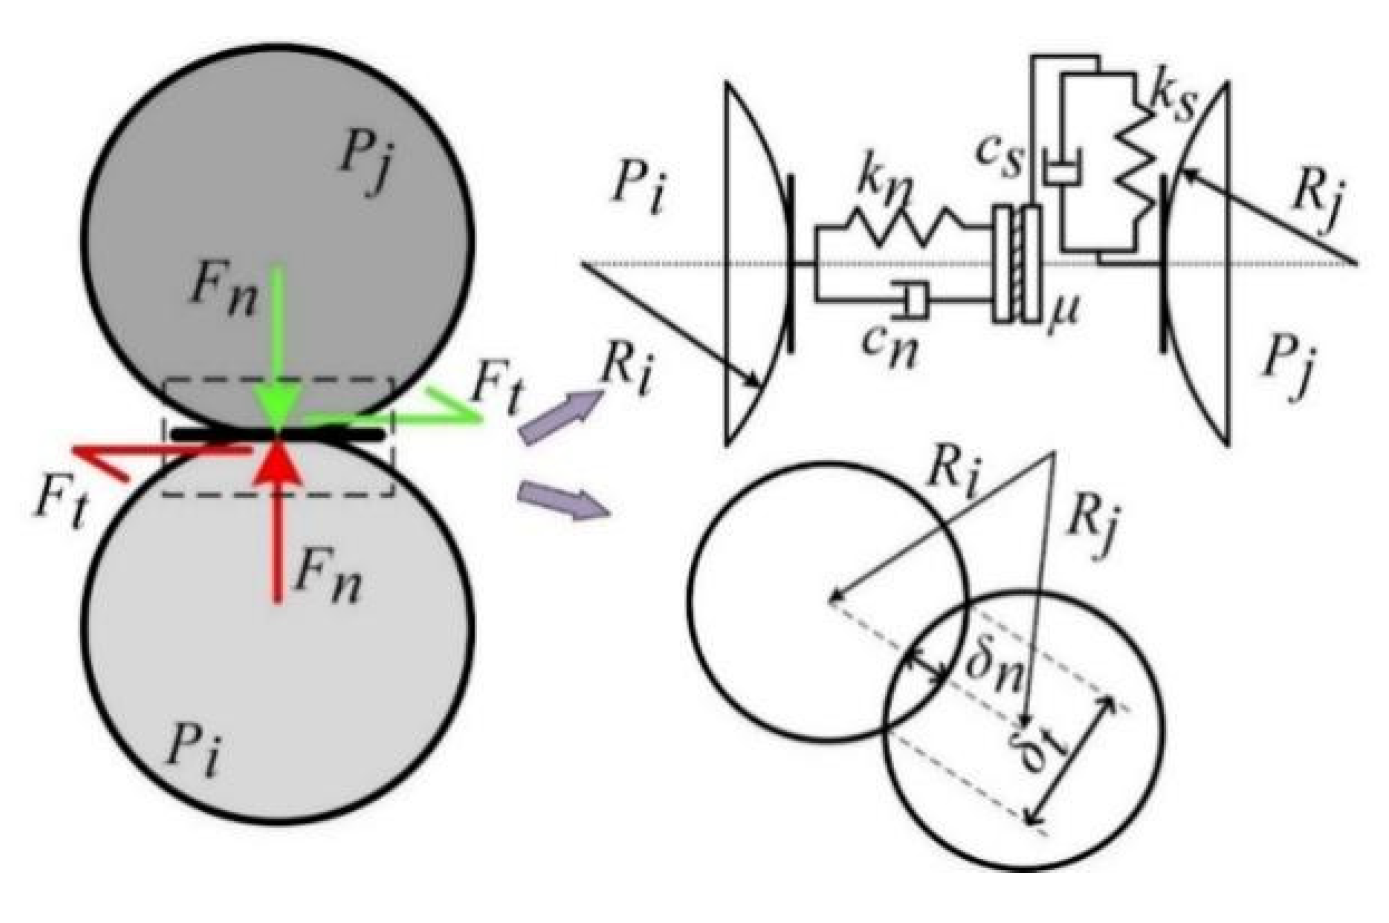
2.1. Contact Model
2.2. DEM Particle Parameters
2.3. Construction Model
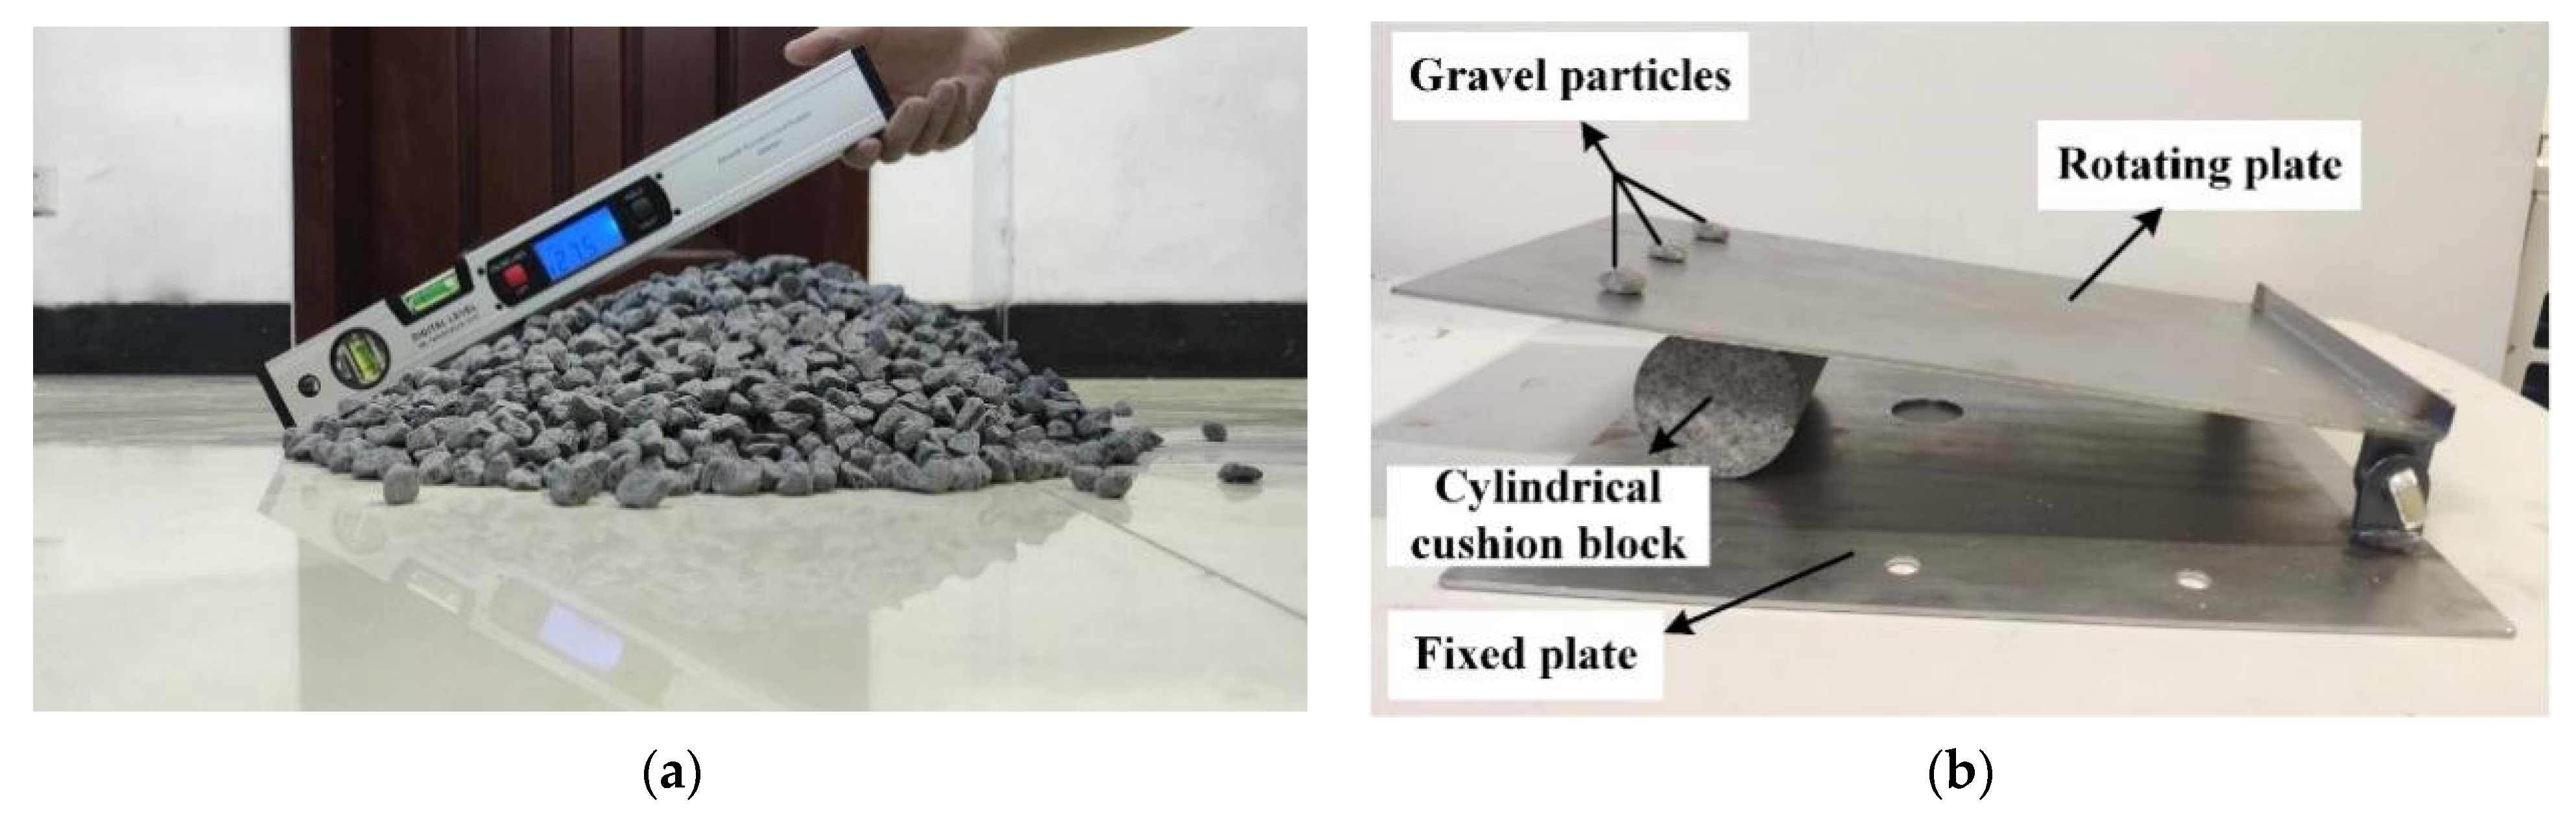
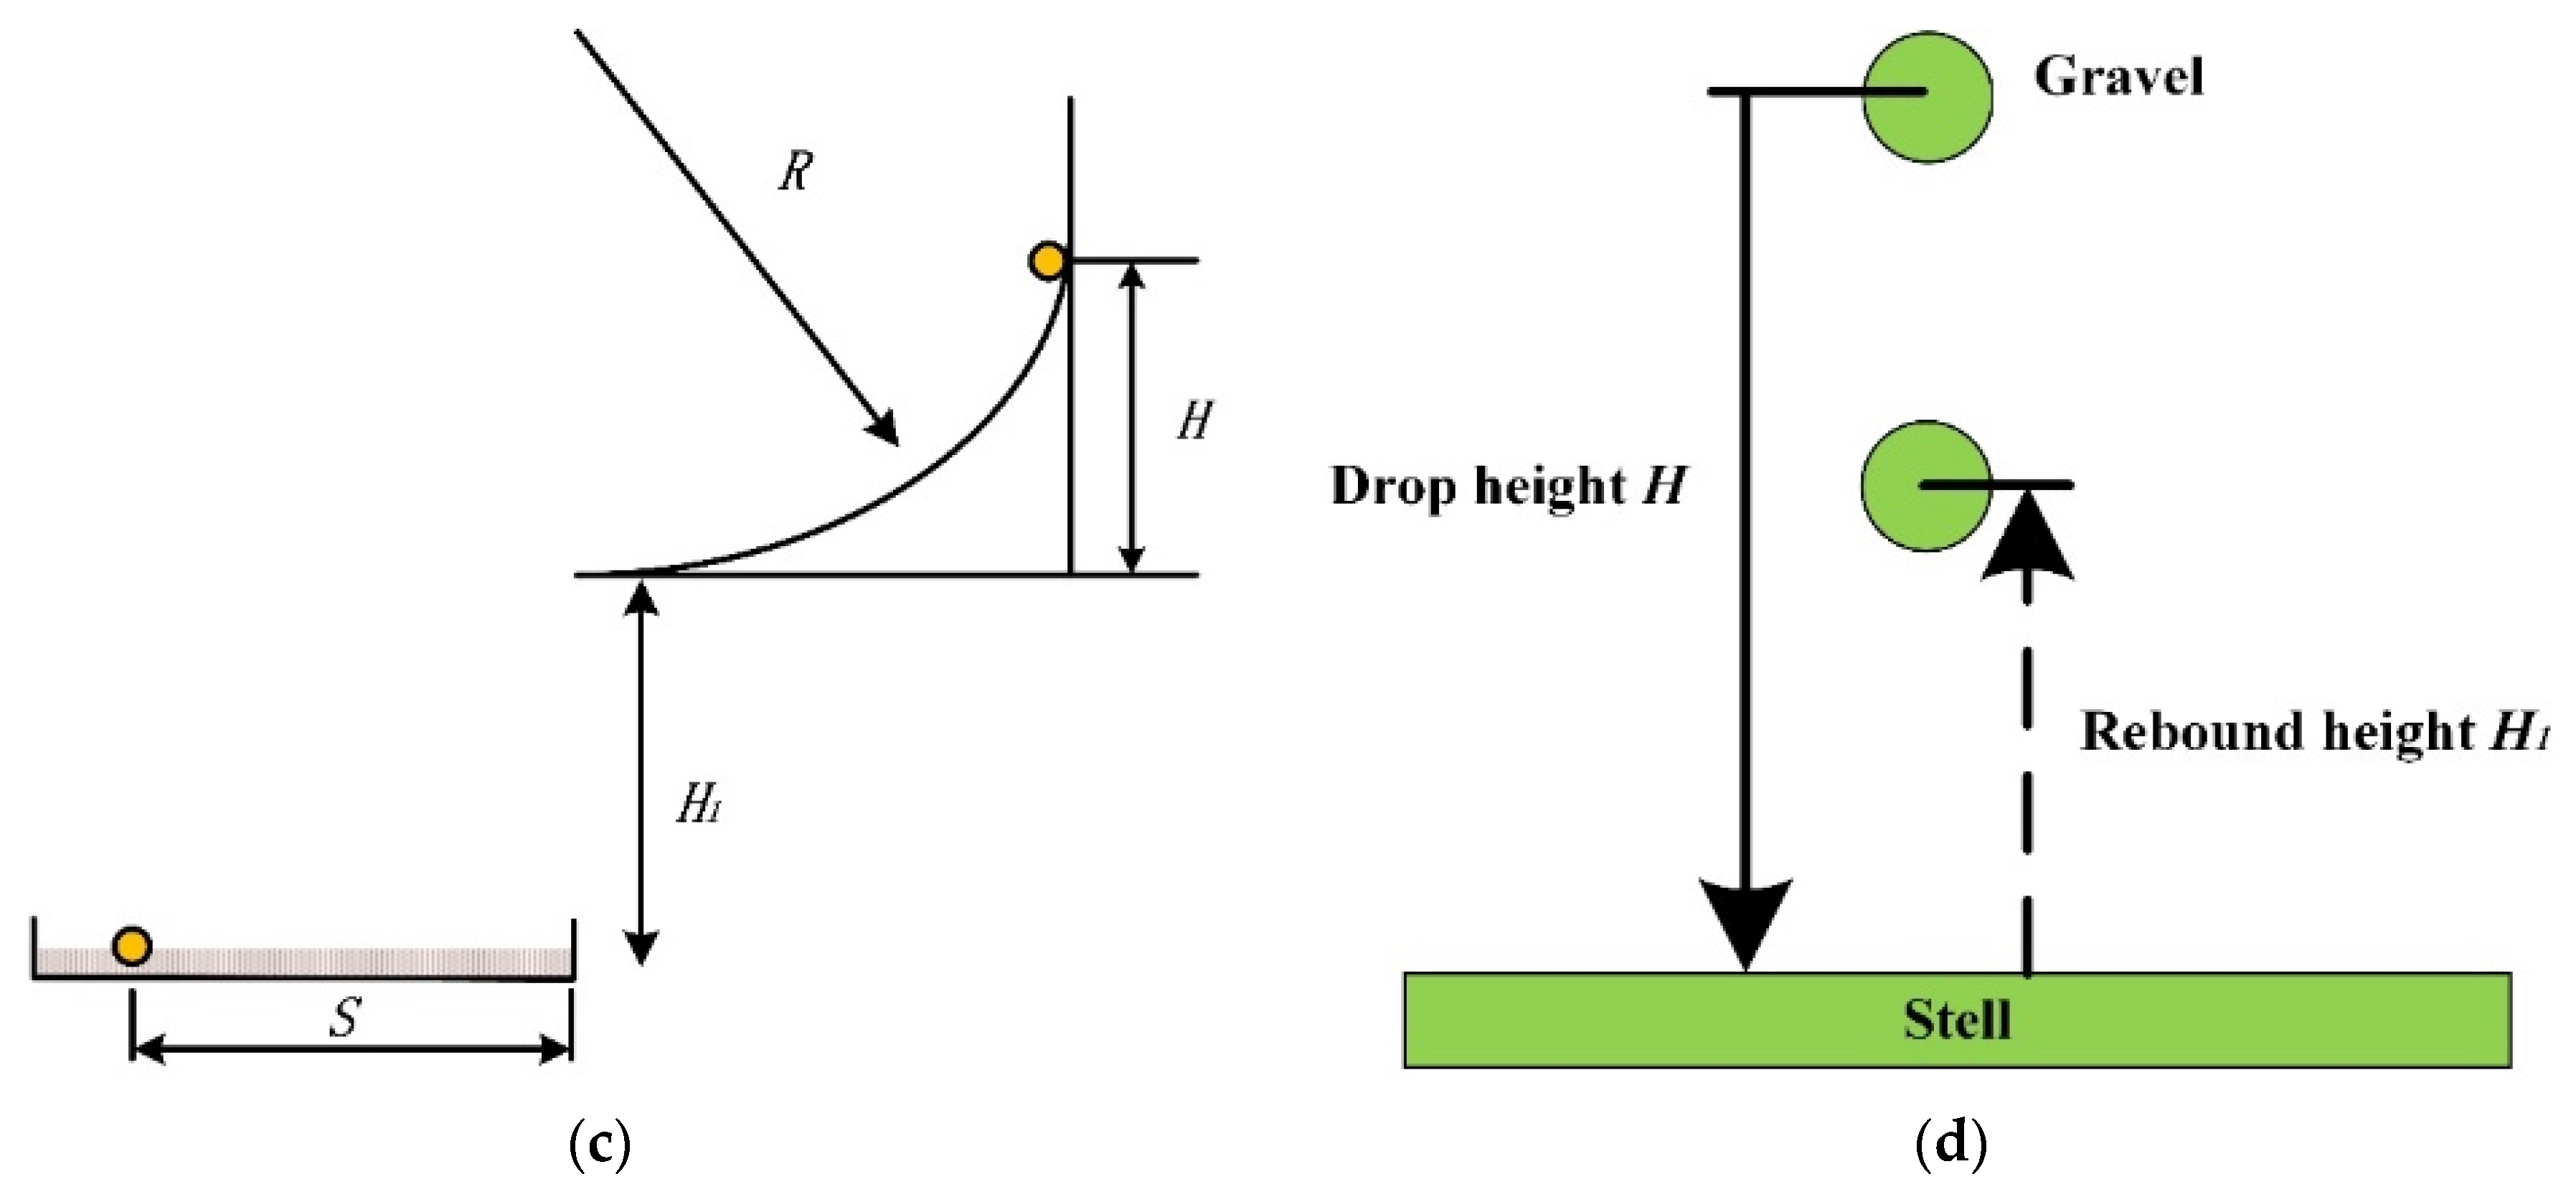
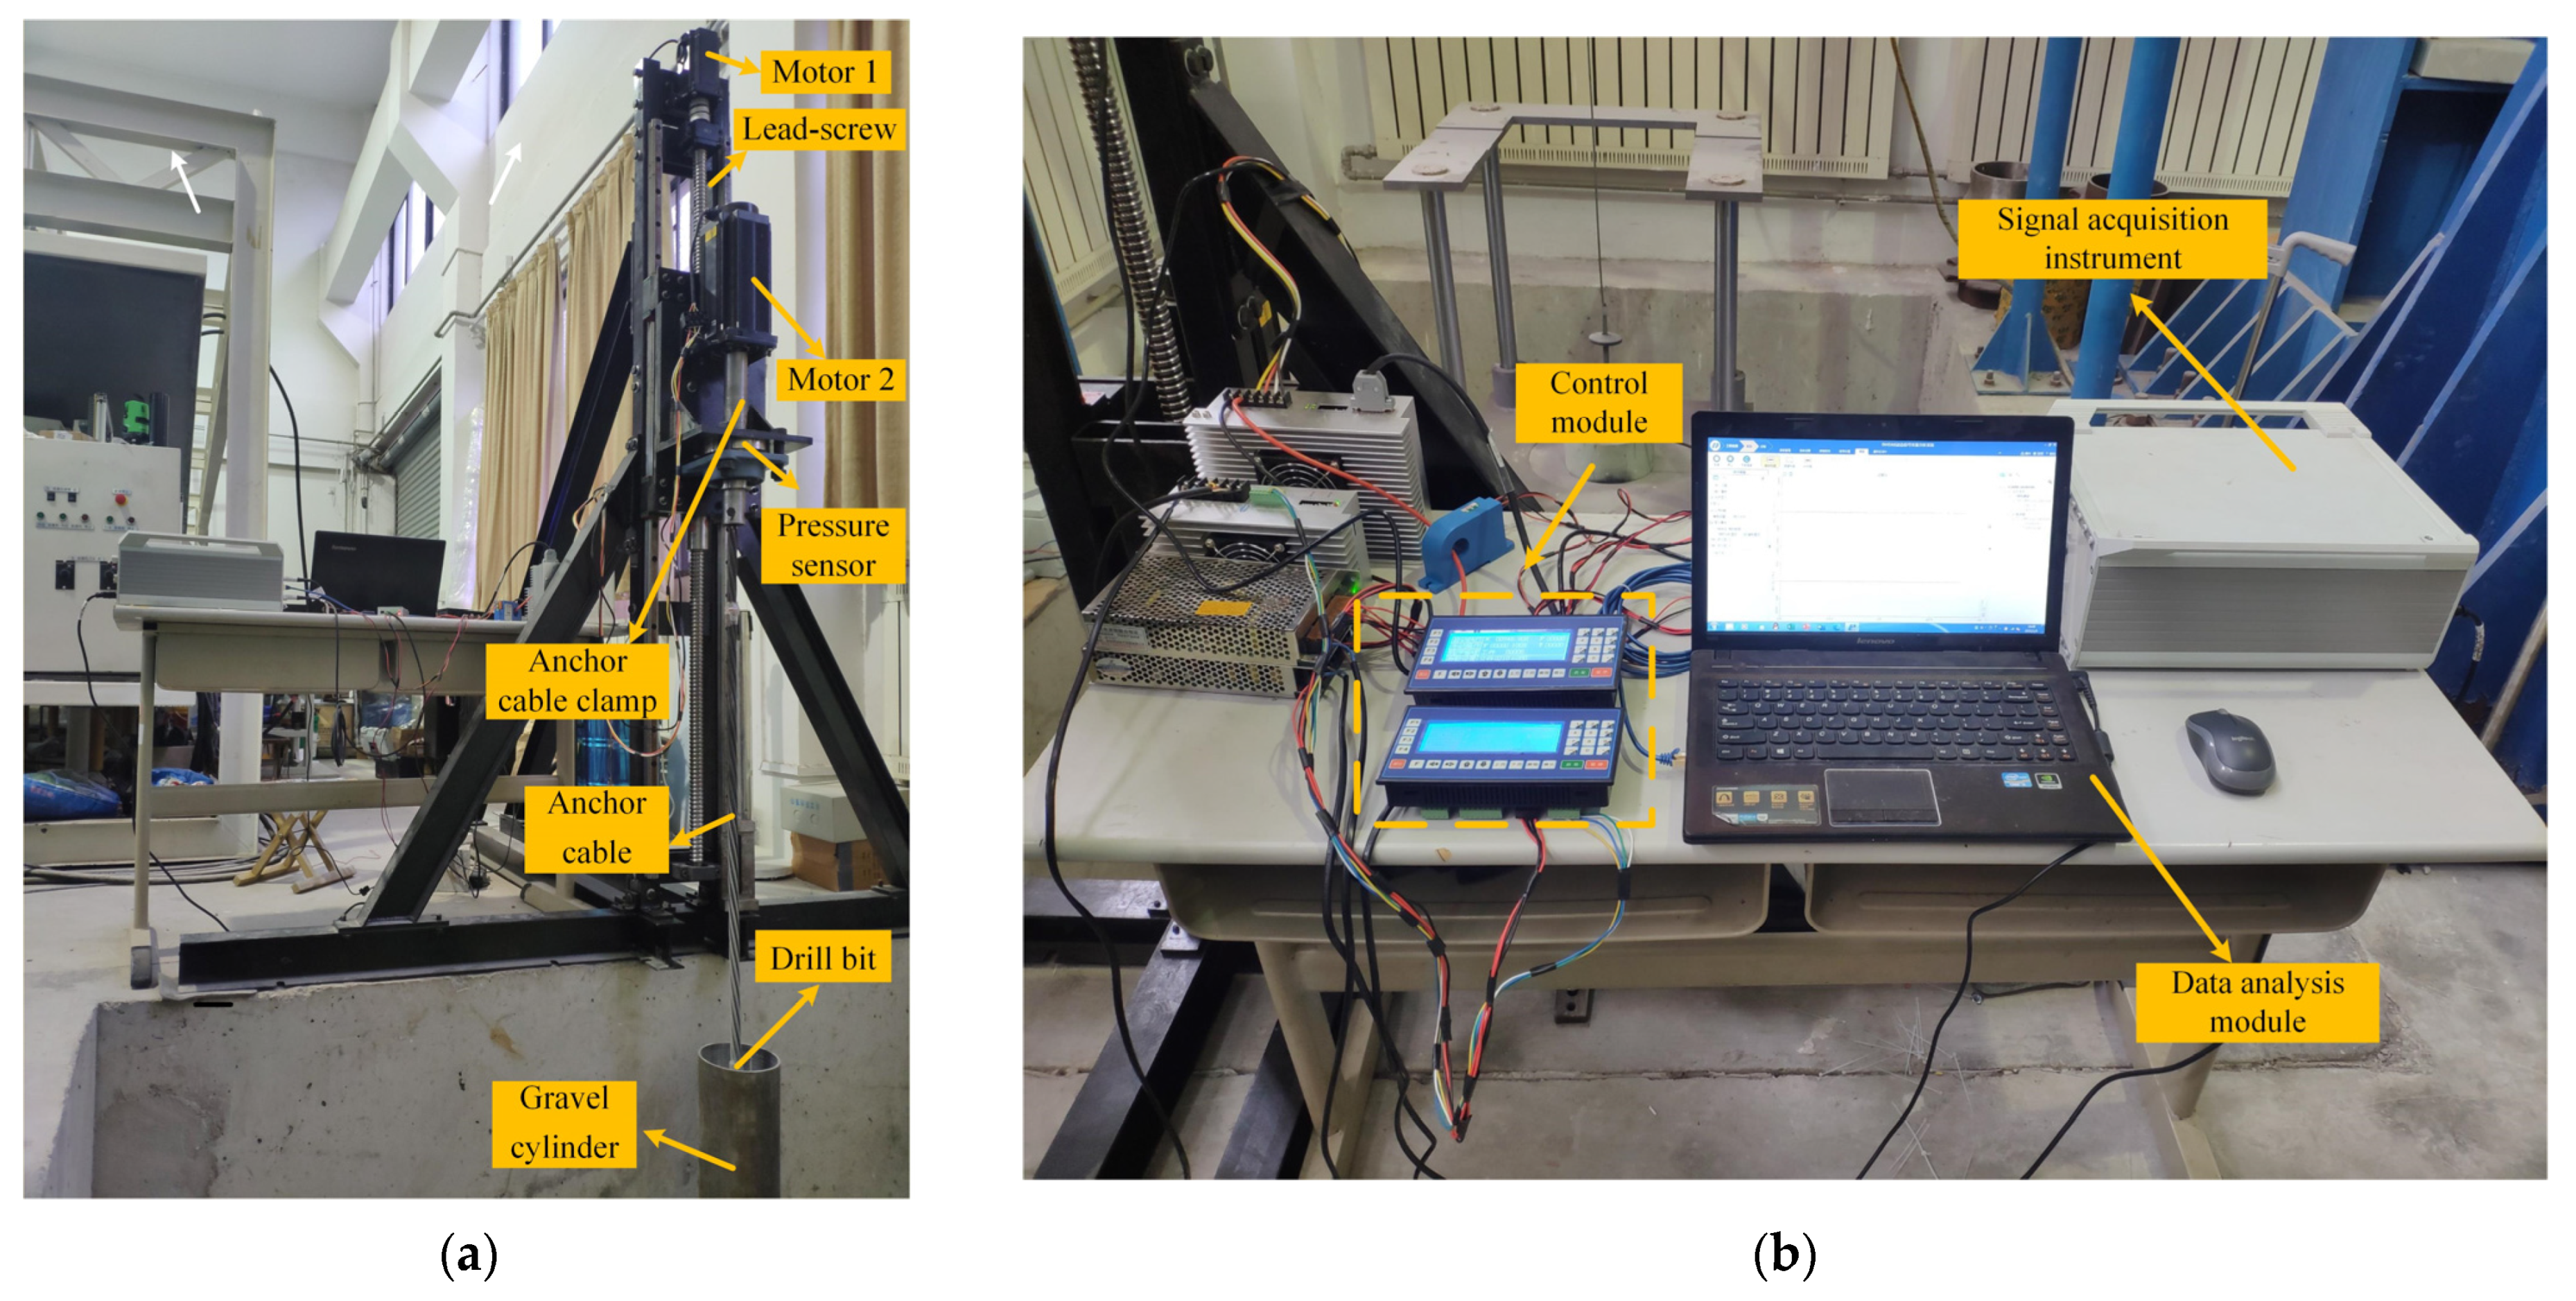
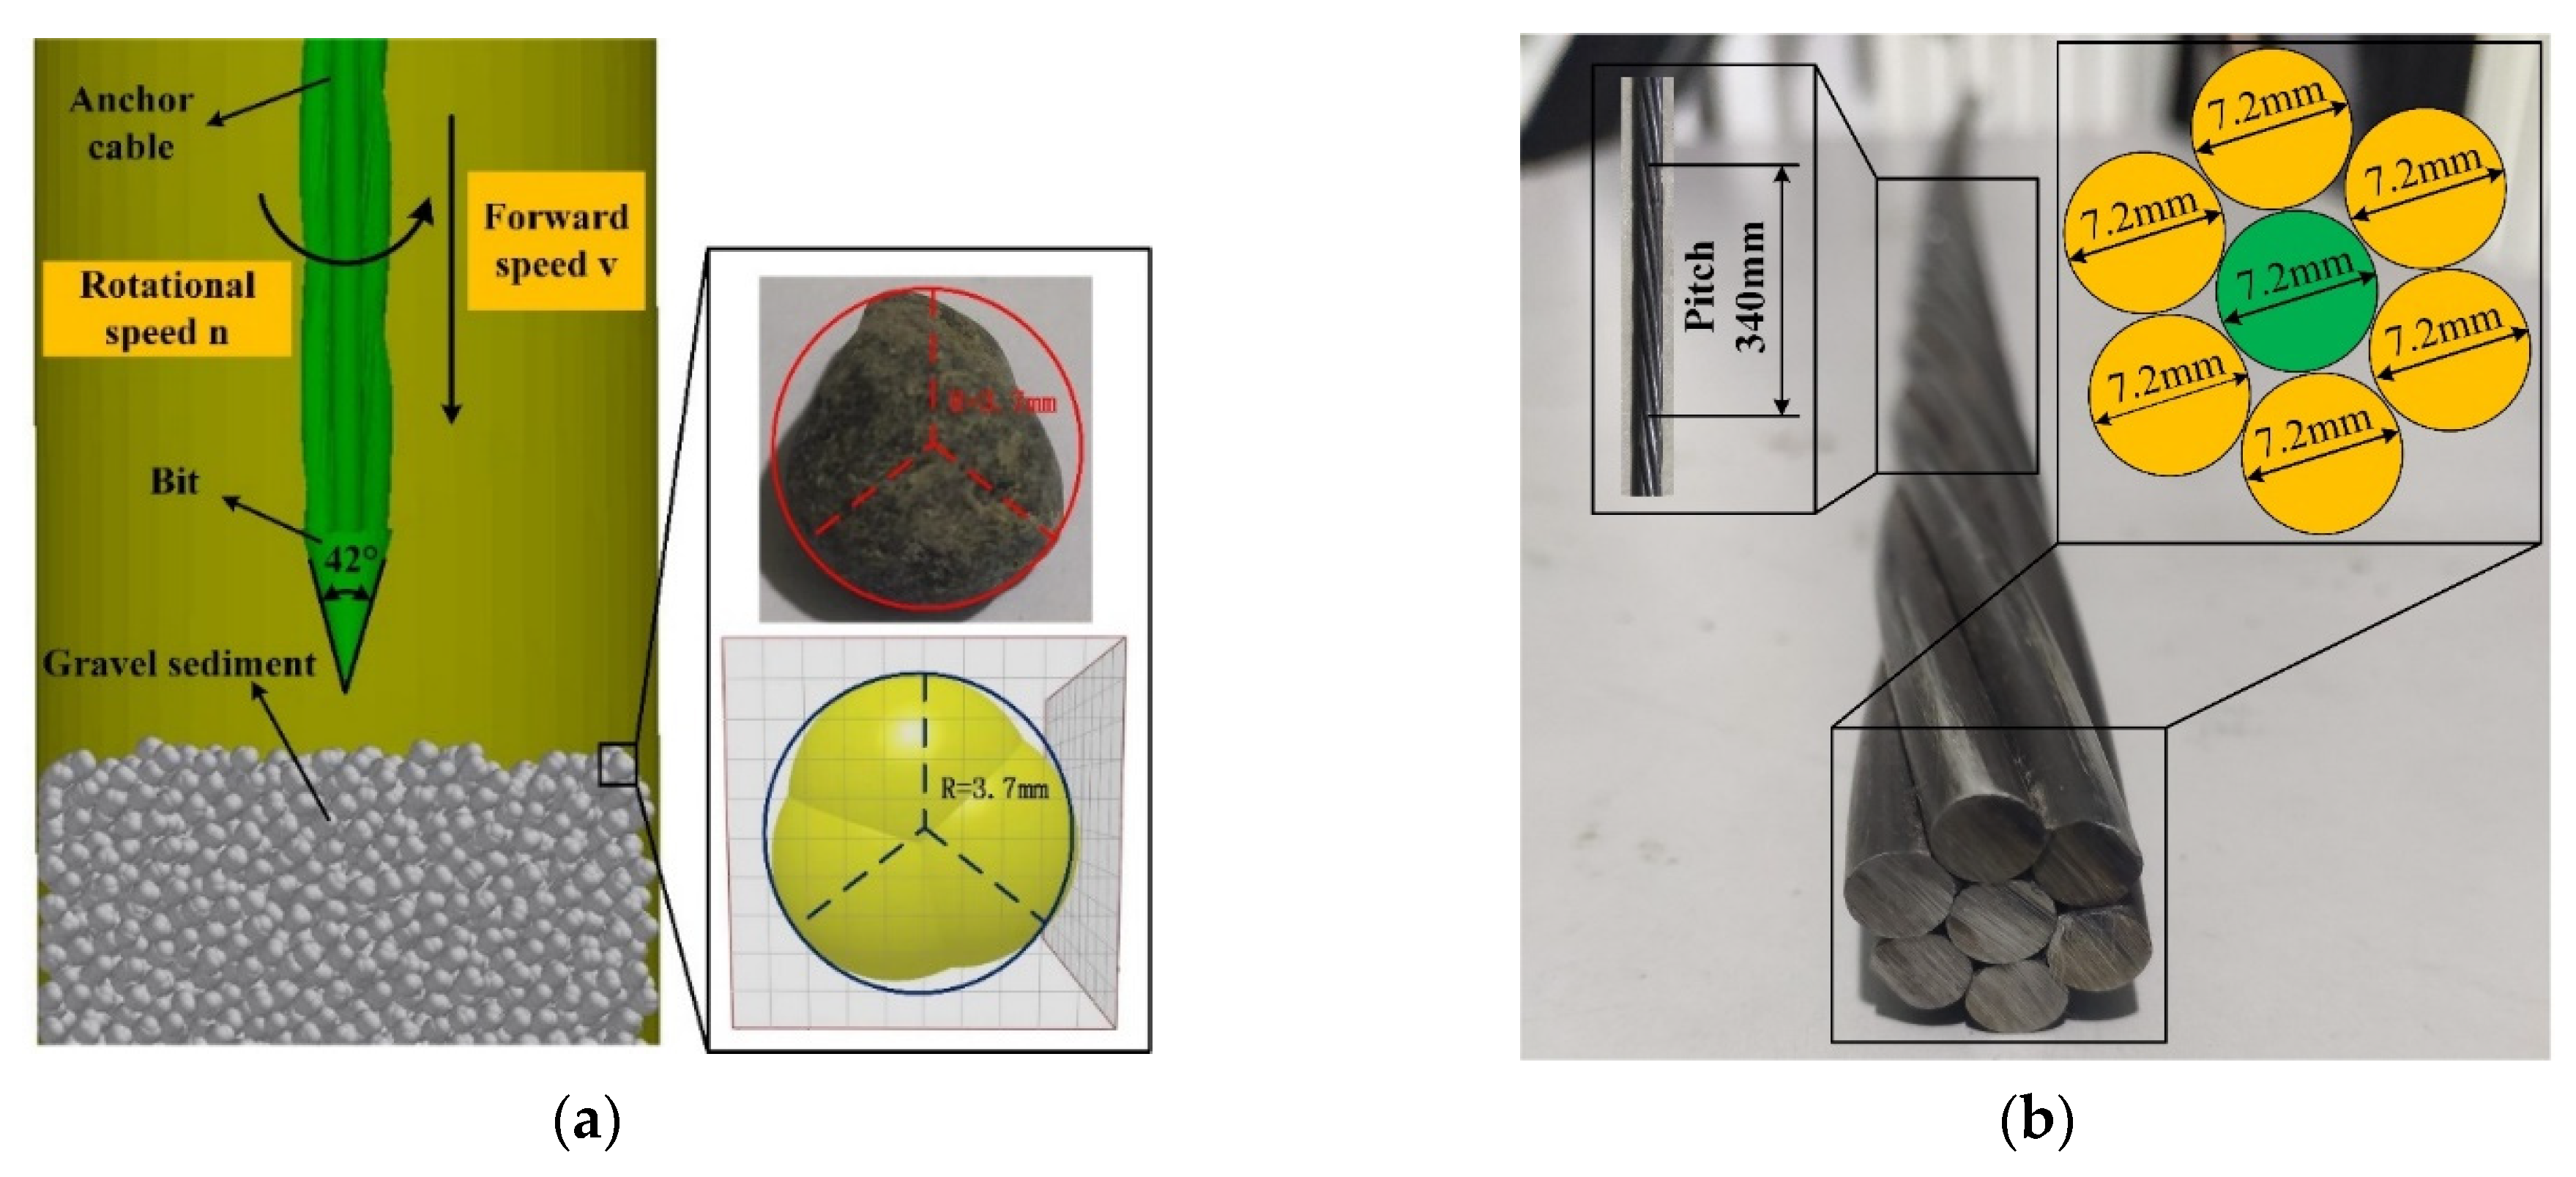
2.3.1. Build A Test-Bed
2.3.2. Simulation Model
2.4. Feasibility Analysis of Bit Anchor Cable Installation Method
2.5. Research Program
3. Results and Discussion
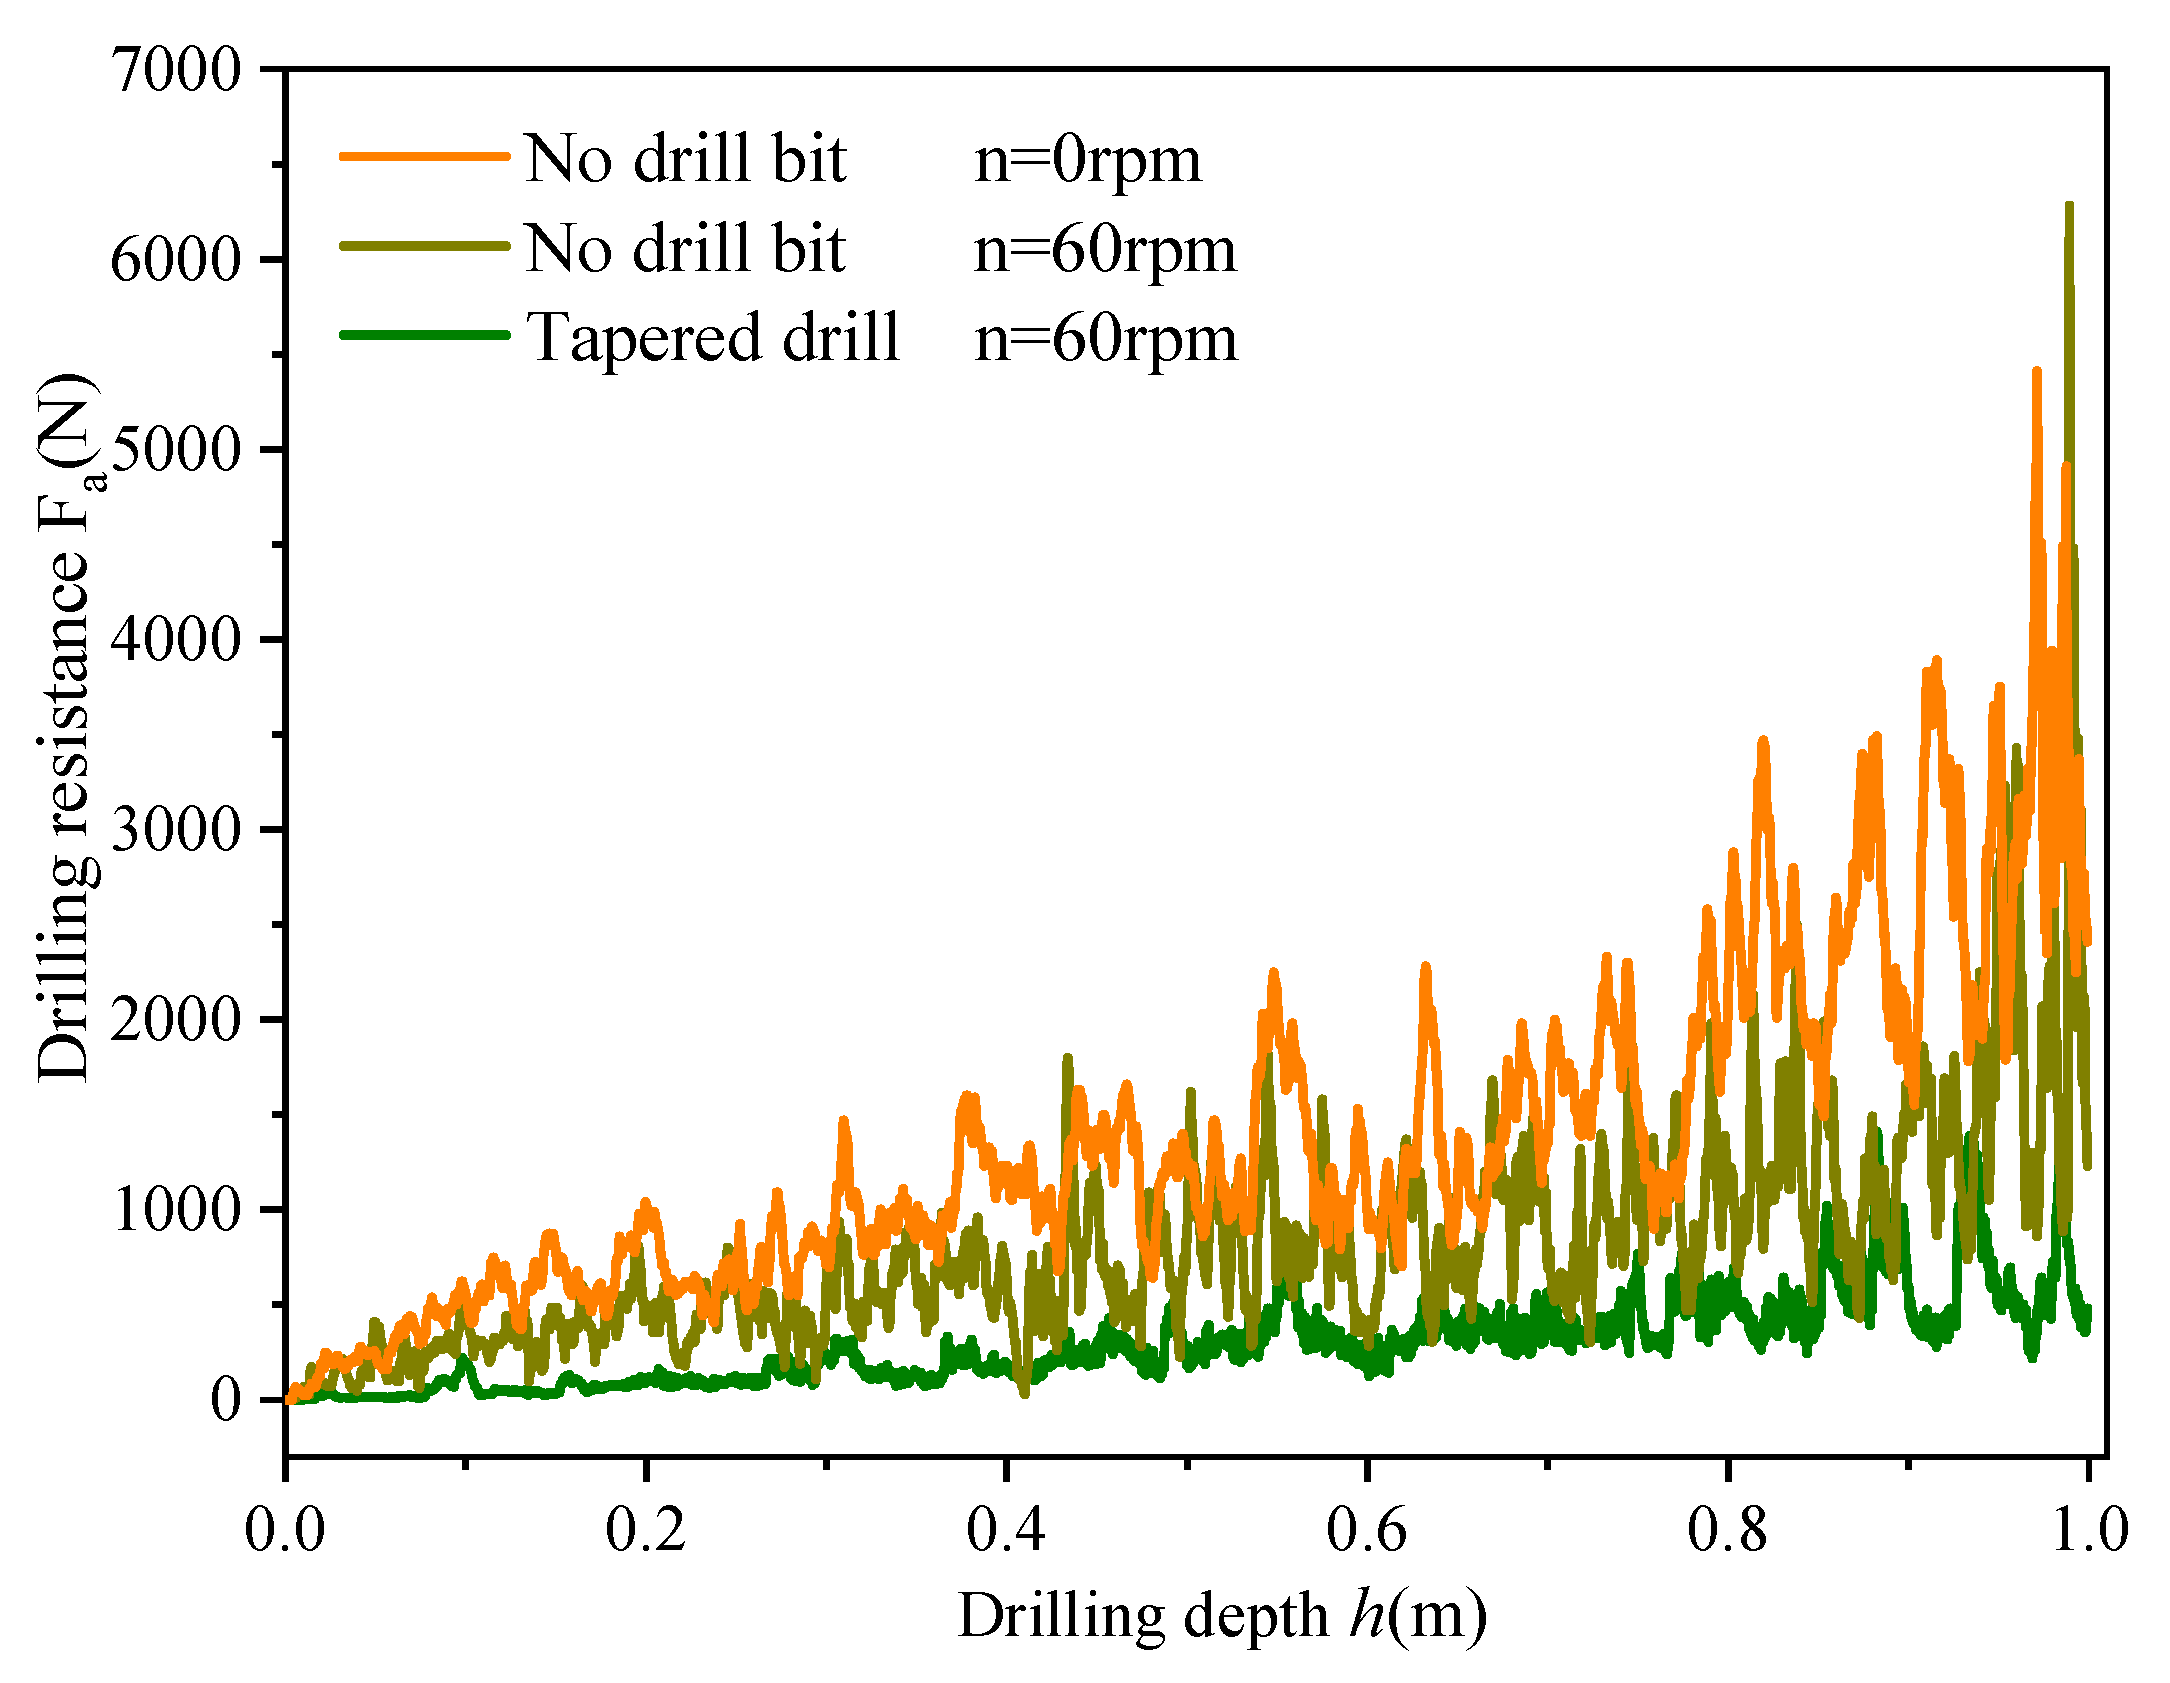
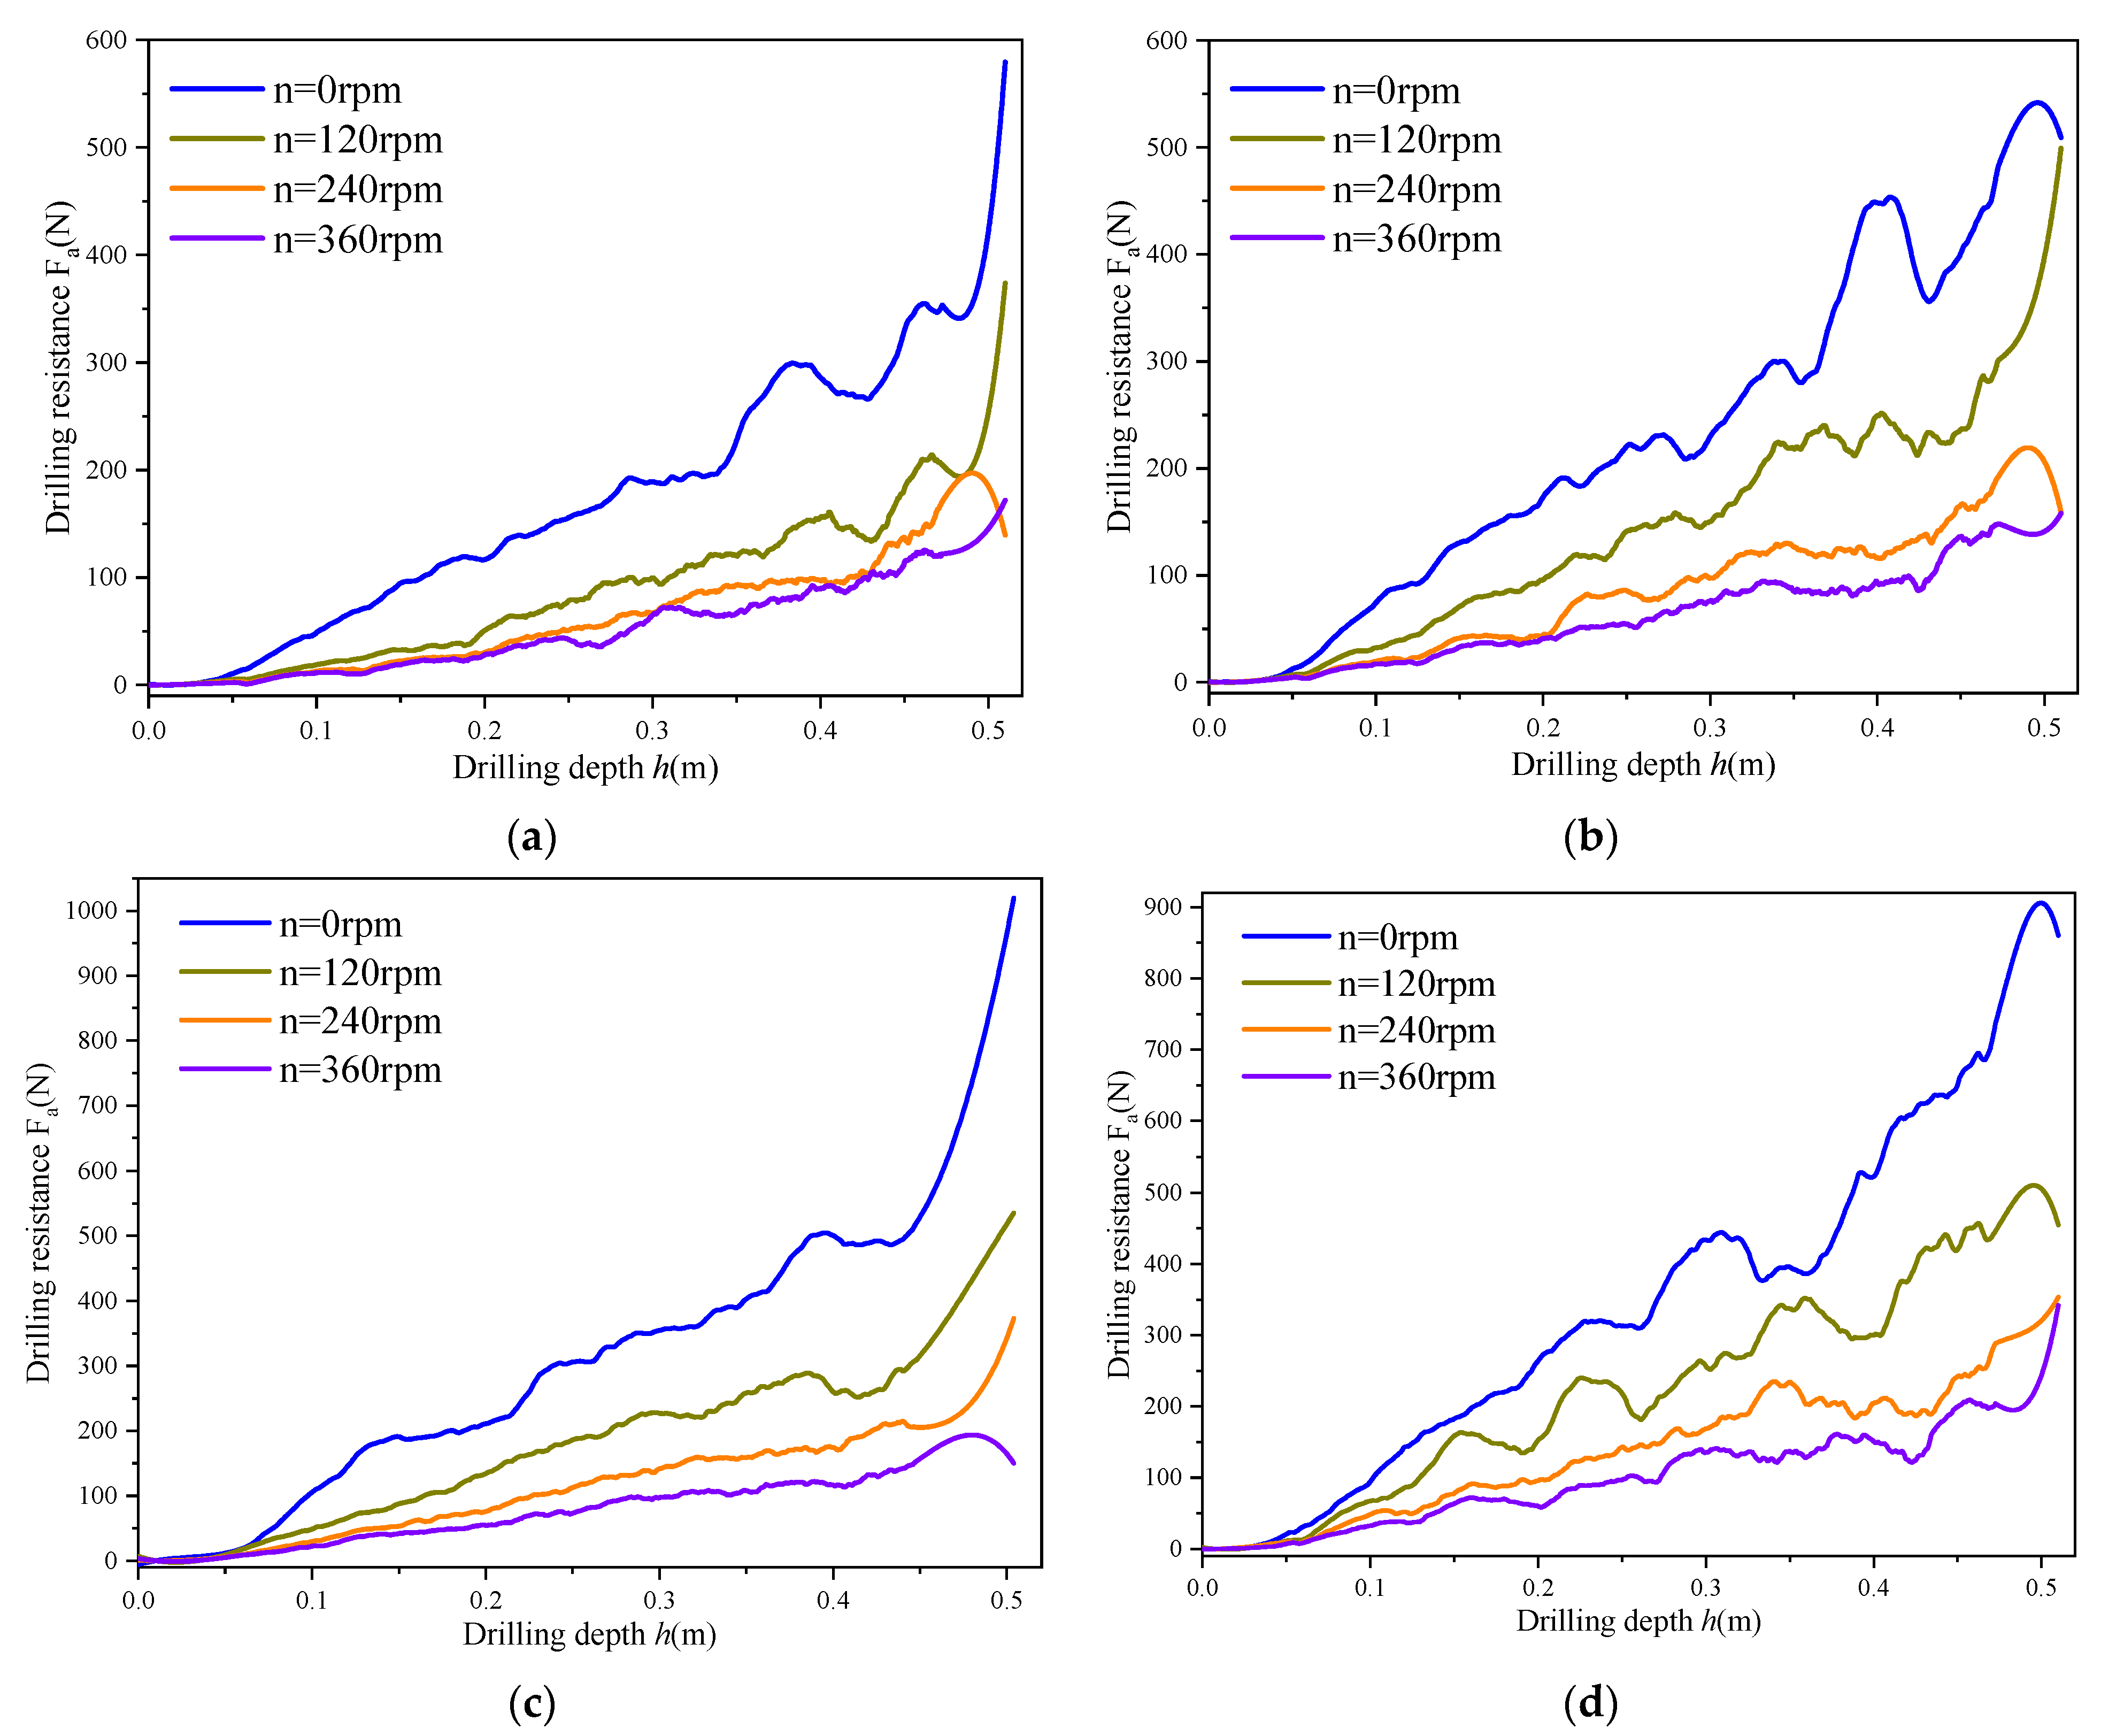
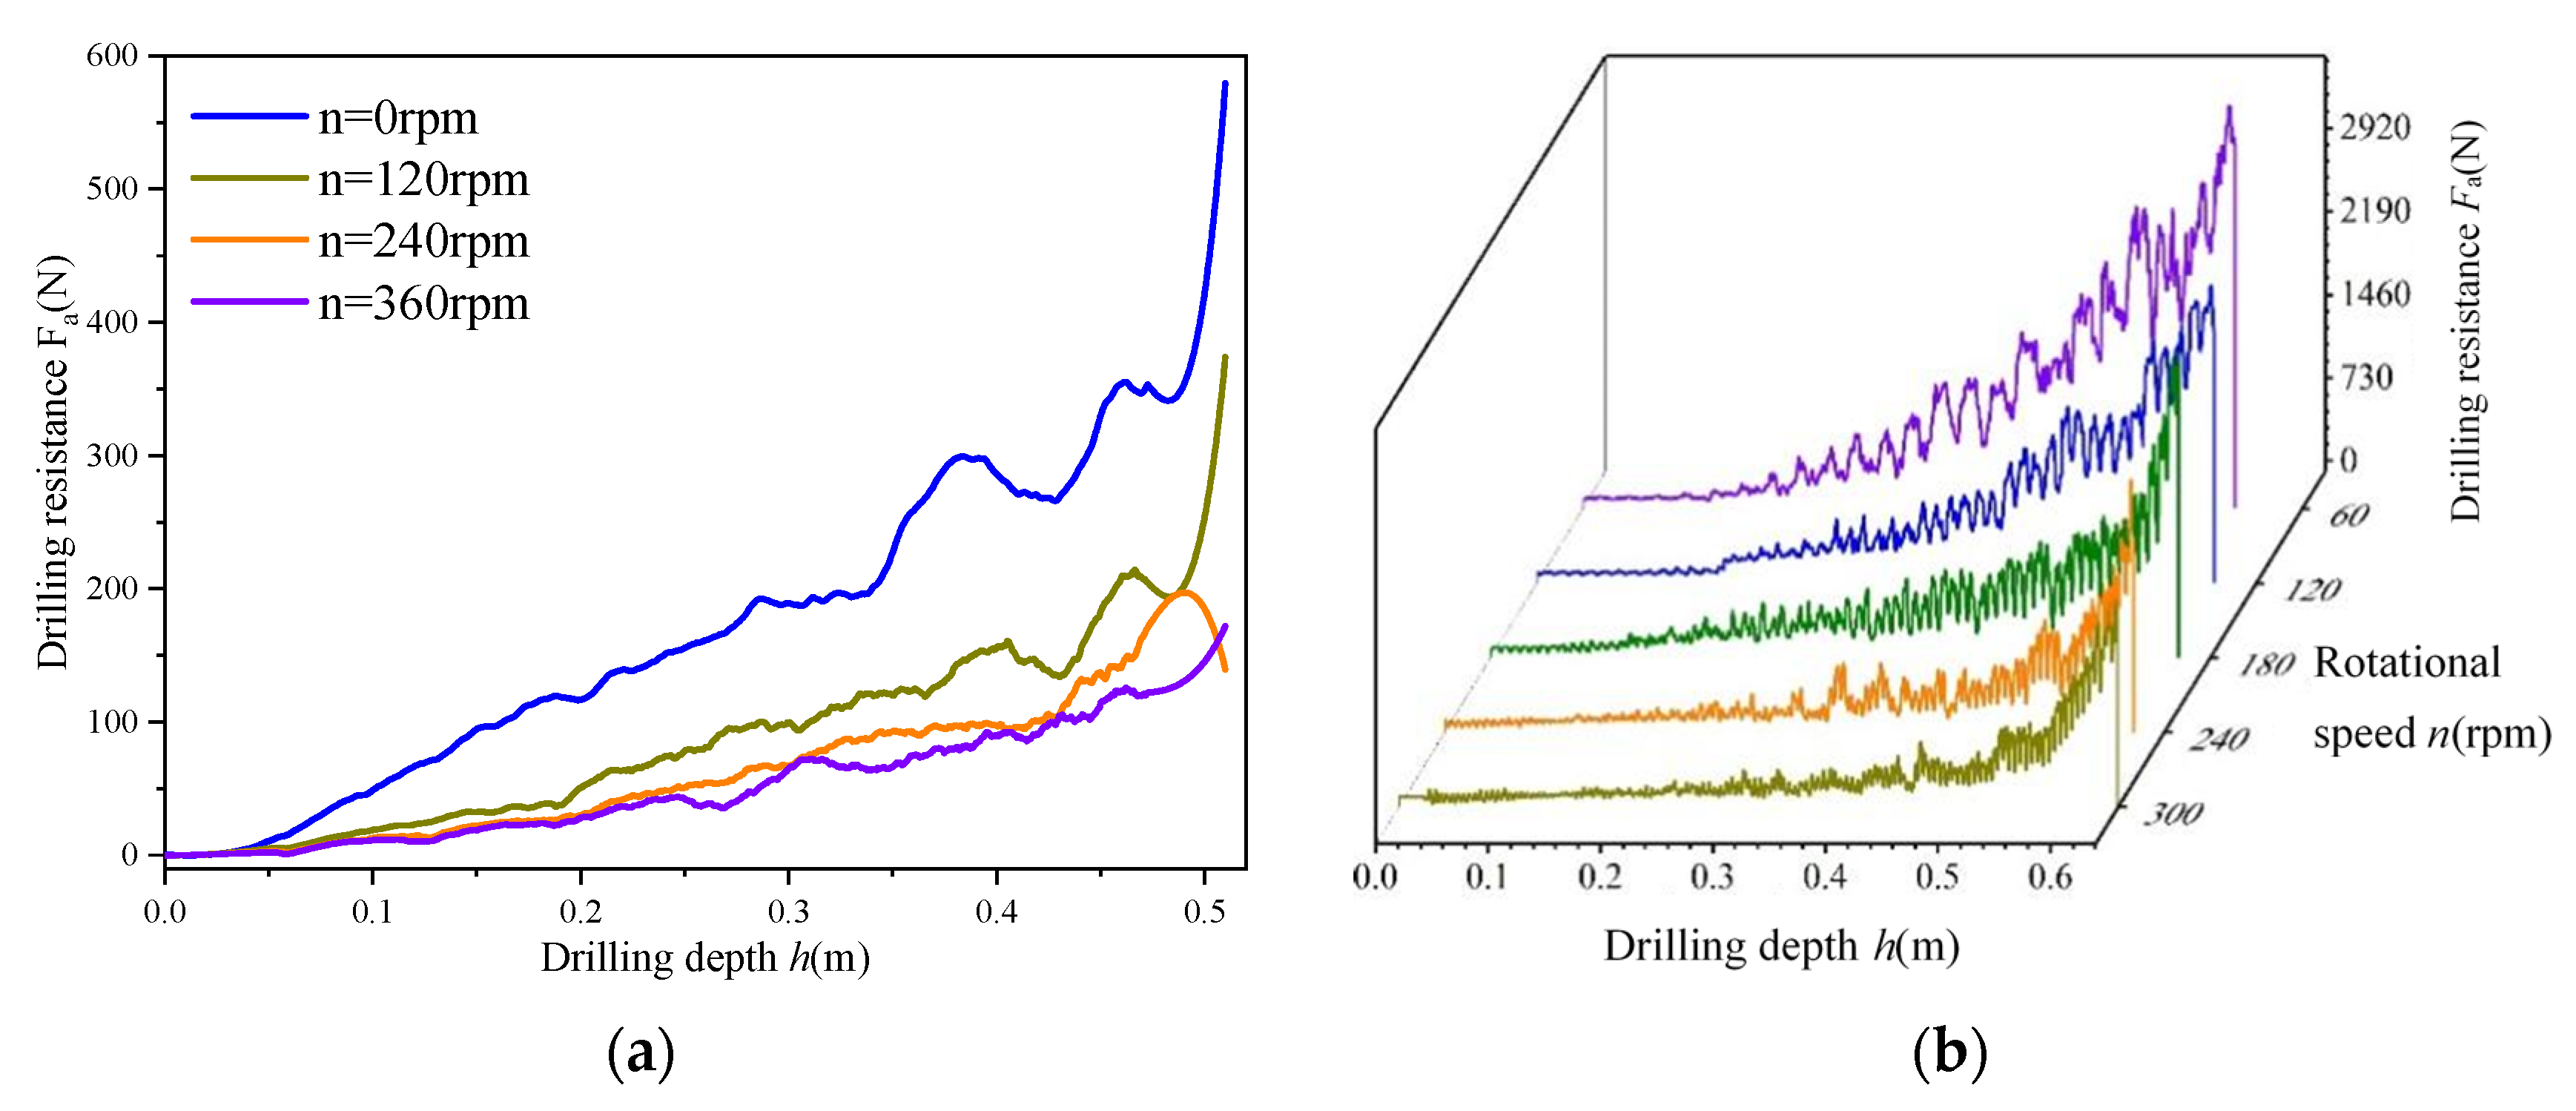
3.1. Axial Speed
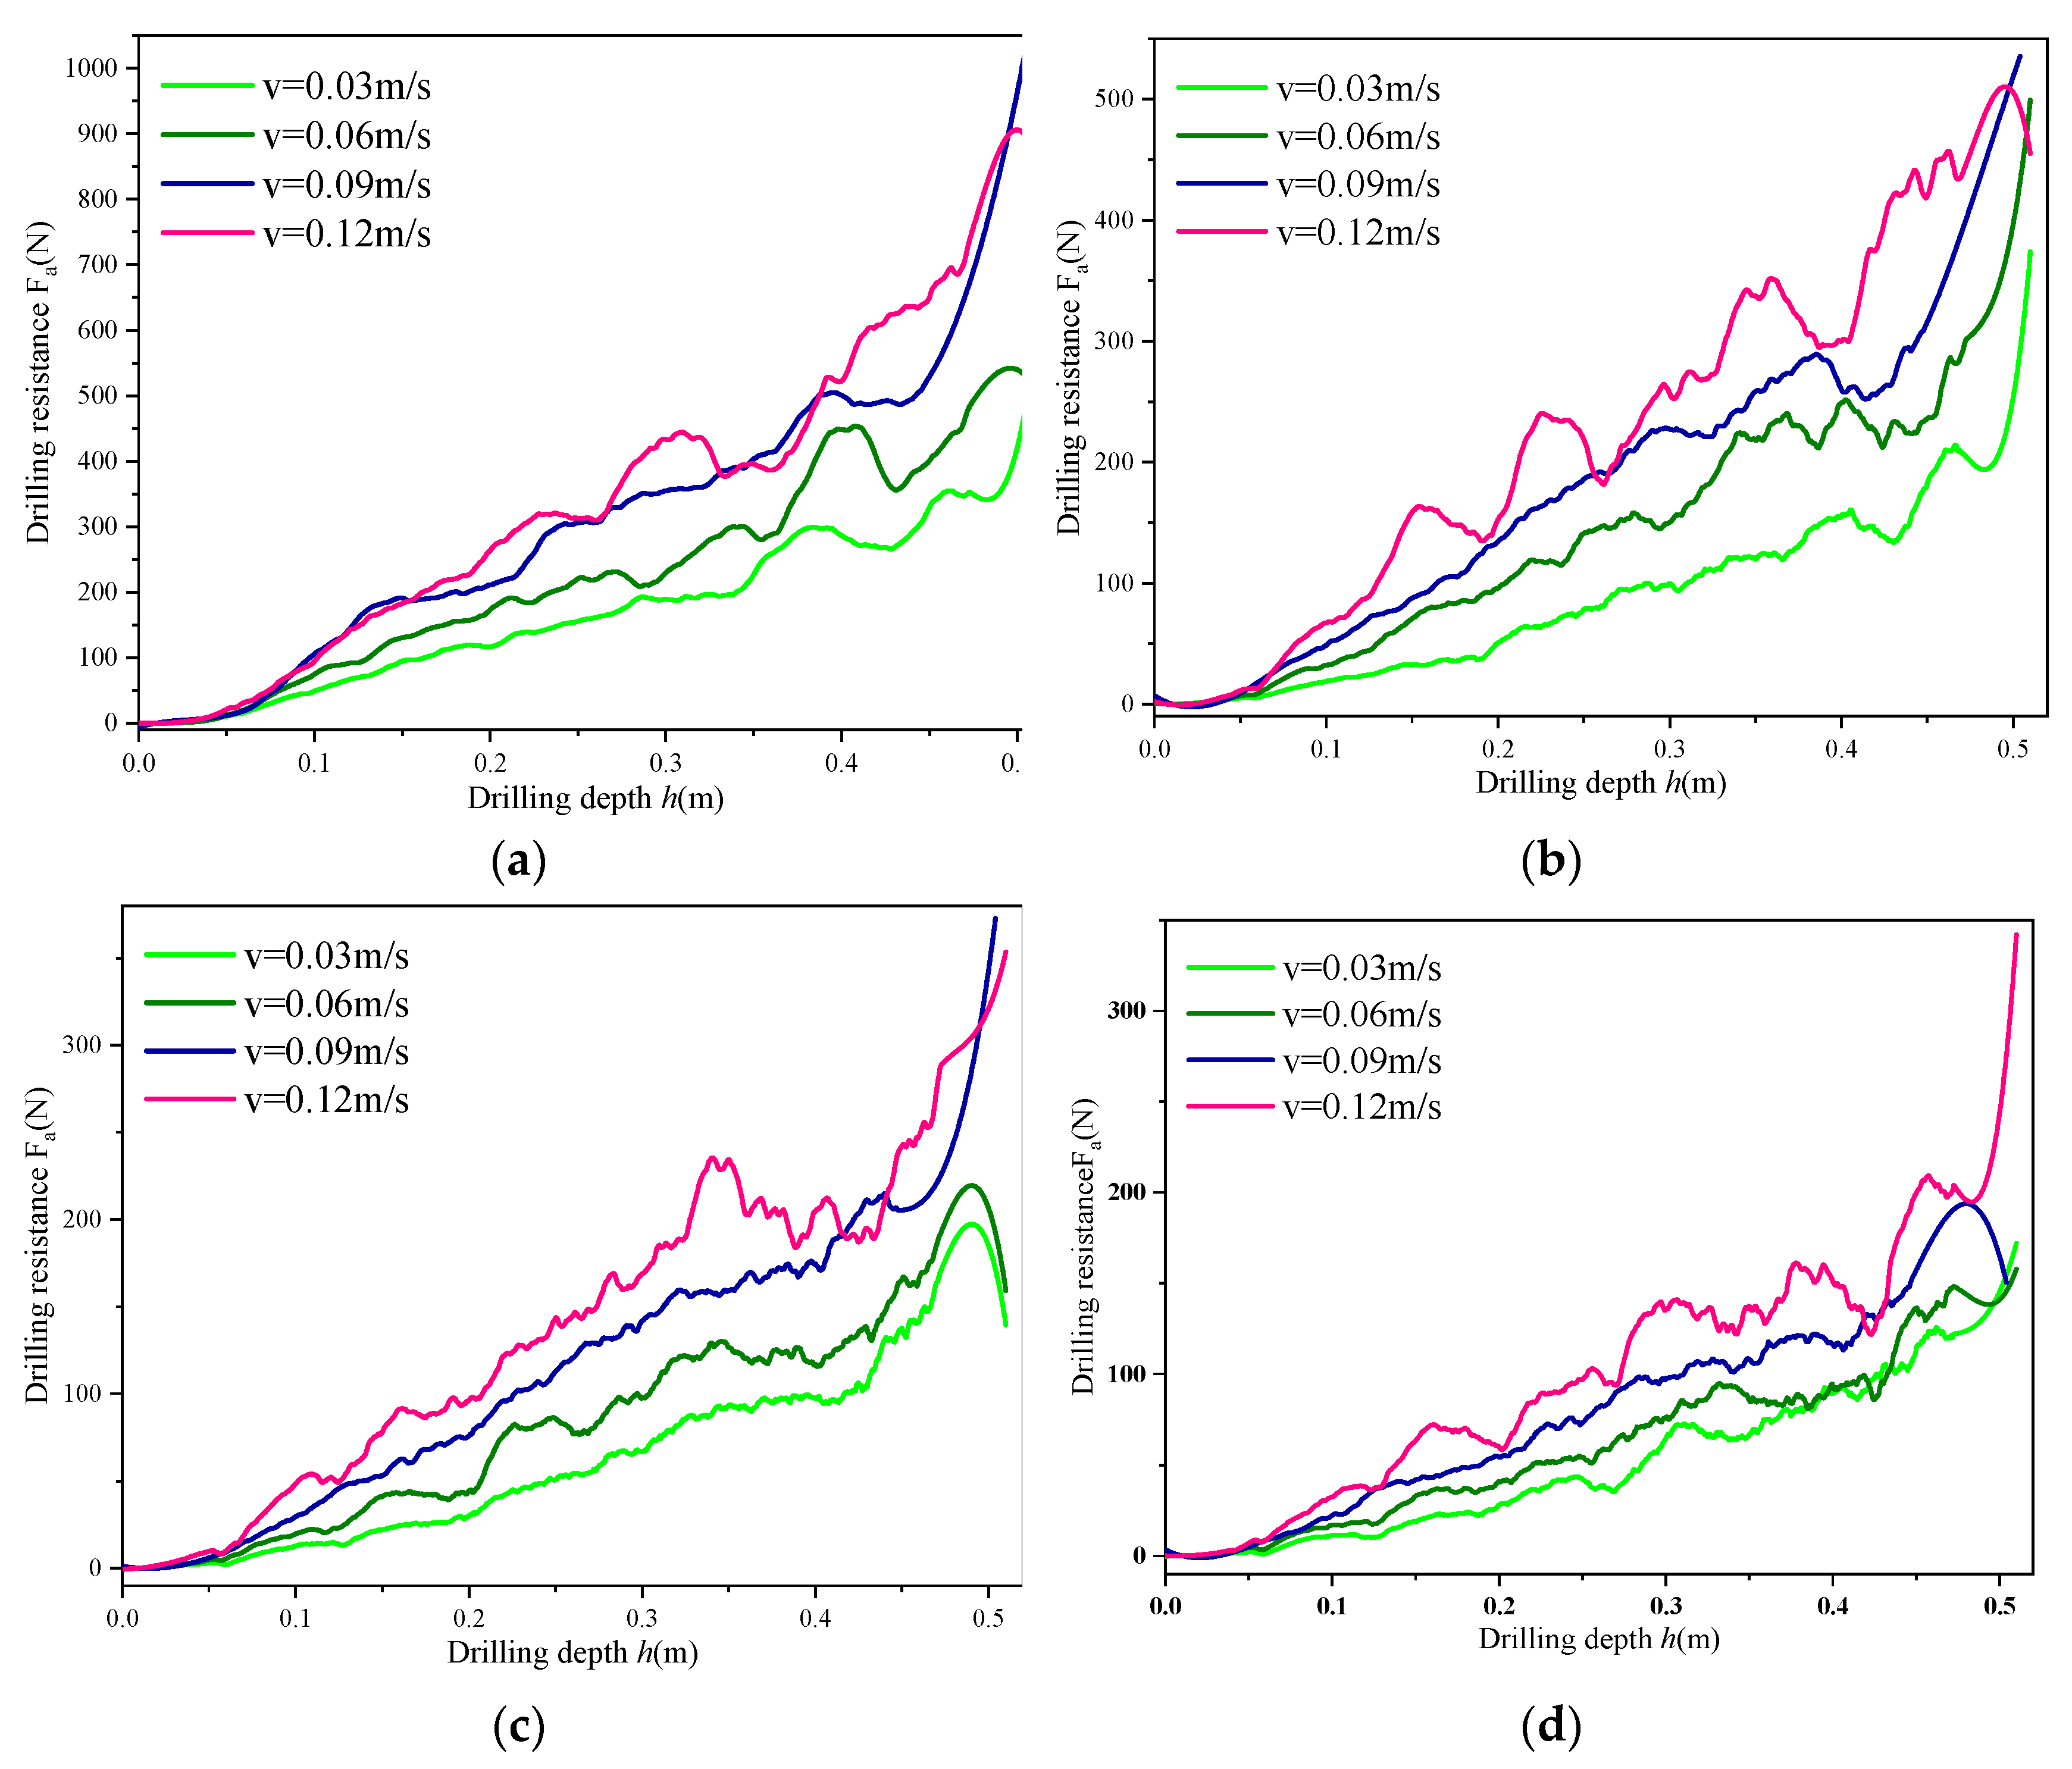
3.2. Feed Rate
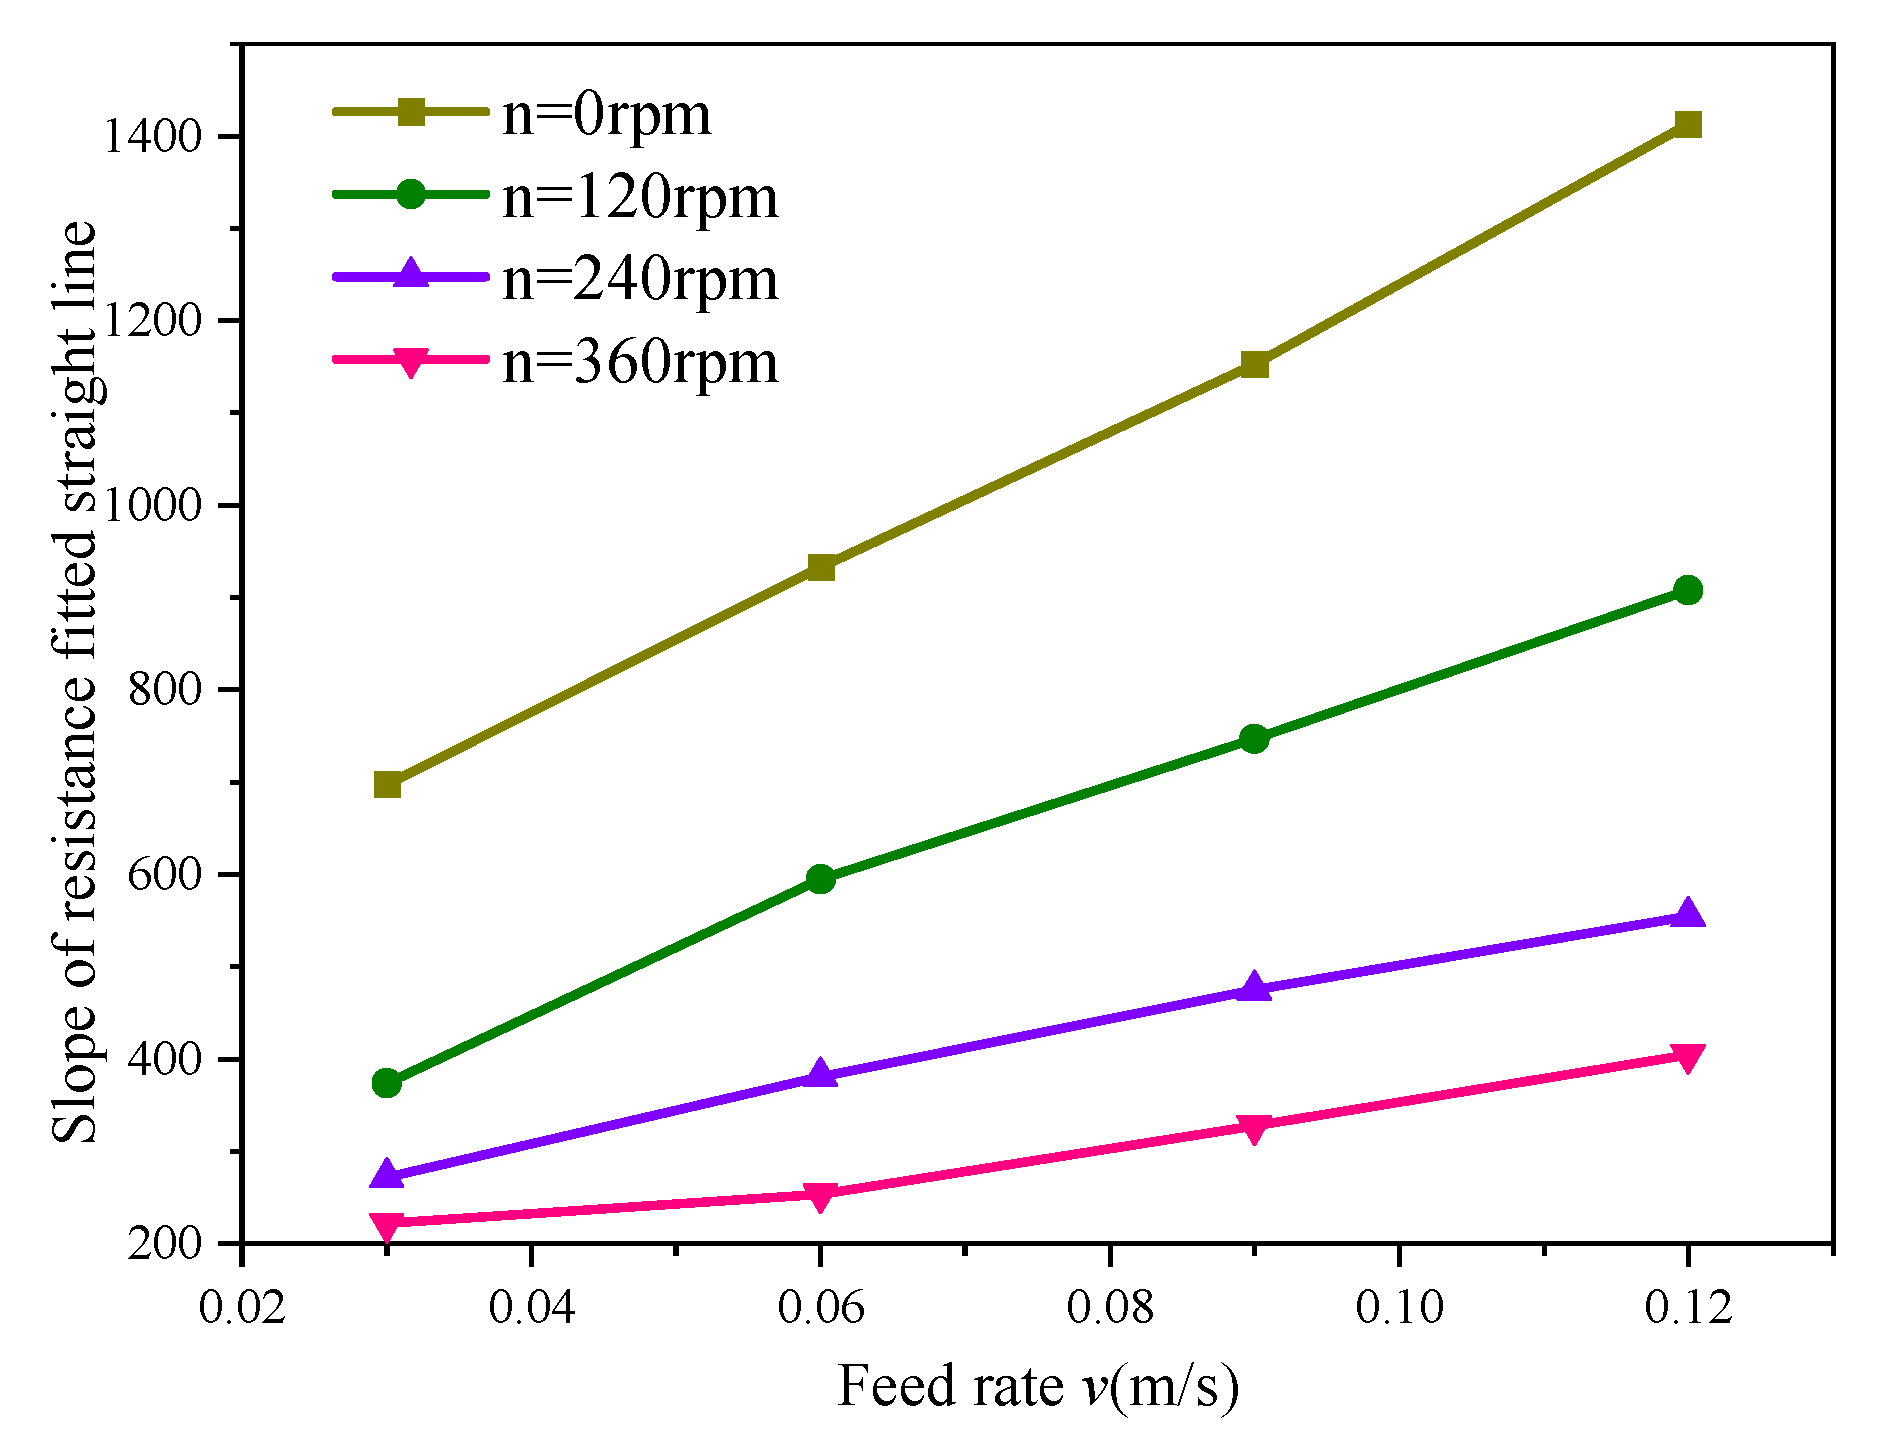
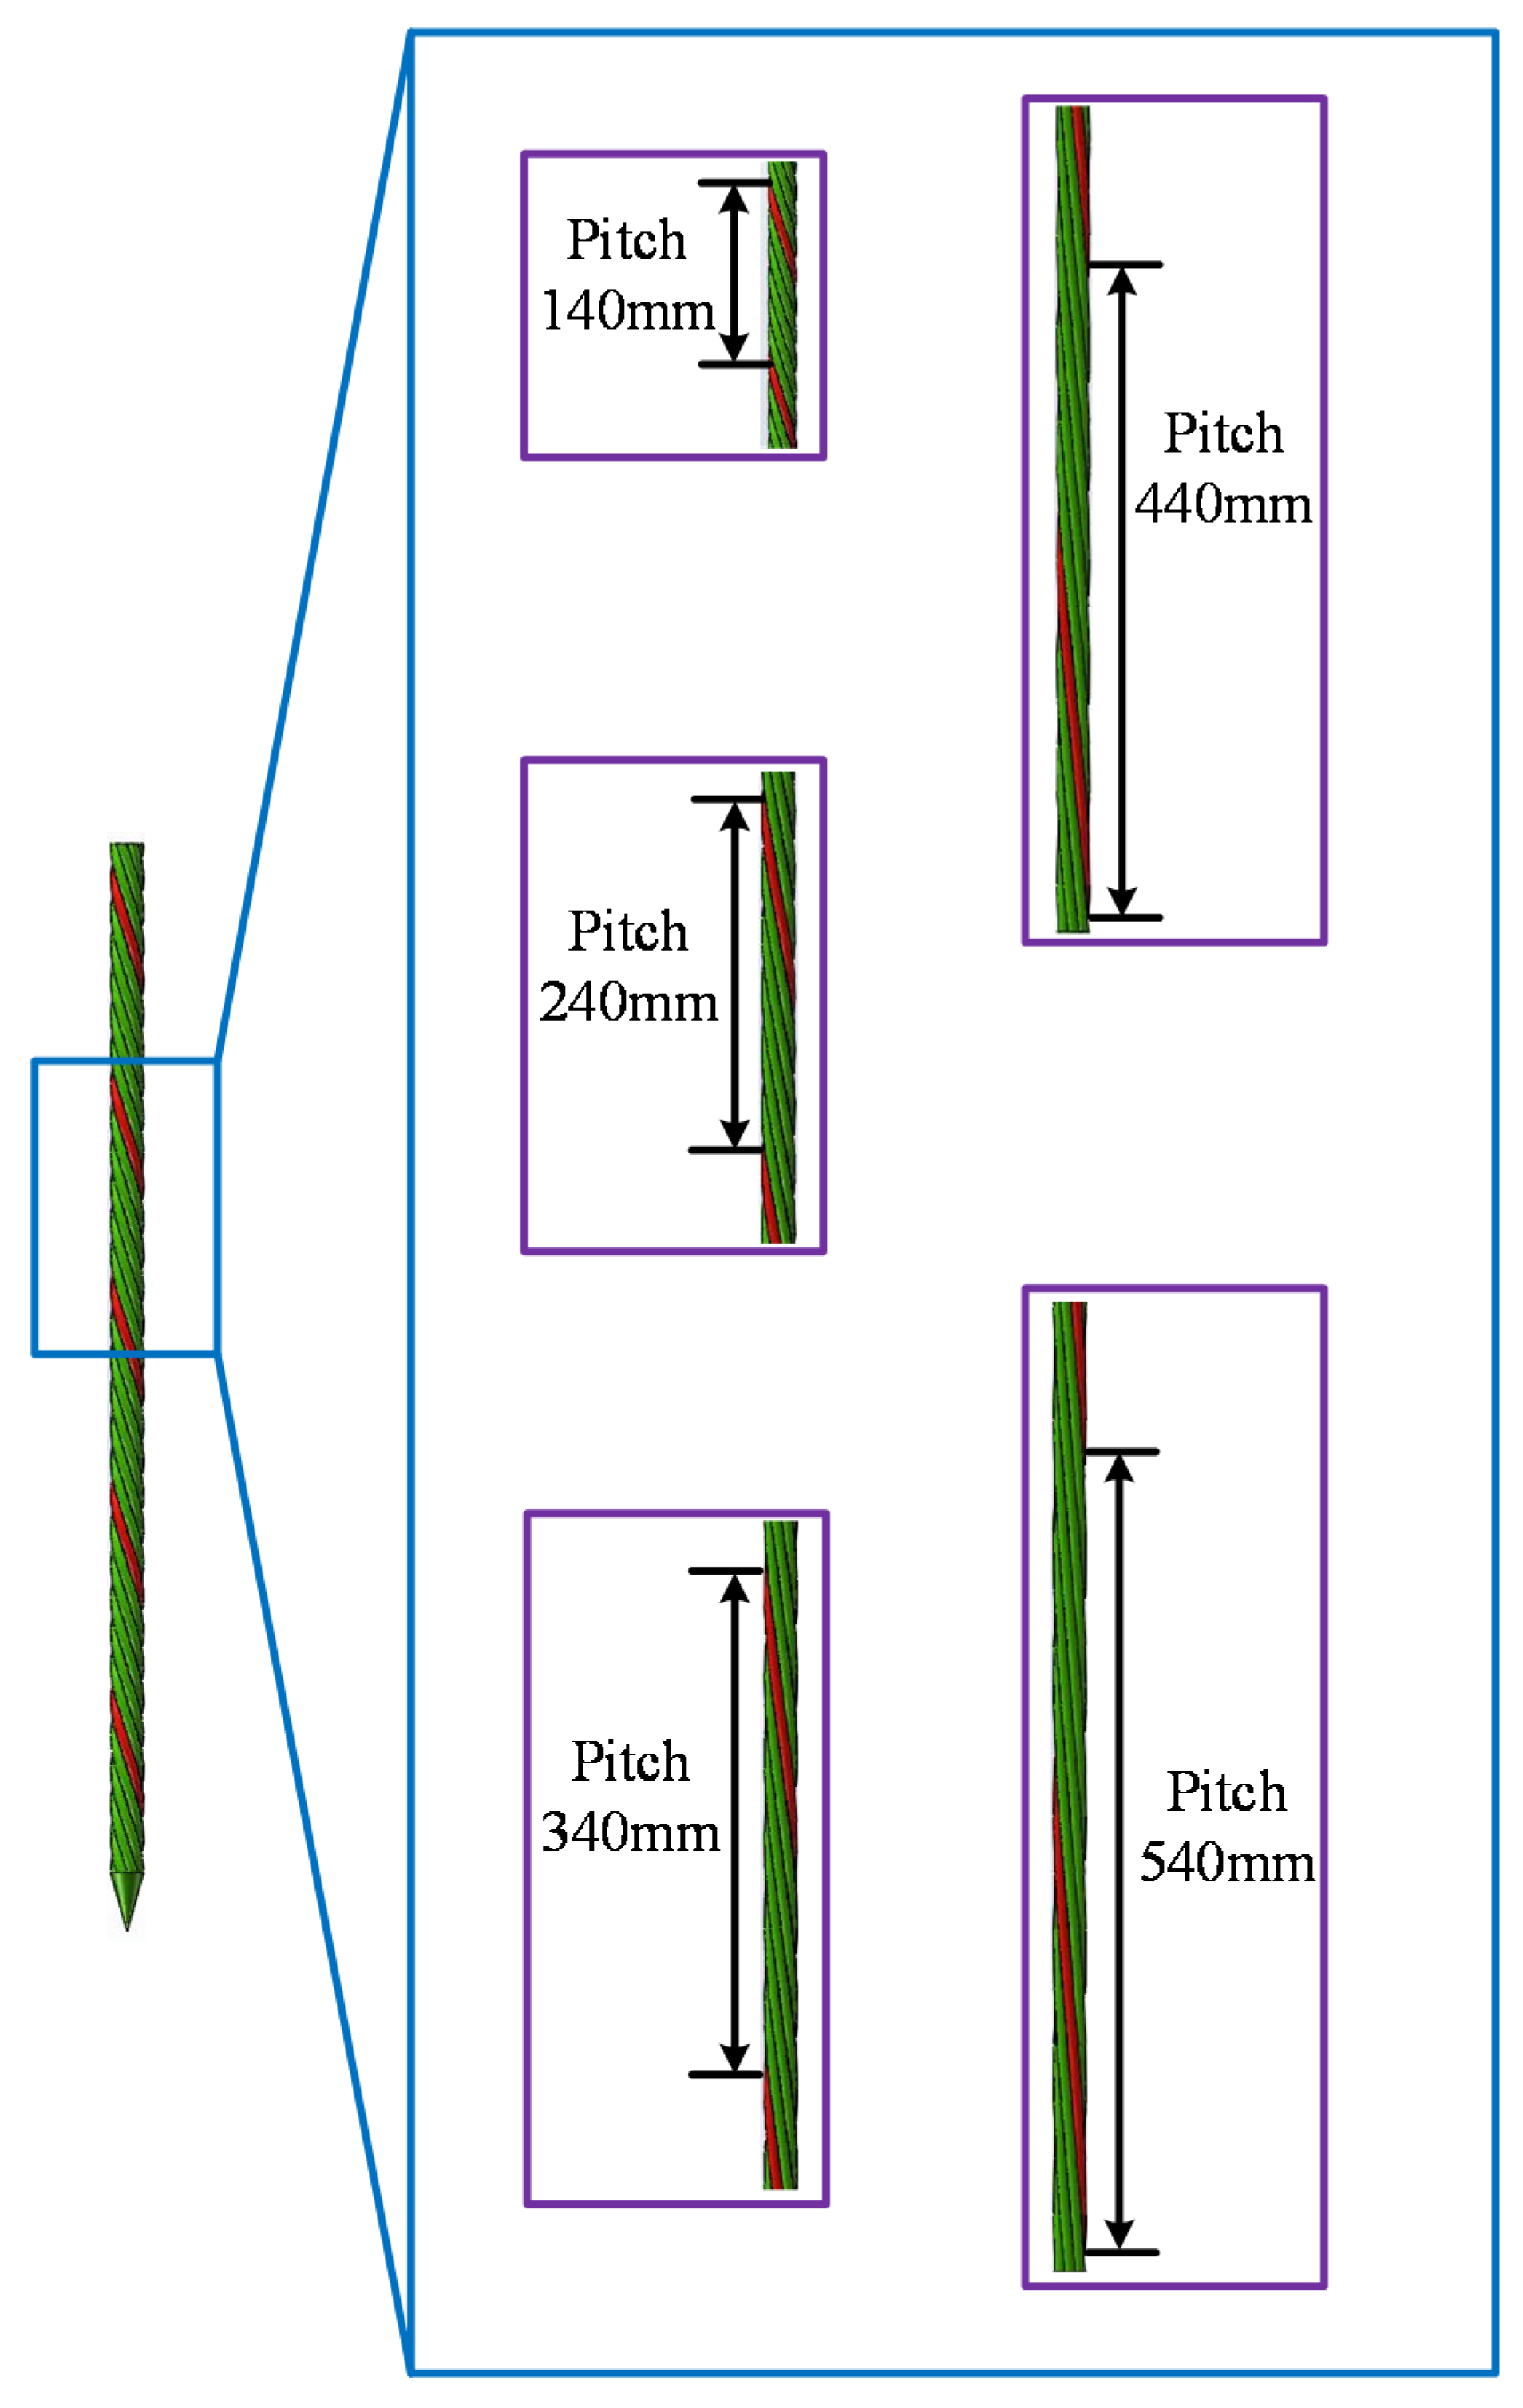
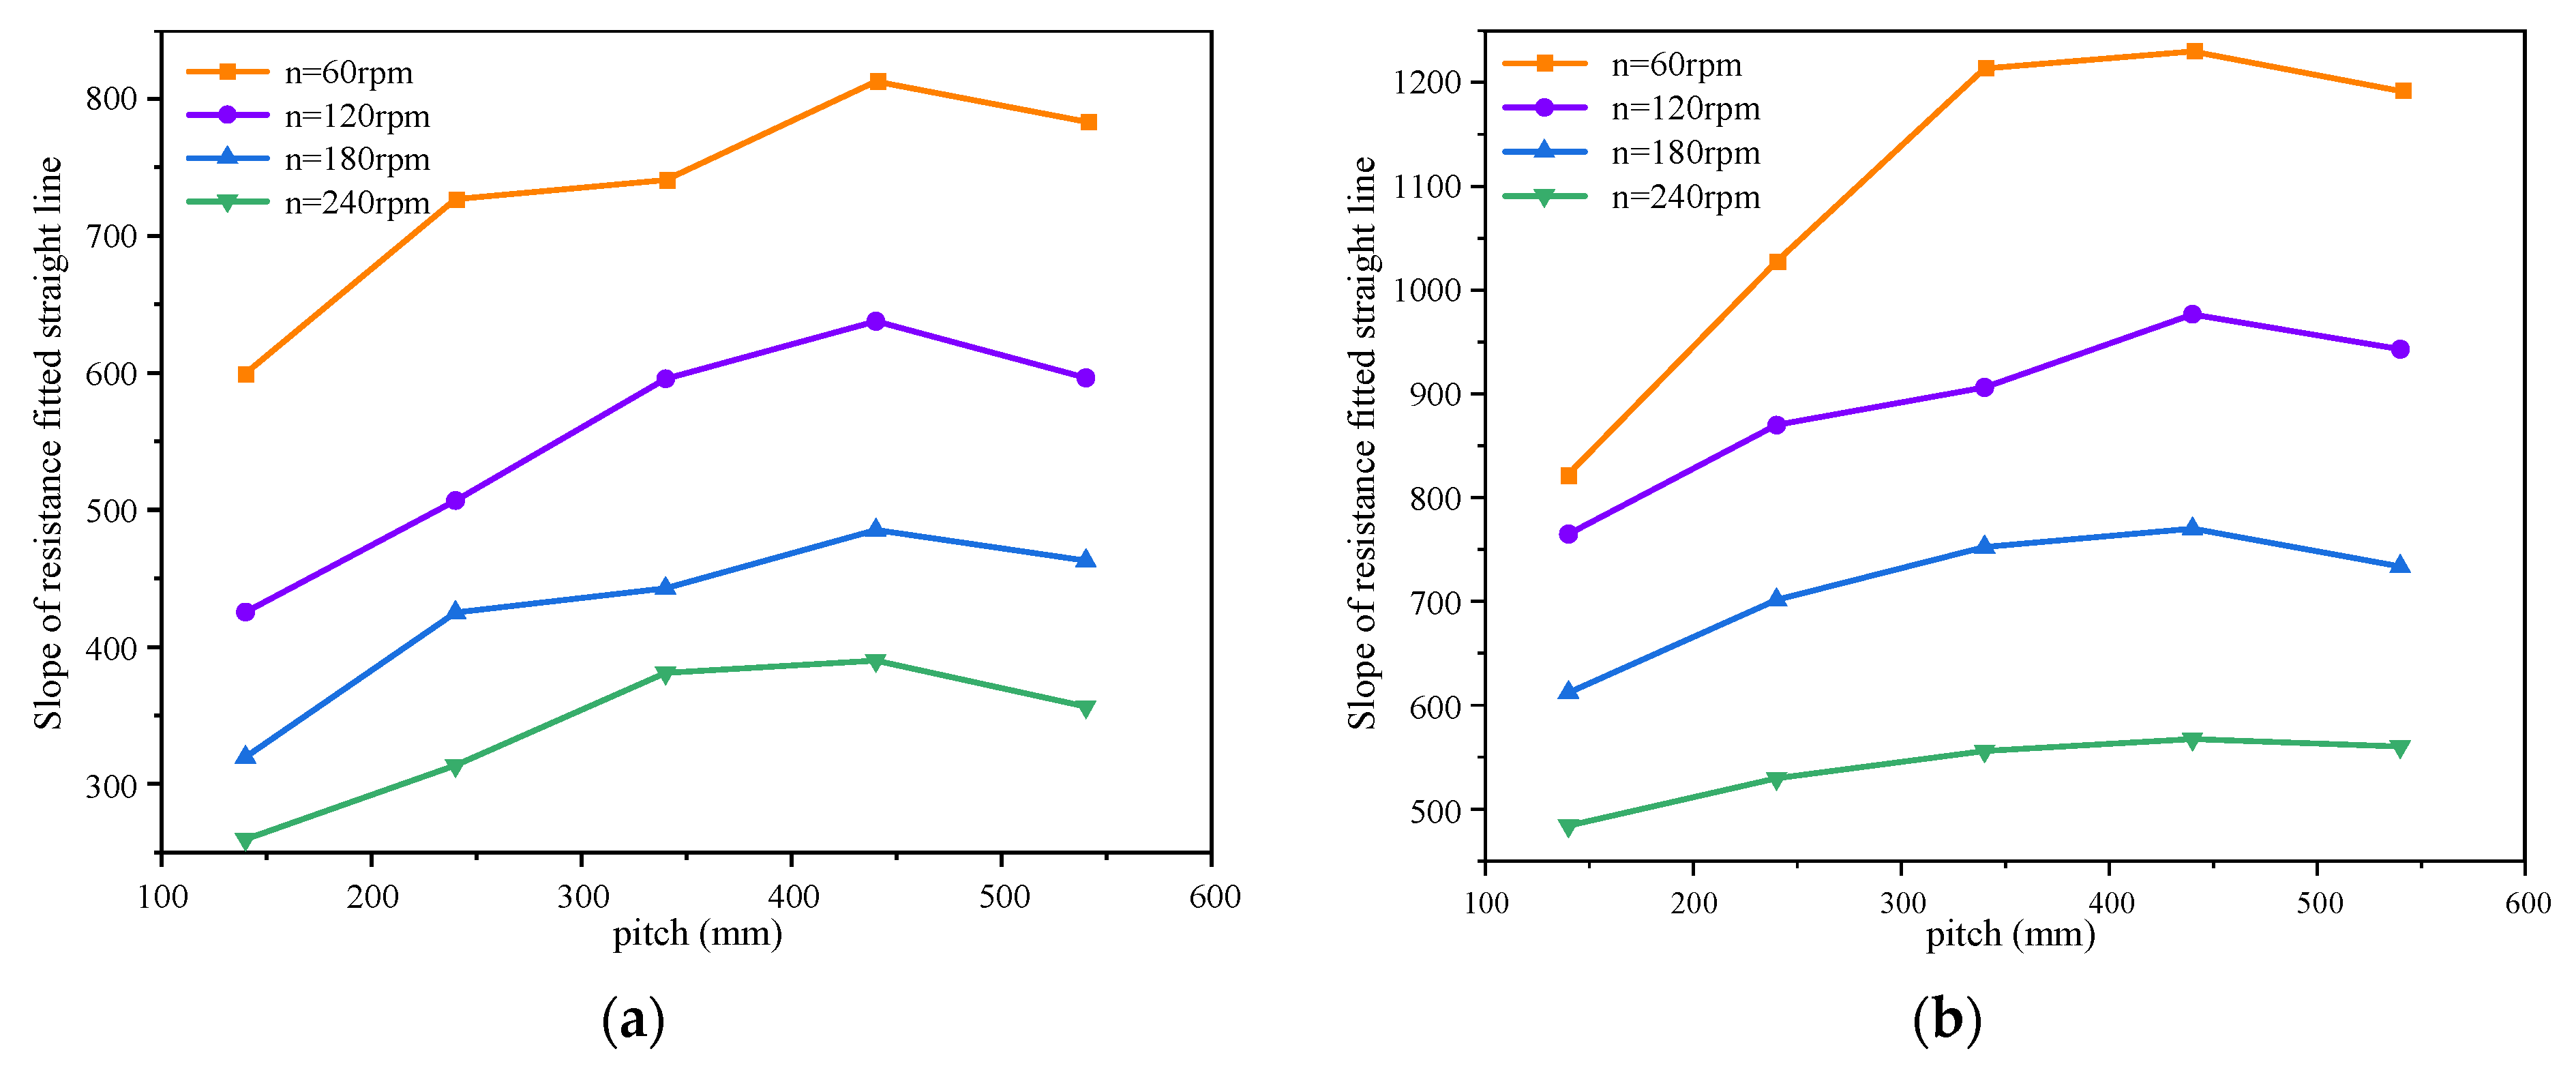
3.3. Anchor Cable Pitch
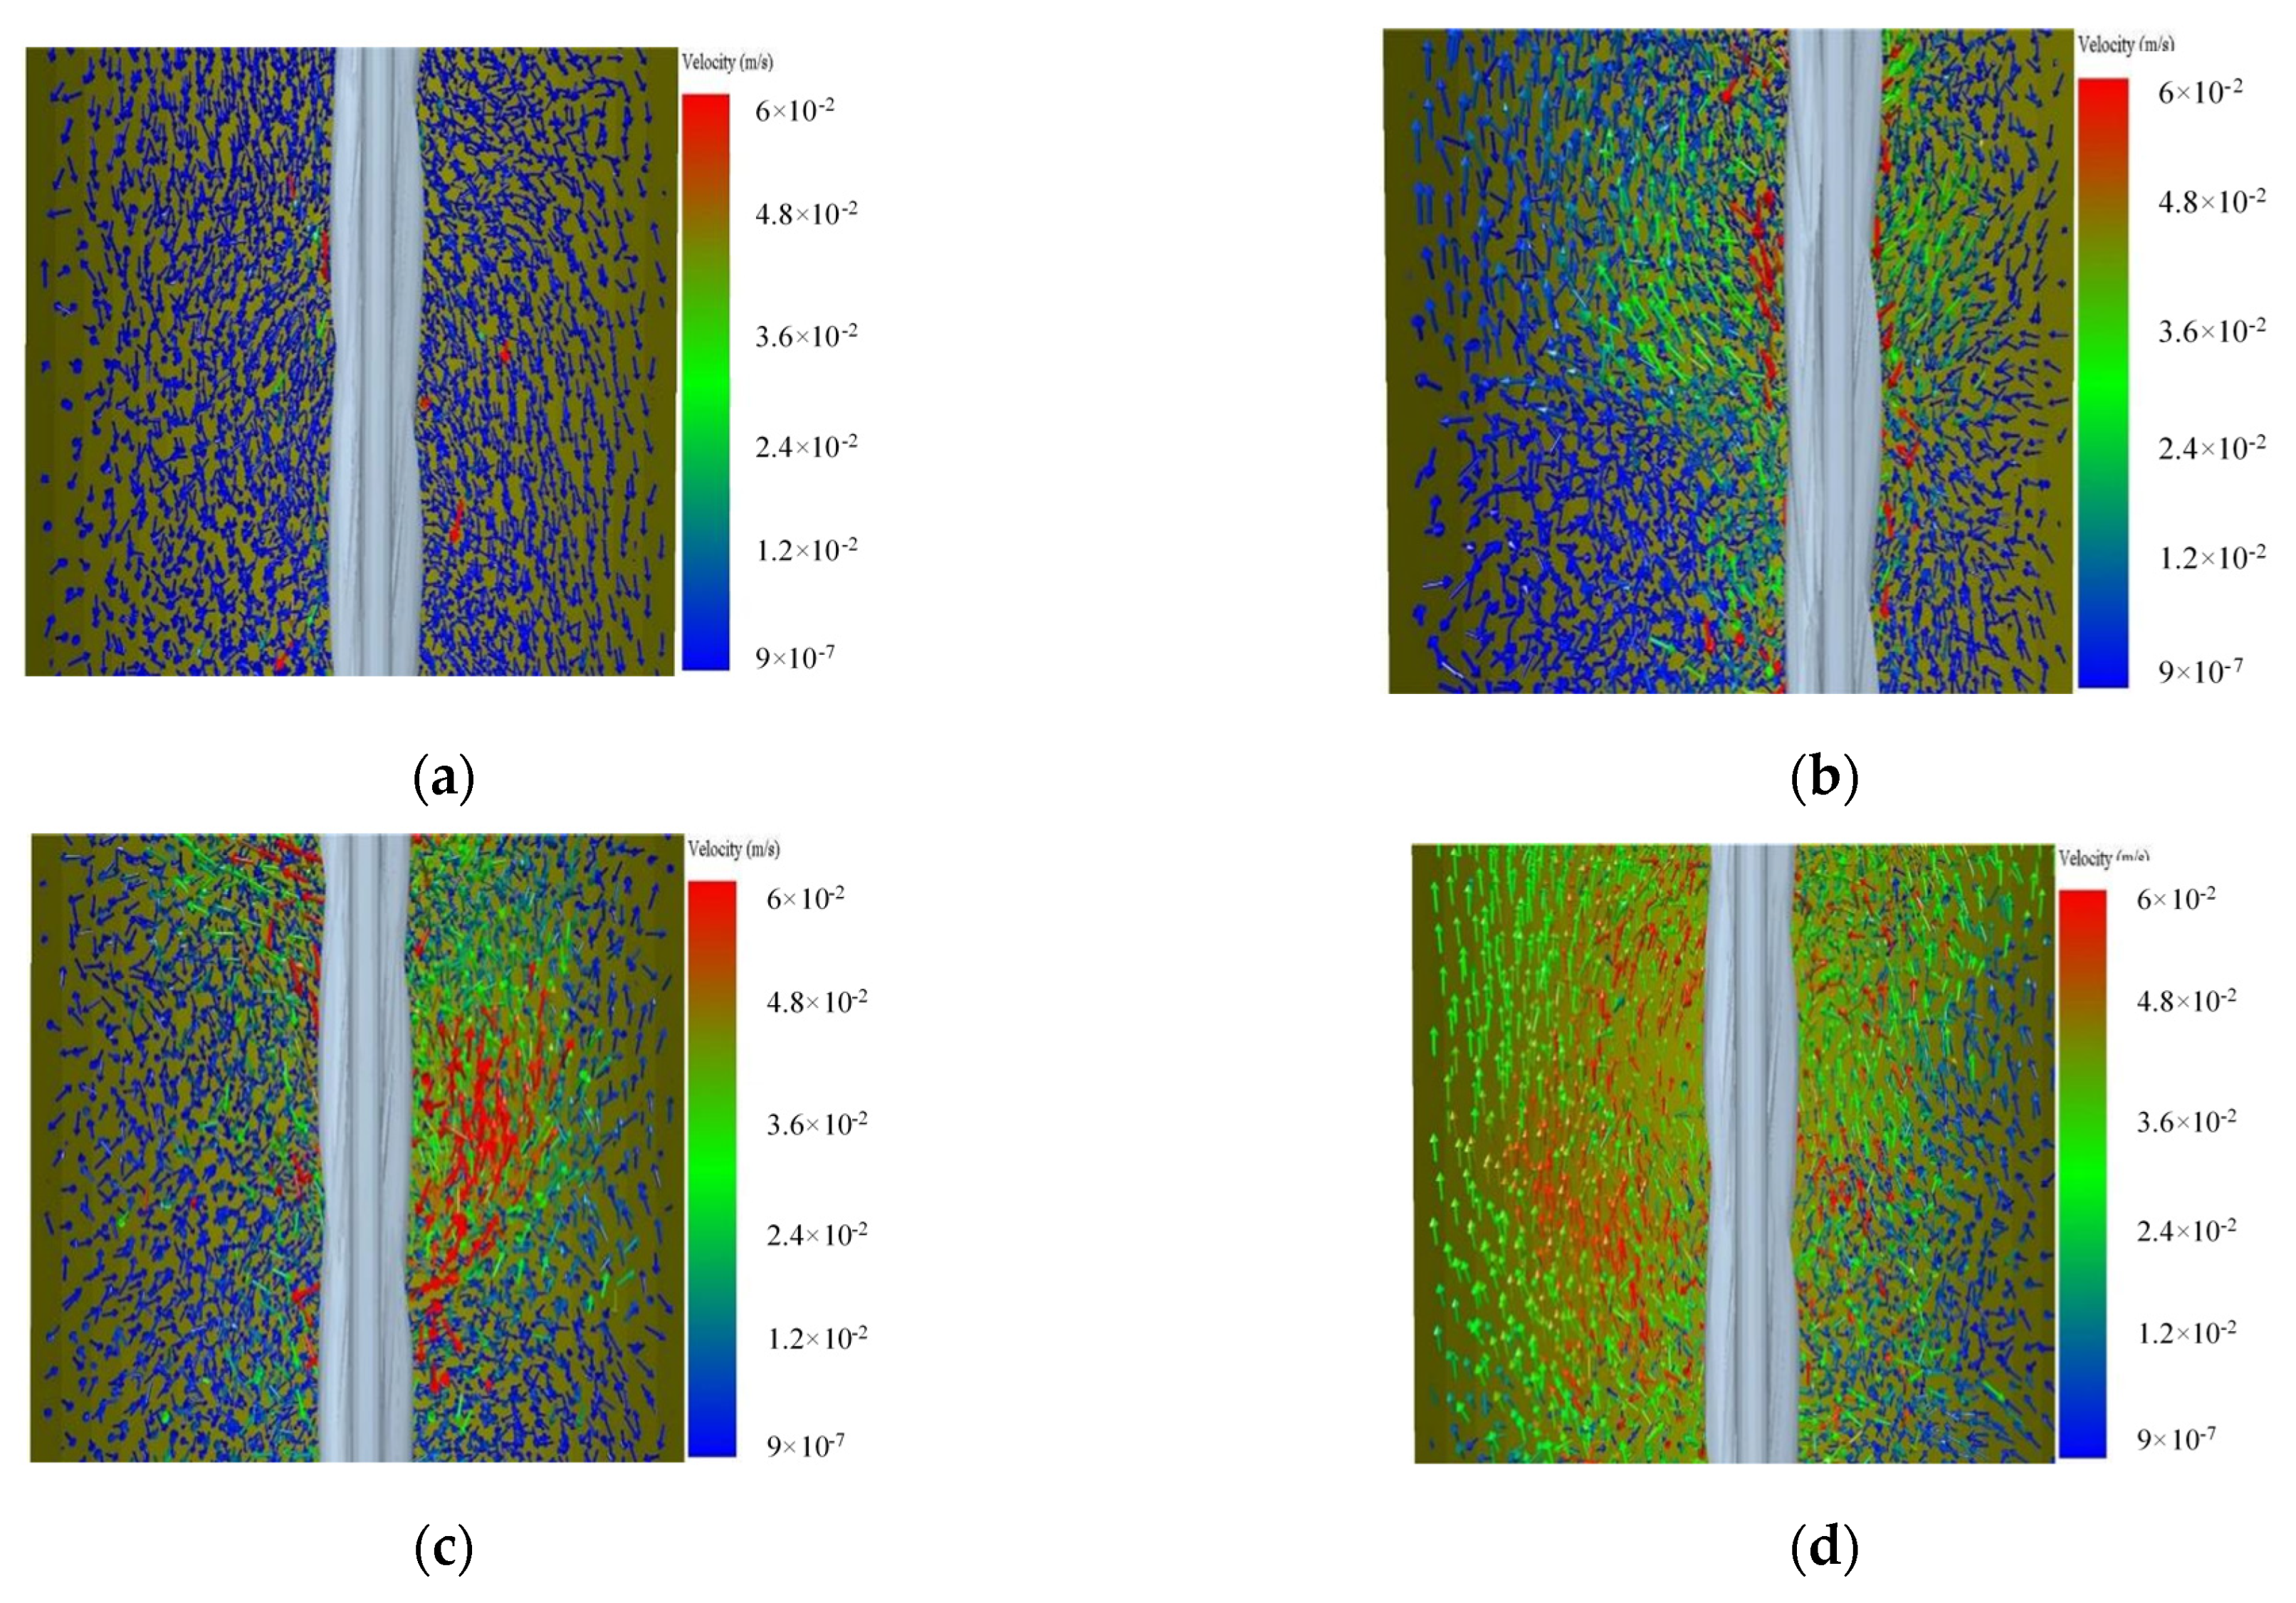
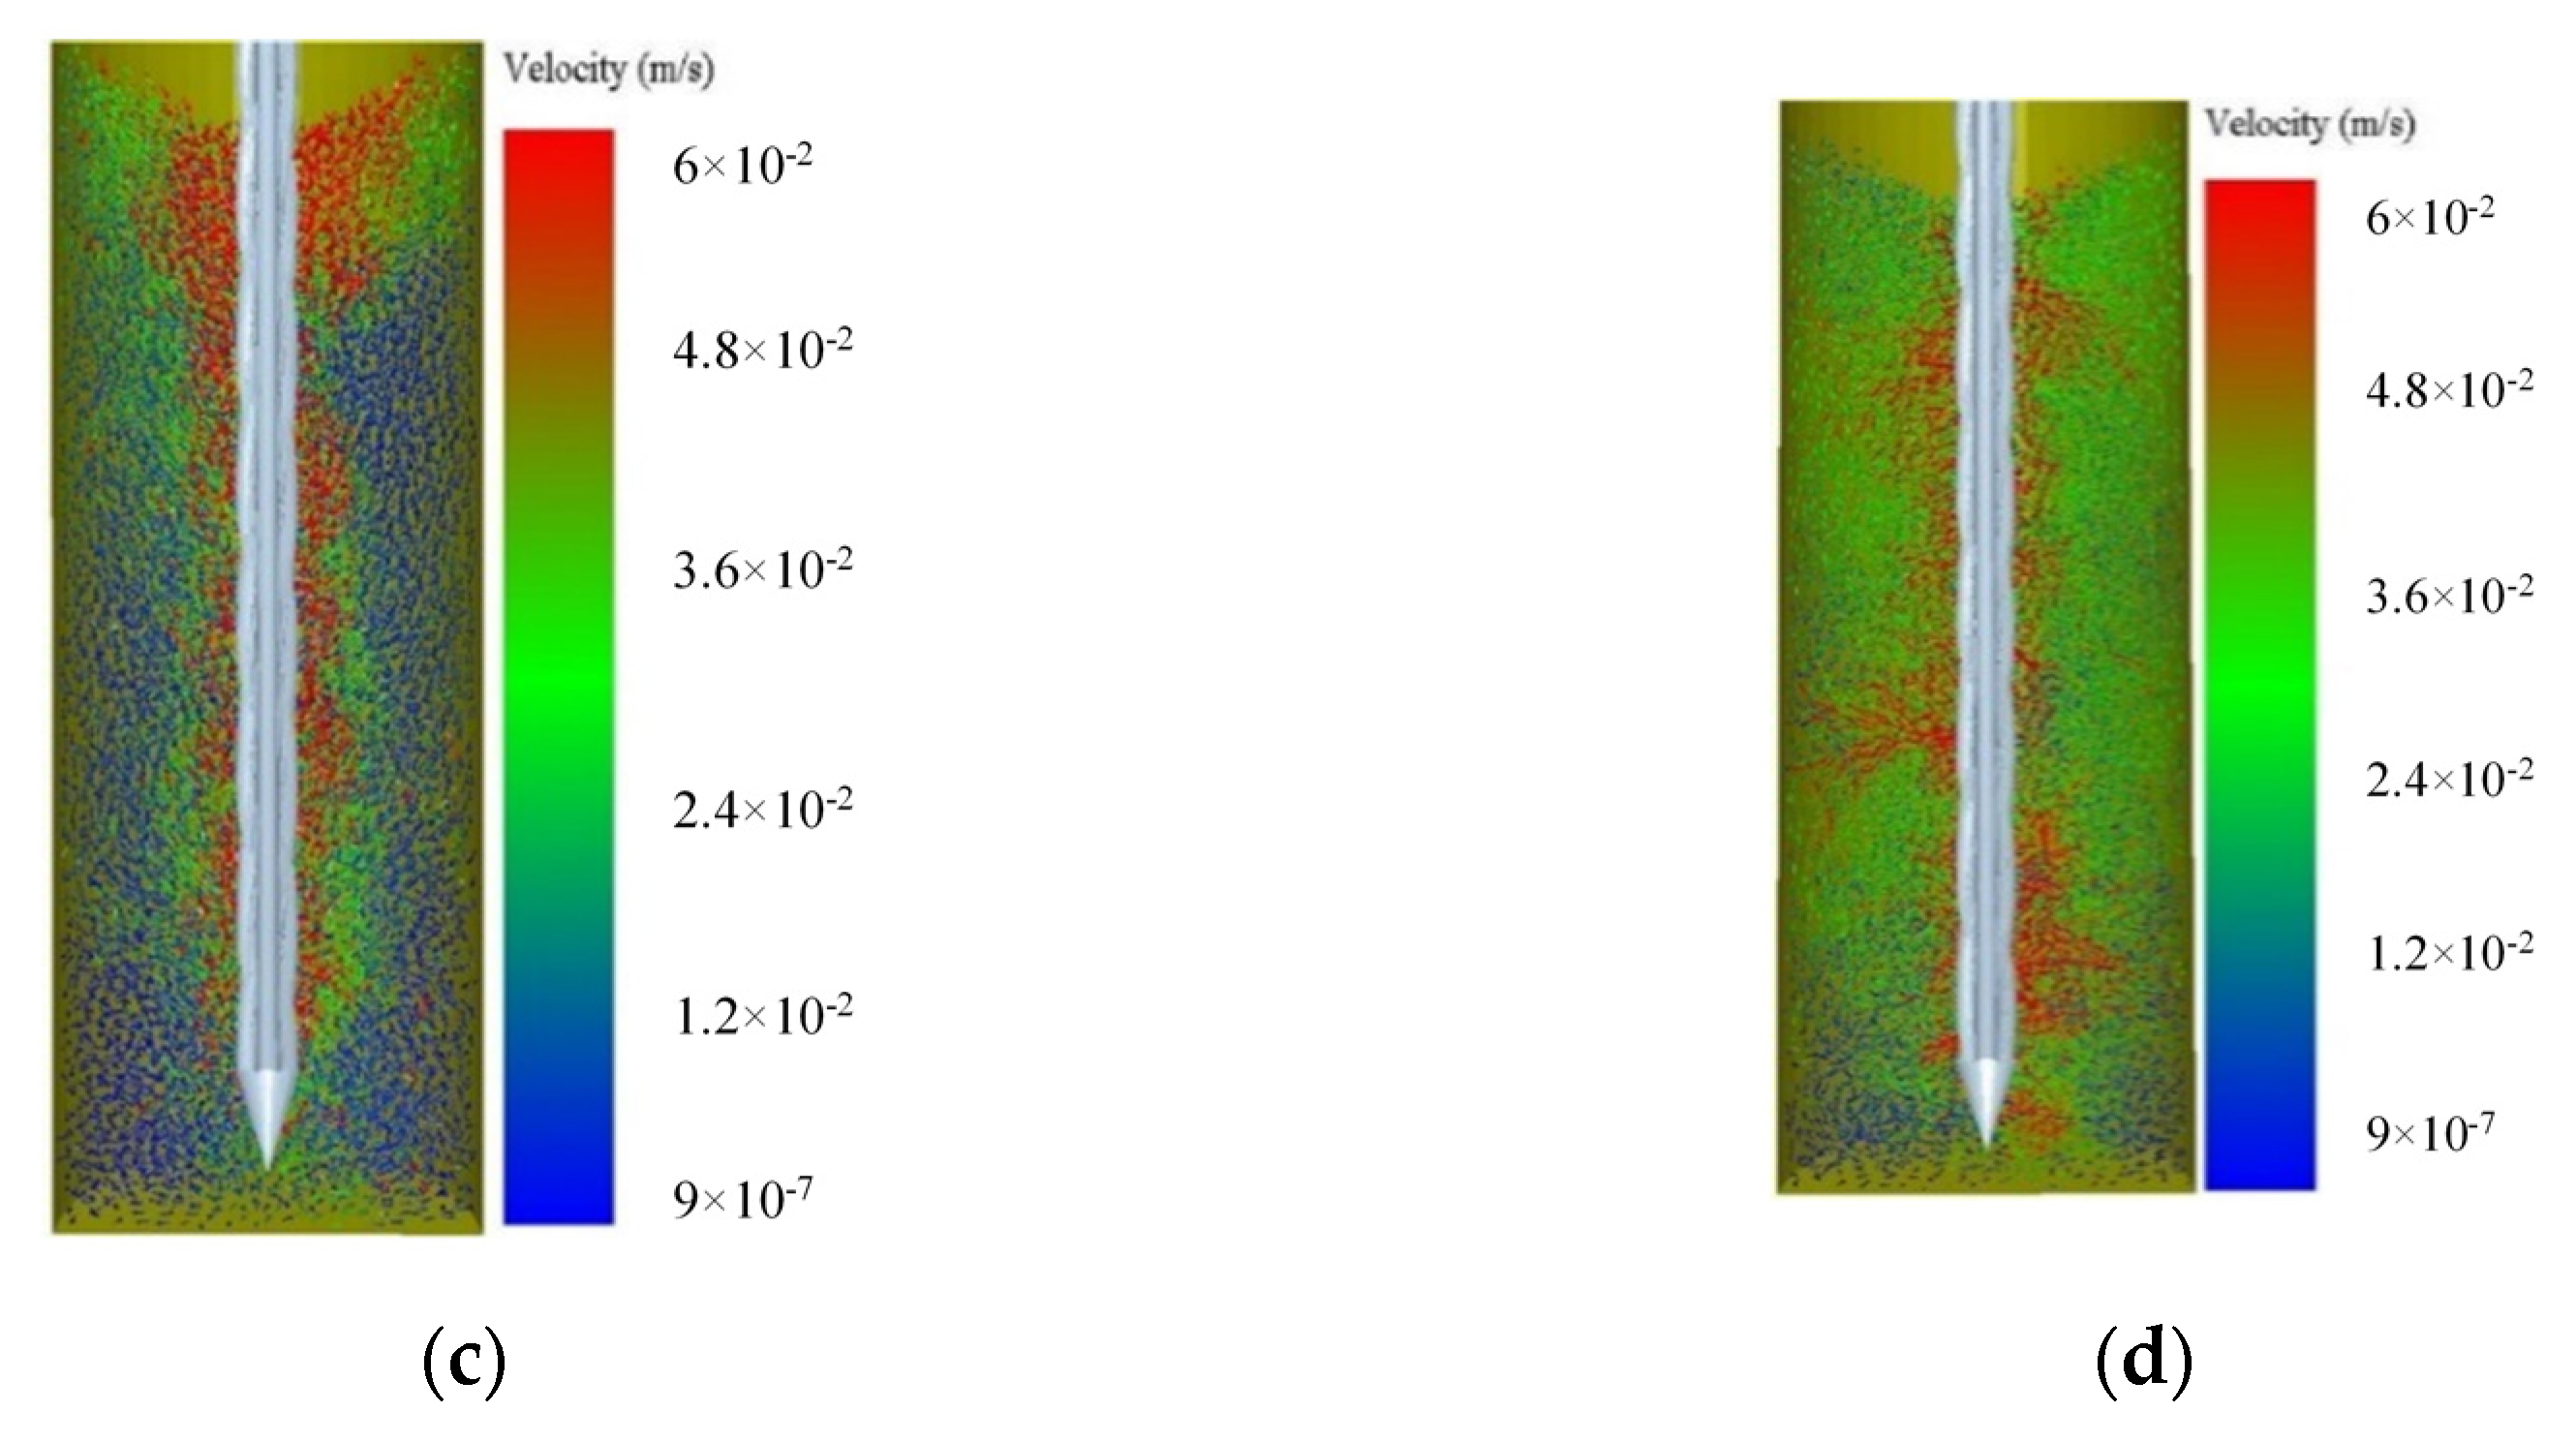
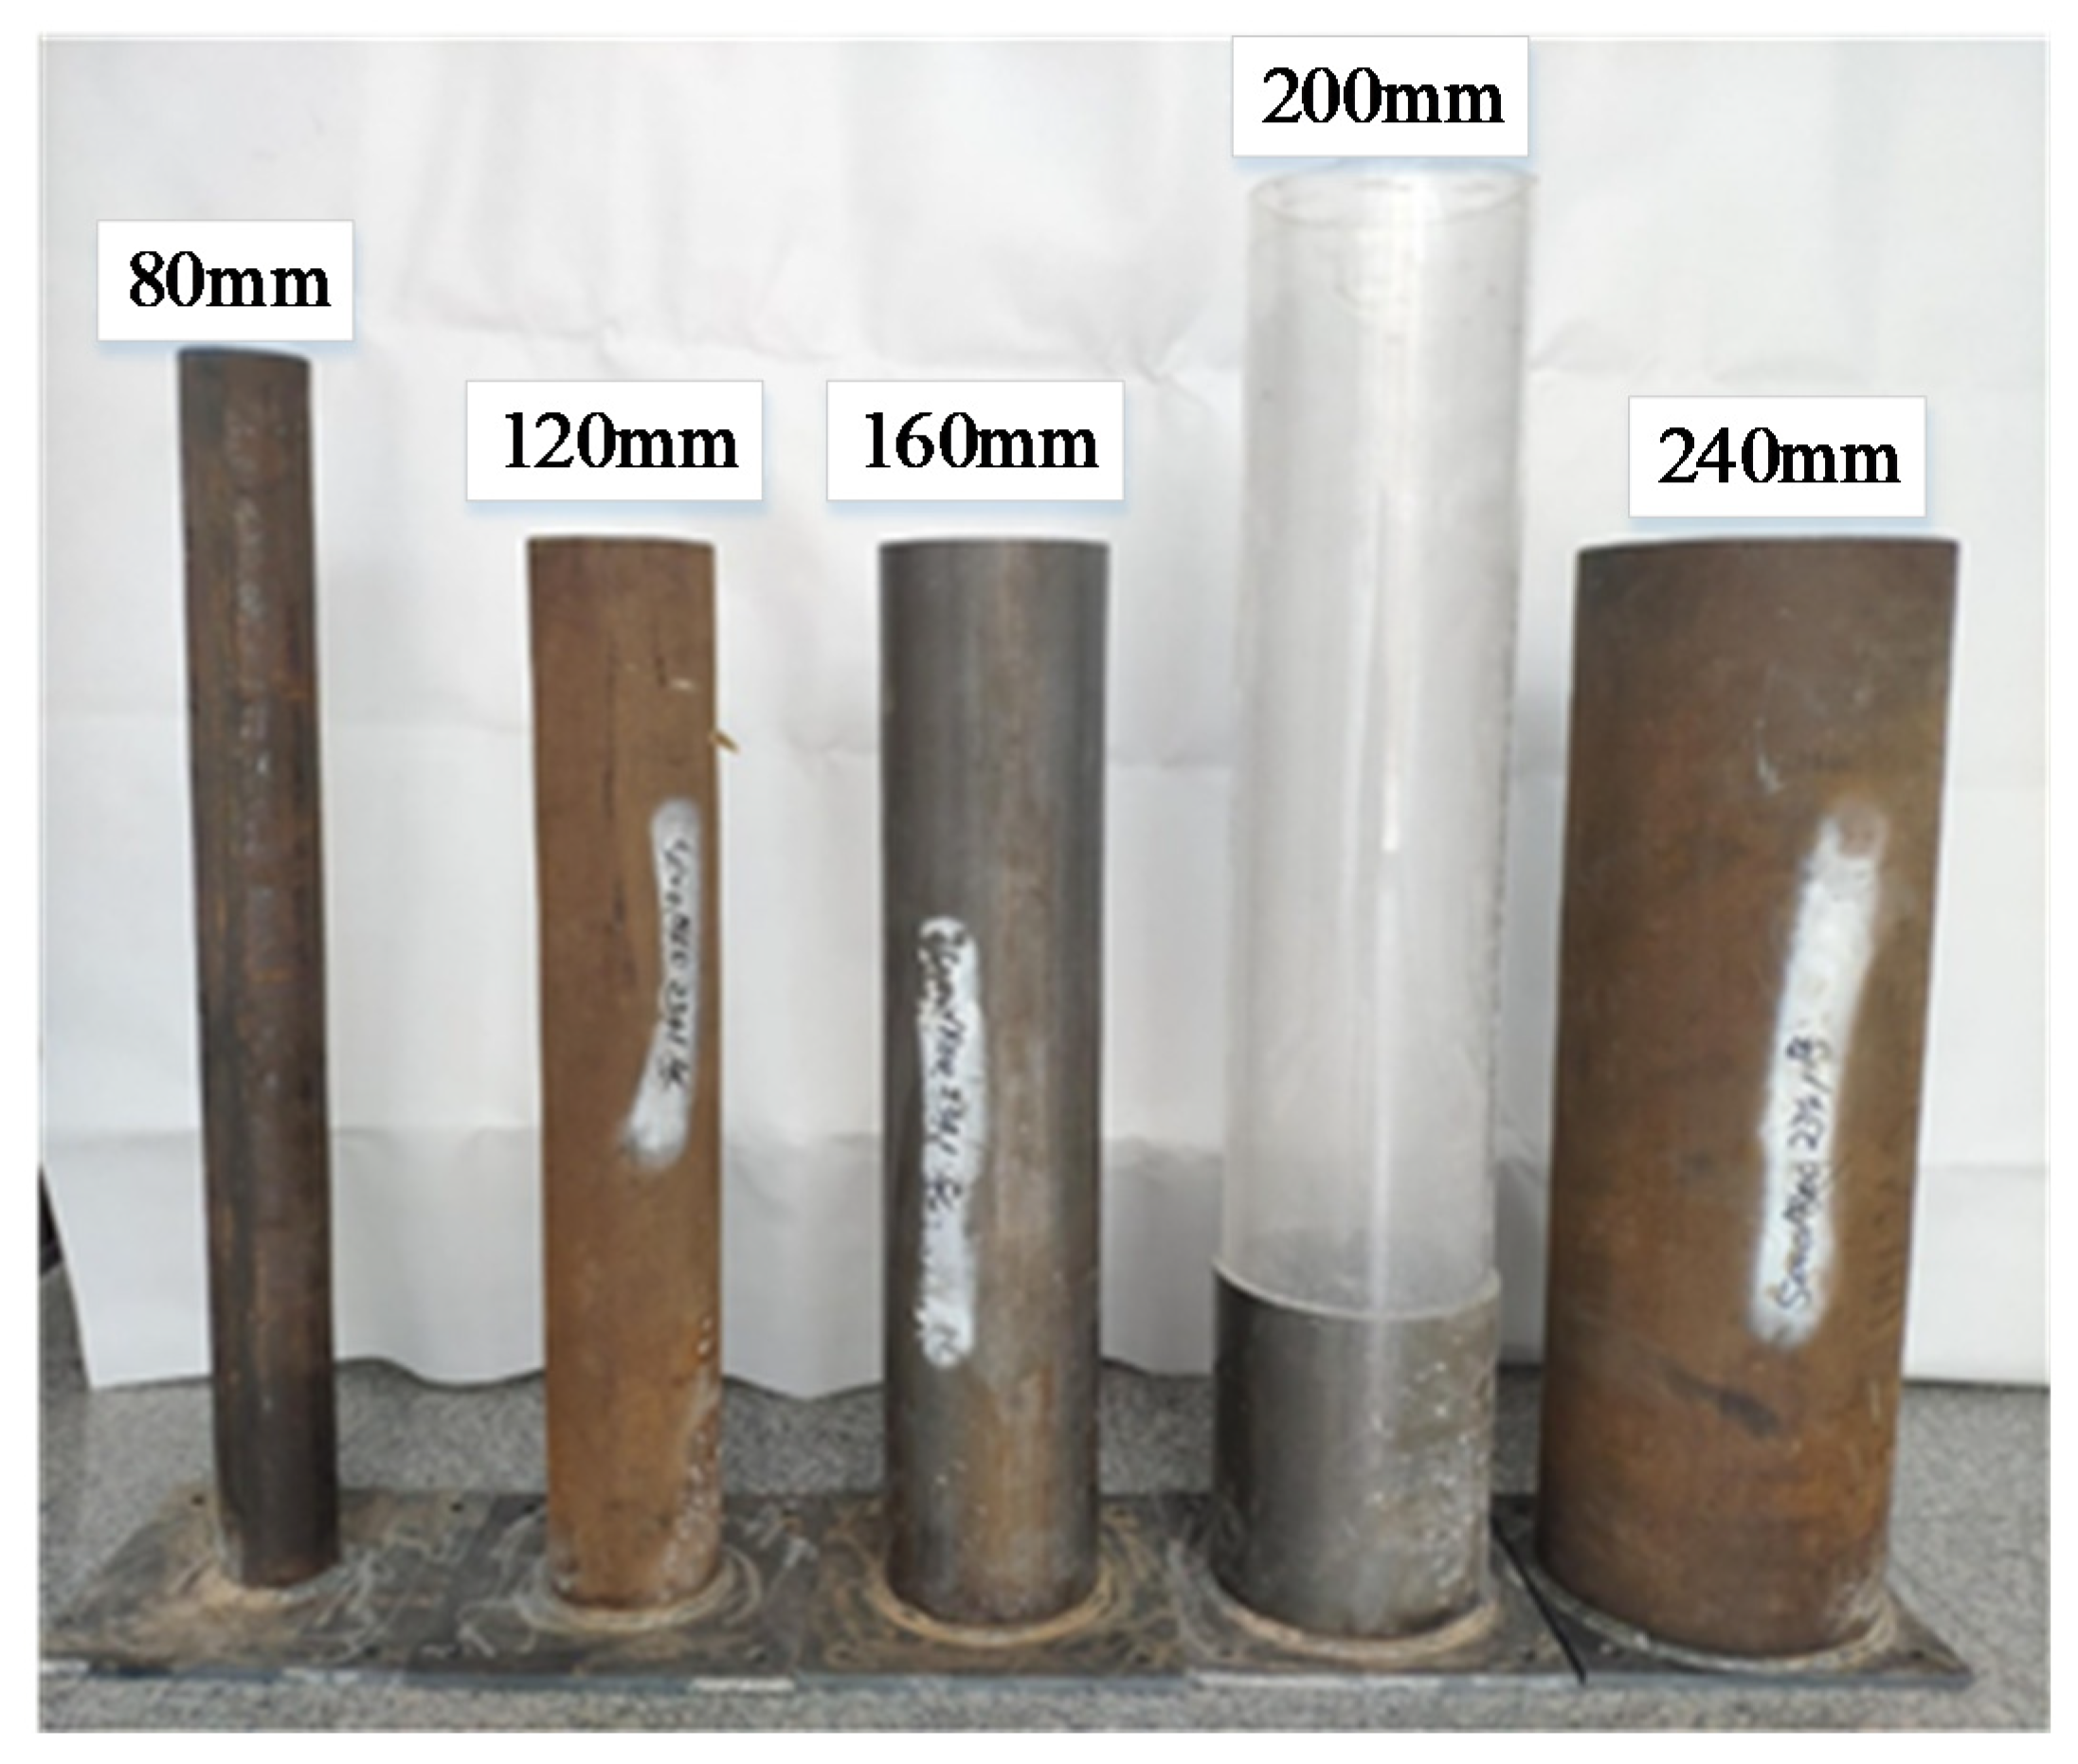
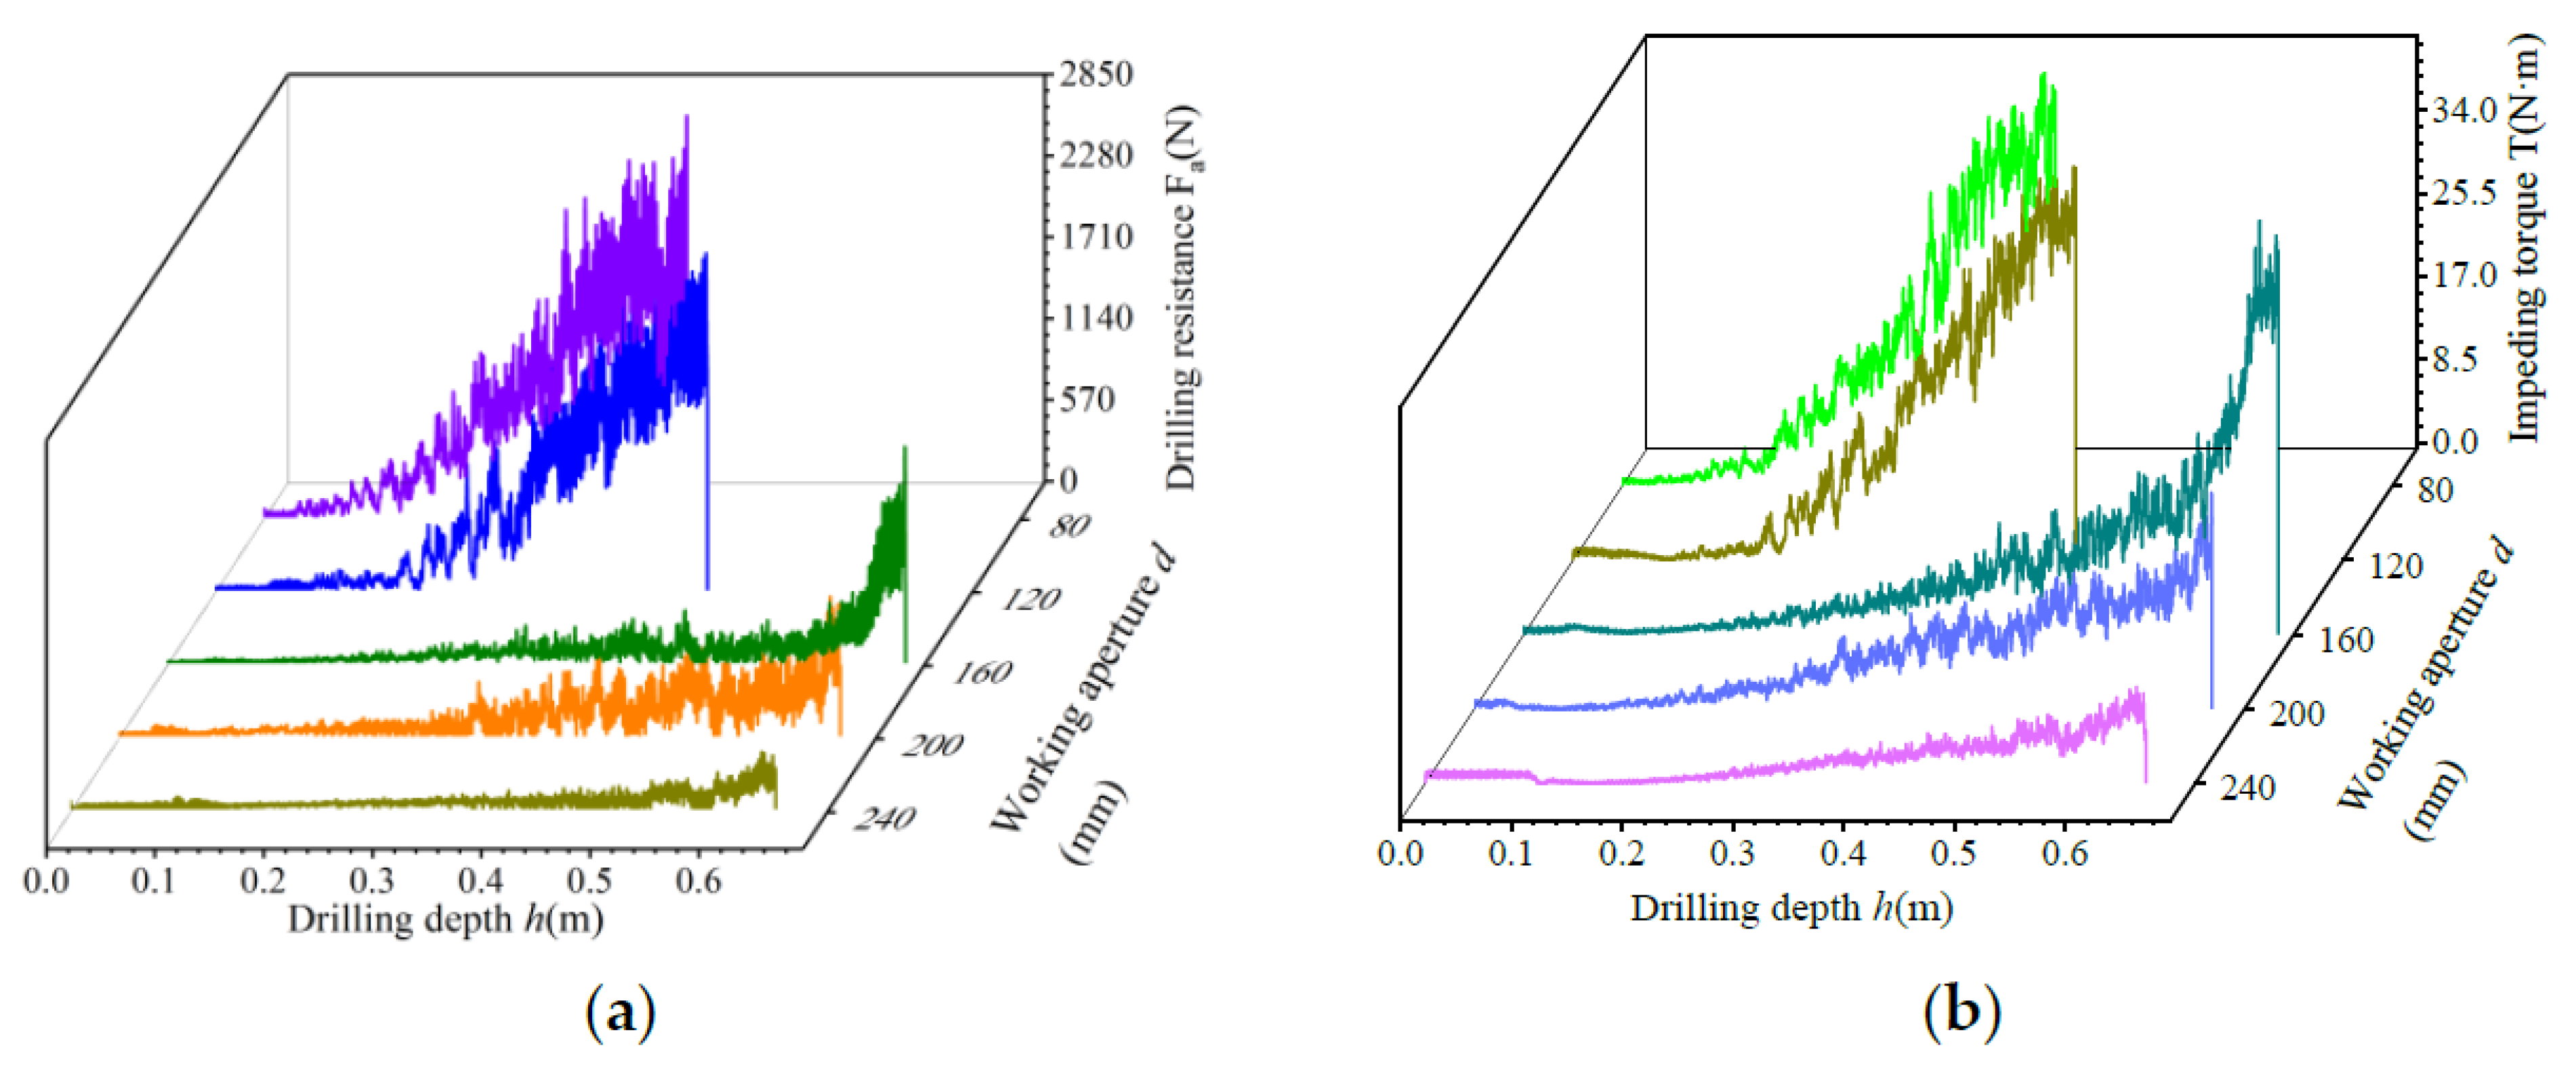
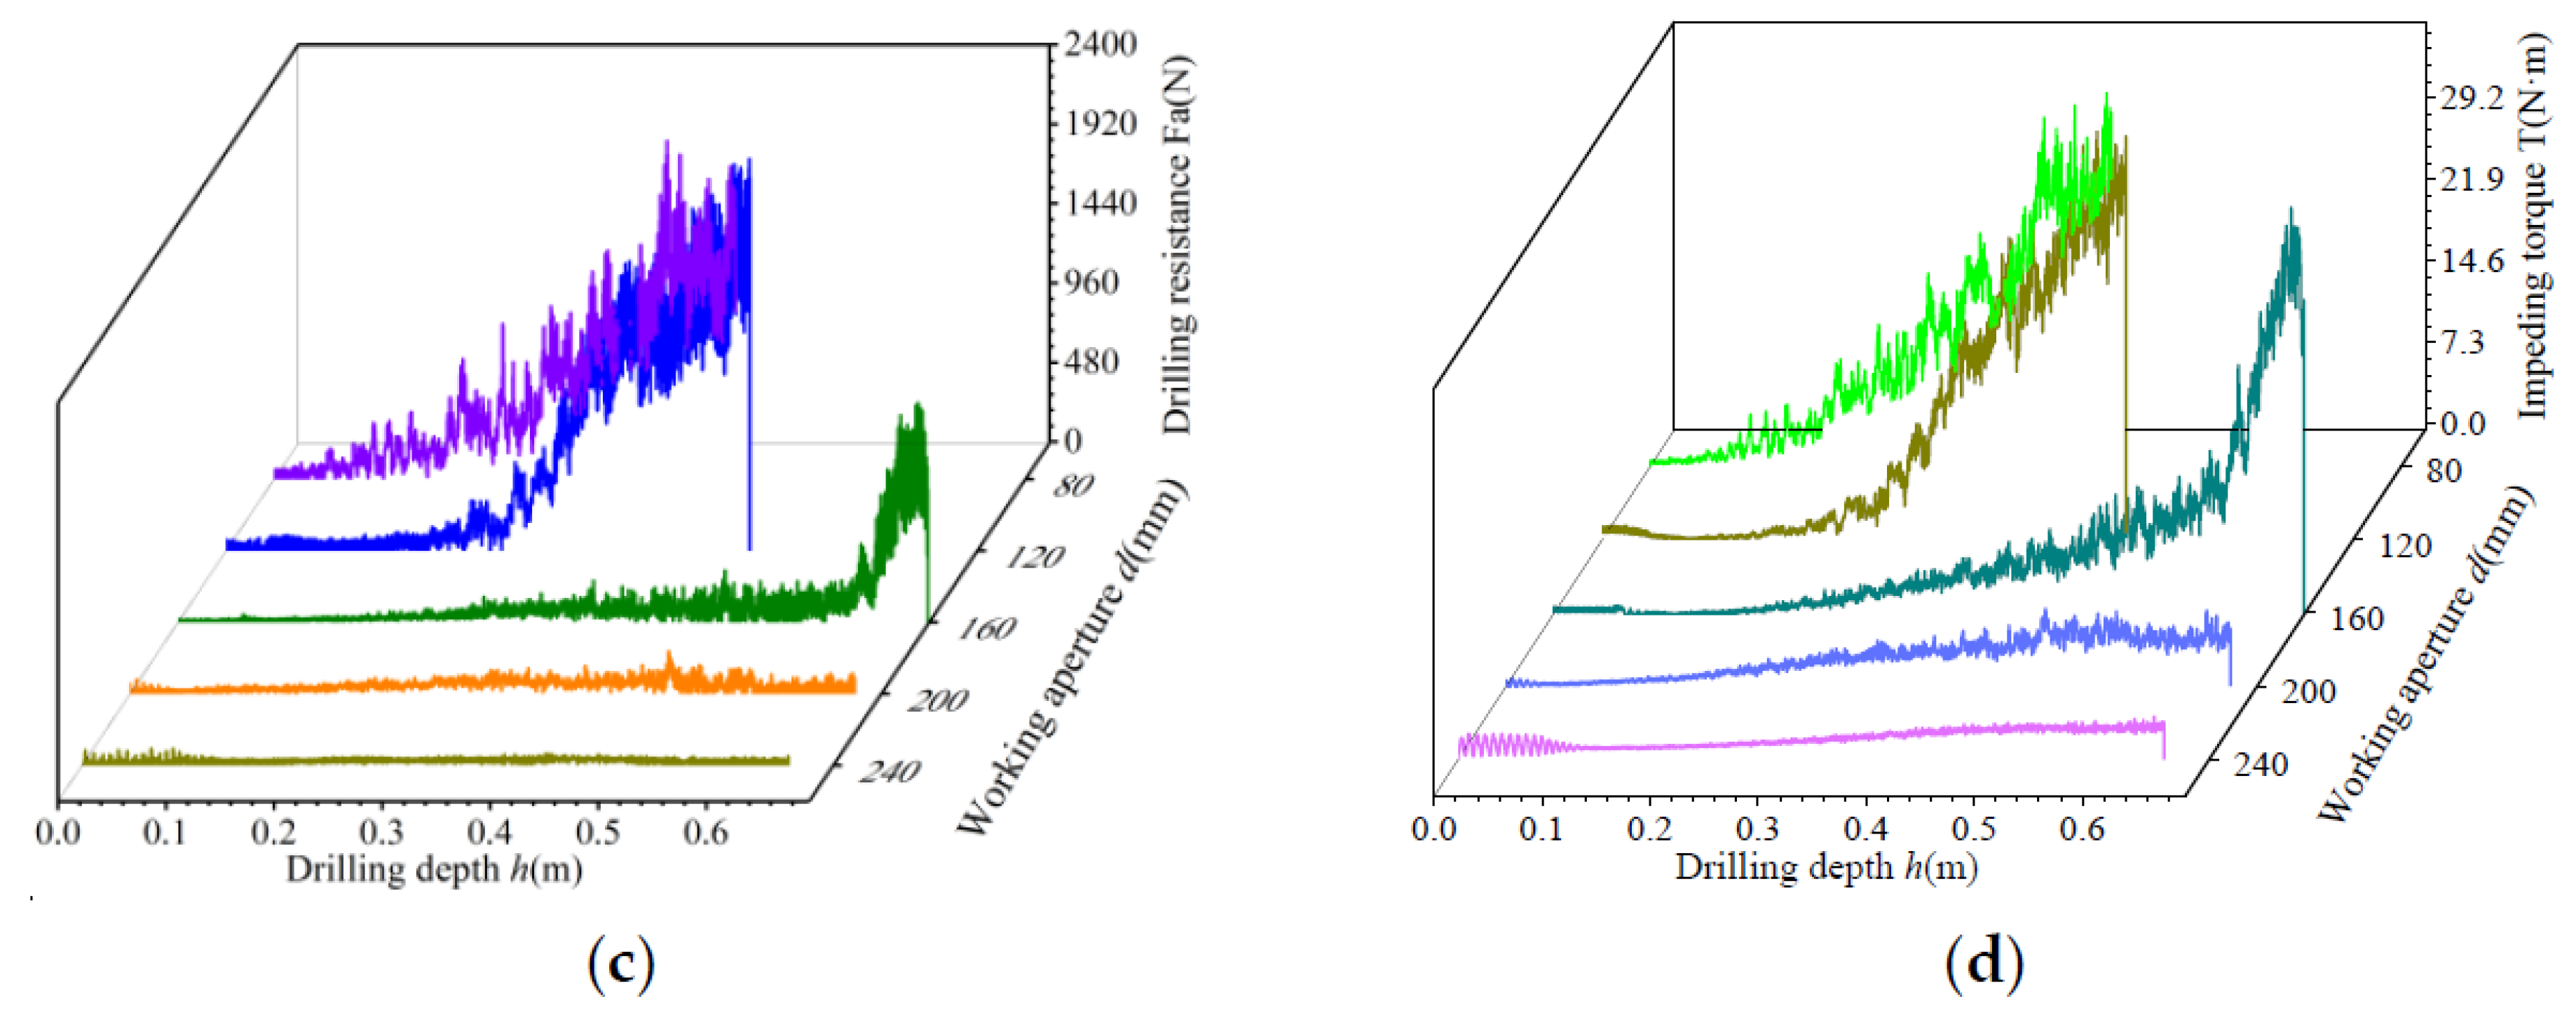
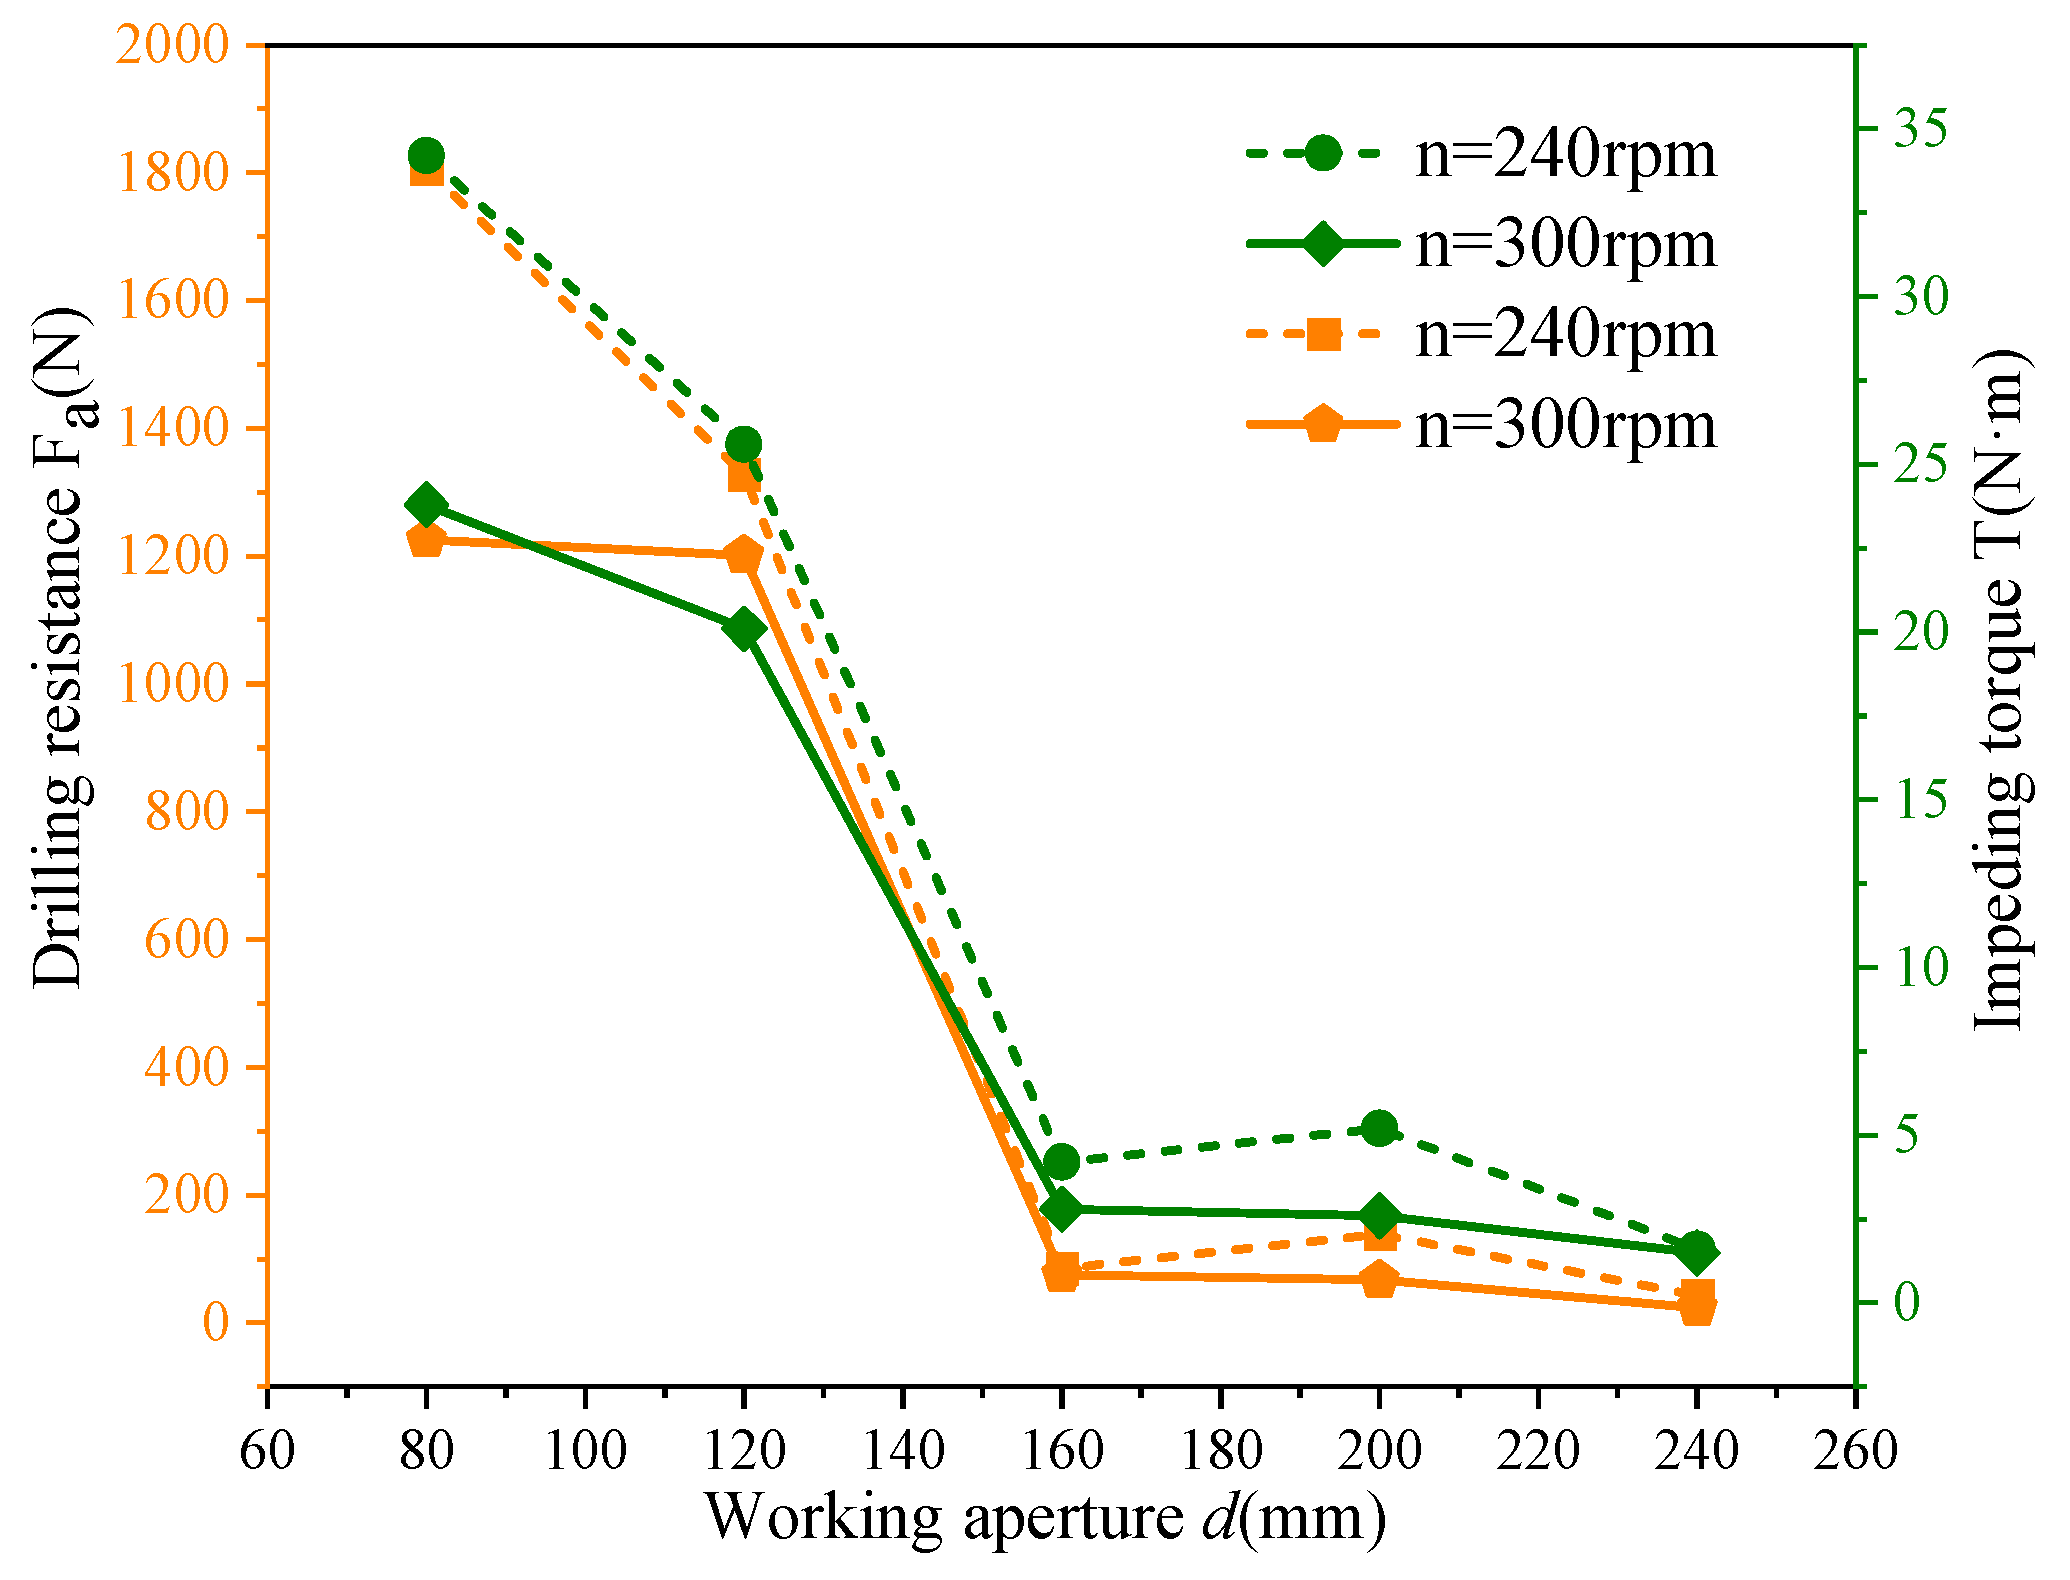
3.4. Working Aperture
4. Conclusions
- (1)
- Affected by using the spiral shape of the drill anchor rod, the axial velocity is negatively correlated with the drilling resistance of the bit anchor cable, and the effects are compared to confirm the correctness of the simulation. The pitch of the bit anchor thread has a hump-shaped relationship with drilling resistance. When the slope is much less than 450 mm, the drilling resistance can be decreased with the aid of appropriately lowering the pitch of the bit anchor cable;
- (2)
- The feed speed is positively correlated with the resistance encountered during drilling; the degree of influence of the anchor cable on the particles in the hole is inversely correlated with the feed rate during drilling. The slope of the drilling resistance fitting line is positively correlated with the feed velocity, and the smaller the axial speed, the stronger the positive correlation between the slope and the feed speed;
- (3)
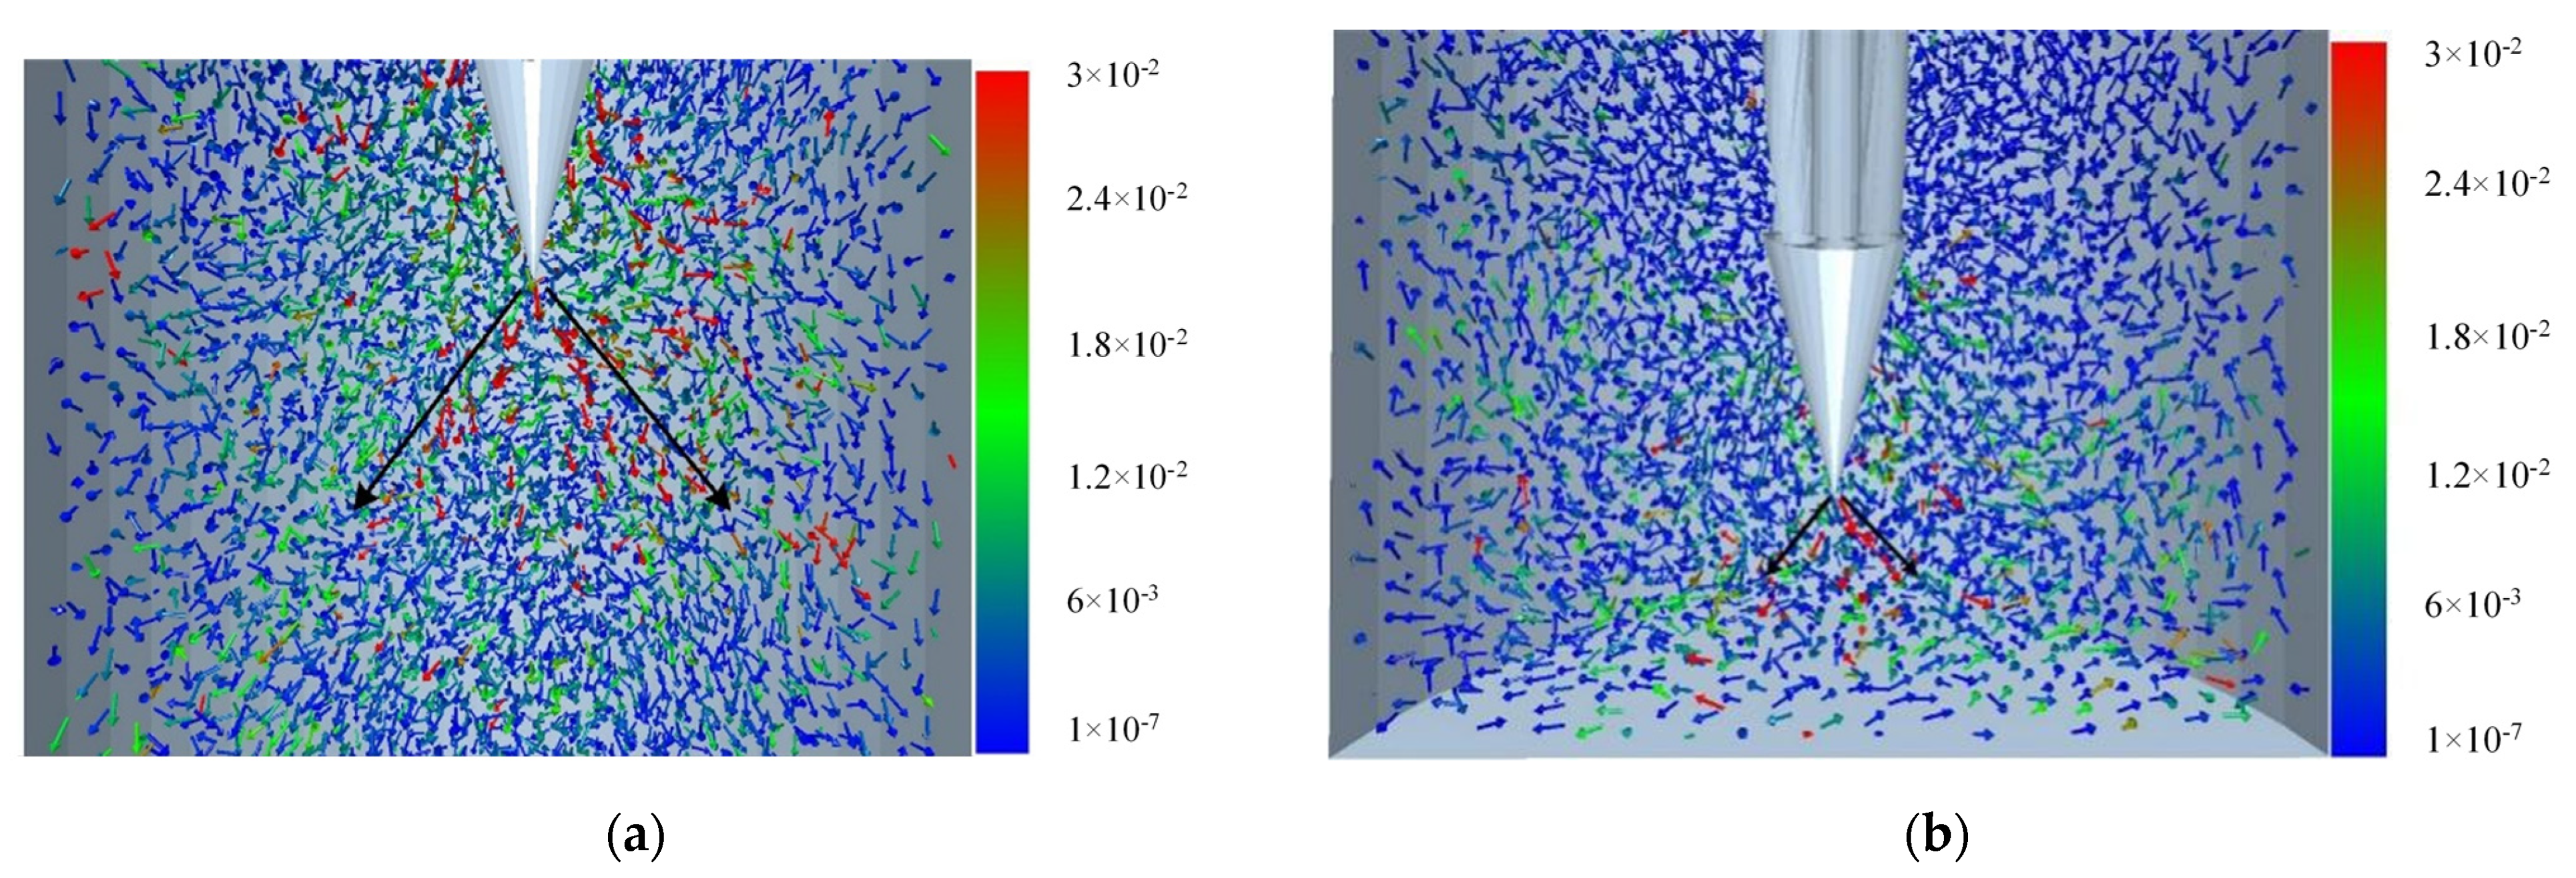
- As the aperture increases, the drilling resistance and the hindering torque of the drill anchor cable gradually decrease. When the bit is 0.2 m away from the bottom of the hole, the particle velocity vector at the lower end of the bit shows an evident conical distribution, and the particles diffuse horizontally. When the bit is 0.05 m from the bottom of the hole, the number of particles that diffuse laterally decreases sharply.
Author Contributions
Funding
Institutional Review Board Statement
Informed Consent Statement
Data Availability Statement
Conflicts of Interest
References
- Hao, W.D.; Tao, D. Research on Deformation Control Technology of Broken Soft Rock Pre-mining Roadway. IOP Conf. Ser. Earth Environ. Sci. 2019, 358, 042047. [Google Scholar] [CrossRef]
- Gao, Y.; Wang, C.; Liu, Y.; Wang, Y.; Han, L. Deformation mechanism and surrounding rock control in high-stress soft rock roadway: A case study. Adv. Civ. Eng. 2021, 2021, 9950391. [Google Scholar] [CrossRef]
- Sun, Y.; Li, G.; Zhang, J.; Xu, J. Failure mechanisms of rheological coal roadway. Sustainability 2020, 12, 1885. [Google Scholar] [CrossRef] [Green Version]
- Xu, Y.; Pan, K.; Zhang, H. Investigation of critical techniques on floor roadway support under the impacts of superimposed mining: Theoretical analysis and field study. Environ. Earth Sci. 2019, 78, 436. [Google Scholar] [CrossRef]
- Shi, K.; Wu, X.; Tian, Y.; Xie, X. Analysis of re-tensioning time of anchor cable based on new prestress loss model. Mathematics 2021, 9, 1094. [Google Scholar] [CrossRef]
- Yang, Z.P.; Li, S.Q.; Yu, Y.; Liu, X.; Hu, Y. Study on the variation characteristics of the anchor cable prestress based on field monitoring in a foundation pit. Arab. J. Geosci. 2020, 13, 1269. [Google Scholar] [CrossRef]
- Cooley, R.L.; Barkmeier, W.W. Temperature rise in the pulp chamber caused by twist drills. J. Prosthet. Dent. 1980, 44, 426–429. [Google Scholar] [CrossRef]
- Saha, S.; Pal, S.; Albright, J.A. Surgical drilling: Design and performance of an improved drill. J. Biomech. Eng. Trans. Asme 1982, 104, 245–252. [Google Scholar] [CrossRef]
- Kim, K.W.; Ahn, T.K. Force Prediction and Stress Analysis of a Twist Drill from Tool Geometry and Cutting Conditions. Int. J. Precis. Eng. Manuf. 2005, 6, 65–72. [Google Scholar]
- Zhang, Q.; Wang, J. Geometry, specification, and drilling performance of a plane rake-faced drill point design. Proc. Inst. Mech. Eng. Part C J. Mech. Eng. Sci. 2010, 224, 369–378. [Google Scholar] [CrossRef]
- Šporin, J.; Mrvar, P.; Petrič, M.; Vižintin, G.; Vukelić, Z. The characterization of wear in roller cone drill bit by rock material—Sandstone. J. Pet. Sci. Eng. 2018, 173, 1355–1367. [Google Scholar] [CrossRef]
- Yakym, R.S.; Petryna, D.Y. Analysis of Causes and Preventing Ways of Early Workability Loss of Three-Cone Rock Bit Cutters. Met. Adv. Technol. 2020, 42, 731–751. [Google Scholar] [CrossRef]
- Porin, J.; Balako, T.; Mrvar, P.; Janc, B.; Vukeli, E. Change of the Properties of Steel Material of the Roller Cone Bit Due to the Influence of the Drilling Operational Parameters and Rock Properties. Energies 2020, 13, 5949. [Google Scholar]
- Moura, J.D.; Xiao, Y.; Yang, J.; Butt, S.D. An empirical model for the drilling performance prediction for roller-cone drill bits. J. Pet. Sci. Eng. 2021, 10, 3287. [Google Scholar] [CrossRef]
- Utter, B.; Behringer, R.P. Transients in sheared granular matter. Eur. Phys. J. 2004, 14, 373–380. [Google Scholar] [CrossRef]
- Antony, S.J.; Kruyt, N.P. Role of interparticle friction and particle-scale elasticity in the shear-strength mechanism of three-dimensional granular media. Phys. Rev. E 2009, 79, 031308. [Google Scholar] [CrossRef] [Green Version]
- Barreto, D.; O’Sullivan, C. The influence of inter-particle friction and the intermediate stress ratio on soil response under generalized stress conditions. Granul. Matter 2012, 14, 505–521. [Google Scholar] [CrossRef] [Green Version]
- Senetakis, K.; Sandeep, C.S.; Todisco, M.C. Dynamic inter-particle friction of crushed limestone surfaces. Tribol. Int. 2017, 111, 1–8. [Google Scholar] [CrossRef]
- Sandeep, C.S.; Senetakis, K. Effect of Young’s Modulus and Surface Roughness on the Inter-Particle Friction of Granular Materials. Materials 2018, 11, 217. [Google Scholar] [CrossRef] [Green Version]
- Cundall, P.A.; Strack, O.D.L. A discrete numerical model for granular assemblies. Geotechnique 2008, 30, 331–336. [Google Scholar] [CrossRef] [Green Version]
- Cundall, P.A. The measurement and Analysis of accelerations in rock slopes. Ph.D. Thesis, University of London: Imperial College of Science and Technology, London, UK, 1971. [Google Scholar]
- Ren, W.J.; Wang, L.; Mao, Q.H.; Jiang, S.B.; Huang, S. Coupling Properties of Chain Drive System under Various and Eccentric Loads. Int. J. Simul. Model. 2020, 19, 643–654. [Google Scholar] [CrossRef]
- Jiang, S.B.; Huang, S.; Zeng, Q.L. Dynamic properties of chain drive system considering multiple impact factors. Int. J. Simul. Model 2022, 21, 284–295. [Google Scholar] [CrossRef]
- Shi, S.; Gao, L.; Xiao, H.; Xu, Y.; Yin, H. Research on ballast breakage under tamping operation based on DEM–MBD coupling approach. Constr. Build. Mater. 2021, 272, 121810. [Google Scholar] [CrossRef]
- Chen, Z.; Xue, D.; Wang, G.; Cui, D.; Fang, Y.; Wang, S. Simulation and optimization of the tracked chassis performance of electric shovel based on DEM-MBD. Powder Technol. 2021, 390, 428–441. [Google Scholar] [CrossRef]


| G (GPa) | Ρ (kg/m3) | σ | μR | η | μS | ||
|---|---|---|---|---|---|---|---|
| Gravel | 11 | 2700 | 0.29 | Gravel—Gravel | 0.2 | 0.62 | 0.74 |
| Anchor cable | 8.02 | 7801 | 0.29 | Gravel—Anchor cable | 0.25 | 0.42 | 0.49 |
| Axial Speed/rpm | Feed Rate/(m/s) | Anchor Cable Pitch/mm | Working Aperture/mm |
|---|---|---|---|
| 0, 120, 240, 360 | 0.03, 0.06, 0.09, 0.12 | 140, 240, 340, 440, 540 | 80, 120, 160, 200, 240 |
| Rotating Speed (rpm) | Feeding Rate (m/s) | Fitting Straight Line Slope | Rotating Speed (rpm) | Feeding Rate (m/s) | Fitting Straight Line Slope |
|---|---|---|---|---|---|
| 0 | 0.03 | 698 | 240 | 0.03 | 272 |
| 0 | 0.06 | 933 | 240 | 0.06 | 381 |
| 0 | 0.09 | 1153 | 240 | 0.09 | 475 |
| 0 | 0.12 | 1413 | 240 | 0.12 | 555 |
| 120 | 0.03 | 374 | 360 | 0.03 | 222 |
| 120 | 0.06 | 595 | 360 | 0.06 | 254 |
| 120 | 0.09 | 747 | 360 | 0.09 | 328 |
| 120 | 0.12 | 908 | 360 | 0.12 | 405 |
| Feeding Rates (m/s) | Axial Speed (rpm) | Aperture (mm) | Particle Depth in the Hole (mm) |
|---|---|---|---|
| 0.01 | 240, 300 | 80, 120, 160, 200, 240 | 800 |
Disclaimer/Publisher’s Note: The statements, opinions and data contained in all publications are solely those of the individual author(s) and contributor(s) and not of MDPI and/or the editor(s). MDPI and/or the editor(s) disclaim responsibility for any injury to people or property resulting from any ideas, methods, instructions or products referred to in the content. |
© 2023 by the authors. Licensee MDPI, Basel, Switzerland. This article is an open access article distributed under the terms and conditions of the Creative Commons Attribution (CC BY) license (https://creativecommons.org/licenses/by/4.0/).
Share and Cite
Gao, K.; Liu, J.; Chen, H.; Li, X.; Huang, S. Dynamic Characteristics of Rock Holes with Gravel Sediment Drilled by Bit Anchor Cable Drilling. Sustainability 2023, 15, 5956. https://doi.org/10.3390/su15075956
Gao K, Liu J, Chen H, Li X, Huang S. Dynamic Characteristics of Rock Holes with Gravel Sediment Drilled by Bit Anchor Cable Drilling. Sustainability. 2023; 15(7):5956. https://doi.org/10.3390/su15075956
Chicago/Turabian StyleGao, Kuidong, Jihai Liu, Hong Chen, Xu Li, and Shuan Huang. 2023. "Dynamic Characteristics of Rock Holes with Gravel Sediment Drilled by Bit Anchor Cable Drilling" Sustainability 15, no. 7: 5956. https://doi.org/10.3390/su15075956