Article

Design and Development of a Fog-Assisted Elephant Corridor over a Railway Track

1
Department of Computer Science and Engineering, University of Kalyani, Kalyani 741235, India
2
Department of Computer Science and Engineering, Kalyani Government Engineering College, Kalyani 741235, India
3
Department of Computer Science Electrical Engineering and Mathematical Sciences, Western Norway University of Applied Sciences, 5063 Bergen, Norway
4
Computer Science Department, Community College, King Saud University, Riyadh 11437, Saudi Arabia
*
Author to whom correspondence should be addressed.
Sustainability 2023, 15(7), 5944; https://doi.org/10.3390/su15075944
Submission received: 10 January 2023 / Revised: 18 March 2023 / Accepted: 19 March 2023 / Published: 29 March 2023
(This article belongs to the Special Issue Trust Privacy and Security for Future Sustainable Smart Cities)

Abstract

:
Elephants are one of the largest animals on earth and are found in forests, grasslands and savannahs in the tropical and subtropical regions of Asia and Africa. A country like India, especially the northeastern region, is covered by deep forests and is home to many elephants. Railroads are an effective and inexpensive means of transporting goods and passengers in this region. Due to poor visibility in the forests, collisions between trains and elephants are increasing day by day. In the last ten years, more than 190 elephants died due to train accidents. The most effective solution to this collision problem is to stop the train immediately. To address this sensitive issue, a solution is needed to detect and monitor elephants near railroad tracks and analyze data from the camera trap near the intersection of elephant corridors and railroad tracks. In this paper, we have developed a fog computing-based framework that not only detects and monitors the elephants but also improves the latency, network utilization and execution time. The fog-enabled elephant monitoring system informs the train control system of the existence of elephants in the corridor and a warning light LED flashes near the train tracks. This system is deployed and simulated in the iFogSim simulator and shows improvements in latency, network utilization, and execution time compared to cloud-based infrastructures.

1. Introduction

Collisions between trains and wildlife are a major problem in India. Indian Railway (IR) operates one of the largest rail networks in the world with approximately 65,000 km of track and 7500 stations. The extensive network of railways crosses a number of forests around the world. This results in many collisions between trains and wildlife species on the rail line. Collisions between trains and elephants account for a large percentage of all collisions.
Wild animals travel great distances across the landscape daily, seasonally, and annually in search of food, drinking water, habitat, and mates [1]. Past agricultural expansion has most likely resulted in the loss and fragmentation of their native habitat. Transportation systems (railroads, roads, and wetlands) or so-called “linear infrastructure” impede the movement of wildlife populations in a growing industrialized world by fragmenting habitat, increasing boundary effects, constricting ecological corridors, impeding wildlife movement, and increasing mortality rates from direct collisions with motorized transport [2].
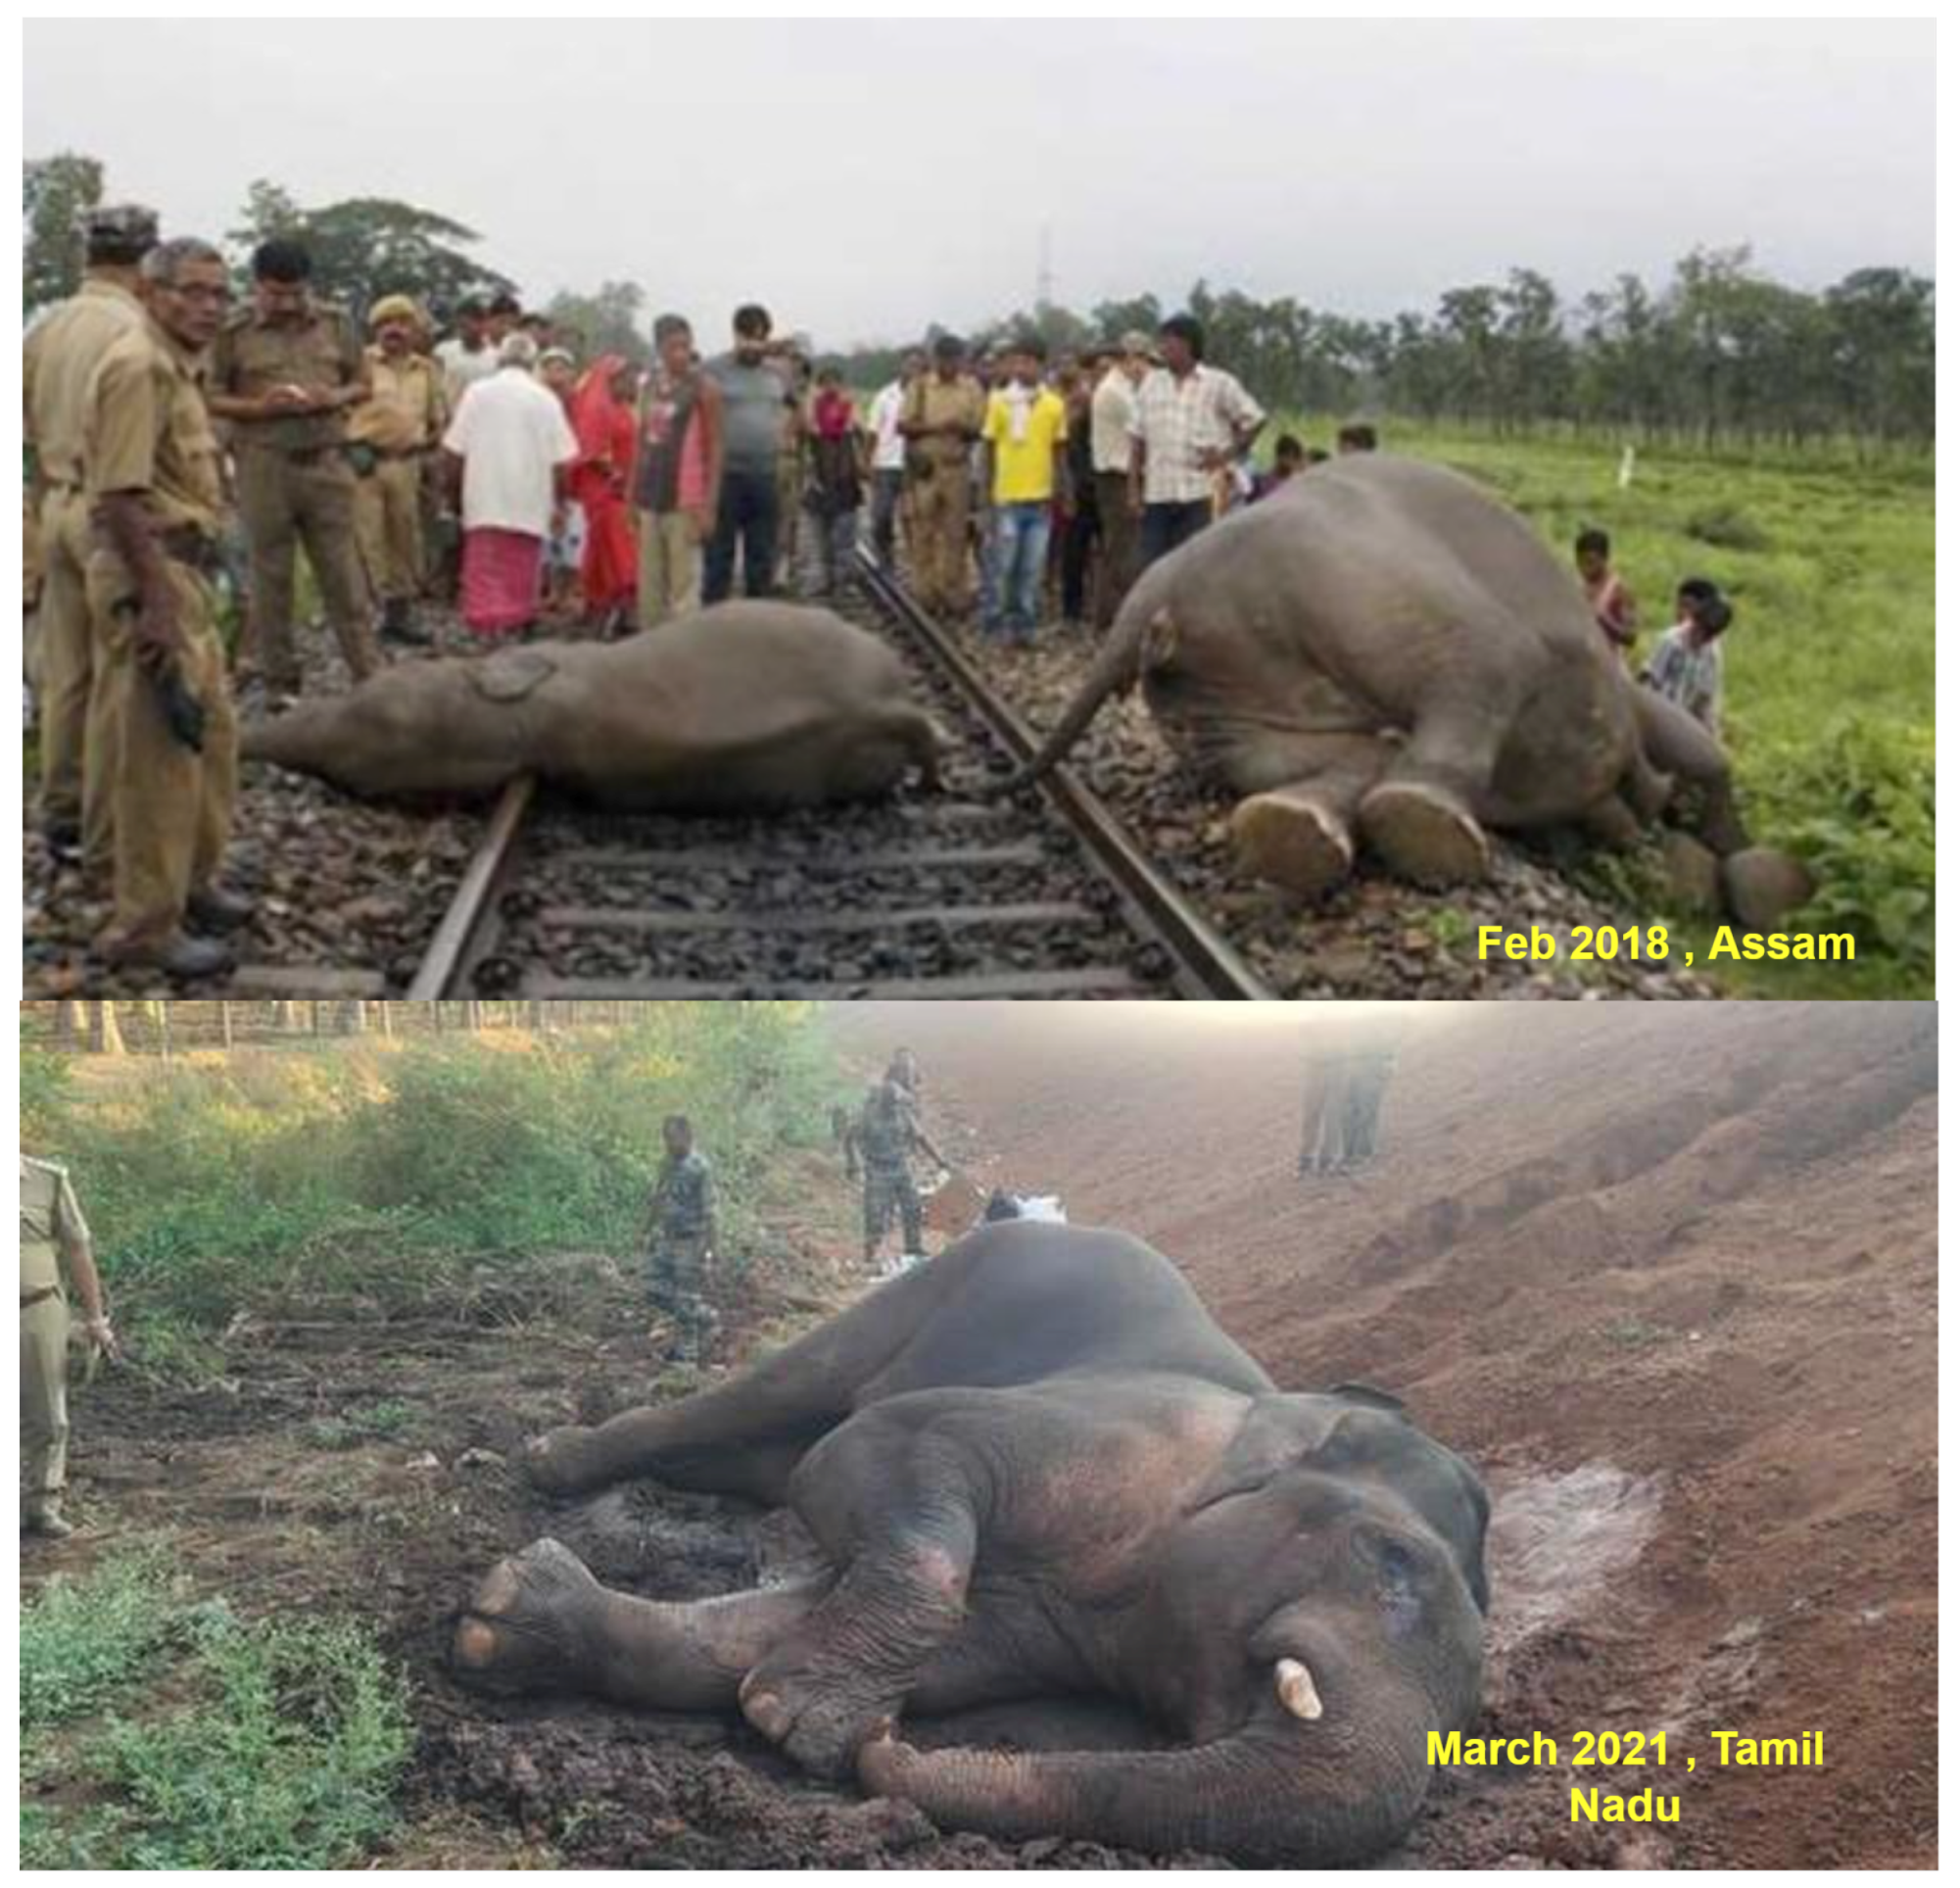
Figure 1 shows collisions between trains and elephants in Assam in 2018 and Tamil Nadu in 2021. Not only elephants but other wildlife have been killed by trains around the world. From 1988 to 1990, an estimated 200 moose–train collisions were recorded in British Columbia, Canada [3]. In 1980–1988, there were 266 collisions on the only 92-km railway track in Norway [4]. In addition, there were 725 collisions in Alaska in 9 years [5]. Kusta et al. [6] reported 69 accidents involving deer due to train collisions in the Czech Republic.
Collisions between trains and elephants are not uncommon along the railway track in the northern part of West Bengal between the Alipureduar–Siliguri route [9]. The Guwahati–Lumding line in Assam and Meghalaya [10], the Thrissur–Coimbatore line in Kerala and Tamil Nadu [11], and the Dehradun-Haridwar rail line in Uttrakhand [12] are also accident-prone zones. According to [13], a total of 186 elephants died from 2009–2010 to 2020–2021 due to running over trains on railway tracks. As shown in Table 1, West Bengal and Assam continue to be the hotspots of collisions today. Even in May 2020, an elephant was dead after being hit by a goods train in the Giridih district of Jharkhand [14]. According to the Indian government report, 45 elephants will be killed by trains between 2019 and 2021. In 2020, 16 elephants were killed by collisions with trains in India [15].
To reduce elephant deaths from the train–elephant collisions, we need to slow down trains near the elephant corridor [16]. To do this, we must alert train drivers to the presence of elephants near the rail line. Elephant monitoring and tracking is the only prominent solution to this problem. Continuous monitoring and tracking of elephants near the corridor require enormous computing capacity. The cloud is the only prominent solution to this problem. However, the major drawback of the cloud is latency. This latency is a common condition that has a significant impact on action times. The main backbone of the cloud is the data center. These data centers are geographically distributed across the globe [
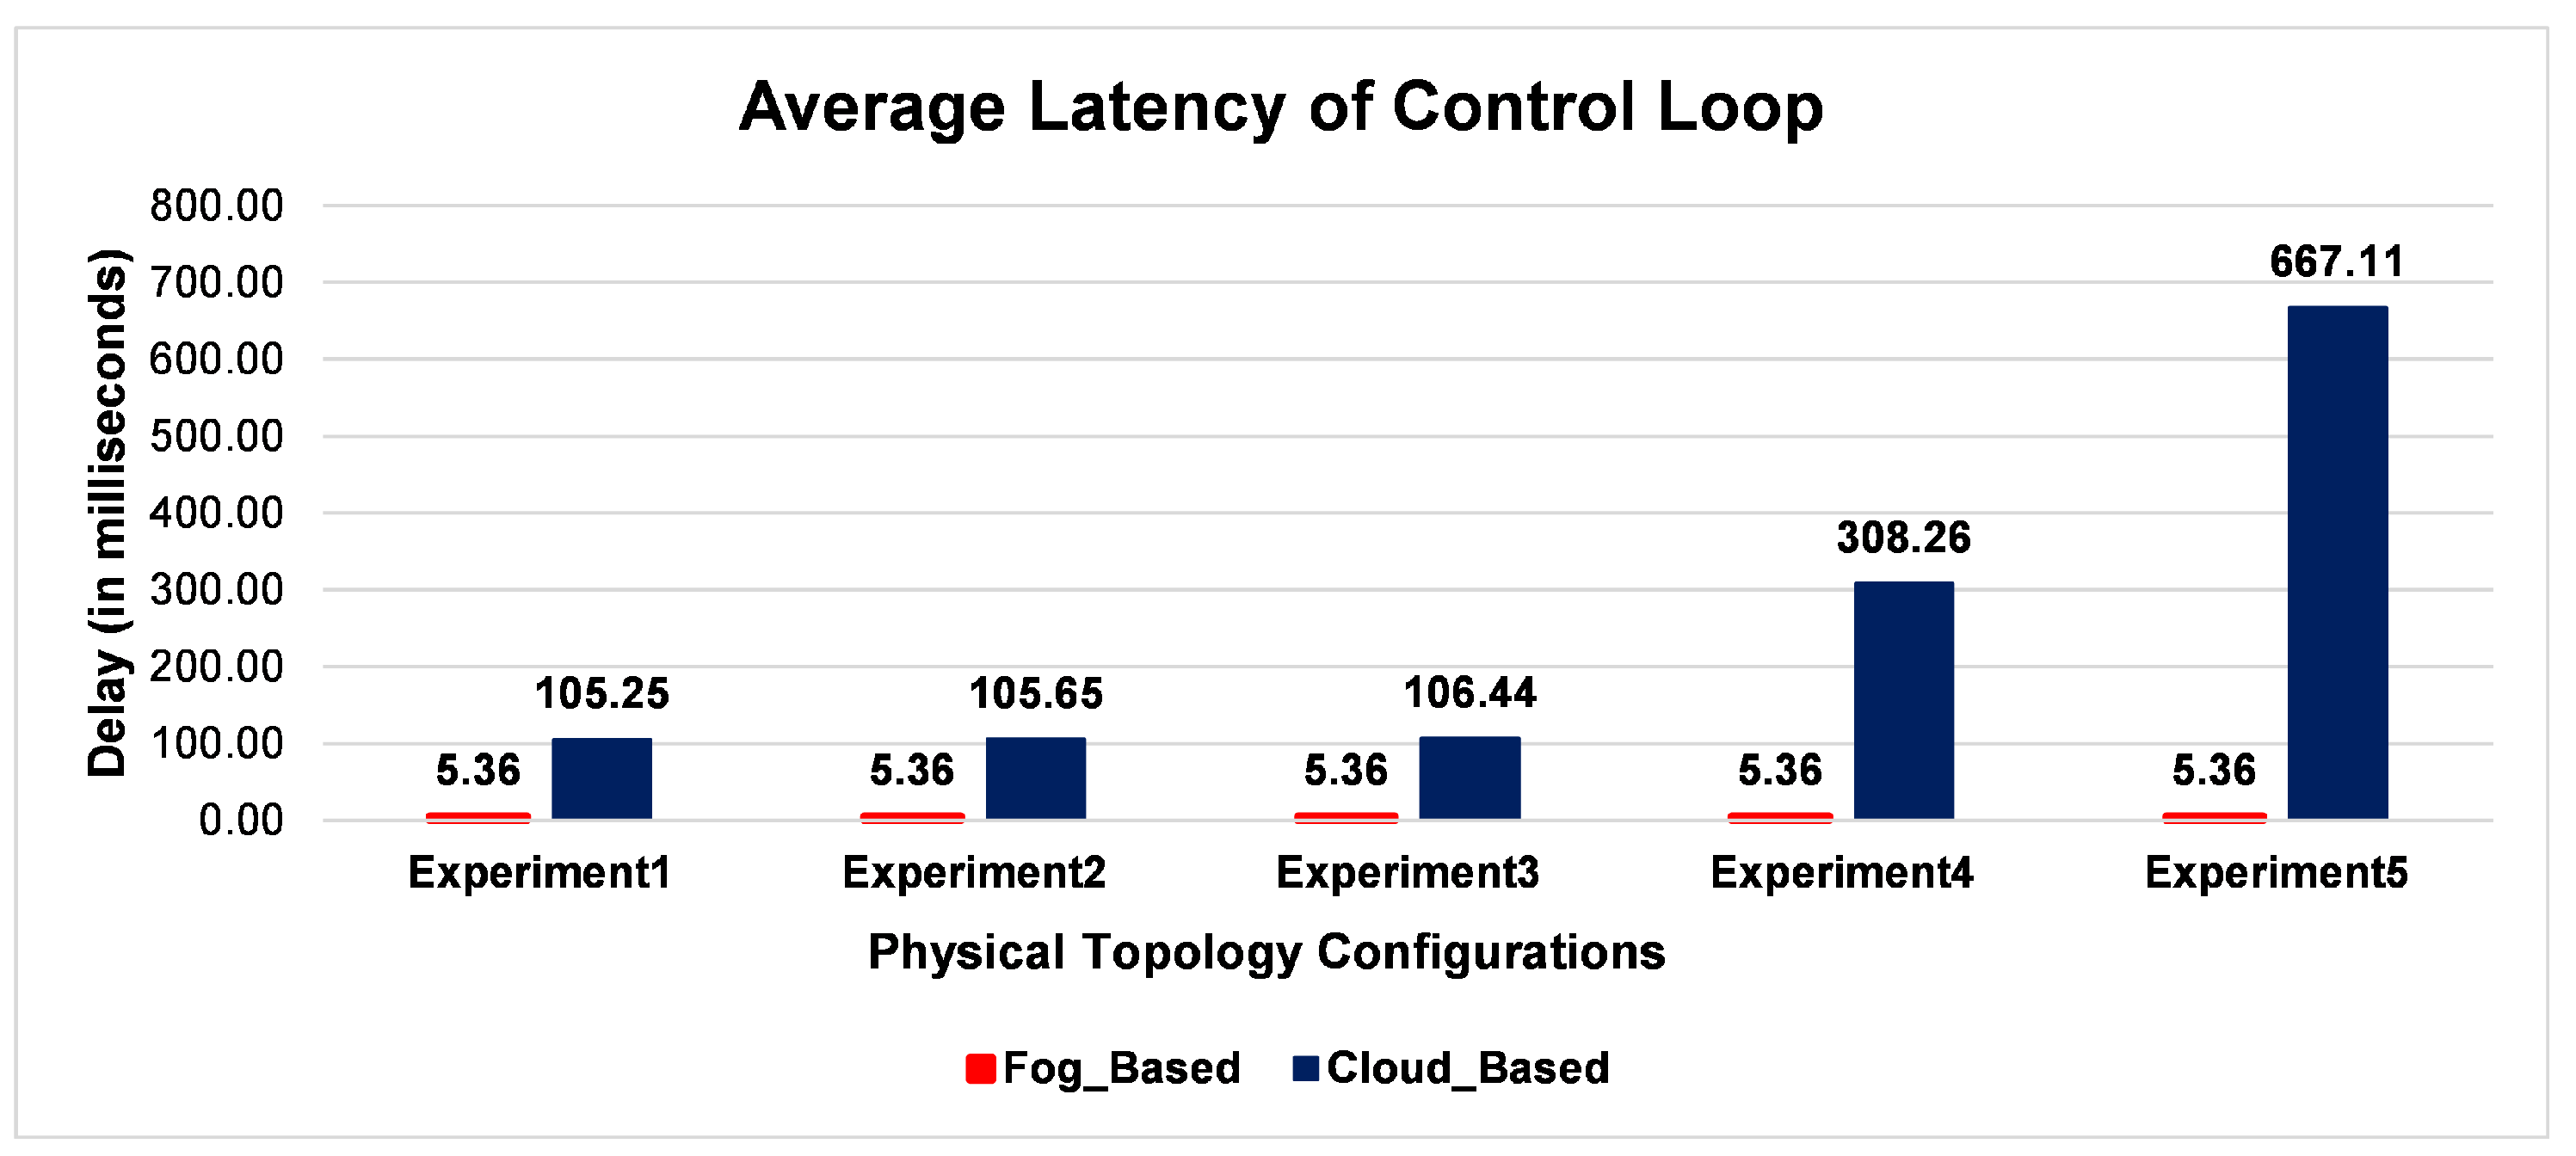
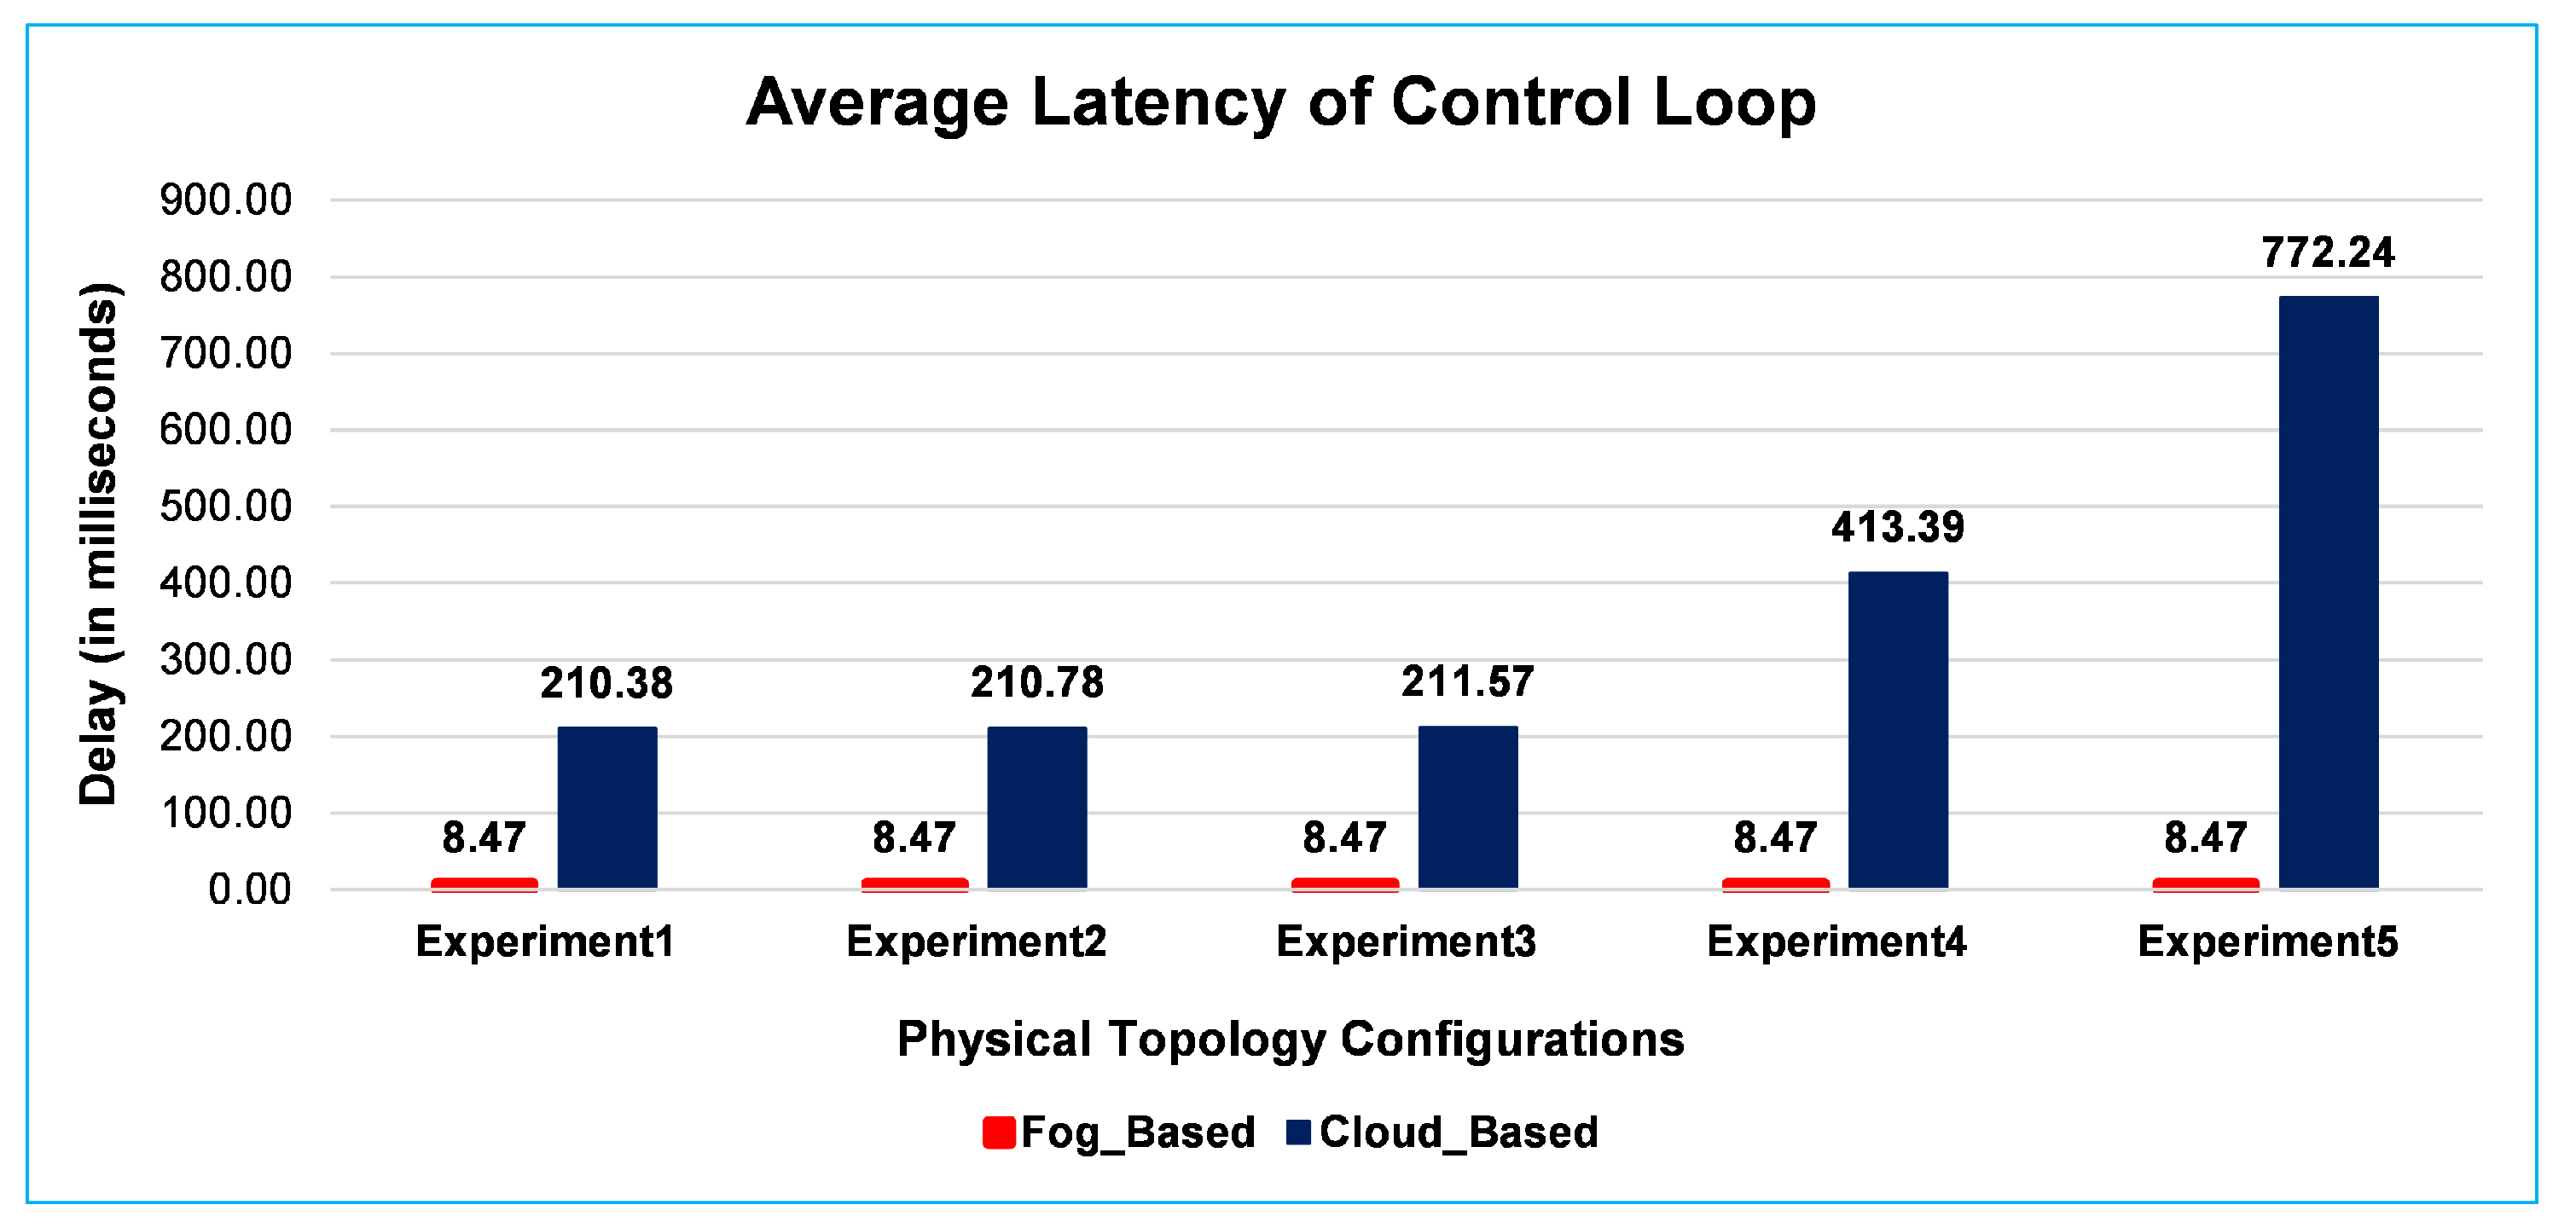
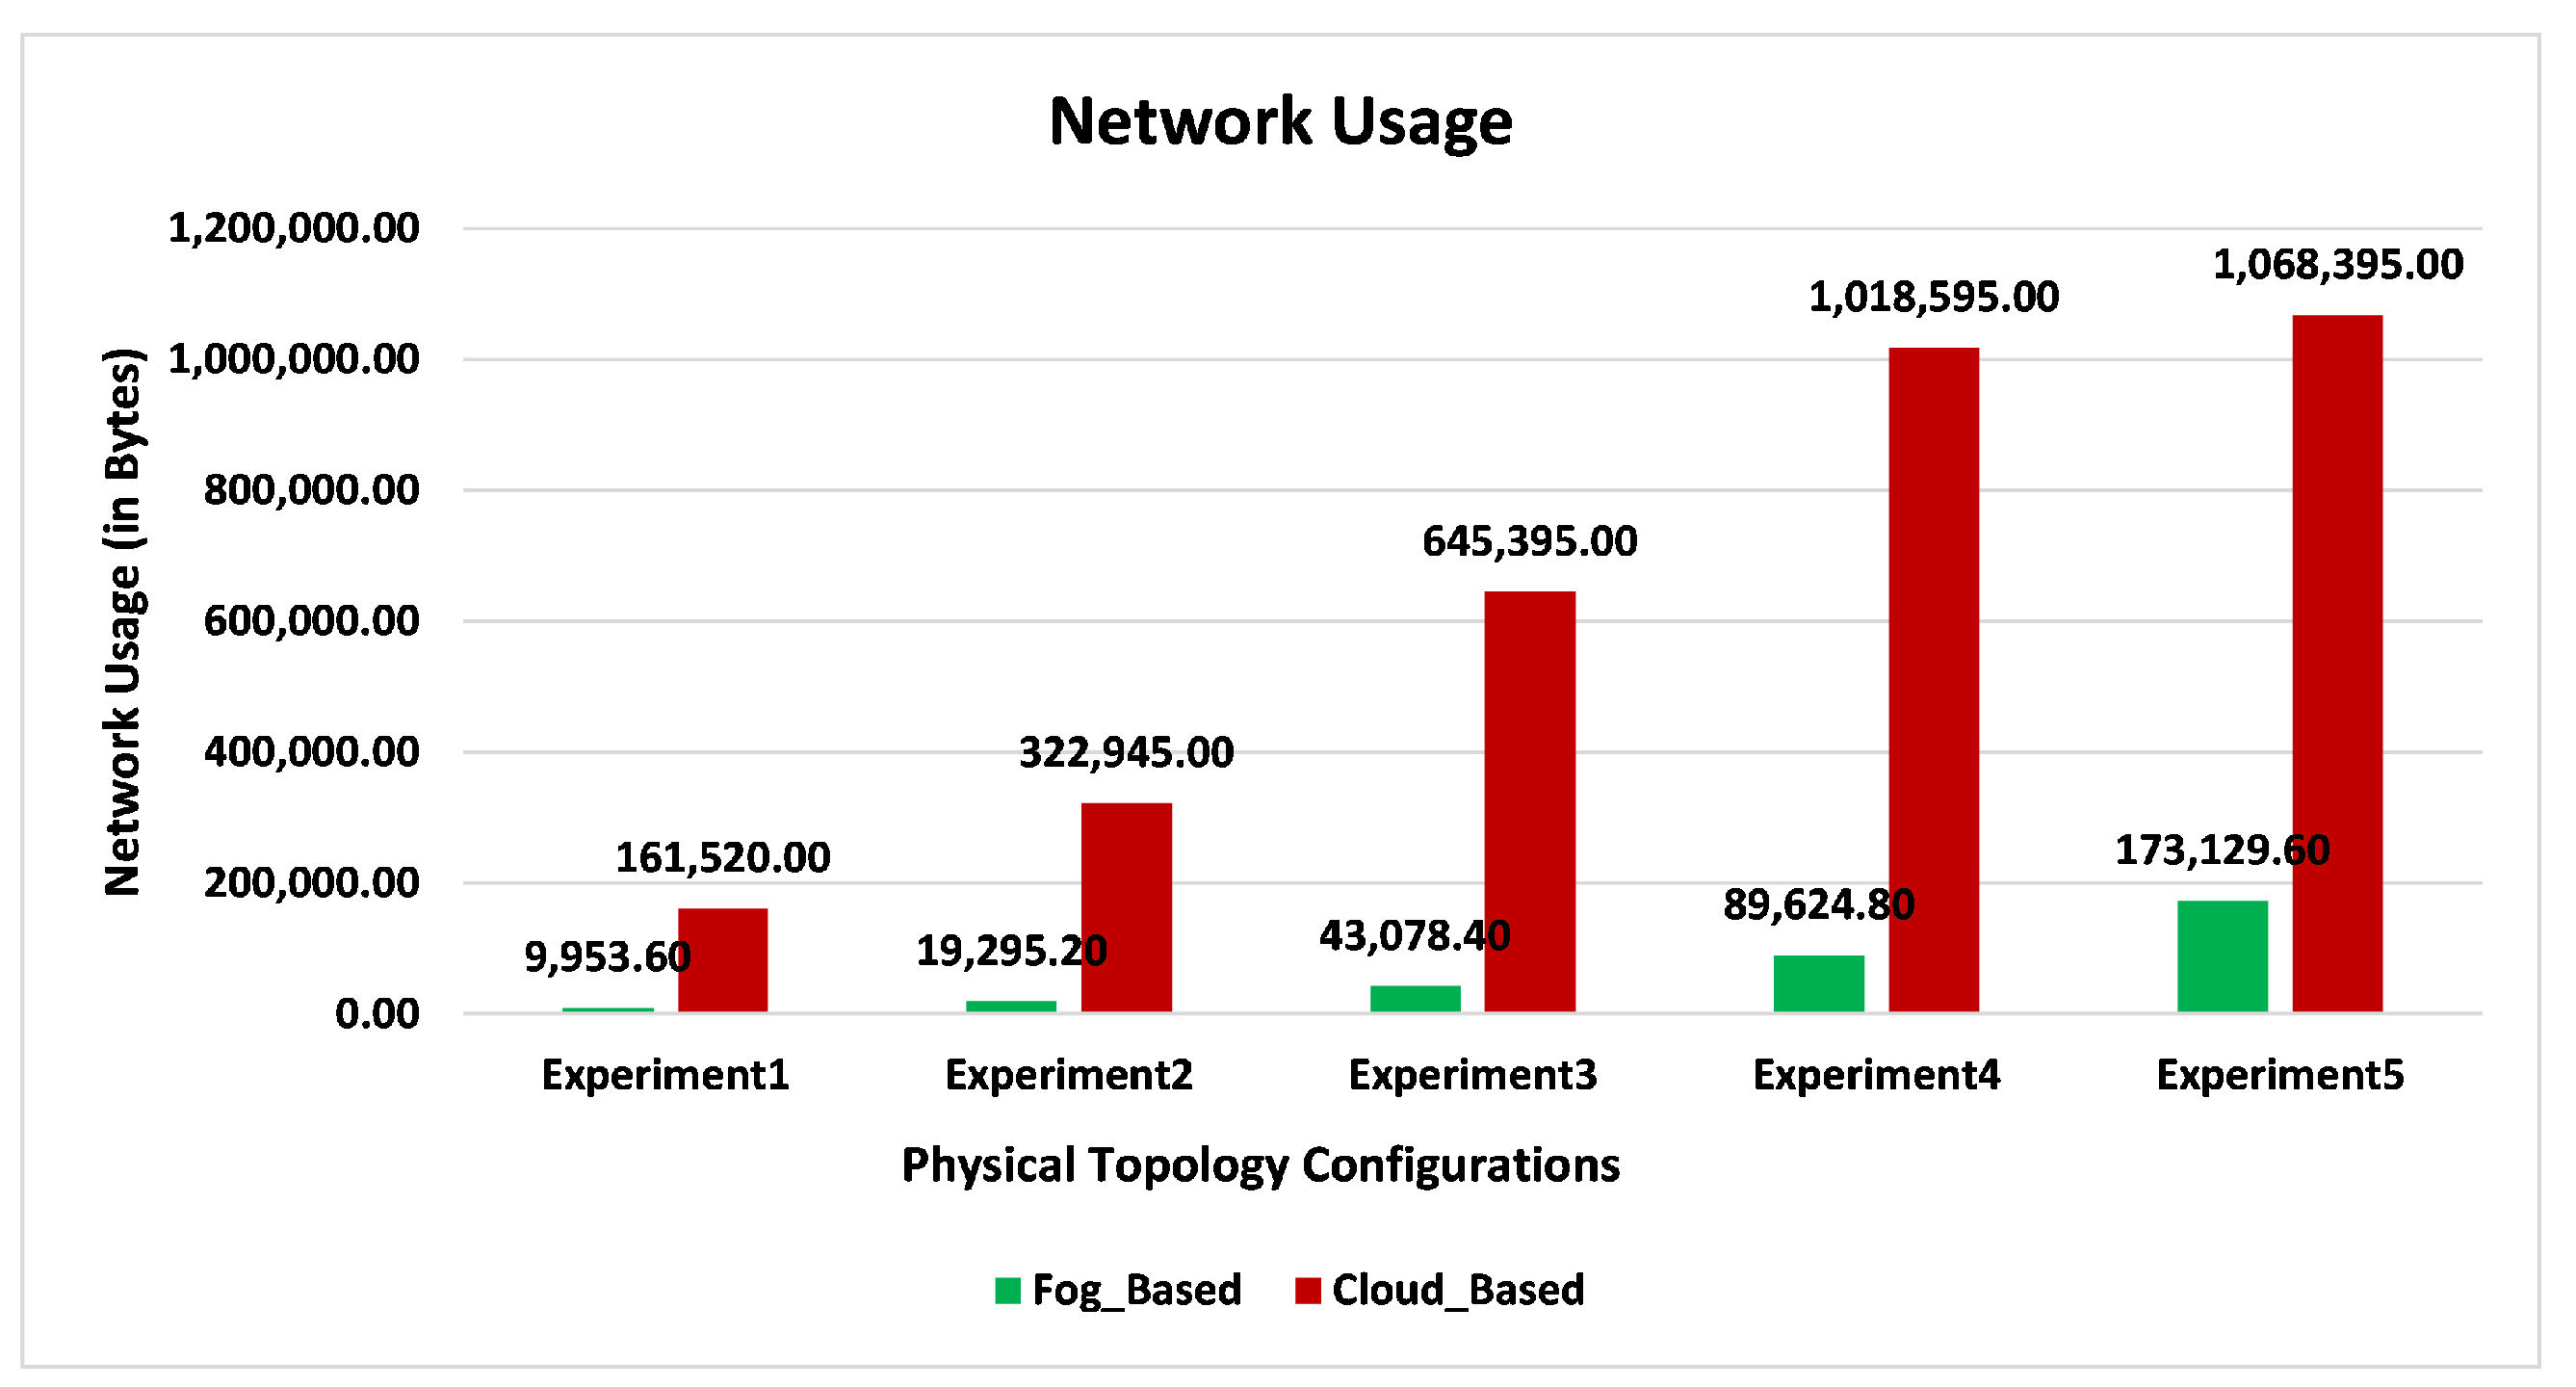
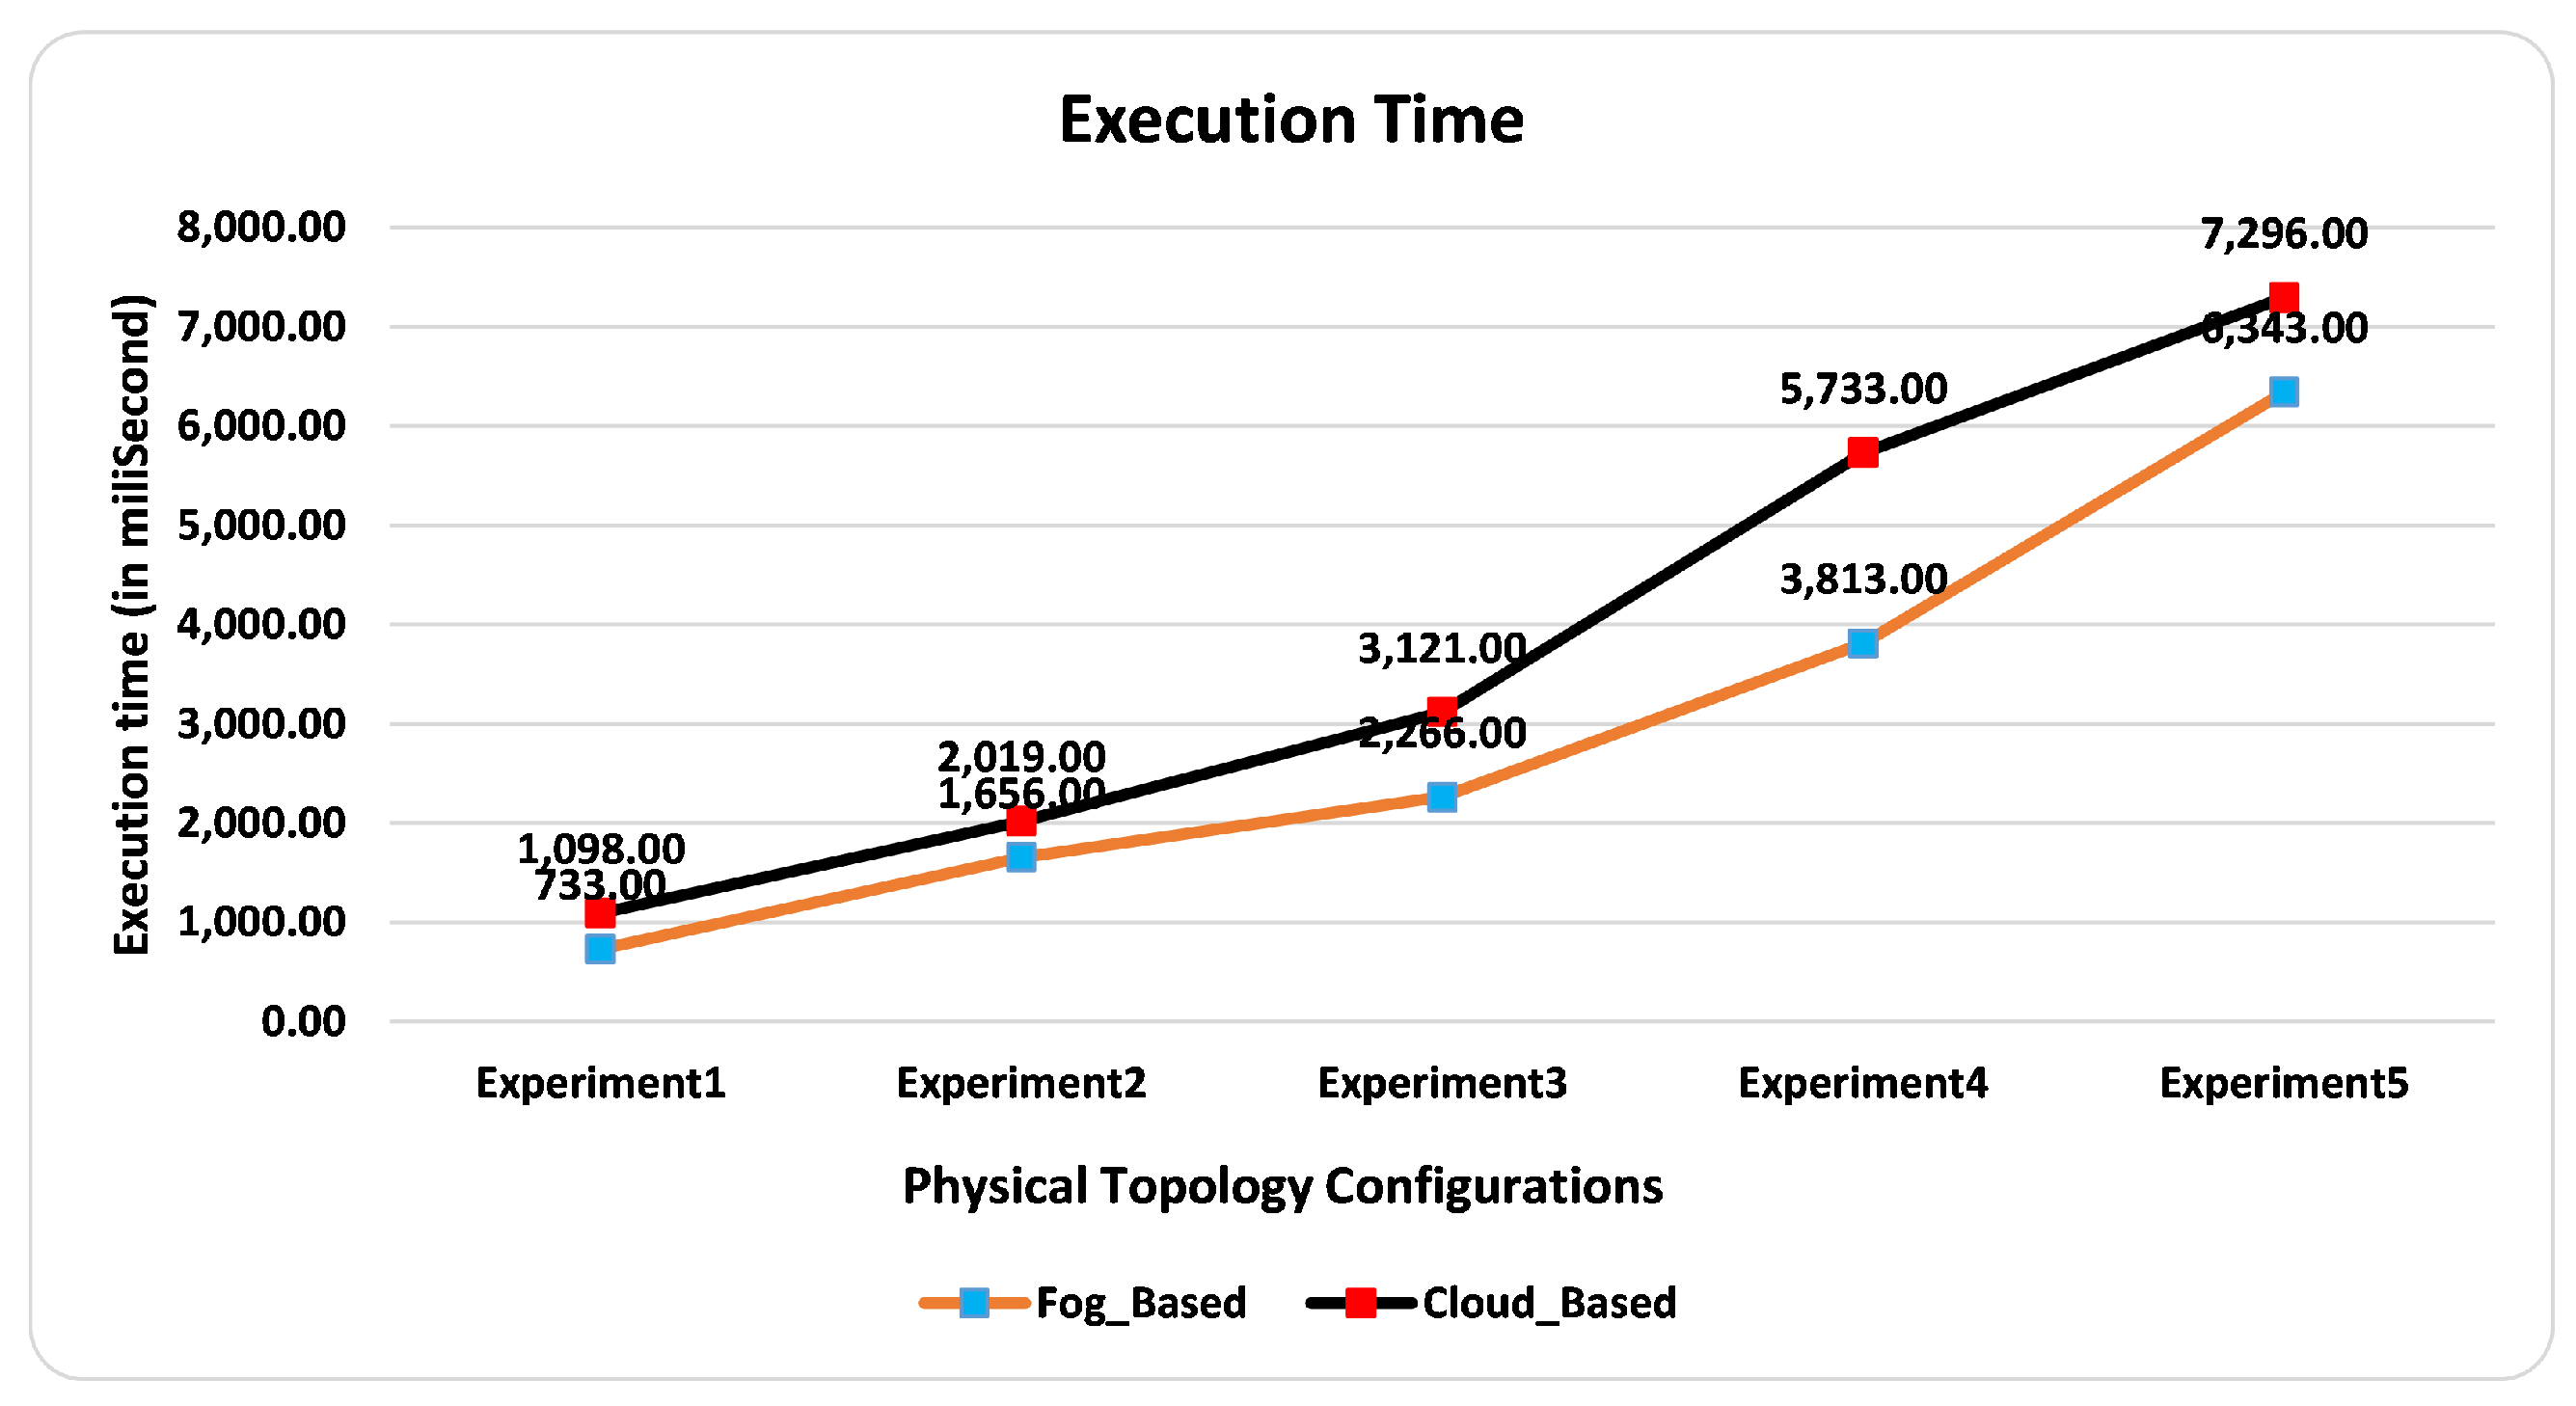
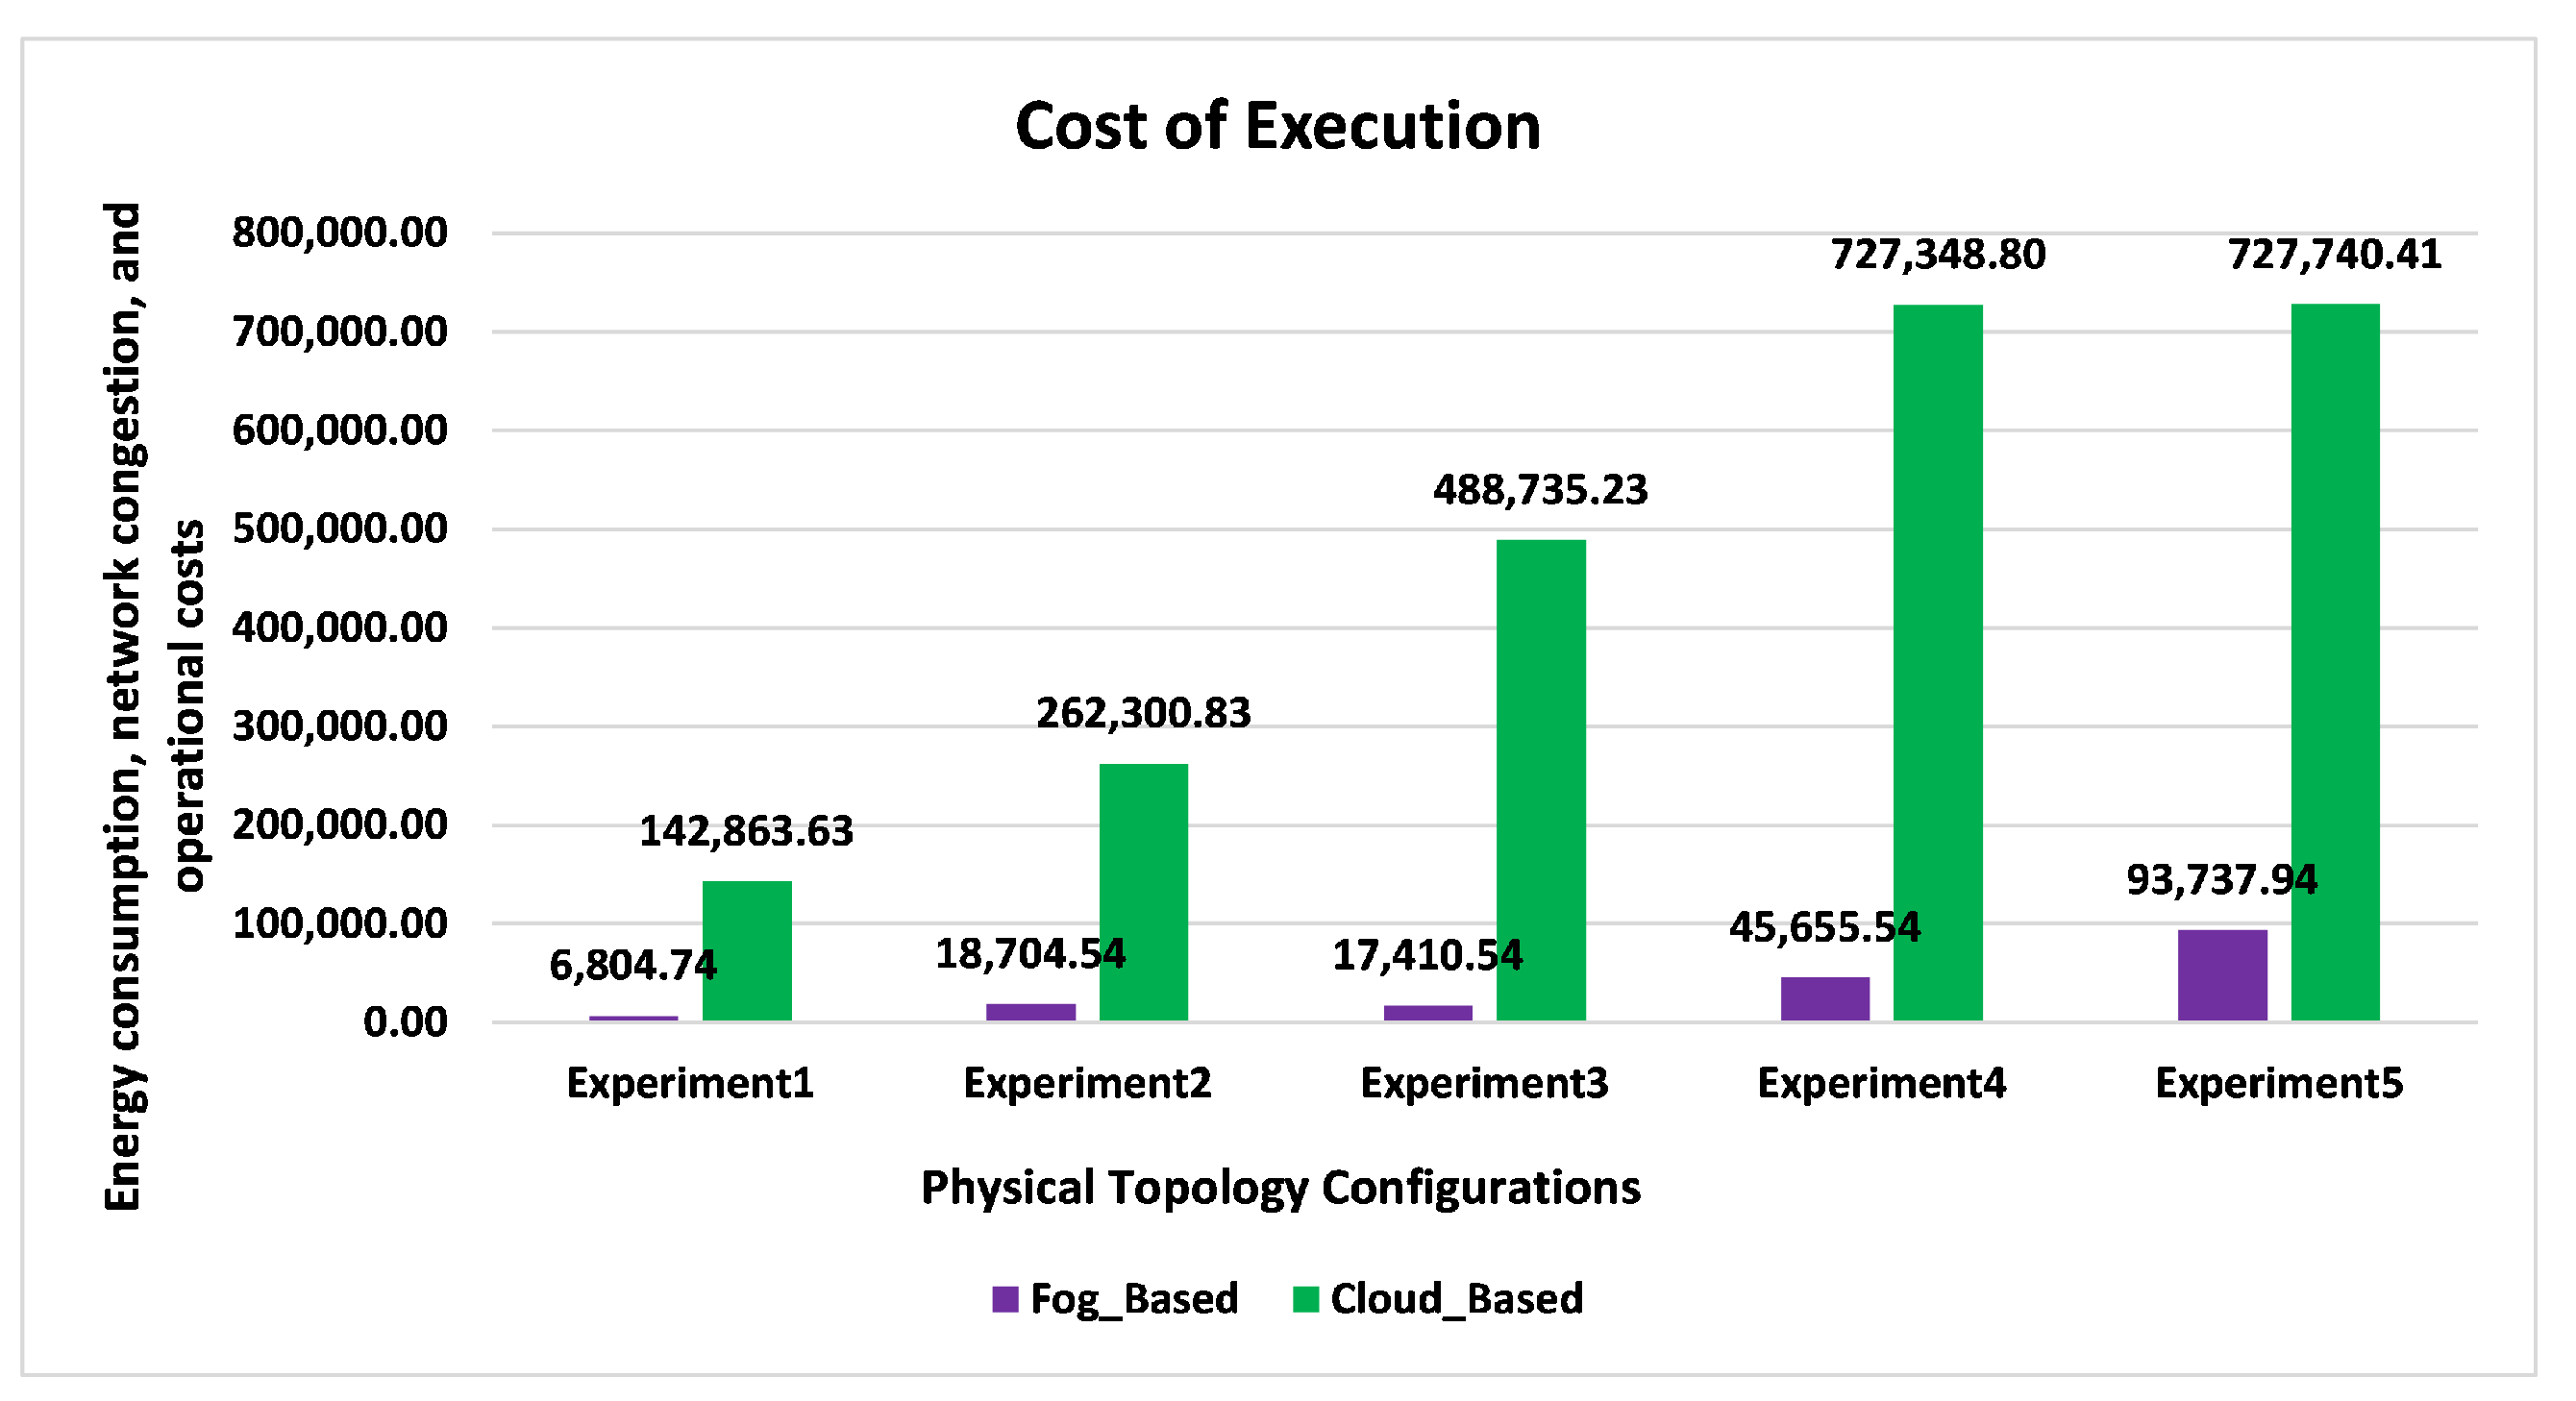
17]. Deriving the network usage of the cloud is another major challenge. Fog computing plays an important role in applications with latency. The main objective of this research work is as follows (1) How does latency behave in fog computing compared to cloud computing environments? (2) To improve the network utilization of fog compared to the cloud. (3) Understanding the execution time in both environments. (4) Behaviour of the cost of the execution matrices.
The remaining part of the article is structured as follows. A brief literature survey has been recorded in Section 2. Later, in Section 3 the proposed system framework has been demonstrated with a proper pictorial representation of the work. Experimental results and comparative analysis has been highlighted in Section 4.2. Finally, the conclusion statements and future directions of this study have been discussed in Section 5.

2. Literature Review

A considerable number of research articles have been published on the topic of fog computing. CISCO first introduced fog Computing in 2014. Fog computing is an advanced version of cloud computing with the concept of processing data near the end devices. Cloud computing is one of the most emerging technologies in terms of service-oriented models [18]. Durability, scalability, and cost efficiency are prominent aspects of the cloud. However, in addition to these admirable features, there are also some drawbacks associated with it. These include higher communication costs, higher energy consumption and longer response time [19]. In this paper, the researchers have made a comparison between the fog and cloud computing paradigms and concluded that fog reduces the delay in processing. Fog node system software was deployed by Chang et al. [20] on ARM 64bit architecture System on a Chip(SoC). Several applications such as smart parking systems, smart home monitoring, smart retail and delivery systems have been demonstrated and found to require low latency. Alrawais et al. [21] explained various privacy and security aspects of IoT environments with fog computing. The study focused on certificate revocation information between IoT endpoints. Few studies focused on energy consumption in cloud environments [22,23].
A novel fog computing architecture called ’TelcoFog’ has been proposed by Villalta et al. [24]. It is suitable for assimilated and ecosystem operators providing virtualized network functions (NVF), multi-access edge computing (MEC), and IoT services. Low latency is the main advantage of this architecture. An accident detection and emergency response system has been deployed by Dar et al. [25]. They achieved better results on fog compared to the cloud. Dastjerdi et al. [26] have presented a comprehensive study on fog computing that includes motivations, principles, architecture, and applications. In the article [27], the researchers discussed the working principles of fog, the transmission of data between IoT devices, the characteristics of fog computing, various components used in fog, and various applications based on fog computing. Several studies have shown that the latency of the cloud-based system is much higher than that of the fog-based implementations of the system [25,28]. Fog computing reduces network traffic and provides support for scalability, an important feature of IoT frameworks [26]. Network utilization is one of the most important parameters in fog computing environments for time-critical real-time applications. Network utilization must be minimized in a fog environment. Several studies have been conducted on monitoring systems with fog computing. Several studies have been conducted on monitoring systems with fog computing. Numerous studies have attempted to explain emergency efficiency for fog computing in the IoT environment [29,30].
Chen et al. [31] presented a system for monitoring traffic speed using fog computing in urban areas. The objective of the study was not only to track the speed of vehicles but also to track multiple agents using a single-agent tracking algorithm. Gaocheng et al. [32] proposed a fog-based public surveillance system. In that article, the problem of object tracking latency was addressed. This article addressed problems such as slow speed and unfulfilled results in the presence of large illumination variations. The study proposed a correlation filter-based tracker to solve the problem and deployed it in the fog computing environment. In the article [33], the researchers proposed a monitoring system based on fog computing to reduce the general conflict in the public. The researchers used the geo-distribution of fog computing to maintain citizens’ security ethics and privacy requirements.
Data fusion and artificial intelligent-based a fog-assisted framework: FogSurv proposed by Munir et al. [34]. The main objective of this paper was to provide situational awareness (SA) and rapid response to emergencies using airborne urban surveillance. The research found an improvement in latency of about 37% over the cloud architecture. Shing et al. [35] proposed a cyber-physical system (CPS) for intelligent monitoring in the education sector. To achieve the goal of minimizing delay and reducing energy consumption. An OpticalFog node is proposed to be deployed in the middleware of the cloud to meet the requirements. Another study discovered a comparative analysis between cloud and fog in article [36].
Fathy et al. [37] proposed a weapon detection architecture based on fog computing and SDN using the YOLOv5 model. This study demonstrated how the YOLO model detects objects very fast. Fog computing-enabled smart city planning with a vehicle detection model is described in the article [38]. A greedy algorithm-based intrusion detection was proposed using fog computing in an IoT environment [39]. In article [40], a fog computing-based surveillance system is proposed for crime and vulnerability detection. The researcher studied traffic surveillance using fog computing in the article [41]. Some security-related studies were covered in articles [42,43,44]. Intelligent security surveillance systems using fog computing suggested by the study [45]. The study used PTZ control cameras for proper camera movements. This research considered audio along with the video in the proposed surveillance system using fog computing [46].
Collectively, these studies provide important insights into the latency and network usage parameters in the fog computing domain.

3. The Proposed System Framework

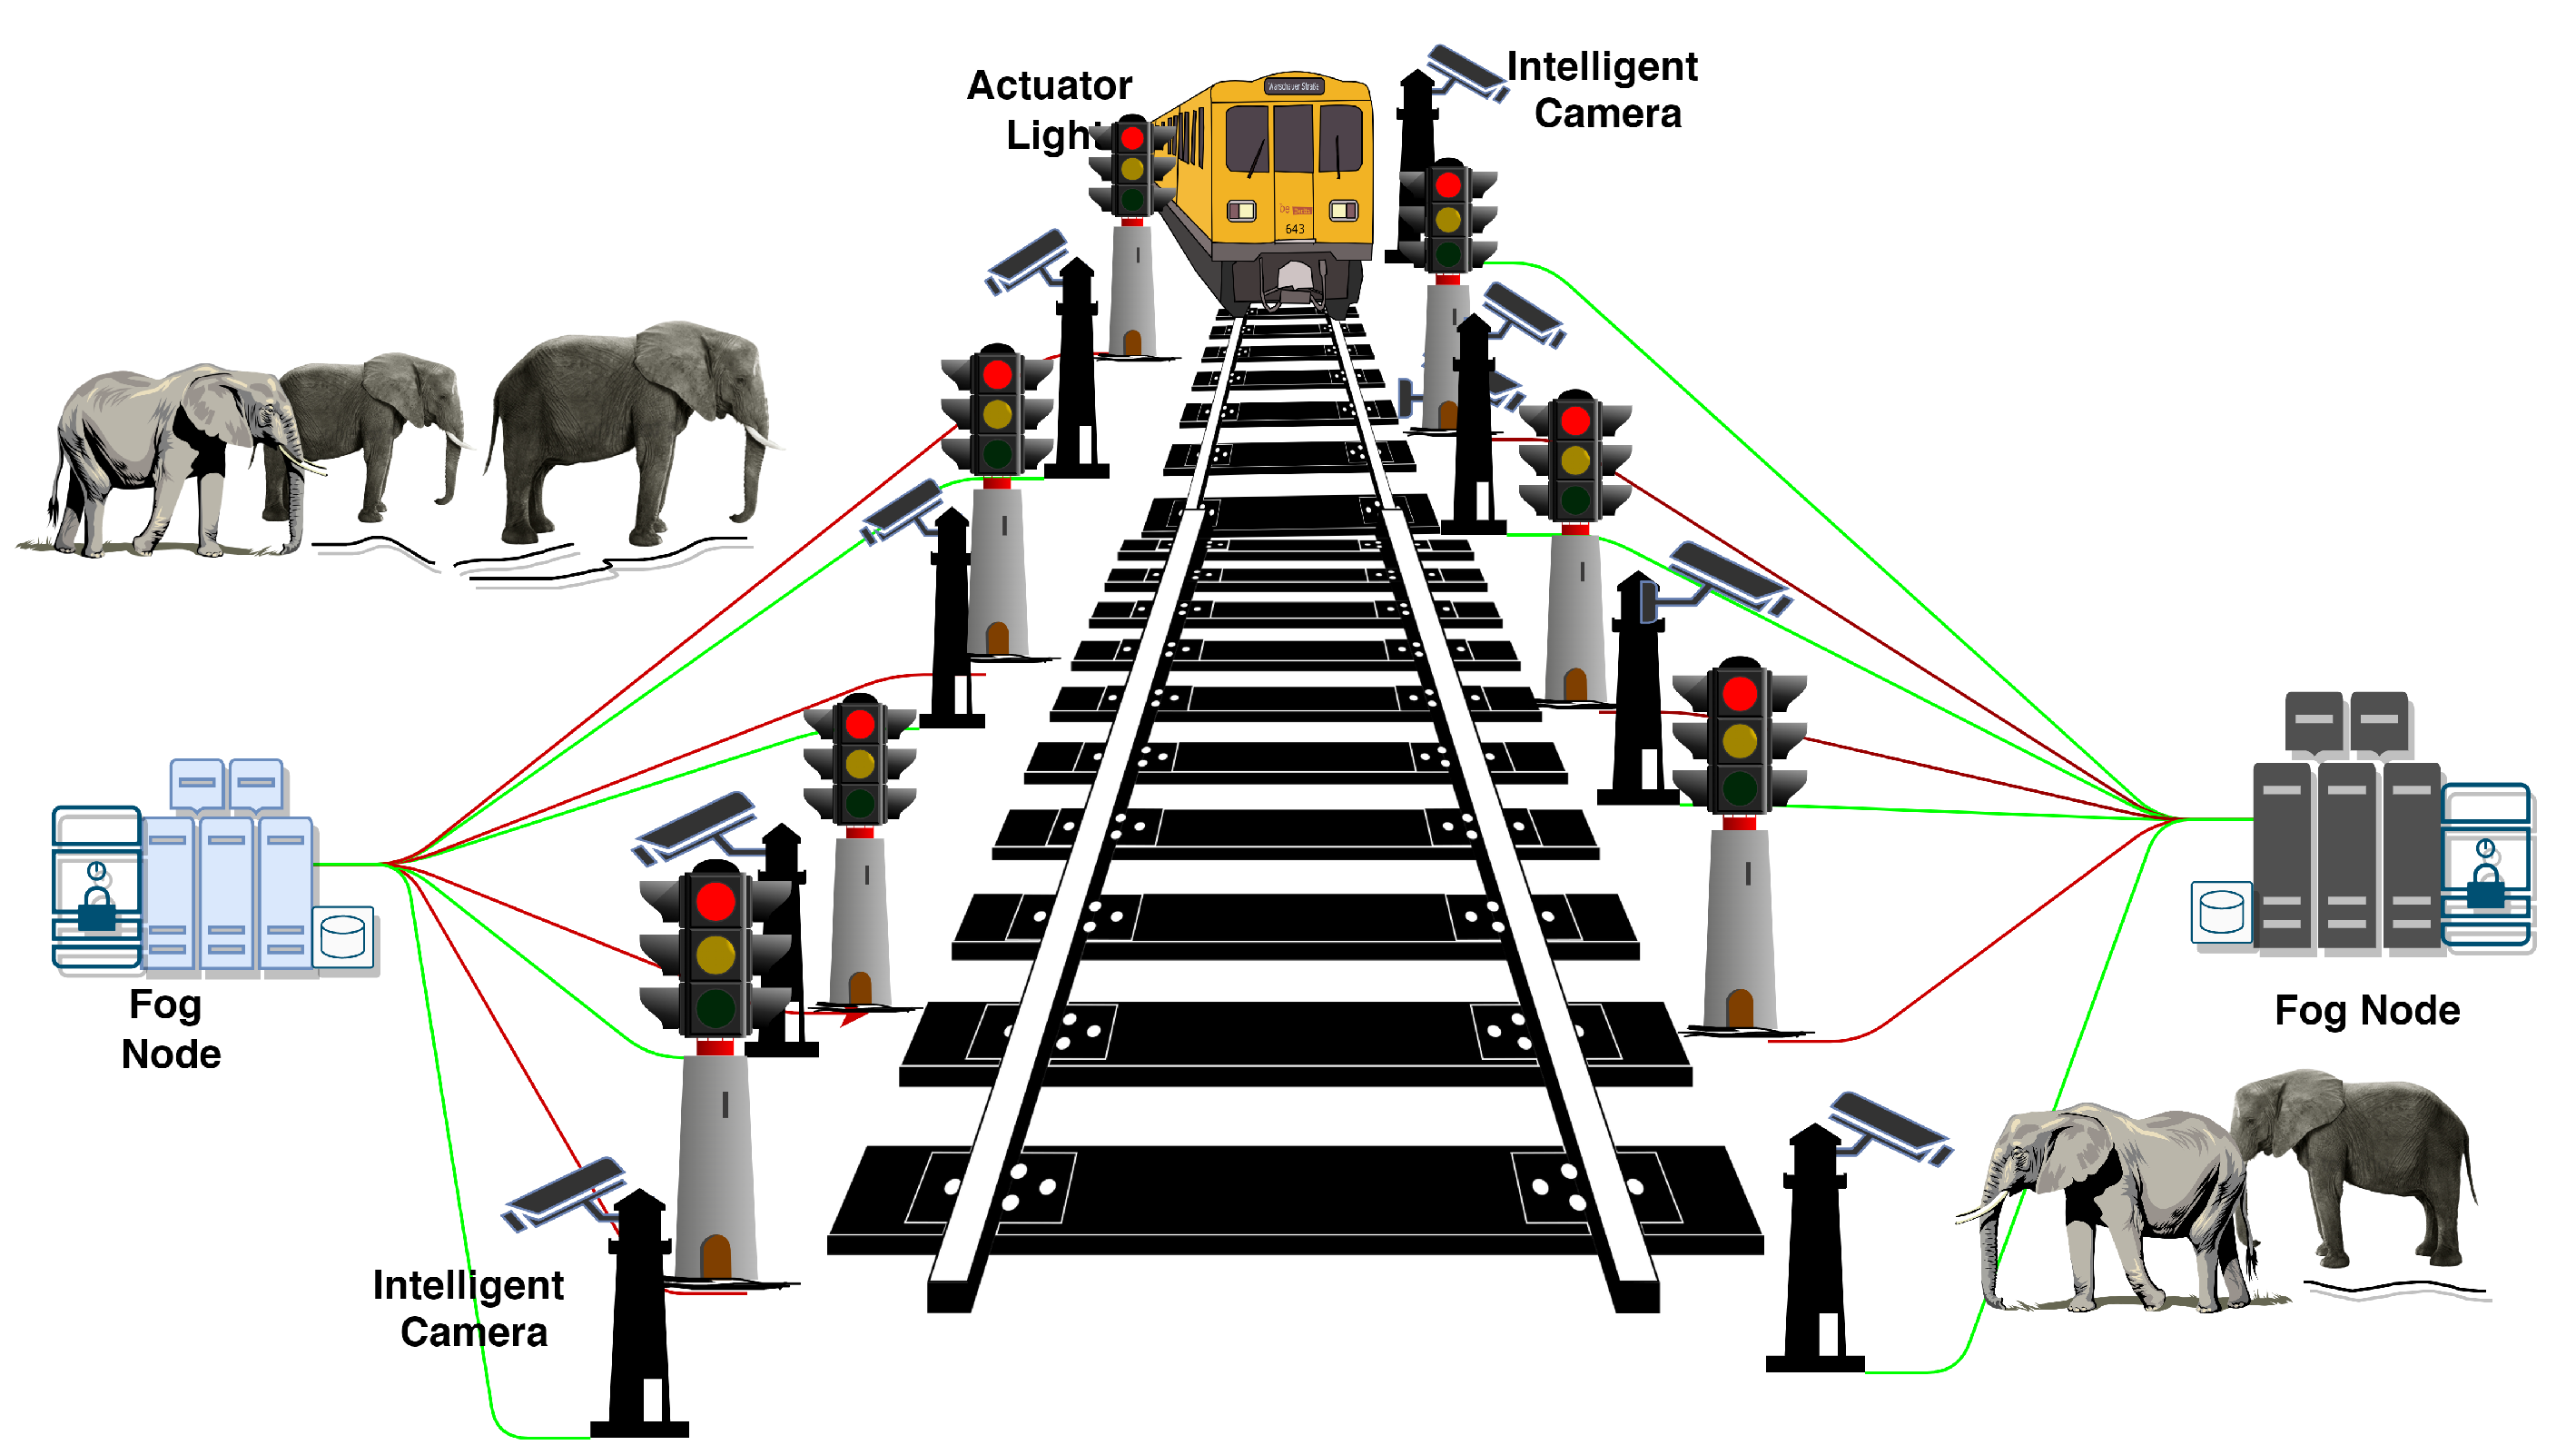
Monitoring elephants next to the railroad tracks is one of the biggest challenges. Enormous computational resources are required to autonomously monitor an elephant near a railroad track, as shown by the fog-supported elephant corridor in Figure 2. For continuous monitoring of elephants, intelligent cameras are generally used. In bad weather and night monitoring specialised infrared cameras are suitable options. New Flateye Cameras by Hanwha Techwin is a solution to this bad weather problem. New Flateye Cameras consist of 2 Megapixel QNE-6080RV(W) and 4 Megapixel QNE-7080RV(W) along with the application of a (3.2∼10 mm) × 3.1 electric varifocal lens allows viewing angles to be freely adjusted. In addition, the infrared (IR) light function features make the camera effective even at night time [47]. Intelligent cameras are installed along the railroad tracks, recording video at 5-millisecond intervals and sending it to the server for processing. The processing takes place in the cloud and sends the result to the actuator. This allows the train driver to see the light and stop the train. However, the cloud-centric system is not latency sensitive. The cloud takes a measurable amount of time to respond. The cost is also higher compared to fog-enabled systems. Therefore, a fog-enabled system is proposed for elephant monitoring.
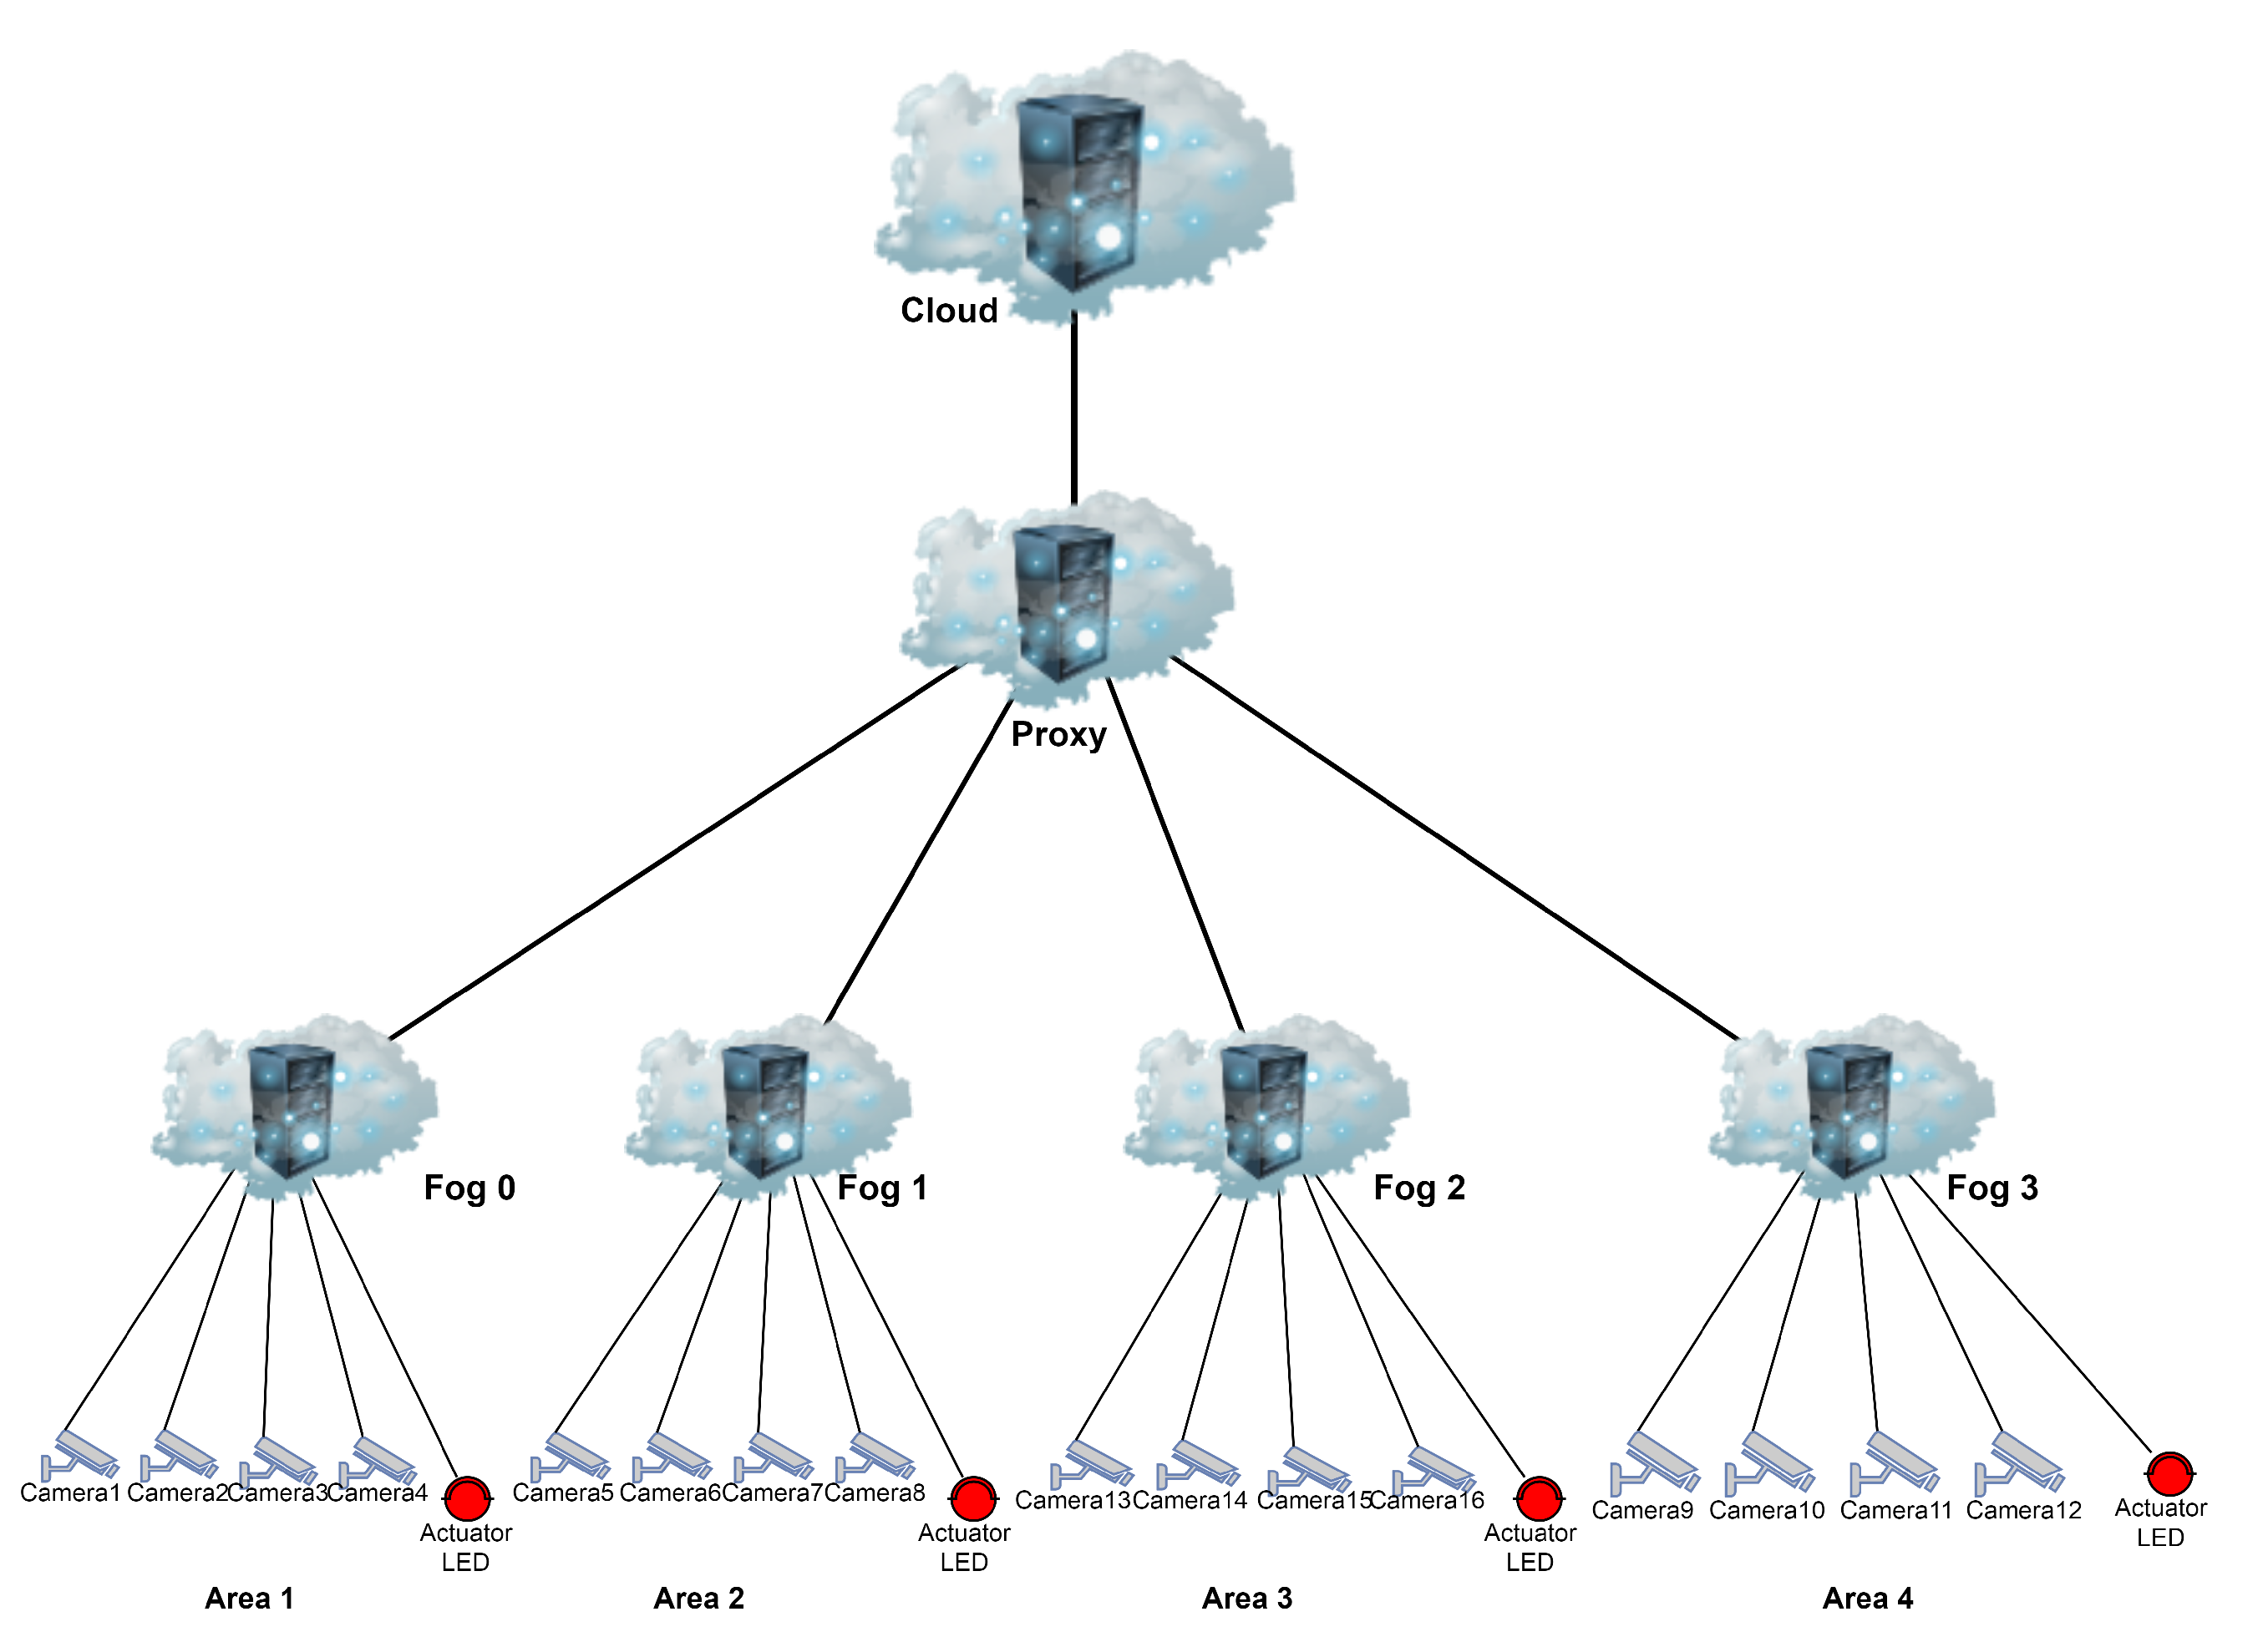
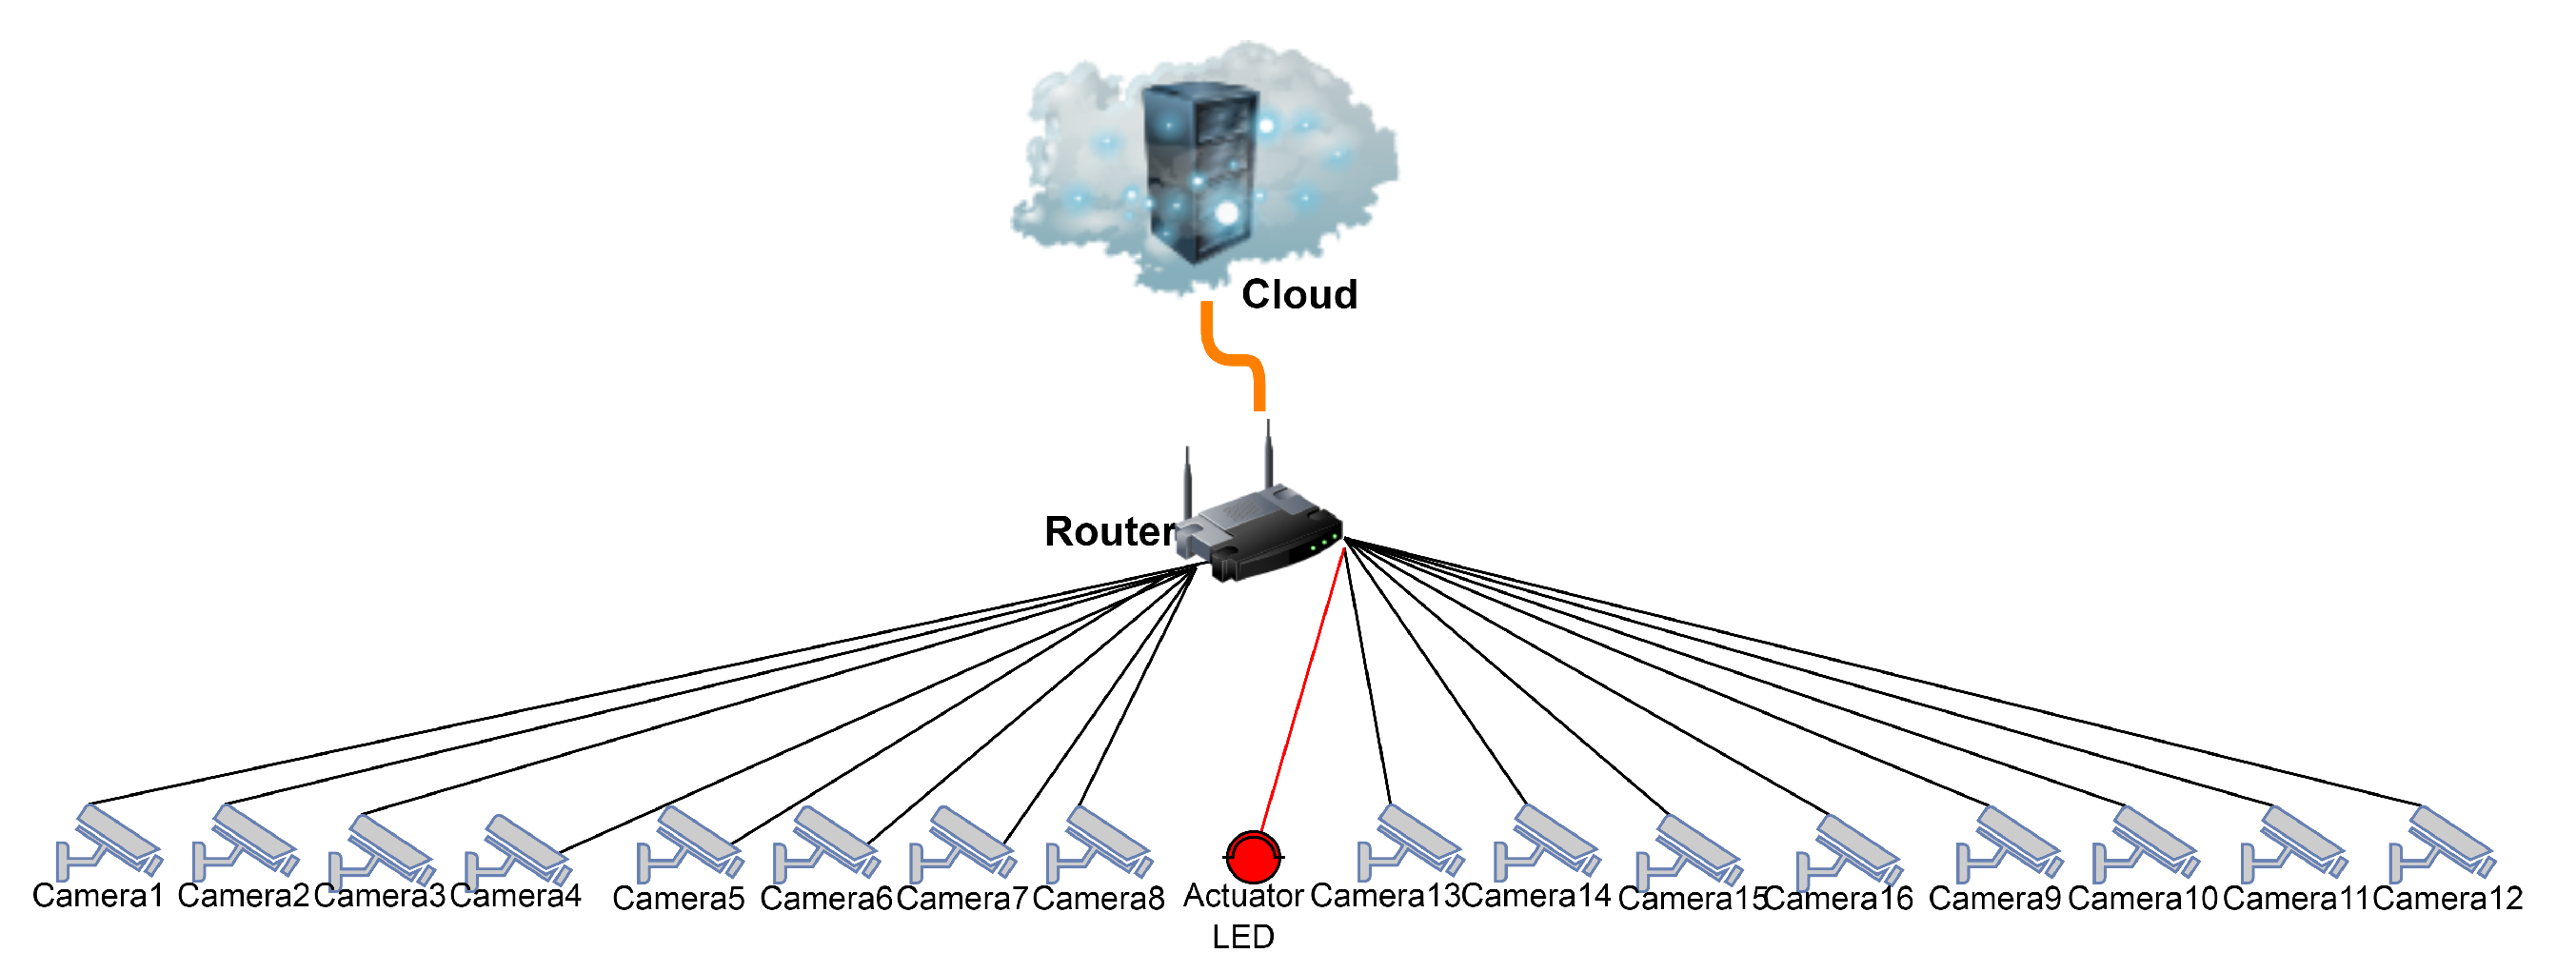
The system consists of a cloud server, a fog node, a proxy server, an intelligent camera (sensor), an actuator light, and a camera controller (microcontroller). The architecture consists of three layers. The first layer consists of smart cameras, and actuator lights—all things that are used along railroad tracks. The first layer is responsible for taking photos of elephants near the railroad tracks. Layer 1 also controls the camera through the camera controller module. Layer 2 contains fog nodes. The fog node is responsible for processing data. The elephant detector and elephant tracker modules are deployed in the fog node at layer 2. The elephant detector detects the elephant, and the elephant tracker calculates the coordinates of the elephant. A fog node is nothing more than a host in cloud computing. The top layer is layer 3, and this layer consists of a proxy server and a cloud. In 
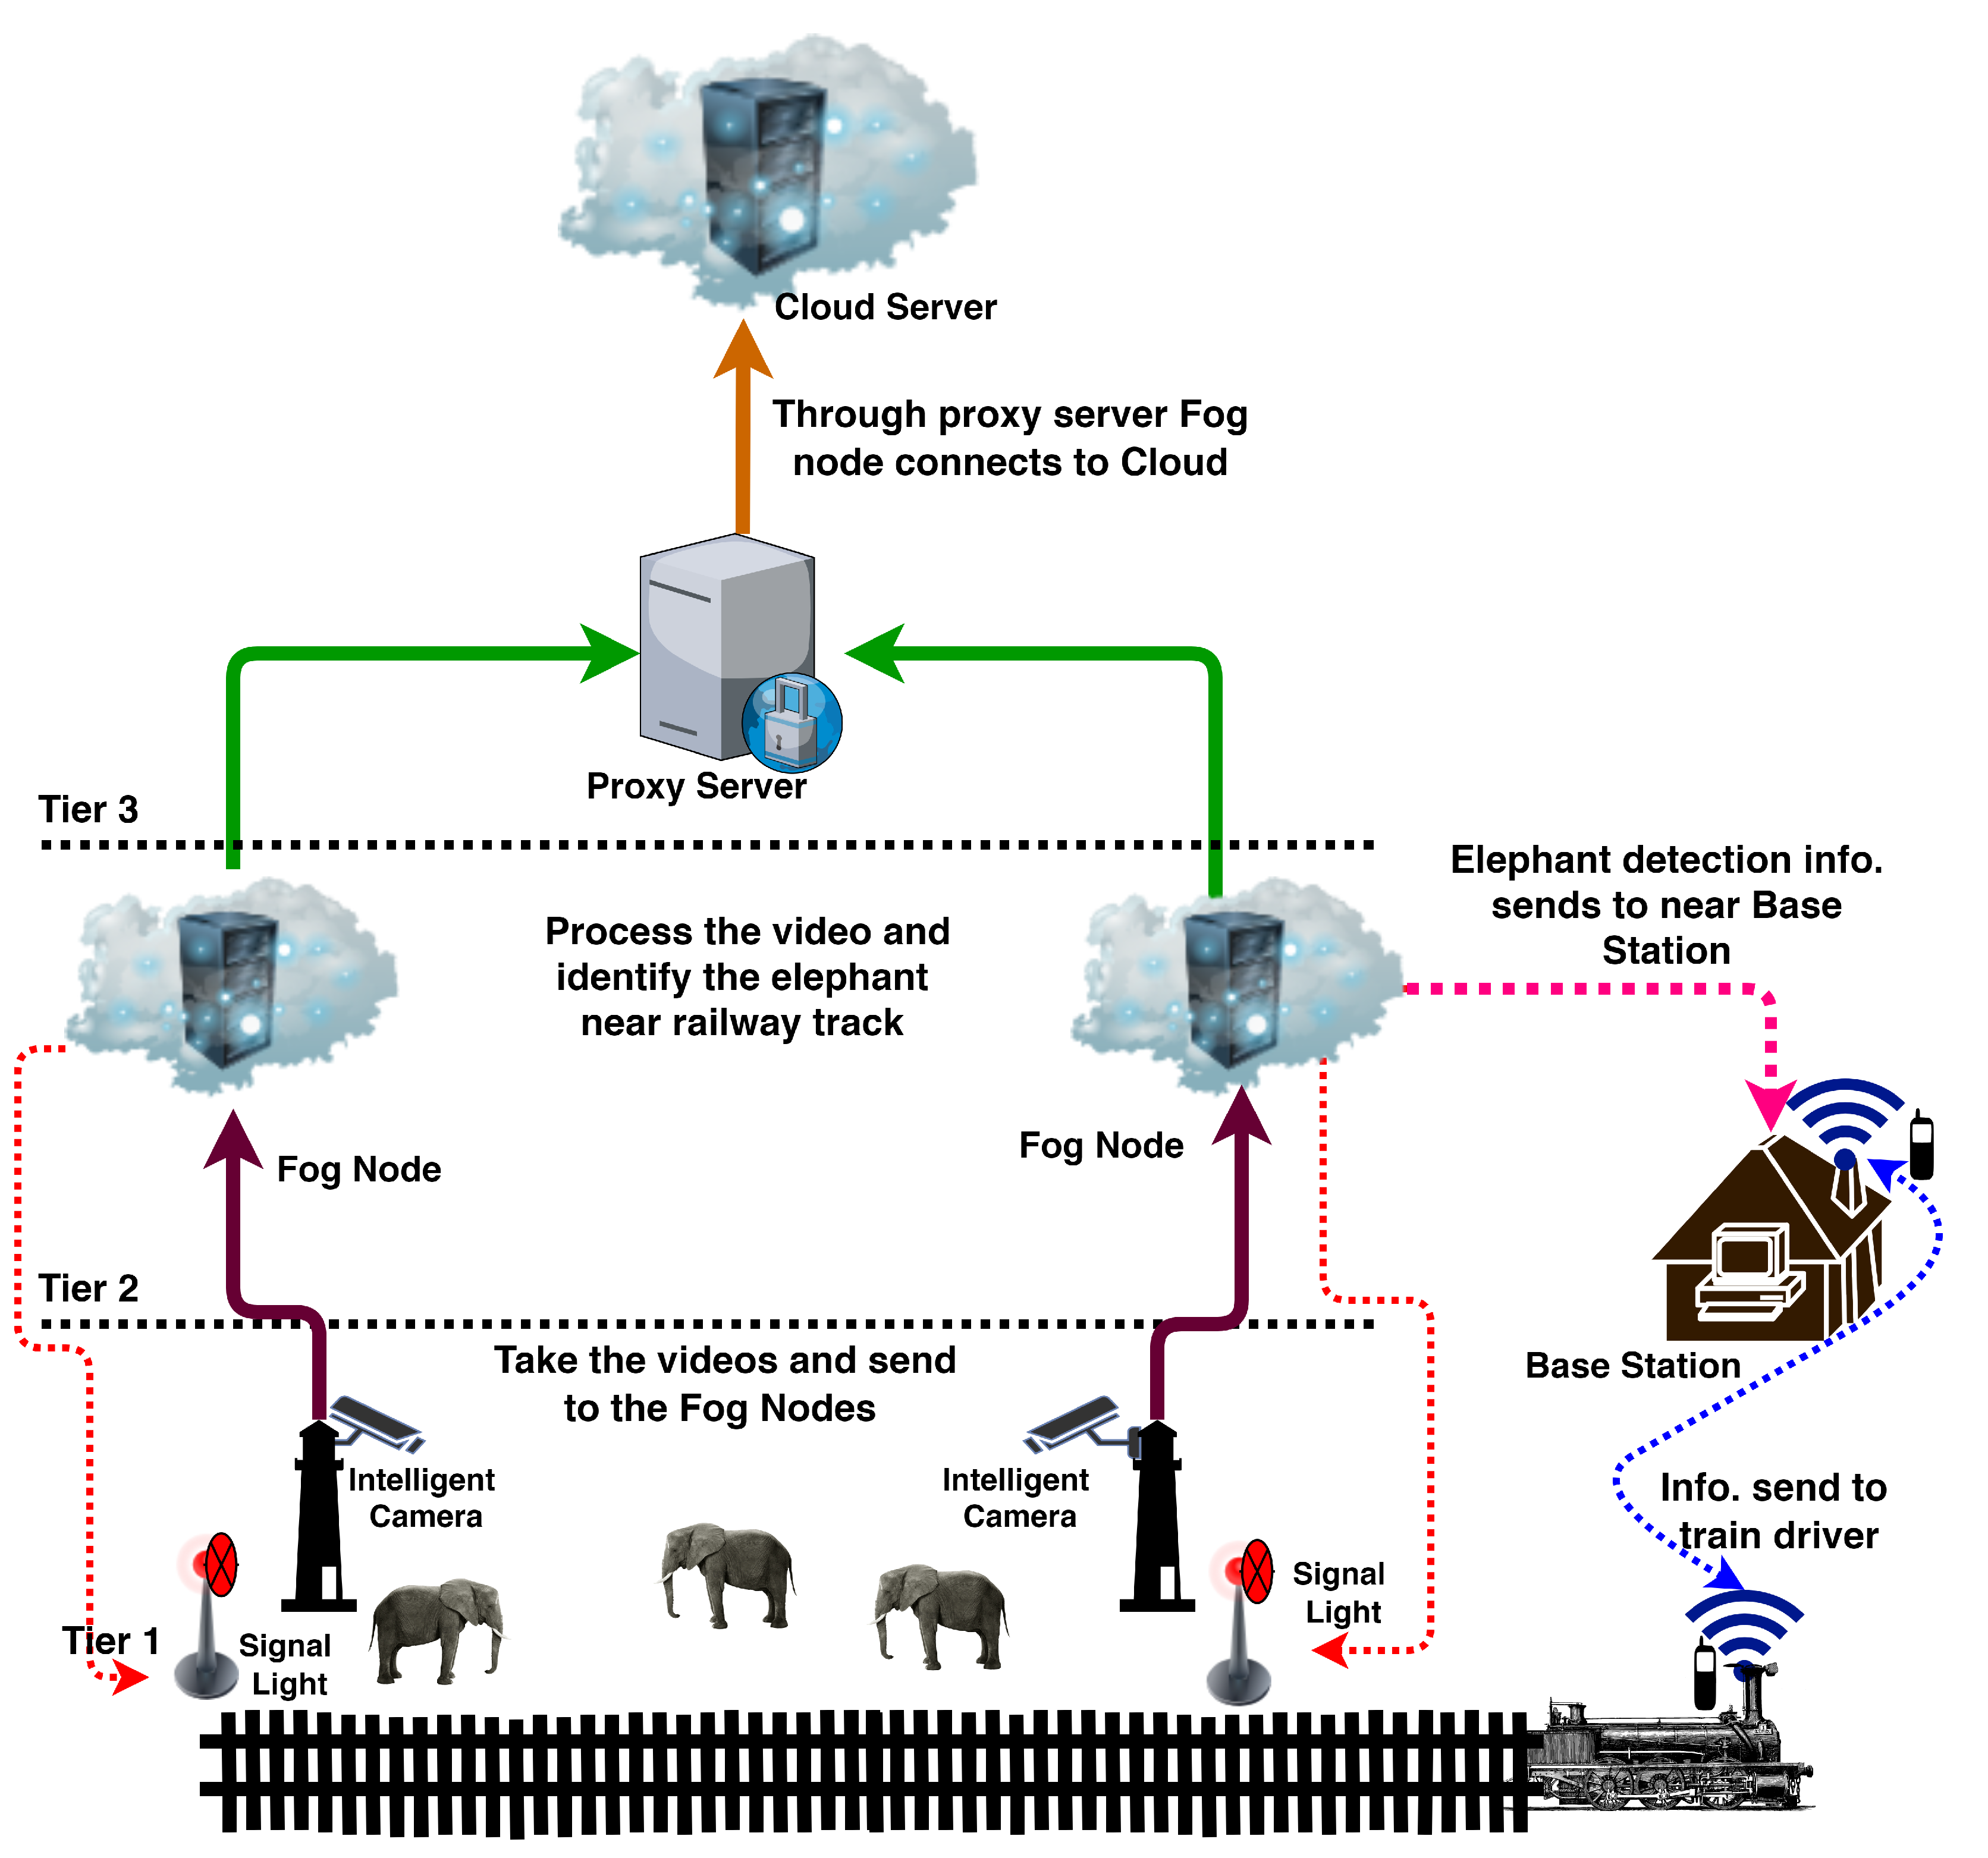
Figure 3, we can see that the proposed elephant monitoring architecture has been implemented with a fog-based scenario.Due to limited resources and huge establishment costs, this study was not physically implemented. The study is simulated by a globally accepted simulator iFogSim.

3.1. Workflow of the Designed Framework

Figure 4 shows the application model of the elephant monitoring system using the iFogSim simulator. The application model consists of M o t i o n _ d e t e c t i o n , E l e p h a n t _ d e t e c t i o n , E l e p h a n t _ t r a c k e r , C a m e r a _ c o n t r o l , and L i g h t _ i n t e r f a c e modules. The motion detector extracts the moving part from the raw video and sends it to the next module elephant detector. The motion detector module is also integrated with the camera. The elephant detector is used in the fog node. After receiving the data from the previous module, the elephant detector processes the data and detects the elephant using various object detection algorithms. It takes the data from the motion detector and sends it to the elephant tracker. The elephant tracker module is also used on the fog node. Elephant tracker receives the information from the previous module and continuously tracks the elephant using camera actuators. At the same time, a message is sent to the base station or forest office. The base station manager forwards the message to the train driver. As a result, the train driver can stop the train immediately.
For real-time object detection neural network-based models are used. You Only Look Once (YOLO) is one of the most prominent object detection models used for real-time detection (see Section 3.2). This model requires a massive computation capability. Cameras are not sufficient to do so. Therefore, it is required to deploy this model at the nearest fog node unit.
Algorithm 1 describes a few simple steps for an object (elephant) detection process. Popular object detection algorithms are discussed in Table 2.
Algorithm 1: Steps for Elephant Detection
Input: Camera Stream Video
Output: Detection of elephants from image
1.
Initialization of the system
a.
Set Camera
2.
Image Acquisition
a.
Capture the image of elephant
3
Image segmentation
a.
Input the image in RGB format
b.
Convert RGB image in grayscale (black and white) image
c.
Apply effective threshold technique
d.
Image is ready for final segmentation
4.
Applying image enhancement techniques
a.
Noise removal process from image
5.
Elephant detection
a.
Extract the elephants from the image
Although Table 2 describes a few models, this study considers YOLO using python OpenCV.

3.2. You Only Look Once (YOLO)

You Only Look Once is an advanced objection model which is known for object detection in real-time [
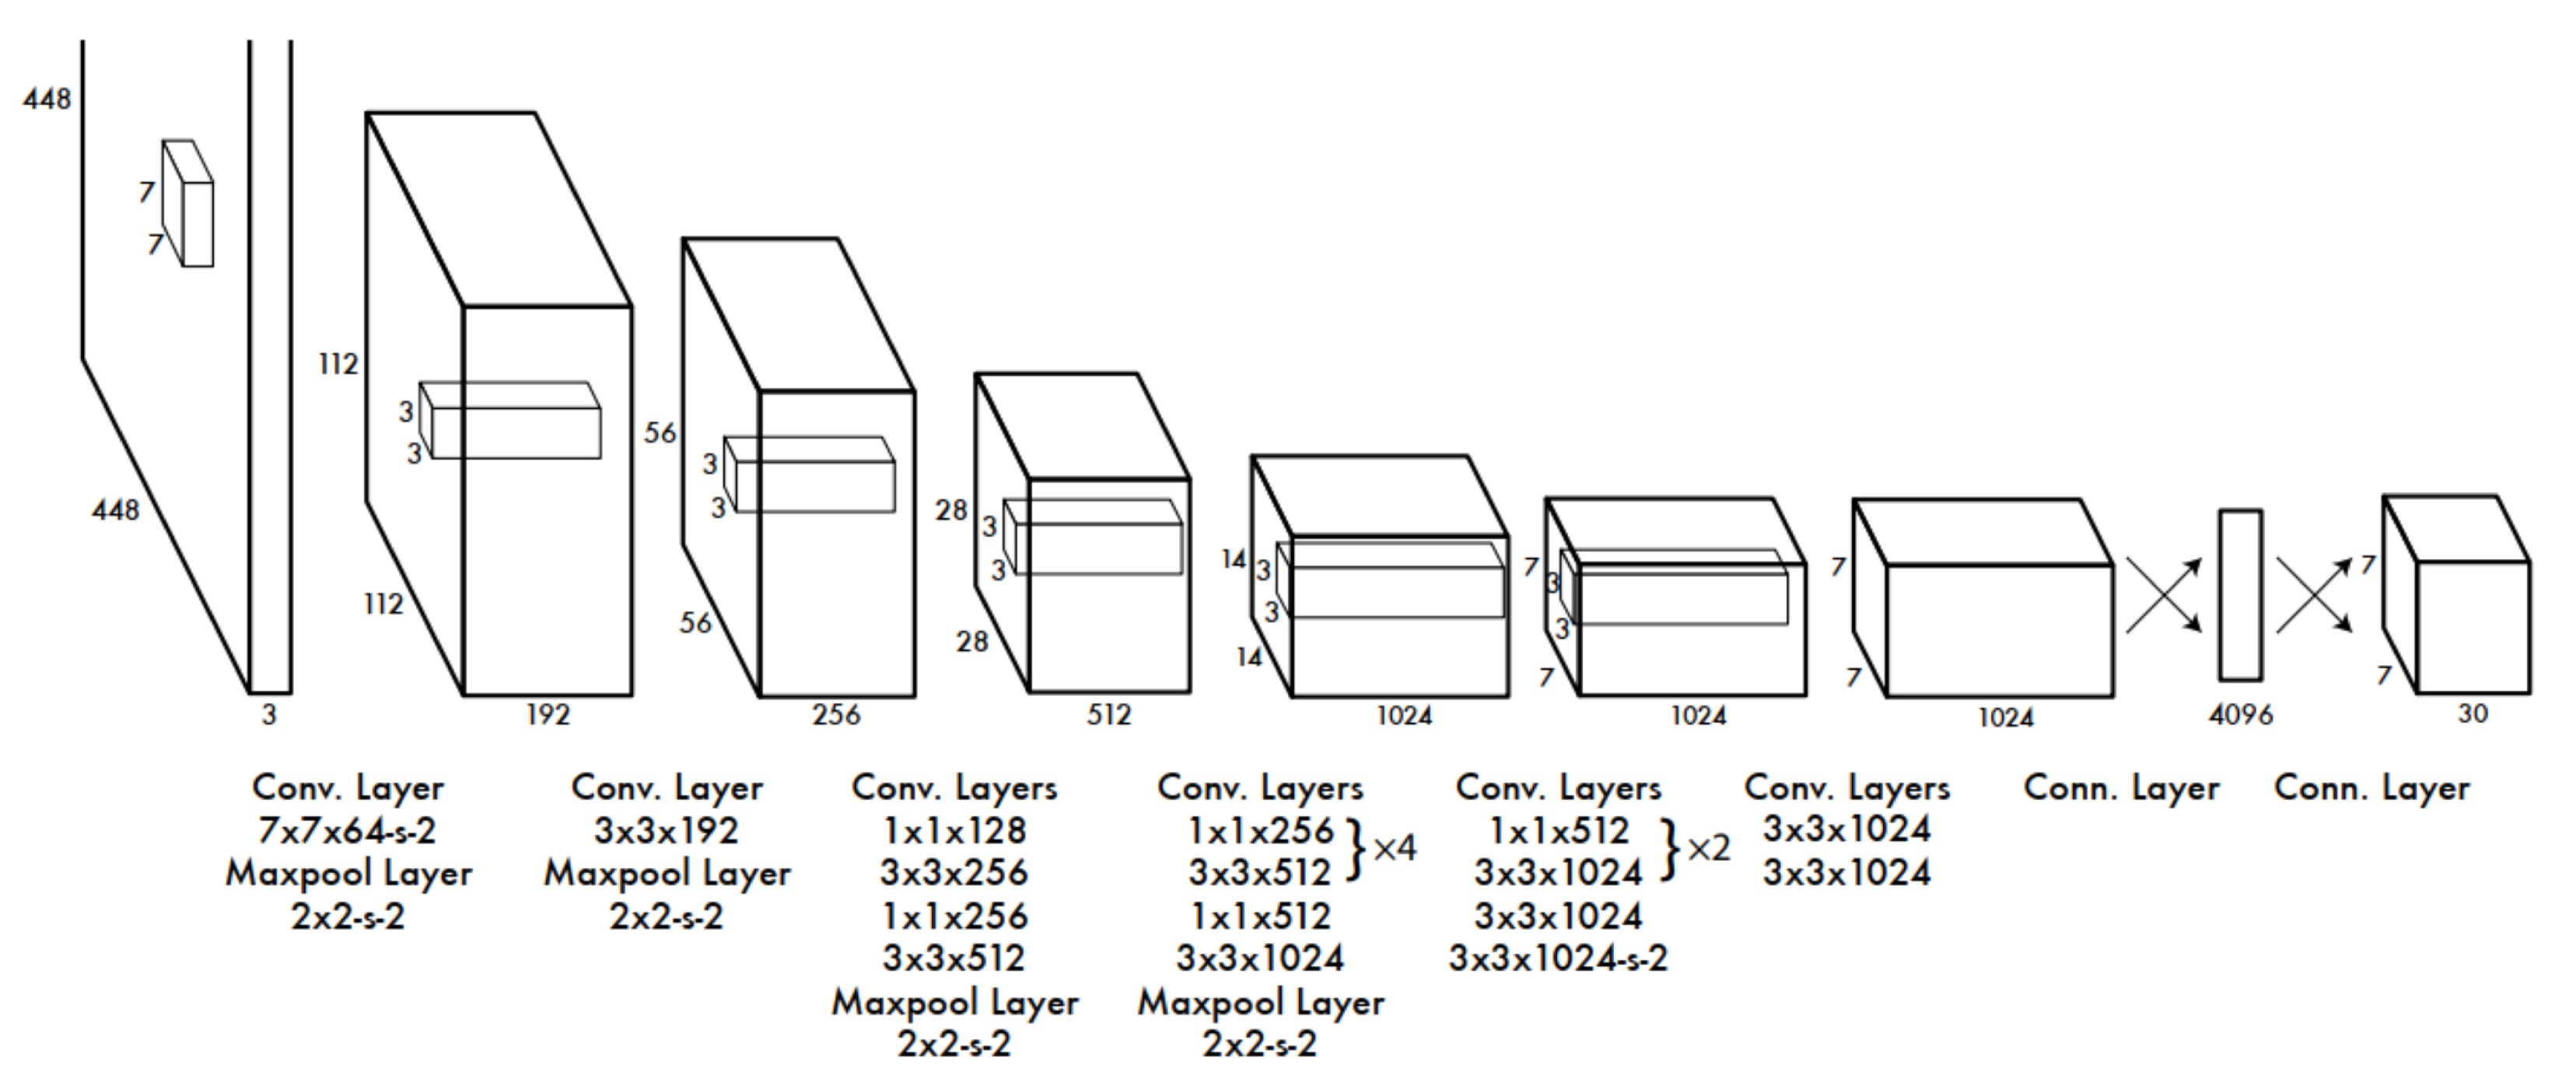
48]. It is a deep learning-based model. Generally, the YOLO model works fast, it can process nearly 45 frames per second. Fast YOLO can process up to 155 frames per second. Due to this high frame rate, it can also process videos with less than 25 ms of latency. In YOLO, a single convolution network simultaneously predicts many boundary boxes and then a classifier is applied to the boxes. After the classifications post-processing is applied to the boxes. Other R-CNN and its variations model used numerous steps to accomplish object detection. These models are comparatively slow due to their separate training components requiring training independently. Whereas, YOLO works on end-to-end architecture which simultaneously acts as the region-based proposal and classifications, thus making a faster outcome. The YOLO model is depicted in Figure 5. The image has been divided into an S × S grid, and each cell is interested in predicting 5 + k (k is the set of classes) quantities, including the likelihood (confidence) that this cell is actually contained in a truthful bounding box, the height and width of the bounding box, it’s centre ( x , y ) , and the likelihood that an object in the bounding box belongs to the kth class (k-values). As a result, the output layer has S × S × ( 5 + k ) elements. Here, the network consists of 24 convolutional layers followed by 2 connected layers. Additionally, the 1 × 1 convolutional layer is used to reduce the feature space. It makes the final prediction using a probability map and boundary boxes with a confidence score. This study implements YOLO object detection using python OpenCV [49].
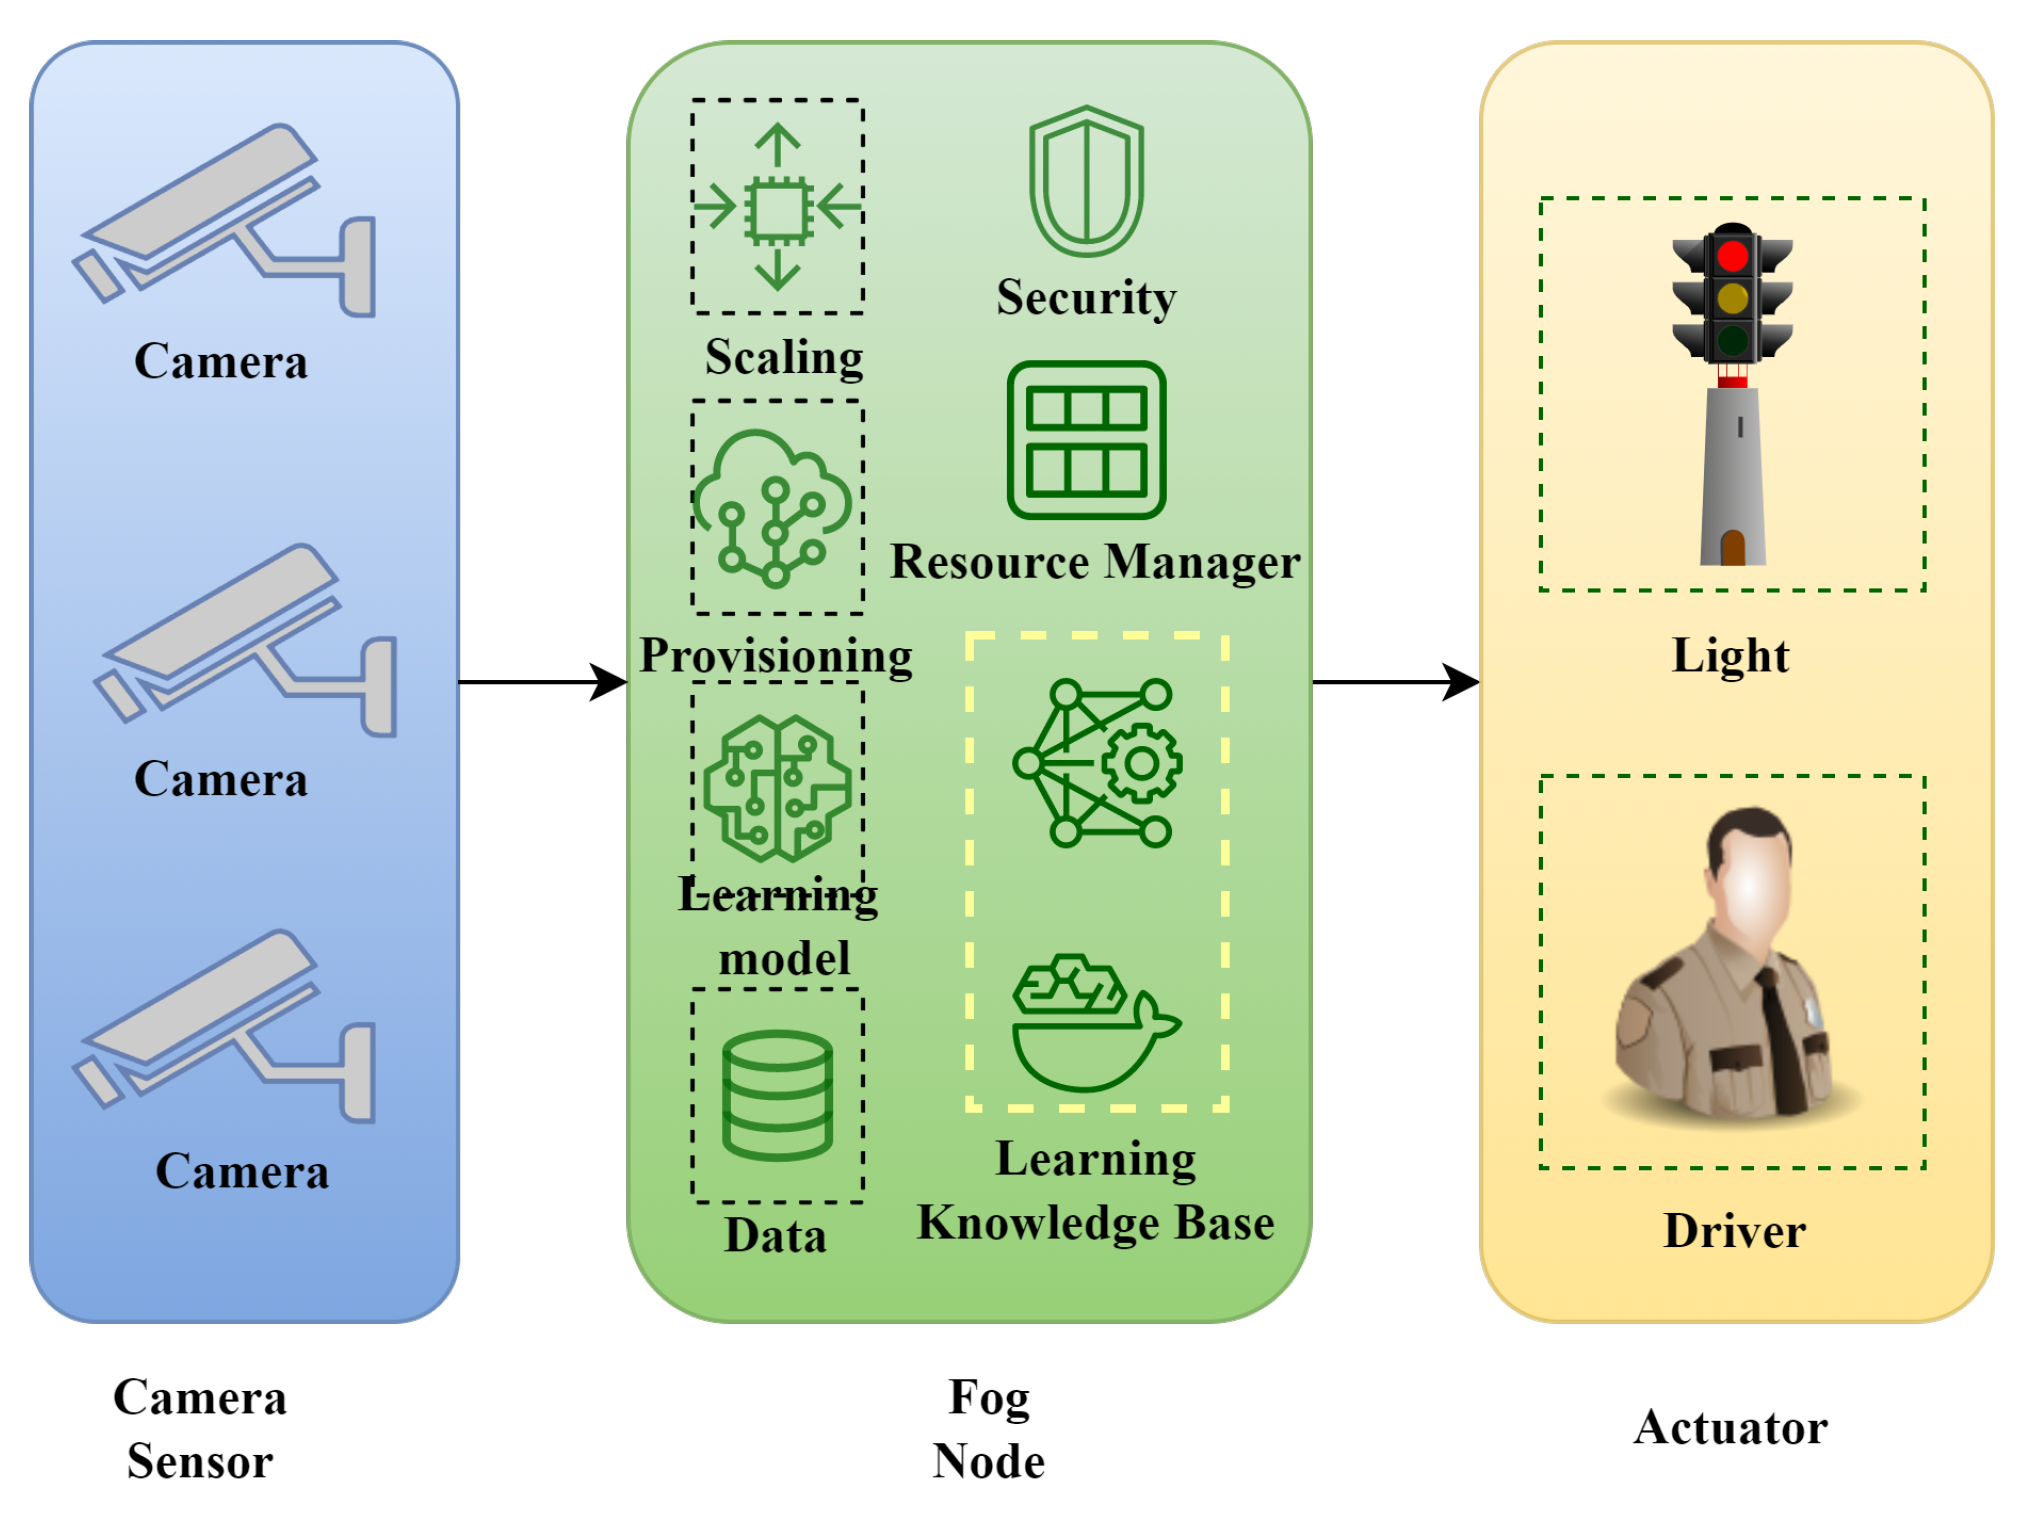
Figure 6 illustrates the internal architecture of the fog node used for object detection. The fog node is responsible for storing data, deploying the learning model, scaling, and resource provisioning. The fog node also contains a learning knowledge base and resource manager.
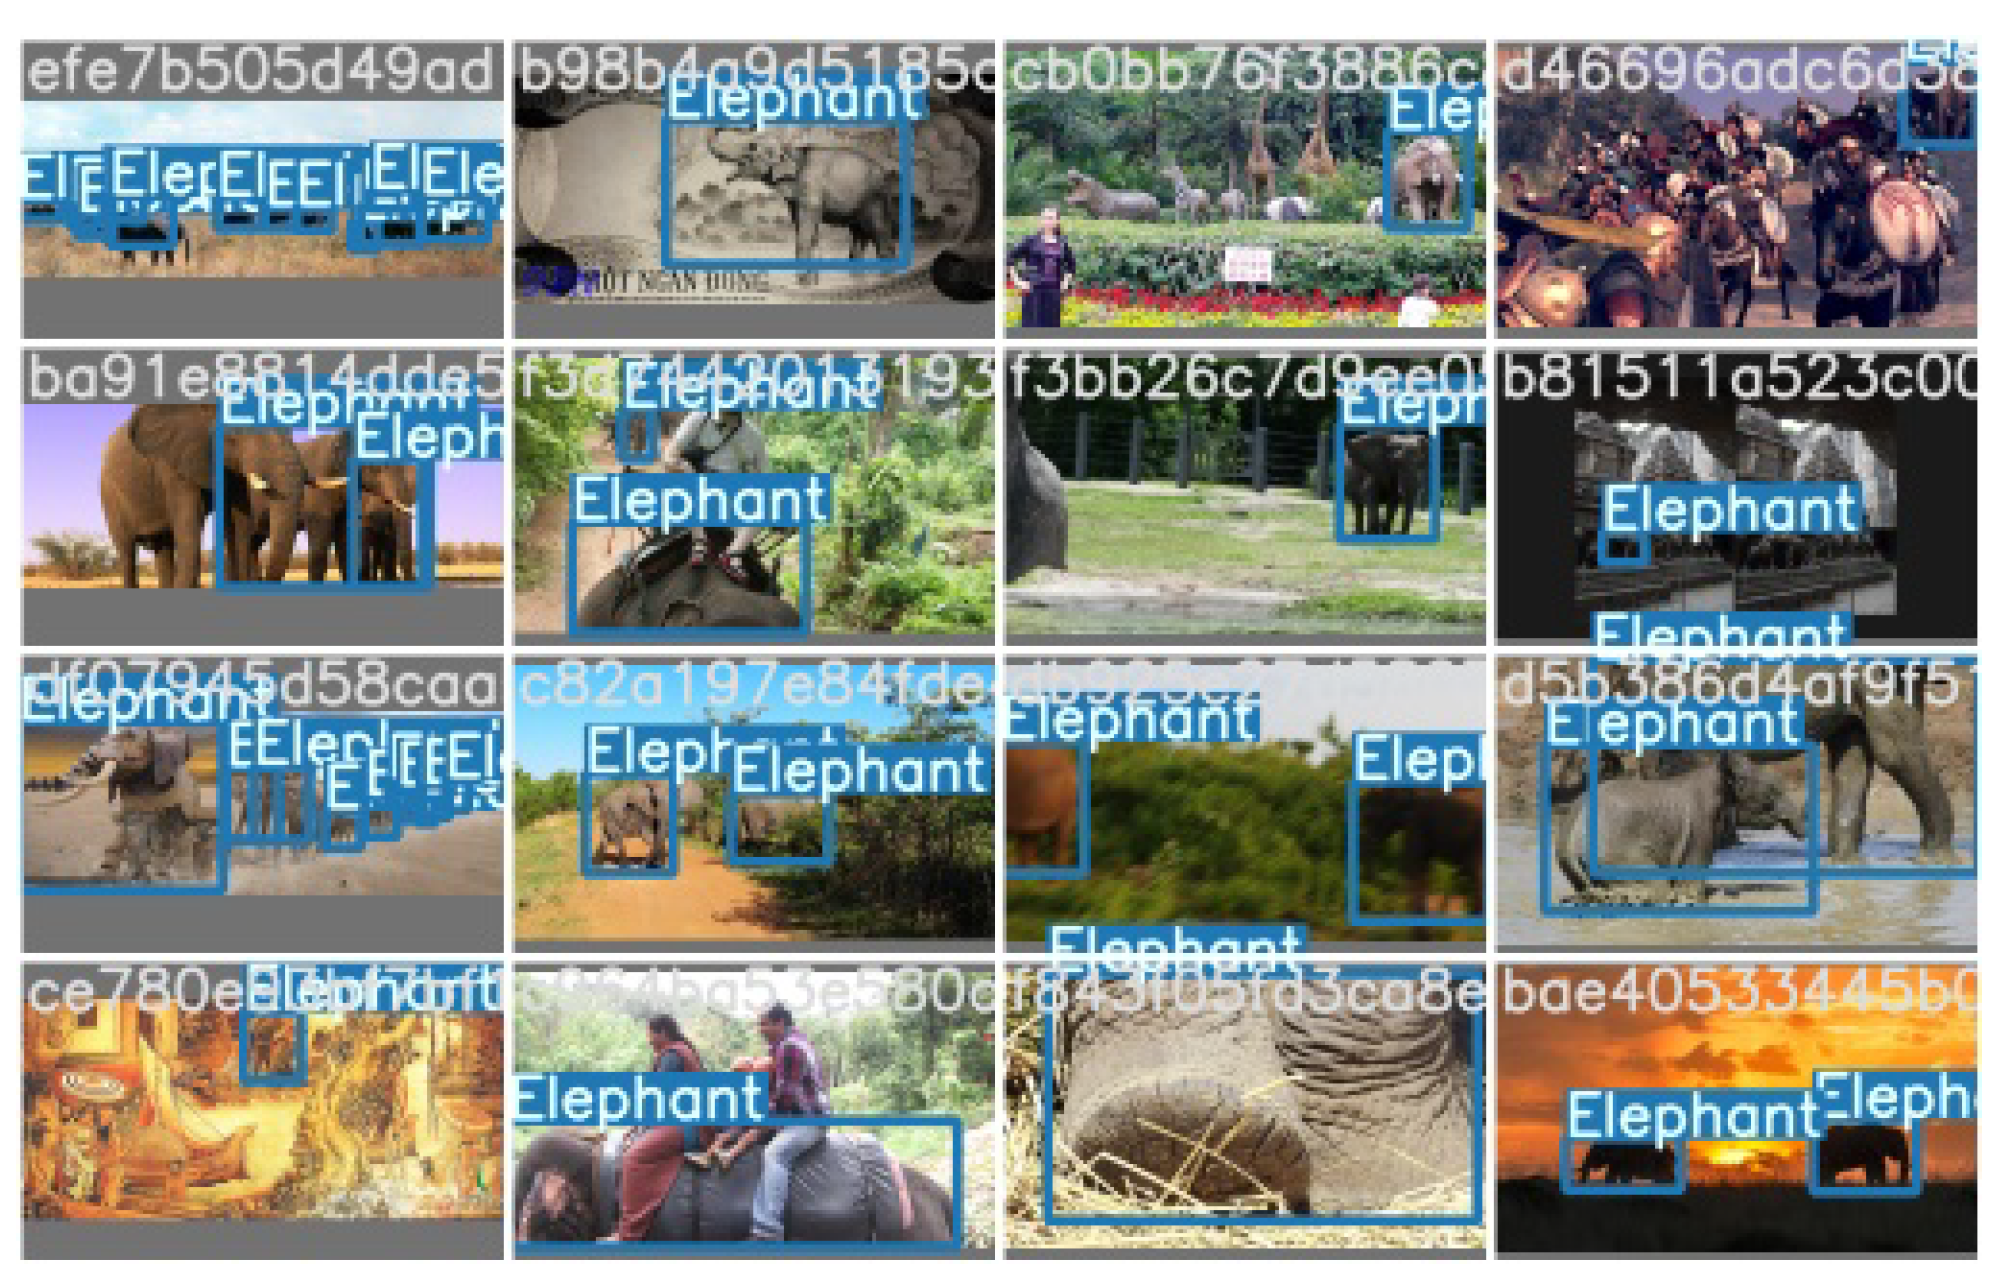
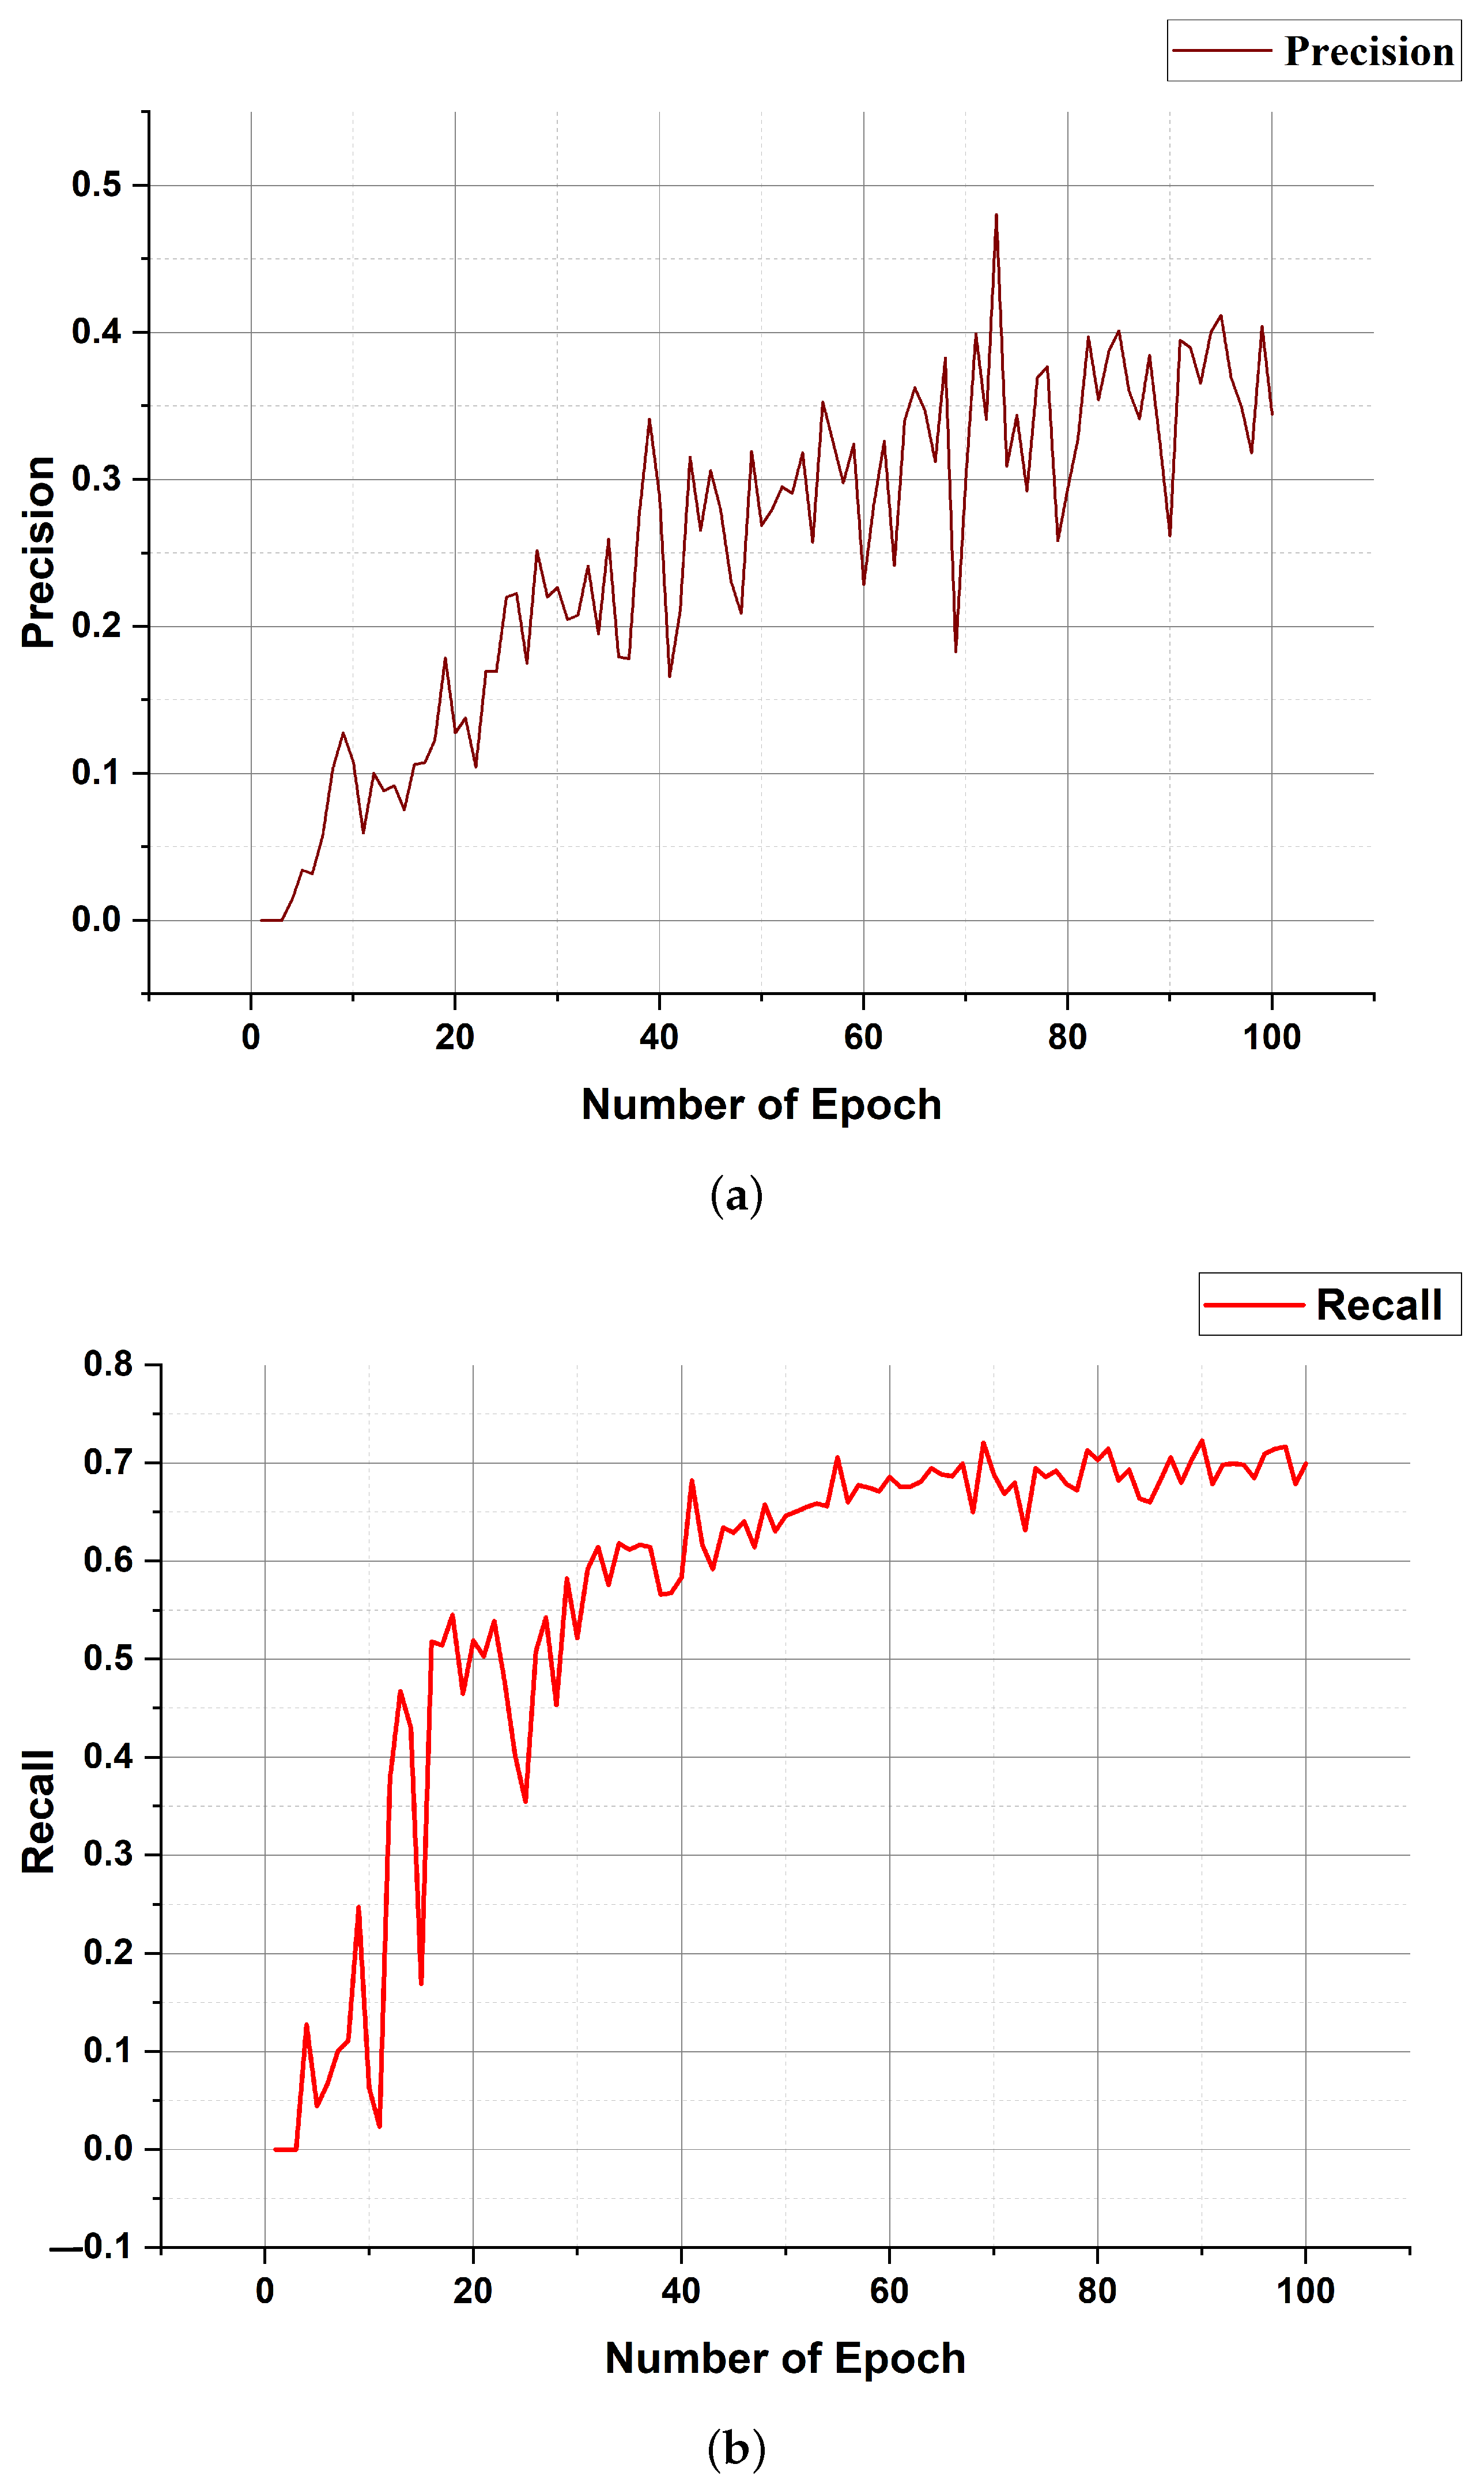
In this study, the deep learning model YOLOv5 is used for training the data set. The customised data set contained 500 images of elephants. 100 elephant images were used for validation. The google collab platform is used to train this model. The model is trained with 100 epochs, and the batch size is 16. Figure 7 illustrates the sample of elephant detection using YOLOv5 model.

3.3. Modules Used in Application Model

Motion detection: This module is connected to the intelligent camera. The camera captures the stream of pictures. The motion detection module extracts the moving element from this image and sends the data to the next module for further processing.
Elephant detection: This elephant detection module receives the data sent by the motion detection module. This module extracts the image of the elephant from the received data. This detection is done based on different image segmentation techniques. One of the detection techniques is explained in simple steps in the previous Algorithm 1. This module also computes the location of each elephant. Table 2 shows some popular algorithms used for real-time detection.
Elephant tracker: The elephant tracking module receives information from the elephant detection module. This module calculates the optimal camera position based on the elephant’s last coordinate. This information is sent to the next camera control module.
Camera Control: The camera control module receives various parameters from the elephant tracker module and moves the camera according to these values.
Light Interface: Based on the presence of elephants, the elephant detection module sends the information to the light interface. This module controls the lighting installed next to the railroad tracks.
Table 3 represents the amount of data generated by the camera sensor after a 5-millisecond interval. That CPU length (Mill. Ins.) represents the number of instructions present on that data and tupleNWlength (Bytes) represents the size of data in Bytes. That is similar to the Video Stream tuple type in Table 4.
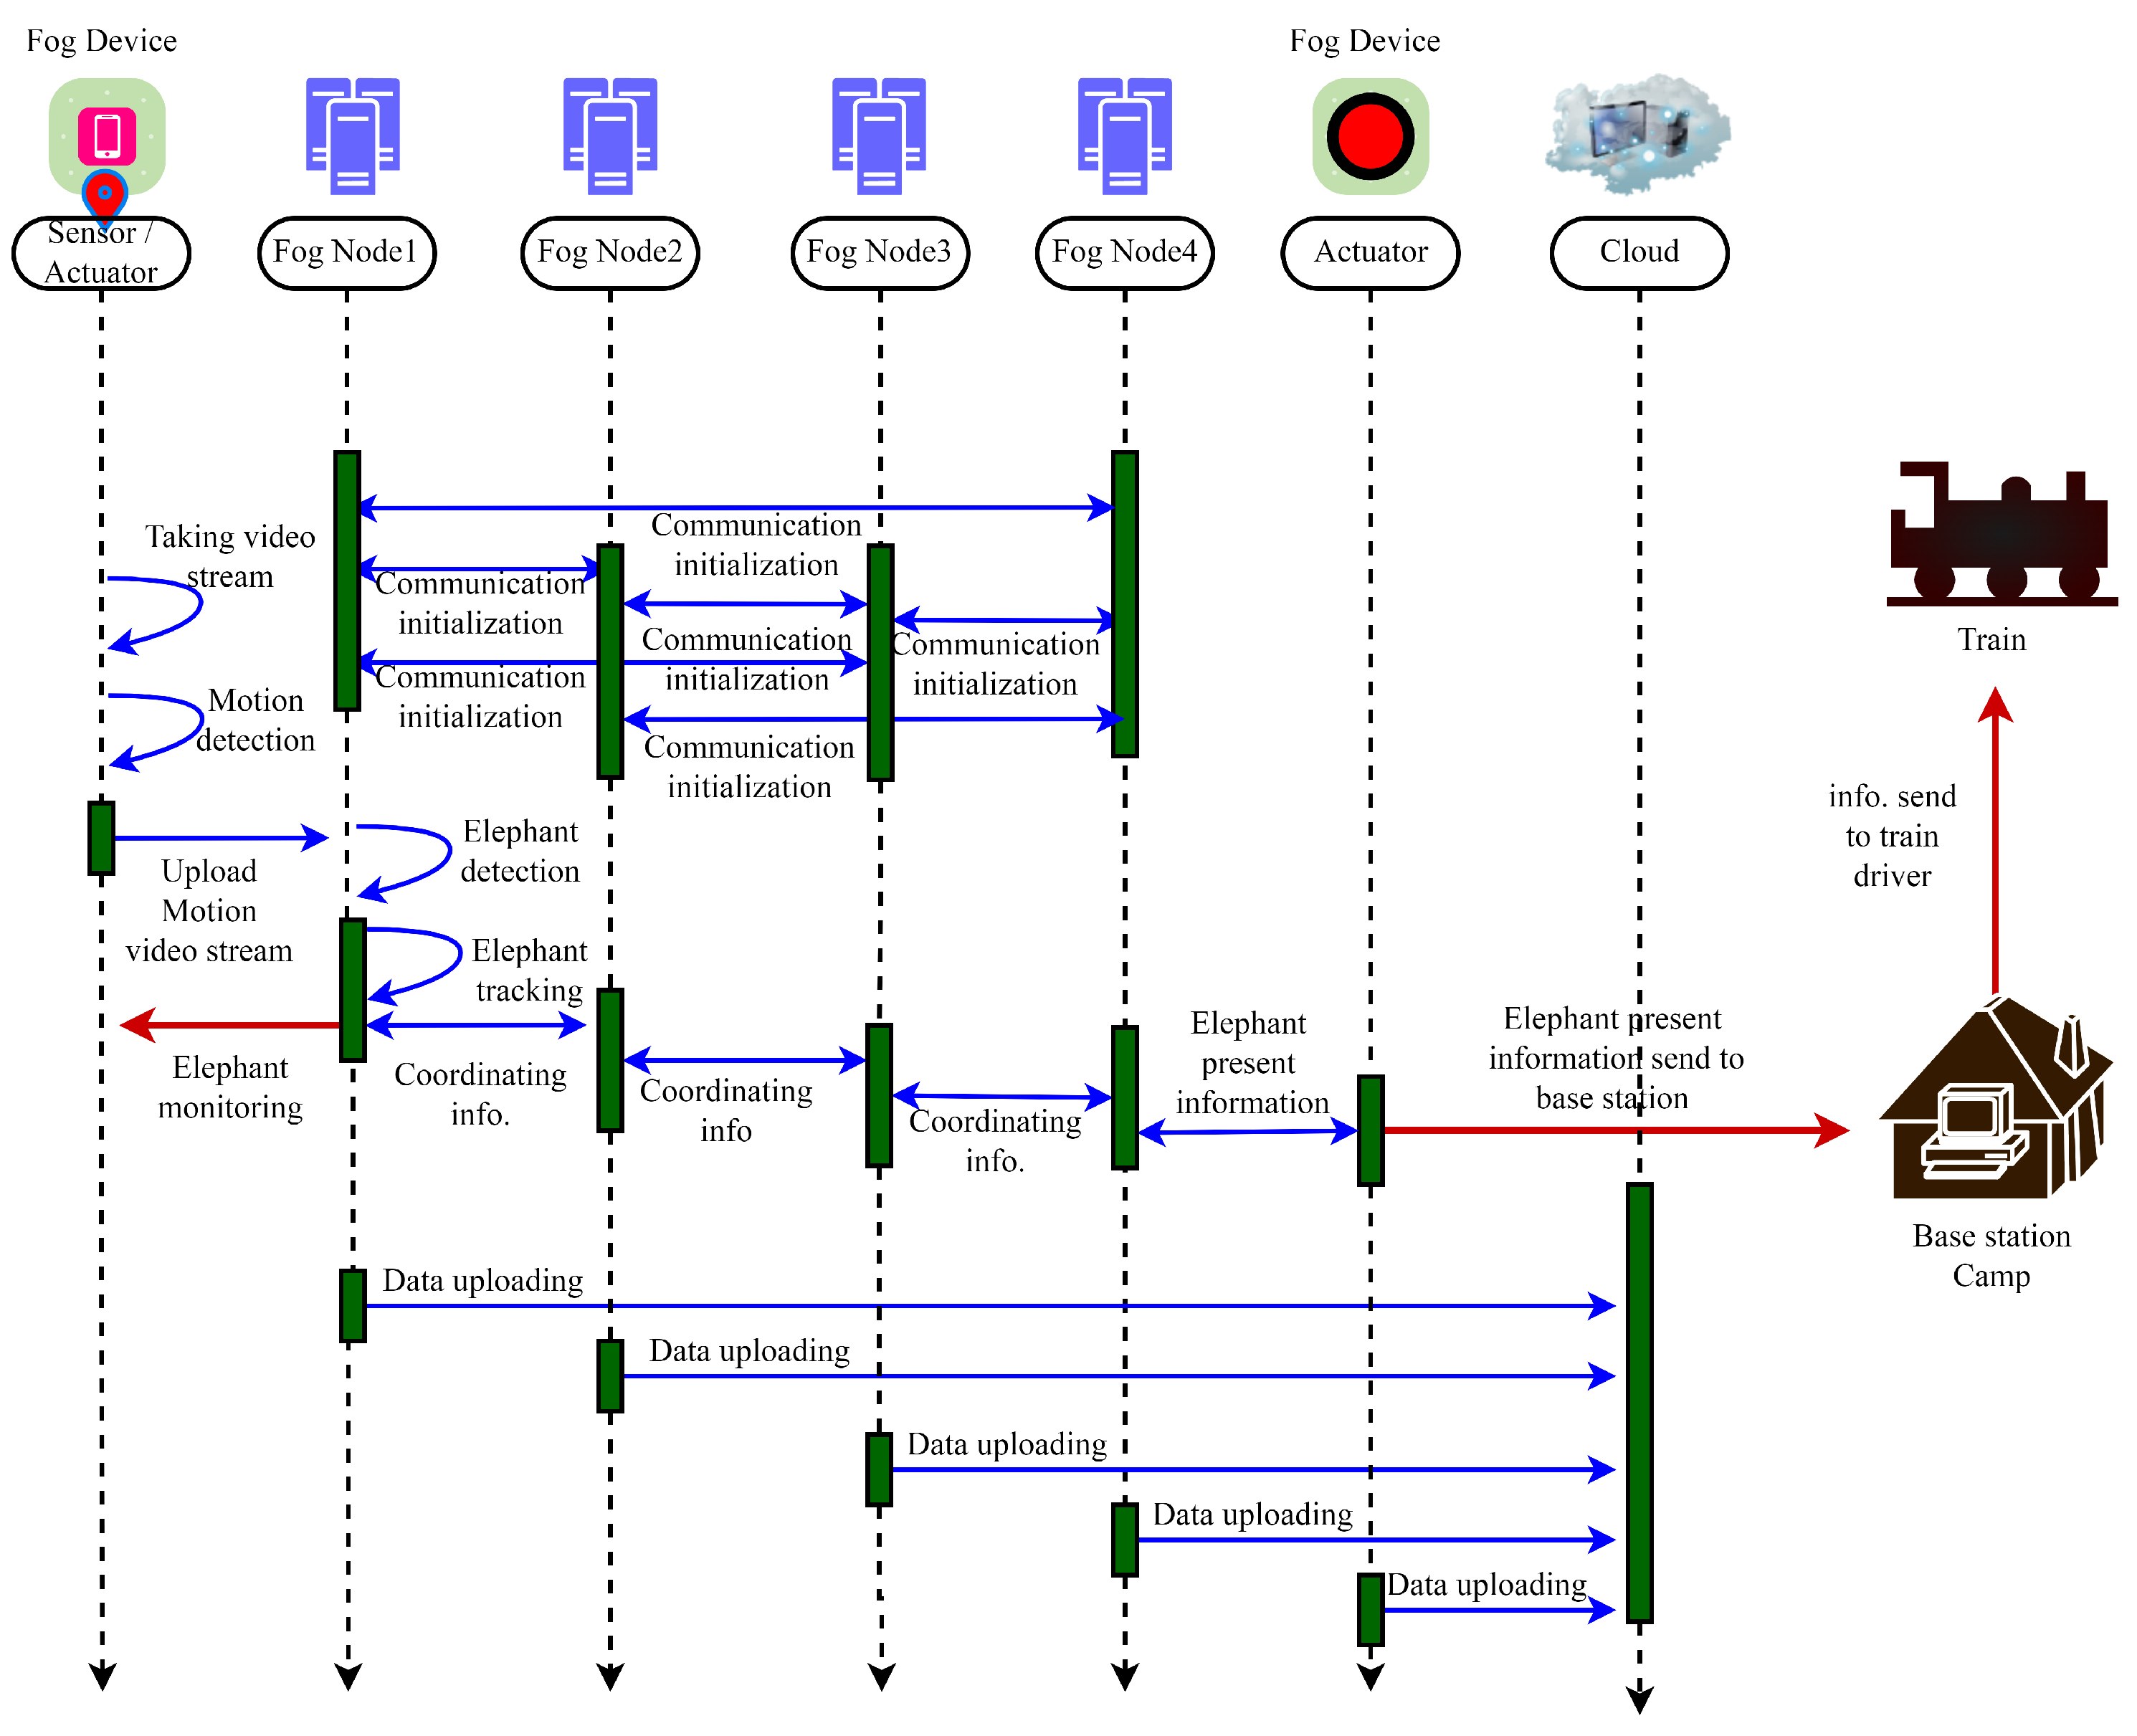
Figure 8 shows the data sequence diagram of the entire system. This figure contains cameras, including a sensor and an actuator, a fog node, a LED light base station, and a rail driver. In our simulation process, the camera is nothing more than a fog device. Within the device, two primary operations take place: (1) recording the raw video. (2) Detecting the motion video and uploading the video to the fog node. Figure 8 consists of four nodes connected by communication links. After the task is placed in this fog node for processing, the fog nodes coordinate with each other. The result is reflected on the LED light and the elephant detection base camp/station.

4. Performance Evaluation

4.1. Experimental Setup

The proposed elephant monitoring framework using fog is implemented in the iFogSim toolkit. The simulation setup used in the article uses the default setup that comes with the iFogSim simulator. Researchers in the field of fog computing are using the same setup in the literature. We did not modify the simulation parameters in the iFogSim rather created an application module and mapped the proposed problem. The proposed framework is applied to reduce the delay and network load of the system. The basic idea is to process the data near the data source instead of remotely. The fog-enabled system processes the data at the fog level. On the other hand, the cloud-based system processes the data in the cloud.
The architecture of both (fog and cloud) scenarios deployed on the iFogSim toolkit [50] simulator, an extension of the very popular cloud simulator CloudSim. The iFogSim toolkit is one of the promising simulation tools for fog and IoT simulations. Compared to other fog simulation tools, it provides better modelling of virtualized fog architecture that supports scalability and dynamic resource management and provisioning, as well as the ability to simulate fog computing applications. Considering all factors, fog architecture successfully reduces various parameters such as execution delay, network utilization, execution time and execution cost. Reducing execution delay is one of the most important improvements in fog scenarios.
To understand the differences between the two frameworks, it is obvious to simulate the same workload. The architectures were implemented and simulated in the Java-based simulator iFogSim. Essentially, five experiments were conducted in the cloud and fog scenarios. Experiment-1, Experiment-2, Experiment-3, Experiment-4, and Experiment-5, are configured based on the number of sensors (cameras), fog devices, and cloud. The details of the camera configuration are shown in one of the following tables. However, Figure 9 shows the topology of Experiment-4 in fog scenarios. Figure 10, on the other hand, shows the topology in the cloud.
Various fog devices, actuators, and sensors were used for simulation purposes. The host is the physical component on which all computations take place. The characteristics of each host are based on various parameters, such as the ×86 architecture used and the Linux operating system installed on each host. In the iFogSim simulator, these fog nodes, actuators and sensors are used as a Java list class. A bottom-up approach was used in this framework. The application method is the layout of the basic framework. The edge devices are attached to the bottom layer, the fog is in the middle, and the cloud layer is on top. The fog broker manages all the tasks that come from the lower layers. Everything is done in the fog broker, from assigning tasks to a specific host to calculating the results. The Mapping module maps the different modules to specific fog devices. The properties of the edges between modules are shown in Table 4. The table describes the size of data transferred between the modules. Tuple type represents the type of data transferred from one module to another. CPU length (Mill. Ins.) describes the required computation power needed to process this data. Whereas the tupleNWlength (Byte) denotes the size of the data transferred between modules in bytes. Each physical device such as fog, proxy and cloud is derived from Fog devices in the simulator. This means that each fog device has its own memory, ram, processor, etc. The actual properties of the physical devices are described in Table 5 and Table 6.
It is necessary to conduct the experiment based on workload traces generated by real systems so that the simulation-based approaches to evaluations are more acceptable. But at the moment there is no such workload. The work consists of five experiments. In each experiment, multiple cameras are installed in the system. The cameras generate a set of video data that serves as a workload in each module. The camera configuration in each experiment is shown in Table 7.
Table 8 illustrates the network latency between devices of physical topology. Gigabyte LAN is installed between cameras and fog nodes. For transferring data to the cloud the system uses an ISP-provided internet connection through a gateway.

4.2. Results and Analysis

The performance of the proposed architecture for detecting and monitoring elephants in fog is implemented and simulated using the popular simulation toolkit iFogSim. In this section, various parameters are analyzed, such as latency-based metrics, network utilization-based metrics, execution time-based metrics, and execution cost-based metrics. Each experiment compares the results of the fog-based environment with a cloud-based environment. The analysis of the results and the graph-based comparison are explained individually in the following subsections.

4.2.1. Analysing Latency Based Metrics

Latency is the key parameter that must be reduced in high-performance computing environments. The main advantage of fog computing is that it performs computations at the edge of the network, often avoiding access to the cloud. Consequently, the fog provides a fast response to the actuator, minimizing latency. Video captured by the camera is transmitted to the fog node for processing. A fog node is available at the edge of the network for all cameras. Since there is a separate fog node for each area, there is enough computing power available to process and detect the object from the data. Once the elephant is detected, information about its presence is available in moments at LED. On the other hand, the location information of the camera control module and the camera control information take a little more time. The latency is calculated using Equation (1) from [50].
L a t e n c y l e d = α + β + γ
where α is the time taken to capture the video stream, and β is the time to upload the video on the fog node for processing and storage purposes. Finally, γ is the time to transmit the information to the LED lights after finishing the detection process on the fog node.
Equation (1) calculates the latency of elephant detection. Whereas, Equation (2) calculates the latency of elephant tracking also via PTZ ( P a n T i l t Z o o m ) camera.
L a t e n c y c a m e r a c o n t r o l = α + β + γ + θ + ϕ
where α , β and γ represent the same as Equation (1). In Equation (2), θ is the time transmission of elephant location to elephant tracker module. Finally, ϕ is the time to transmit the camera control information from the elephant tracker to the intelligent camera controller.
Figure 11 represents a comparative analysis of L a t e n c y i n E l e p h a n t D e t e c t i o n in fog and cloud environments respectively. In Figure 11, the x-axis denotes Physical Topology Configurations and the y-axis denotes delay in milliseconds. The points represent the amount of time taken using each experiment from the x-axis. Similarly, Figure 12 represents a comparative analysis of L a t e n c y i n E l e p h a n t M o n i t o r i n g in both the environments where the x-axis represents Physical Topology Configurations and the y-axis represents the delay in milliseconds respectively.

4.2.2. Analysing Network Usages Based Metrics

Figure 13 shows the network usage of the elephant detection and monitoring application for both deployment strategies. The more devices connected, the higher the network utilization of a system. Similarly, the network load is higher in cloud scenarios than in fog. The fog-based design uses a low-latency edge link for data-intensive communications. Modules such as the elephant detector and elephant tracker are deployed in fog, which significantly reduces the network load. Equation (3) calculates the network usages [50].
N e t w o r k U s a g e = L a t e n c y × ξ
where ξ represents tupleNWSize.

4.2.3. Analysing Execution Time-Based Metrics

Figure 14 demonstrates that the execution time increases when the transmission rate and the number of devices increases. The x-axis shows Physical Topology configurations and, the y-axis shows Execution time in milliseconds. However, this figure clearly shows that the execution time is gradually increasing in each experiment.

4.2.4. Analysing Cost Based Metrics

One of the main objectives is to reduce the cost of the entire system. Figure 15 shows the execution cost of applications in fog and cloud scenarios. The execution cost consists of energy consumption cost, network configuration cost, and operational cost. Equation (4) shows the calculation of the total system cost [51]. In Figure 15, the x-axis represents the cost of execution.
T c o s t = E c o s t + ( T M I P S × L u × R M I P S × L t i m e s × C i )
where T c o s t represents Total Execution Costs, E c o s t represents Execution cost, C i represents CloudSim clock, T M I P S represents total MIPS of the host, R M I P S represents rate per MIPS, L t i m e s represent last utilization update time, and L u represents last utilization.

4.3. Analysing YOLO Model for Elephant Detection

Equation (5) represents the formula for calculating the precision parameter. Whereas, Equation (6) demonstrates the formula for calculating the recall parameter.
P r e c i s i o n = T r u e P o s i t i v e s ( T r u e P o s i t i v e s + F a l s e P o s i t i v e s )
R e c a l l = T r u e P o s i t i v e s ( T r u e P o s i t i v e s + F a l s e N e g a t i v e s )
Figure 16 contains the precision graph and recall graph of elephant detection using YOLOv5. Figure 16a depicts the precision graph. Here the x-axis represents the number of epochs and the y-axis represents precision values. This graph illustrates, how the precision values are behaves over the number of epochs. It clearly states that the precision is improving over the epoch. Figure 16b represents the recall graph. Here the x-axis represents the number of epochs and the y-axis represents recall values.

5. Conclusions and Future Scope

The main objective of the current study is to reduce train–elephant collisions on railroad tracks by developing a framework based on fog computing. The main finding from this research is that the fog computing environment provides comparatively better results on several parameters. These parameters include latency, network utilization, cost of execution, and execution time. The present results clearly support the relevance of the fog computing-based model for elephant monitoring. The study was designed to determine the improvements of fog computing over the cloud. The results of the study indicate that the detection and monitoring of elephants near railroad tracks require lower latency, lower execution time, lower execution cost, and minimal network utilization. All models are simulated in the widely used simulator for fog computing called iFogSim. This approach will prove useful in expanding our understanding of how a fog computing approach is beneficial for latency-sensitive IoT applications. The scope of this study was limited in terms of real-world deployment. Although the current study is based on a simulator, the results suggest several positive outcomes. The question that this study raises is what type of detection algorithm is used to detect elephants. The researchers can use machine learning techniques to update the knowledge base of the system. A better object detection algorithm can be implemented for performance improvements.

Author Contributions

Conceptualization—M.K.M. and R.M.; methodology—M.K.M.; software—M.K.M. and A.T.; validation—M.K.M., R.M. and S.B.; formal analysis—M.K.M. and O.A.; investigation—M.K.M. and A.T.; resources—M.K.M. and J.C.-W.L.; data curation—M.K.M., J.C.-W.L. and A.T.; writing—original draft preparation—M.K.M.; writing—review and editing, R.M., S.B. and J.C.-W.L.; visualization—M.K.M., J.C.-W.L. and R.M.; supervision—U.B. and S.B.; project administration—S.B. and U.B. All authors have read and agreed to the published version of the manuscript.

Funding

This work was funded by the Researchers Supporting Project Number (RSPD2023R681) King Saud University, Riyadh, Saudi Arabia.

Institutional Review Board Statement

Not applicable.

Informed Consent Statement

Not applicable.

Data Availability Statement

Not applicable.

Conflicts of Interest

The authors declare no conflict of interest.

Abbreviations

The following abbreviations are used in this manuscript:
LEDLight-emitting diode
MIPSMillion instructions per second
MBMegaBytes
CPSCyber-physical systems
MECMulti-Access Edge Computing
NVFVirtualized network function
ARMAdvanced RISC Machine
IoTInternet of Things
SoCSystem on a Chip
IRIndian Railways
RGBRed, Green, and Blue
SASituational awareness
SDNSoftware-Defined Network
R-CNNRegion-Based Convolutional Network
HOGHistogram of Oriented Gradients
R-FCNRegion-based Fully Convolutional Network
SSDSingle Shot Detector
SPP-netSpatial Pyramid Pooling
LANLocal Area Network
YOLOYou Only Look Once

References

  1. Fryxell, J.M.; Sinclair, A.R.; Caughley, G. Wildlife Ecology, Conservation, and Management; John Wiley & Sons: Hoboken, NJ, USA, 2014. [Google Scholar]
  2. Forman, R.T.; Deblinger, R.D. The ecological road-effect zone of a Massachusetts (USA) suburban highway. Conserv. Biol. 2000, 14, 36–46. [Google Scholar] [CrossRef]
  3. Joyce, T.L.; Mahoney, S.P. Spatial and temporal distributions of moose-vehicle collisions in Newfoundland. In Wildlife Society Bulletin; John Wiley & Sons: Hoboken, NJ, USA, 2001; pp. 281–291. [Google Scholar]
  4. Andersen, R.; Wiseth, B.; Pedersen, P.H.; Jaren, V. Moose-train collisions: Effects of environmental conditions. Alces J. Devoted Biol. Manag. Moose 1991, 27, 79–84. [Google Scholar]
  5. Modafferi, R.D. Train moose-kill in Alaska: Characteristics and relationship with snowpack depth and moose distribution in lower Susitna Valley. Alces J. Devoted Biol. Manag. Moose 1991, 27, 196–207. [Google Scholar]
  6. Kusta, T.; Hola, M.; Keken, Z.; Jezek, M.; Zika, T.; Hart, V. Deer on the railway line: Spatiotemporal trends in mortality patterns of roe deer. Turk. J. Zool. 2014, 38, 479–485. [Google Scholar] [CrossRef]
  7. Editor. Assam: 5 Elephants Killed by Speeding Train. 2018. Available online: https://arunachal24.in/assam-5-elephant-killed-by-speeding-train// (accessed on 18 December 2022).
  8. Thomus, W. Train Hits Elephant near Tamil Nadu-Kerala Border, Severely Injuring It. 2021. Available online: https://www.thehindu.com/news/cities/Coimbatore/train-hits-elephant-near-tamil-nadu-kerala-border-severely-injuring-it/article34073039.ece (accessed on 18 December 2022).
  9. Roy, M.; Baskaran, N.; Sukumar, R. The death of jumbos on railway tracks in northern West Bengal. Gajah 2009, 31, 36–39. [Google Scholar]
  10. Sarma, U.; Easa, P.; Menon, V. Deadly Tracks—A Scientific Approach to Understanding and Mitigating Elephant Mortality Due to Train Hits in Assam. Wildlife Trust of India. New Delhi. 2006. Available online: http://www.indiaenvironmentportal.org.in/files/Deadly%20Tracks.pdf (accessed on 13 December 2022).
  11. Jha, N.; Sarma, K.; Bhattacharya, P. Assessment of elephant (Elephas maximus) mortality along Palakkad-Coimbatore railway stretch of Kerala and Tamil Nadu using geospatial technology. J. Biodivers Manag. For. 2014, 1, 2. [Google Scholar]
  12. Singh, A.; Kumar, A.; Mookerjee, A.; Menon, V. Jumbo Express—A Scientific Approach to Understanding and Mitigating Elephant Mortality Due to Train Accidents. Animal Welfare. September 2001. Available online: https://wti.org.in/wp-content/uploads/2017/03/pub_jumbo_express.pdf (accessed on 14 December 2022).
  13. Wilson, T. 186 Elephants Killed on Railway Tracks in over 10 Years: MoEFCC. 2021. Available online: https://www.thehindu.com/news/national/186-elephants-killed-on-railway-tracks-in-over-10-years-moefcc/article34558401.ece (accessed on 18 December 2022).
  14. PTI. Elephant Killed after Being Hit by Goods Train in J’khand. 2022. Available online: https://theprint.in/india/elephant-killed-after-being-hit-by-goods-train-in-jkhand/946488/ (accessed on 19 December 2022).
  15. Editor. 45 Elephants Killed in Train Accidents in 2019–2021: Govt. 2022. Available online: https://indianexpress.com/article/cities/bangalore/45-elephants-killed-train-accidents-in-2019-2021-govt-8071210/ (accessed on 20 December 2022).
  16. Roy, M.; Sukumar, R. Railways and Wildlife: A Case Study of Train-Elephant Collisions in Northern West Bengal, India; Springer: Cham, Swtizerland, 2017; pp. 157–177. [Google Scholar]
  17. Mandal, R.; Mondal, M.K.; Banerjee, S.; Biswas, U. An approach toward design and development of an energy-aware VM selection policy with improved SLA violation in the domain of green cloud computing. J. Supercomput. 2020, 76, 7374–7393. [Google Scholar] [CrossRef]
  18. Mandal, R.; Mondal, M.K.; Banerjee, S.; Srivastava, G.; Ghosh, U.; Alnumay, W.; Biswas, U. MECpVmS: An SLA aware energy-efficient virtual machine selection policy for green cloud computing. Cluster Comput. 2022, 26, 651–665. [Google Scholar] [CrossRef]
  19. Mukherjee, M.; Shu, L.; Wang, D. Survey of fog computing: Fundamental, network applications, and research challenges. IEEE Commun. Surv. Tutor. 2018, 20, 1826–1857. [Google Scholar] [CrossRef]
  20. Chang, Y.C.P.; Chen, S.; Wang, T.J.; Lee, Y. Fog computing node system software architecture and potential applications for NB-IoT industry. In Proceedings of the 2016 International Computer Symposium (ICS), Chiayi, Taiwan, 15–17 December 2016; pp. 727–730. [Google Scholar]
  21. Alrawais, A.; Alhothaily, A.; Hu, C.; Cheng, X. Fog computing for the internet of things: Security and privacy issues. IEEE Internet Comput. 2017, 21, 34–42. [Google Scholar] [CrossRef]
  22. Mandal, R.; Mondal, M.K.; Banerjee, S.; Chatterjee, P.; Mansoor, W.; Biswas, U. PbV mSp: A priority-based VM selection policy for VM consolidation in green cloud computing. In Proceedings of the 5th International Conference on Signal Processing and Information Security (ICSPIS), Dubai, United Arab Emirates, 7–8 December 2022; pp. 32–37. [Google Scholar]
  23. Mandal, R.; Mondal, M.K.; Banerjee, S.; Chatterjee, P.; Mansoor, W.; Biswas, U. Design and implementation of an SLA and energy-aware VM placement policy in green cloud computing. In Proceedings of the 2022 IEEE Globecom Workshops (GC Wkshps), Rio de Janeiro, Brazil, 4–8 December 2022; pp. 777–782. [Google Scholar]
  24. Vilalta, R.; López, V.; Giorgetti, A.; Peng, S.; Orsini, V.; Velasco, L.; Serral-Gracia, R.; Morris, D.; De Fina, S.; Cugini, F.; et al. TelcoFog: A unified flexible fog and cloud computing architecture for 5G networks. IEEE Commun. Mag. 2017, 55, 36–43. [Google Scholar] [CrossRef]
  25. Dar, B.K.; Shah, M.A.; Shahid, H.; Naseem, A. Fog computing based automated accident detection and emergency response system using android smartphone. In Proceedings of the 2018 14th International Conference on Emerging Technologies (ICET), Izmir, Turkey, 12–14 September 2018; pp. 1–6. [Google Scholar]
  26. Dastjerdi, A.V.; Gupta, H.; Calheiros, R.N.; Ghosh, S.K.; Buyya, R. Fog computing: Principles, architectures, and applications. In Internet of Things; Elsevier: Amsterdam, The Netherlands, 2016; pp. 61–75. [Google Scholar]
  27. Dastjerdi, A.V.; Buyya, R. Fog computing: Helping the Internet of Things realize its potential. Computer 2016, 49, 112–116. [Google Scholar] [CrossRef]
  28. Saharan, K.; Kumar, A. Fog in comparison to cloud: A survey. Int. J. Comput. Appl. 2015, 122, 10–12. [Google Scholar]
  29. Gupta, S.; Garg, R.; Gupta, N.; Alnumay, W.S.; Ghosh, U.; Sharma, P.K. Energy-efficient dynamic homomorphic security scheme for fog computing in IoT networks. J. Inf. Secur. Appl. 2021, 68, 102768. [Google Scholar] [CrossRef]
  30. Atlam, H.F.; Walters, R.J.; Wills, G.B. Fog computing and the internet of things: A review. Big Data Cogn. Comput. 2018, 2, 10. [Google Scholar] [CrossRef]
  31. Chen, N.; Chen, Y.; Song, S.; Huang, C.T.; Ye, X. Smart urban surveillance using fog computing. In Proceedings of the 2016 IEEE/ACM Symposium on Edge Computing (SEC), Washington, DC, USA, 27–28 October 2016; pp. 95–96. [Google Scholar]
  32. Liu, G.; Liu, S.; Muhammad, K.; Sangaiah, A.K.; Doctor, F. Object tracking in vary lighting conditions for fog based intelligent surveillance of public spaces. IEEE Access 2018, 6, 29283–29296. [Google Scholar] [CrossRef]
  33. Grambow, M.; Hasenburg, J.; Bermbach, D. Public video surveillance: Using the fog to increase privacy. In Proceedings of the 5th Workshop on Middleware and Applications for the Internet of Things, Rennes, France, 10–14 December 2018; pp. 11–14. [Google Scholar]
  34. Munir, A.; Kwon, J.; Lee, J.H.; Kong, J.; Blasch, E.; Aved, A.J.; Muhammad, K. FogSurv: A fog-assisted architecture for urban surveillance using artificial intelligence and data fusion. IEEE Access 2021, 9, 111938–111959. [Google Scholar] [CrossRef]
  35. Singh, K.D.; Sood, S.K. Optical fog-assisted cyber-physical system for intelligent surveillance in the education system. Comput. Appl. Eng. Educ. 2020, 28, 692–704. [Google Scholar] [CrossRef]
  36. Mondal, M.K.; Mandal, R.; Banerjee, S.; Biswas, U.; Chatterjee, P.; Alnumay, W. A CPS based social distancing measuring model using Edge and Fog computing. Comput. Commun. 2022, 194, 378–386. [Google Scholar] [CrossRef]
  37. Fathy, C.; Saleh, S.N. Integrating deep learning-based iot and fog computing with software-defined networking for detecting weapons in video surveillance systems. Sensors 2022, 22, 5075. [Google Scholar] [CrossRef]
  38. Chen, N.; Chen, Y.; Ye, X.; Ling, H.; Song, S.; Huang, C.T. Smart city surveillance in fog computing. In Advances in Mobile Cloud Computing and Big Data in the 5G Era; Springer: Berlin/Heidelberg, Germany, 2017; pp. 203–226. [Google Scholar]
  39. Reddy, D.K.K.; Behera, H.S.; Nayak, J.; Naik, B.; Ghosh, U.; Sharma, P.K. Exact greedy algorithm based split finding approach for intrusion detection in fog-enabled IoT environment. J. Inf. Secur. Appl. 2021, 60, 102866. [Google Scholar] [CrossRef]
  40. Rawat, R.; Chakrawarti, R.K.; Vyas, P.; Gonzáles, J.L.A.; Sikarwar, R.; Bhardwaj, R. Intelligent Fog Computing Surveillance System for Crime and Vulnerability Identification and Tracing. Int. J. Inf. Secur. Priv. (IJISP) 2023, 17, 1–25. [Google Scholar] [CrossRef]
  41. Chen, N.; Chen, Y.; You, Y.; Ling, H.; Liang, P.; Zimmermann, R. Dynamic urban surveillance video stream processing using fog computing. In Proceedings of the 2016 IEEE Second International Conference on Multimedia Big Data (BigMM), Taipei, Taiwan, 20–22 April 2016; pp. 105–112. [Google Scholar]
  42. Das, D.; Banerjee, S.; Chatterjee, P.; Ghosh, U.; Biswas, U. A Secure Blockchain Enabled V2V Communication System Using Smart Contracts. IEEE Trans. Intell. Transp. Syst. 2022, 1–10. [Google Scholar] [CrossRef]
  43. Das, D.; Banerjee, S.; Dasgupta, K.; Chatterjee, P.; Ghosh, U.; Biswas, U. Blockchain Enabled SDN Framework for Security Management in 5G Applications. In Proceedings of the 24th International Conference on Distributed Computing and Networking (IIT), Kharagpur, India, 4–7 January 2023; pp. 414–419. [Google Scholar]
  44. Singh, P.; Nayyar, A.; Kaur, A.; Ghosh, U. Blockchain and Fog Based Architecture for Internet of Everything in Smart Cities. Future Internet 2020, 12, 61. [Google Scholar] [CrossRef]
  45. Sarkar, I.; Kumar, S. Fog computing based intelligent security surveillance using PTZ controller camera. In Proceedings of the 2019 10th International Conference on Computing, Communication and Networking Technologies (ICCCNT), Kanpur, Indonesia, 6–8 July 2019; pp. 1–5. [Google Scholar]
  46. Ledakis, I.; Bouras, T.; Kioumourtzis, G.; Skitsas, M. Adaptive edge and fog computing paradigm for wide area video and audio surveillance. In Proceedings of the 2018 9th International Conference on Information, Intelligence, Systems and Applications (IISA), Zakynthos, Greece, 23–25 July 2018; pp. 1–5. [Google Scholar]
  47. Techwin, H. Flateye Cameras. 2018. Available online: https://www.hanwhasecurity.com/products-page/security-cameras/form-factor/flateye/ (accessed on 22 December 2022).
  48. Redmon, J.; Divvala, S.; Girshick, R.; Farhadi, A. You only look once: Unified, real-time object detection. In Proceedings of the IEEE Conference on Computer Vision and Pattern Recognition, Las Vegas, NV, USA, 26 June–1 July 2016; pp. 779–788. [Google Scholar]
  49. Chandan, G.; Jain, A.; Jain, H. Real time object detection and tracking using Deep Learning and OpenCV. In Proceedings of the 2018 International Conference on Inventive Research in Computing Applications (ICIRCA), Coimbatore, India, 11–12 July 2018; pp. 1305–1308. [Google Scholar]
  50. Gupta, H.; Vahid Dastjerdi, A.; Ghosh, S.K.; Buyya, R. iFogSim: A toolkit for modeling and simulation of resource management techniques in the Internet of Things, Edge and Fog computing environments. Software Pract. Exp. 2017, 47, 1275–1296. [Google Scholar] [CrossRef]
  51. Hassan, S.R.; Ahmad, I.; Ahmad, S.; Alfaify, A.; Shafiq, M. Remote pain monitoring using fog computing for e-healthcare: An efficient architecture. Sensors 2020, 20, 6574. [Google Scholar] [CrossRef] [PubMed]
Figure 1. Train–elephant collision in Assam [7] and Tamil Nadu [8].
Sustainability 15 05944 g001
Figure 2. Fog-Assisted Elephant Corridor Over the Railway Track.
Sustainability 15 05944 g002
Figure 3. Workflow diagram of Proposed Framework.
Sustainability 15 05944 g003
Figure 4. Application model for Elephant Detection & Monitoring in Simulator (iFogSim).
Sustainability 15 05944 g004
Figure 5. Neural network architecture of YOLO [48].
Sustainability 15 05944 g005
Figure 6. Fog node system view.
Sustainability 15 05944 g006
Figure 7. Sample elephant detection using YOLOv5.
Sustainability 15 05944 g007
Figure 8. A Sequence diagram of Proposed Framework.
Sustainability 15 05944 g008
Figure 9. Fog enabled Topology for Experiment-4.
Sustainability 15 05944 g009
Figure 10. Cloud enable Topology for Experiment-4.
Sustainability 15 05944 g010
Figure 11. Analysing Latency Based Metrics: Average delay of the control loop (Elephant Detection).
Sustainability 15 05944 g011
Figure 12. Analysing Latency Based Metrics: Average delay of the control loop (Elephant Monitoring).
Sustainability 15 05944 g012
Figure 13. Analysing Network Usage Based Metrics.
Sustainability 15 05944 g013
Figure 14. Analysing Execution time Based Metrics.
Sustainability 15 05944 g014
Figure 15. Analysing Cost of Execution Based Metrics.
Sustainability 15 05944 g015
Figure 16. Analysing Precision and Recall Metrics. (a) Precision Metrics; (b) Recall Metrics.
Sustainability 15 05944 g016
Table 1. Indian State wise Elephant death due to train hit from 2009–2010 to 2020–2021 [13].
StateNumber of Death
Assam62
West Bengal57
Odisha27
Uttarakhand14
TamilNadu5
Karnataka3
Tripura1
Uttar Pradesh1
Table 2. Popular Object Detection algorithms.
AlgorithmDescriptions
Fast R-CNNFast Region-Based Convolutional Network
Faster R-CNNFaster R-CNN
HOGHistogram of Oriented Gradients
R-CNNRegion-based Convolutional Neural Networks
R-FCNRegion-based Fully Convolutional Network
SSDSingle Shot Detector
SPP-netSpatial Pyramid Pooling
YOLOYou Only Look Once
Table 3. Sensor Configuration for Elephant Monitoring.
CPU Length (Mill. Ins.)tupleNWlength (Bytes)Interval Time
1000 million instruction20,000 Bytes5 ms
Table 4. Inter-module edges properties in the Elephant Detection & Monitoring Application.
Tuple TypeCPU Length (Mill. Ins.)tupleNWlength (Byte)
Video Stream100020,000
Motion Detection Stream20002000
Elephant Detection5002000
Elephant Location1000100
Camera Control Info.100100
Table 5. Value of parameters of Fog, Proxy and Cloud for the fog-based scenario.
ParameterCloudProxyFog
CPU length (MIPS)44,80028002800
RAM (MB)40,00040004000
Level012
Up-link Bandwidth (MB)10010,00010,000
Down-link Bandwidth (MB)10,00010,00010,000
RatePerMIPS0.010.00.0
Busy Power (Watt)16 × 103107.339107.339
Idle Power (Watt)16 × 83.2583.4383.43
Table 6. Value of parameters of Cloud and Router for the cloud-based scenario.
ParameterCloudRouter
CPU length(MIPS)44,8002800
RAM (MB)40,0004000
Level01
Up-link Bandwidth (MB)10010,000
Downlink Bandwidth (MB)10,00010,000
RatePerMIPS0.010.0
Busy Power (Wathe tt)16 × 103107.339
Idle Power (watt)16 × 83.2583.43
Table 7. Number of Cameras are installed in cloud-based.
Experiment NoNumber of Cameras
Experiment-14
Experiment-28
Experiment-312
Experiment-416
Experiment-520
Table 8. Network description of physical topology.
SourceDestinationLatency (ms)
CameraFog node2
Fog nodeProxy (Gateway)2
CameraRouter (Gateway)2
Proxy/Router (Gateway)Cloud (DC)100
Disclaimer/Publisher’s Note: The statements, opinions and data contained in all publications are solely those of the individual author(s) and contributor(s) and not of MDPI and/or the editor(s). MDPI and/or the editor(s) disclaim responsibility for any injury to people or property resulting from any ideas, methods, instructions or products referred to in the content.

