
Fatigue Life Evaluation of Orthotropic Steel Deck of Steel Bridges Using Experimental and Numerical Methods


Abstract
:1. Introduction
2. Fatigue Crack Expansion and Analysis of Calculation Results
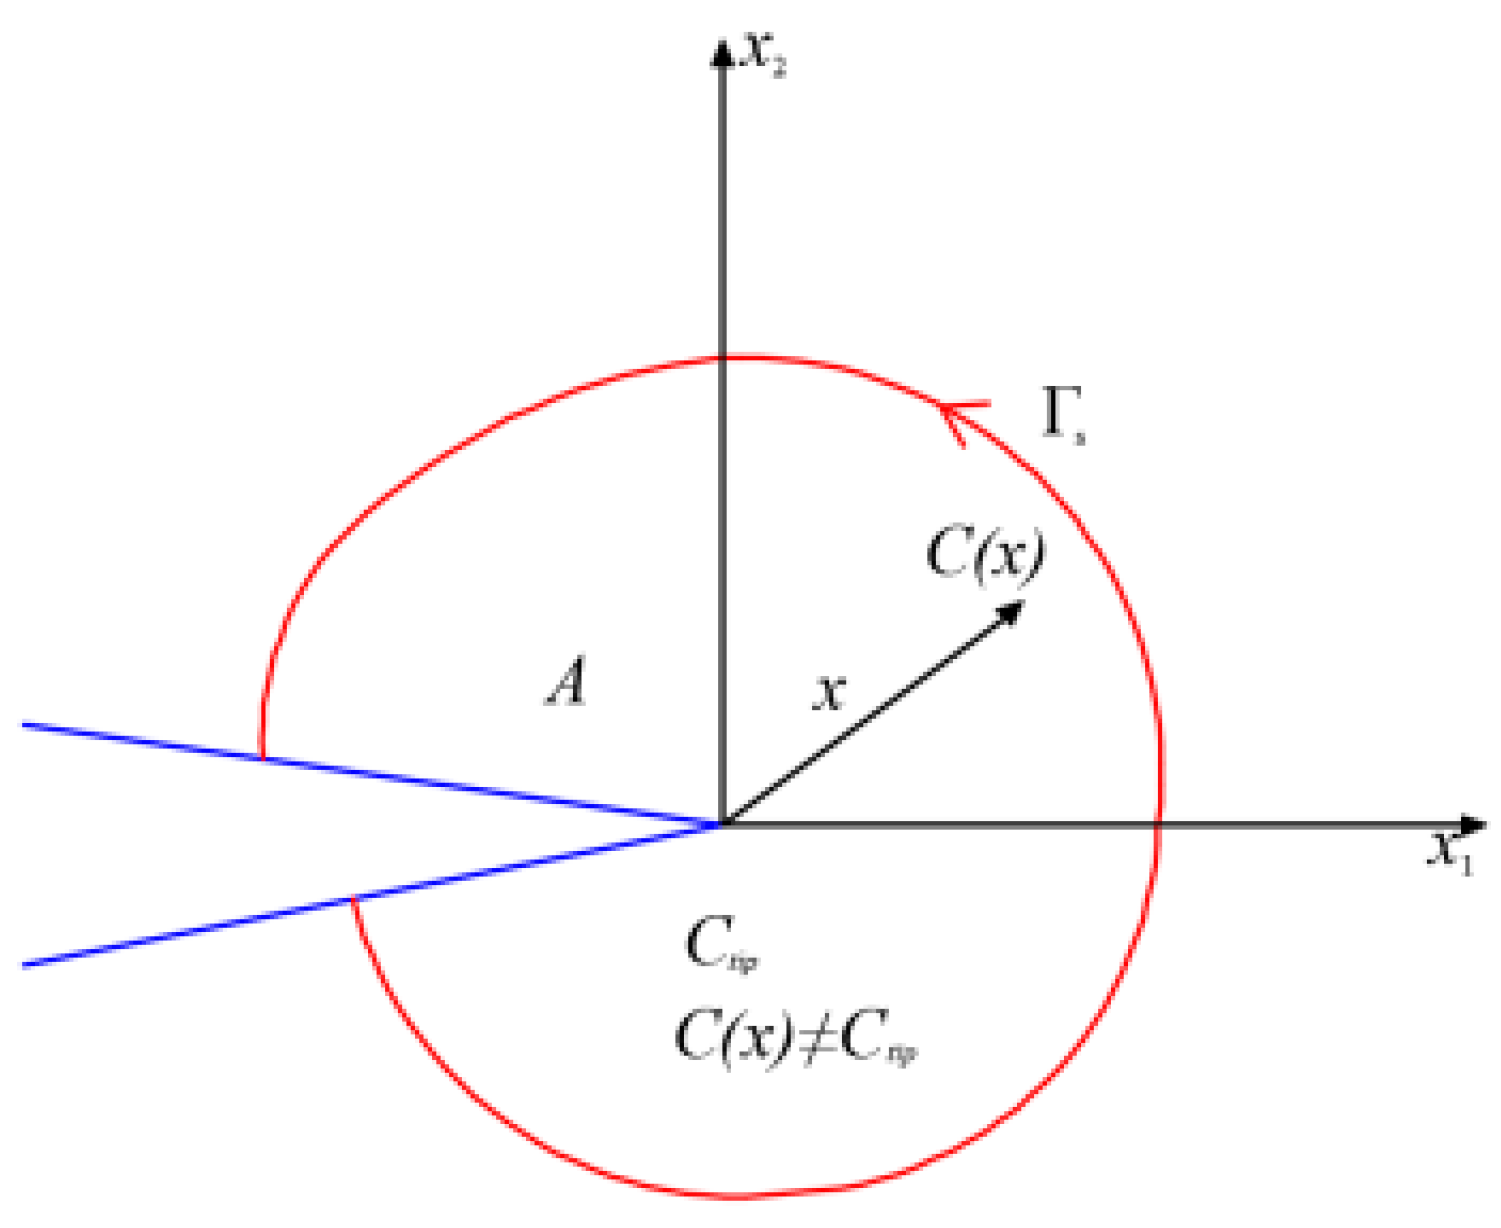
2.1. Calculation of the Stress Intensity Factor
2.2. Fatigue Life Assessment Method Based on Fracture Mechanics
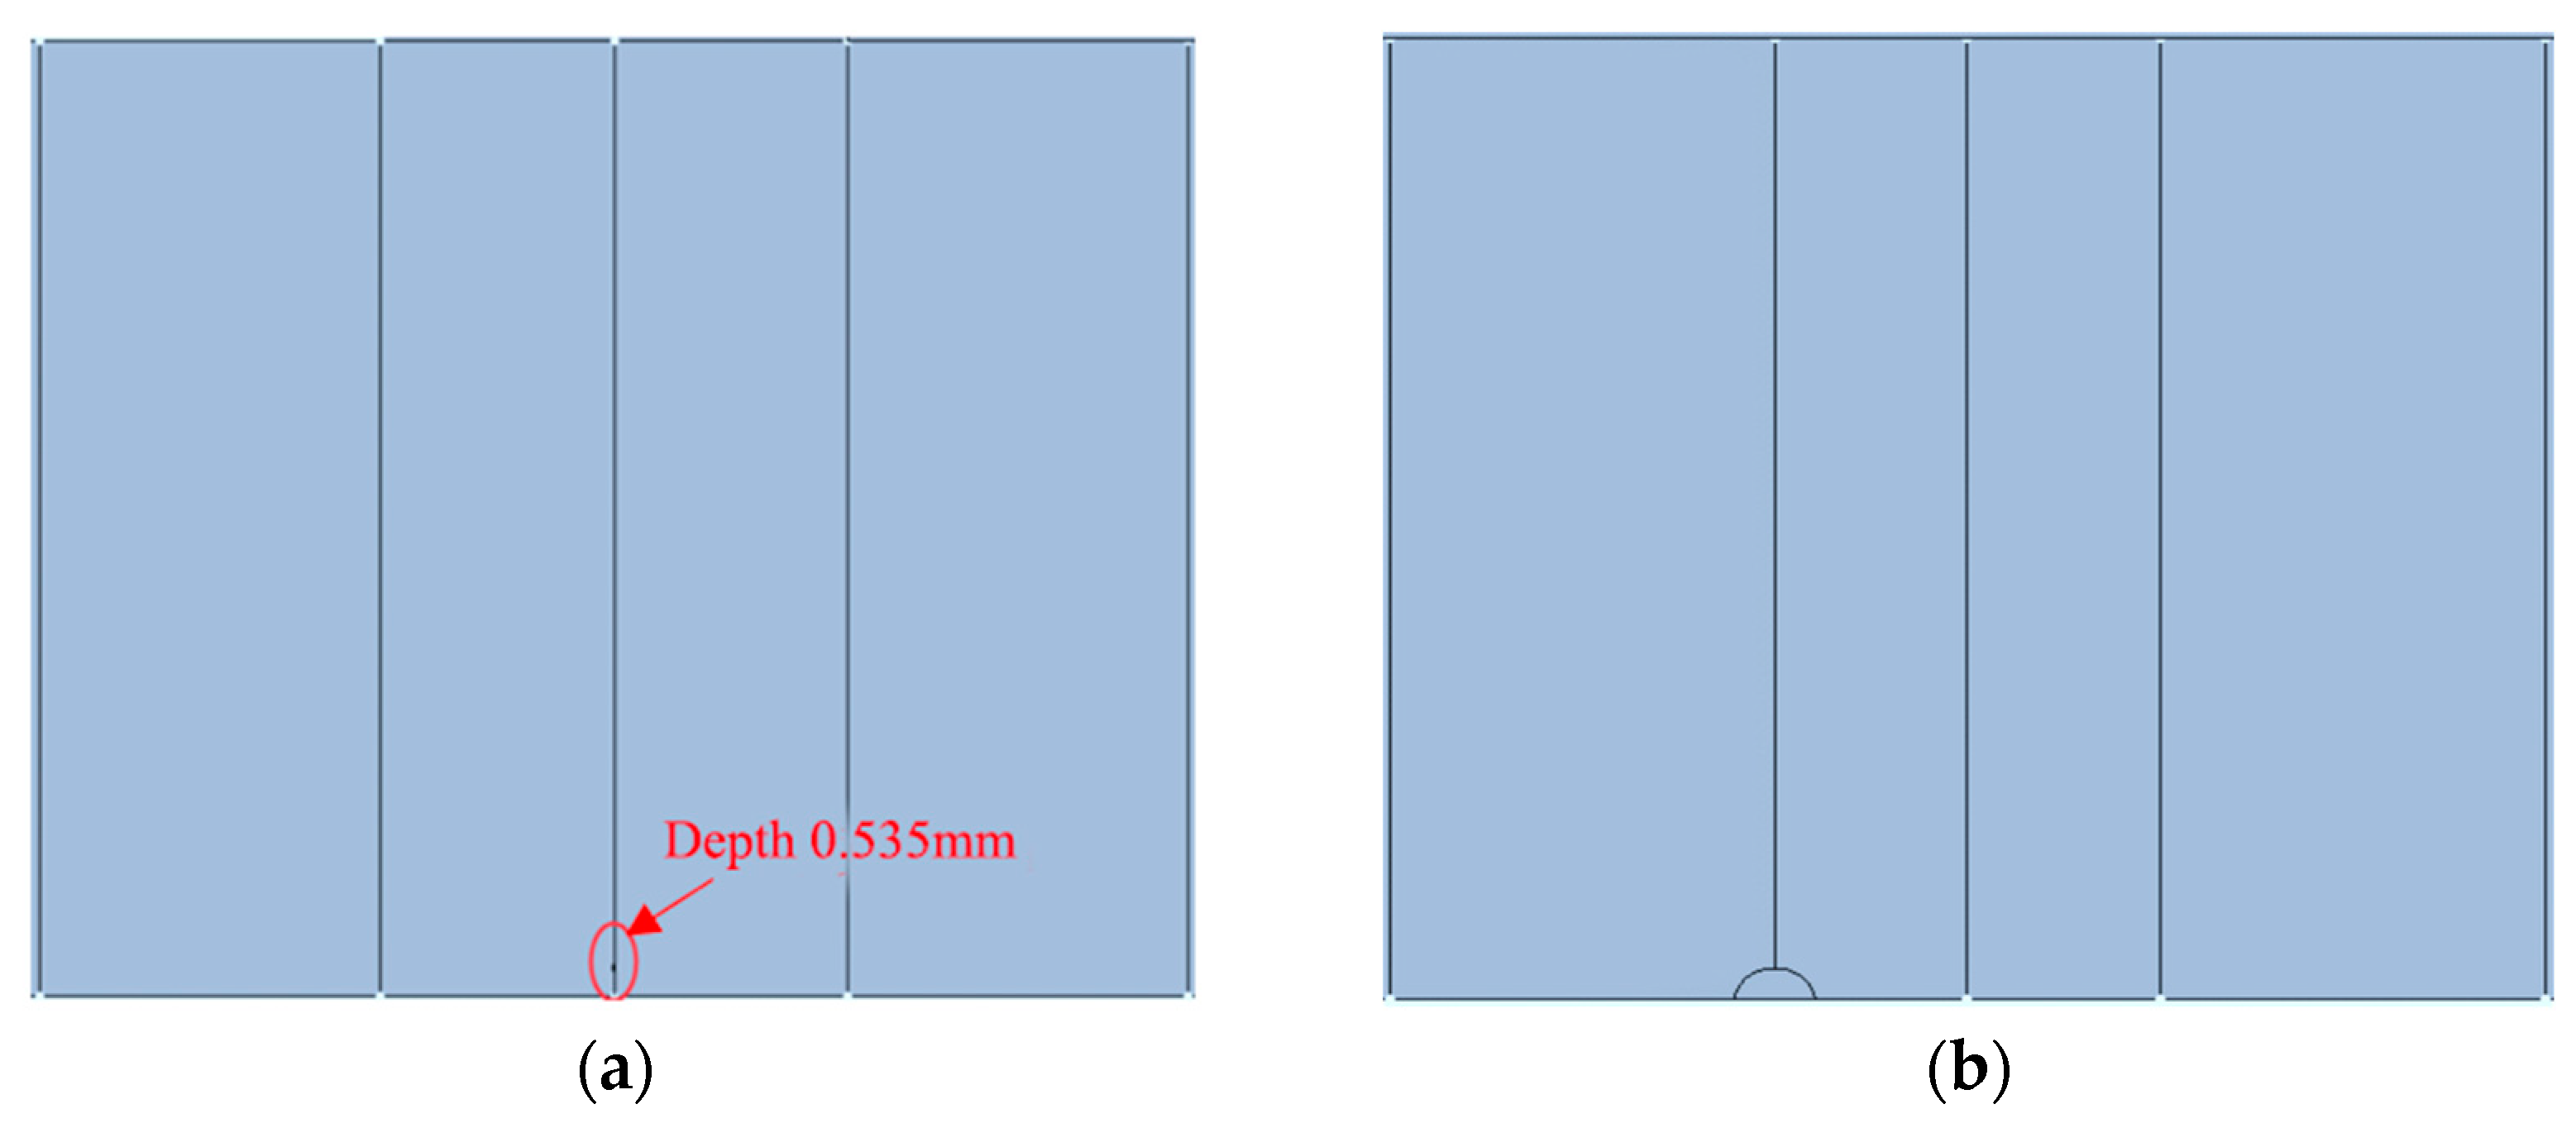
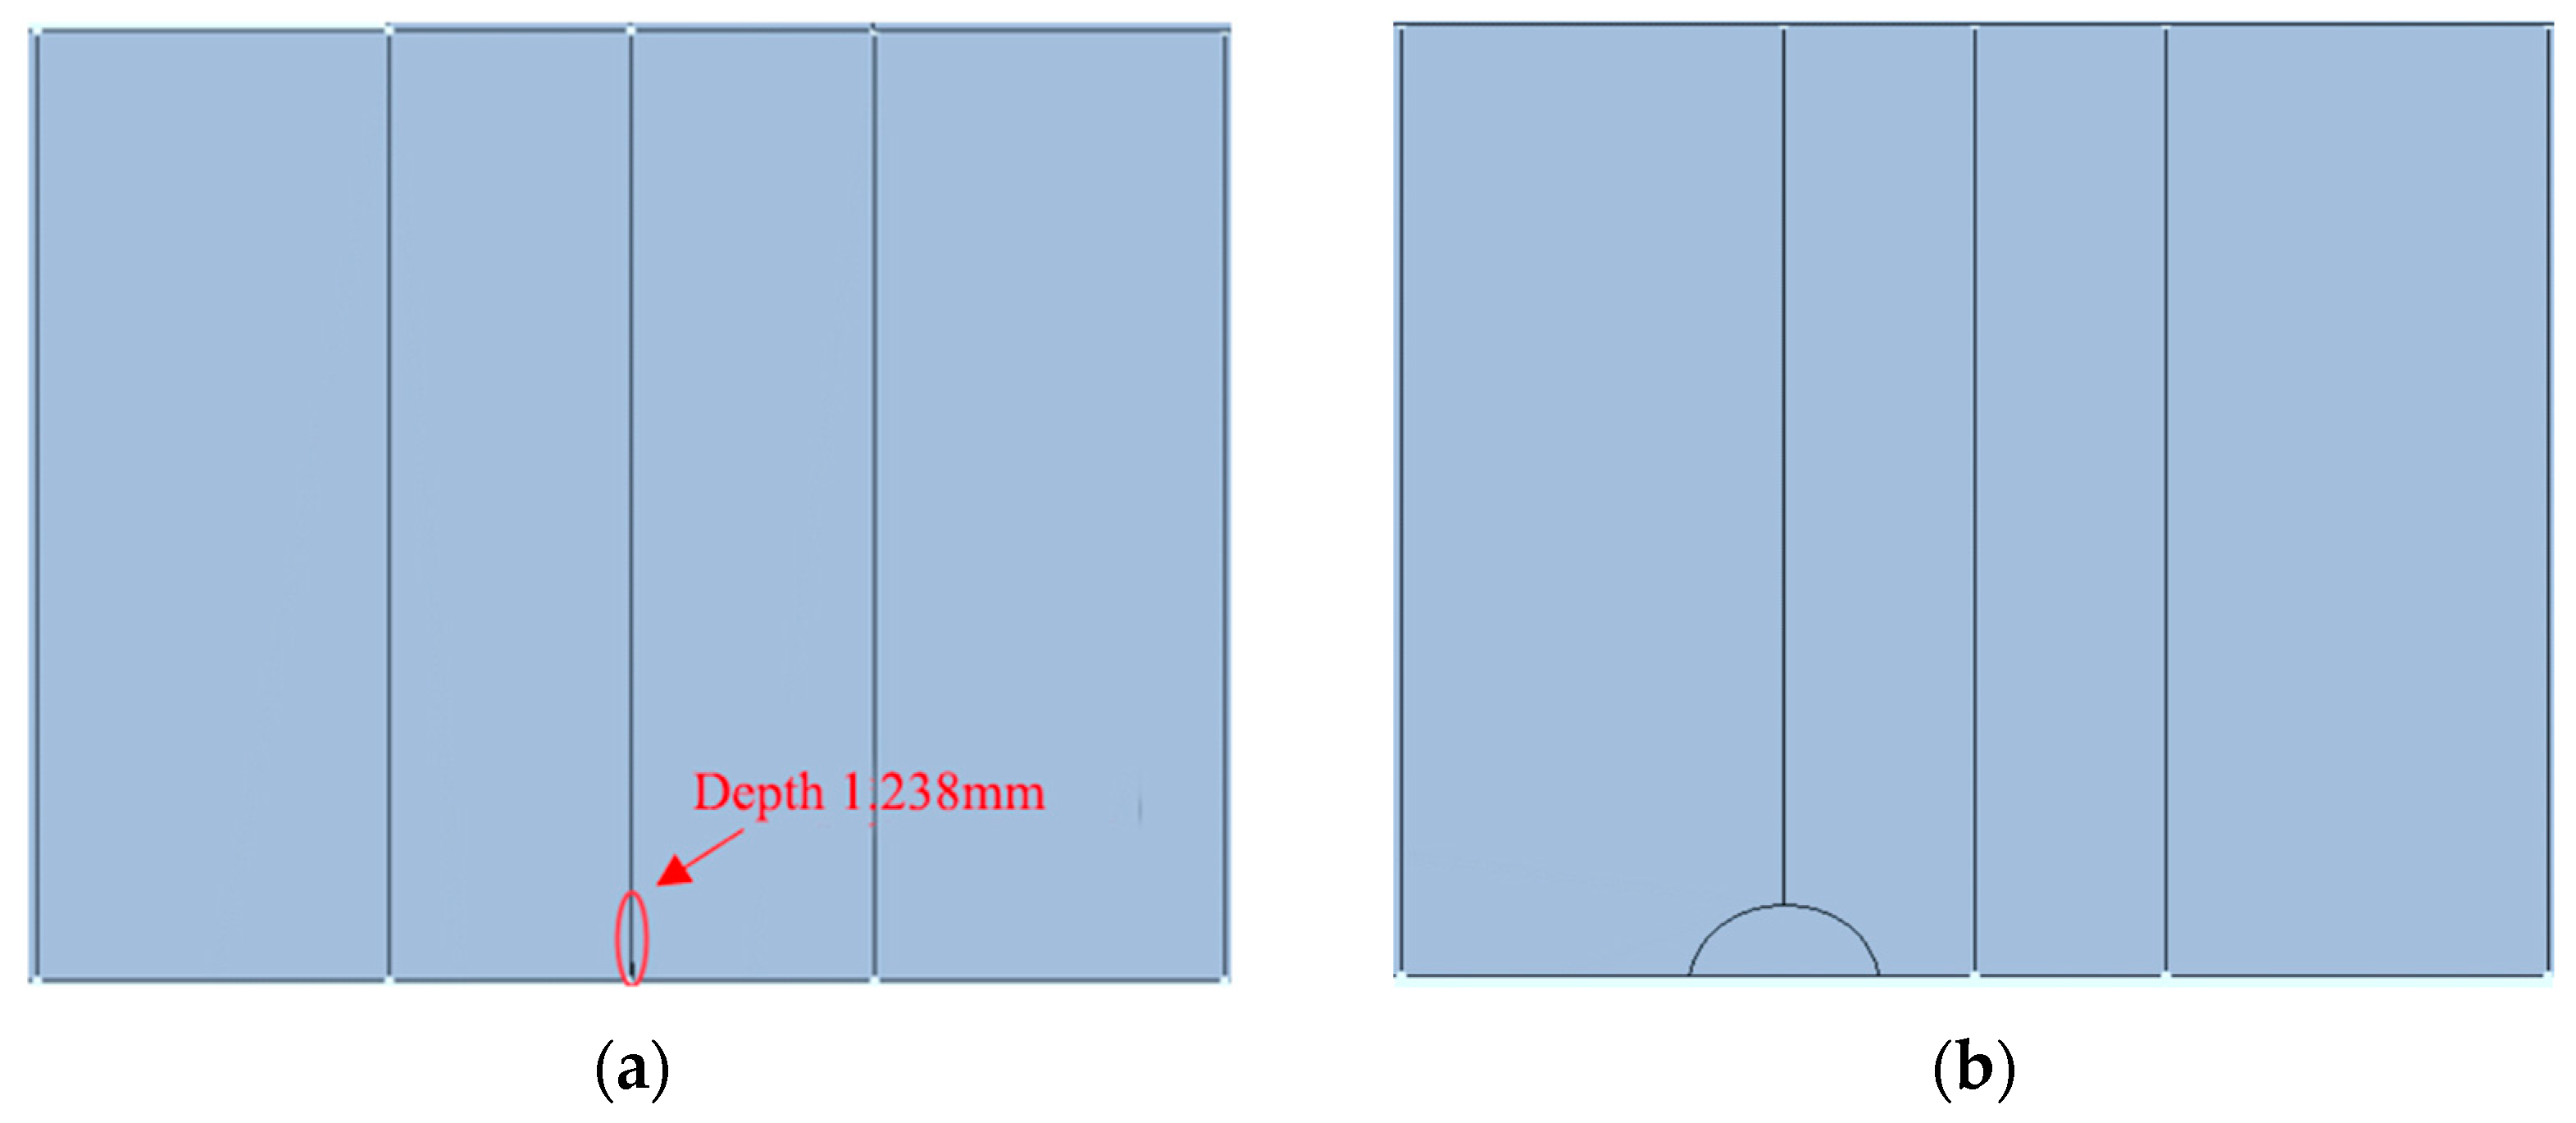
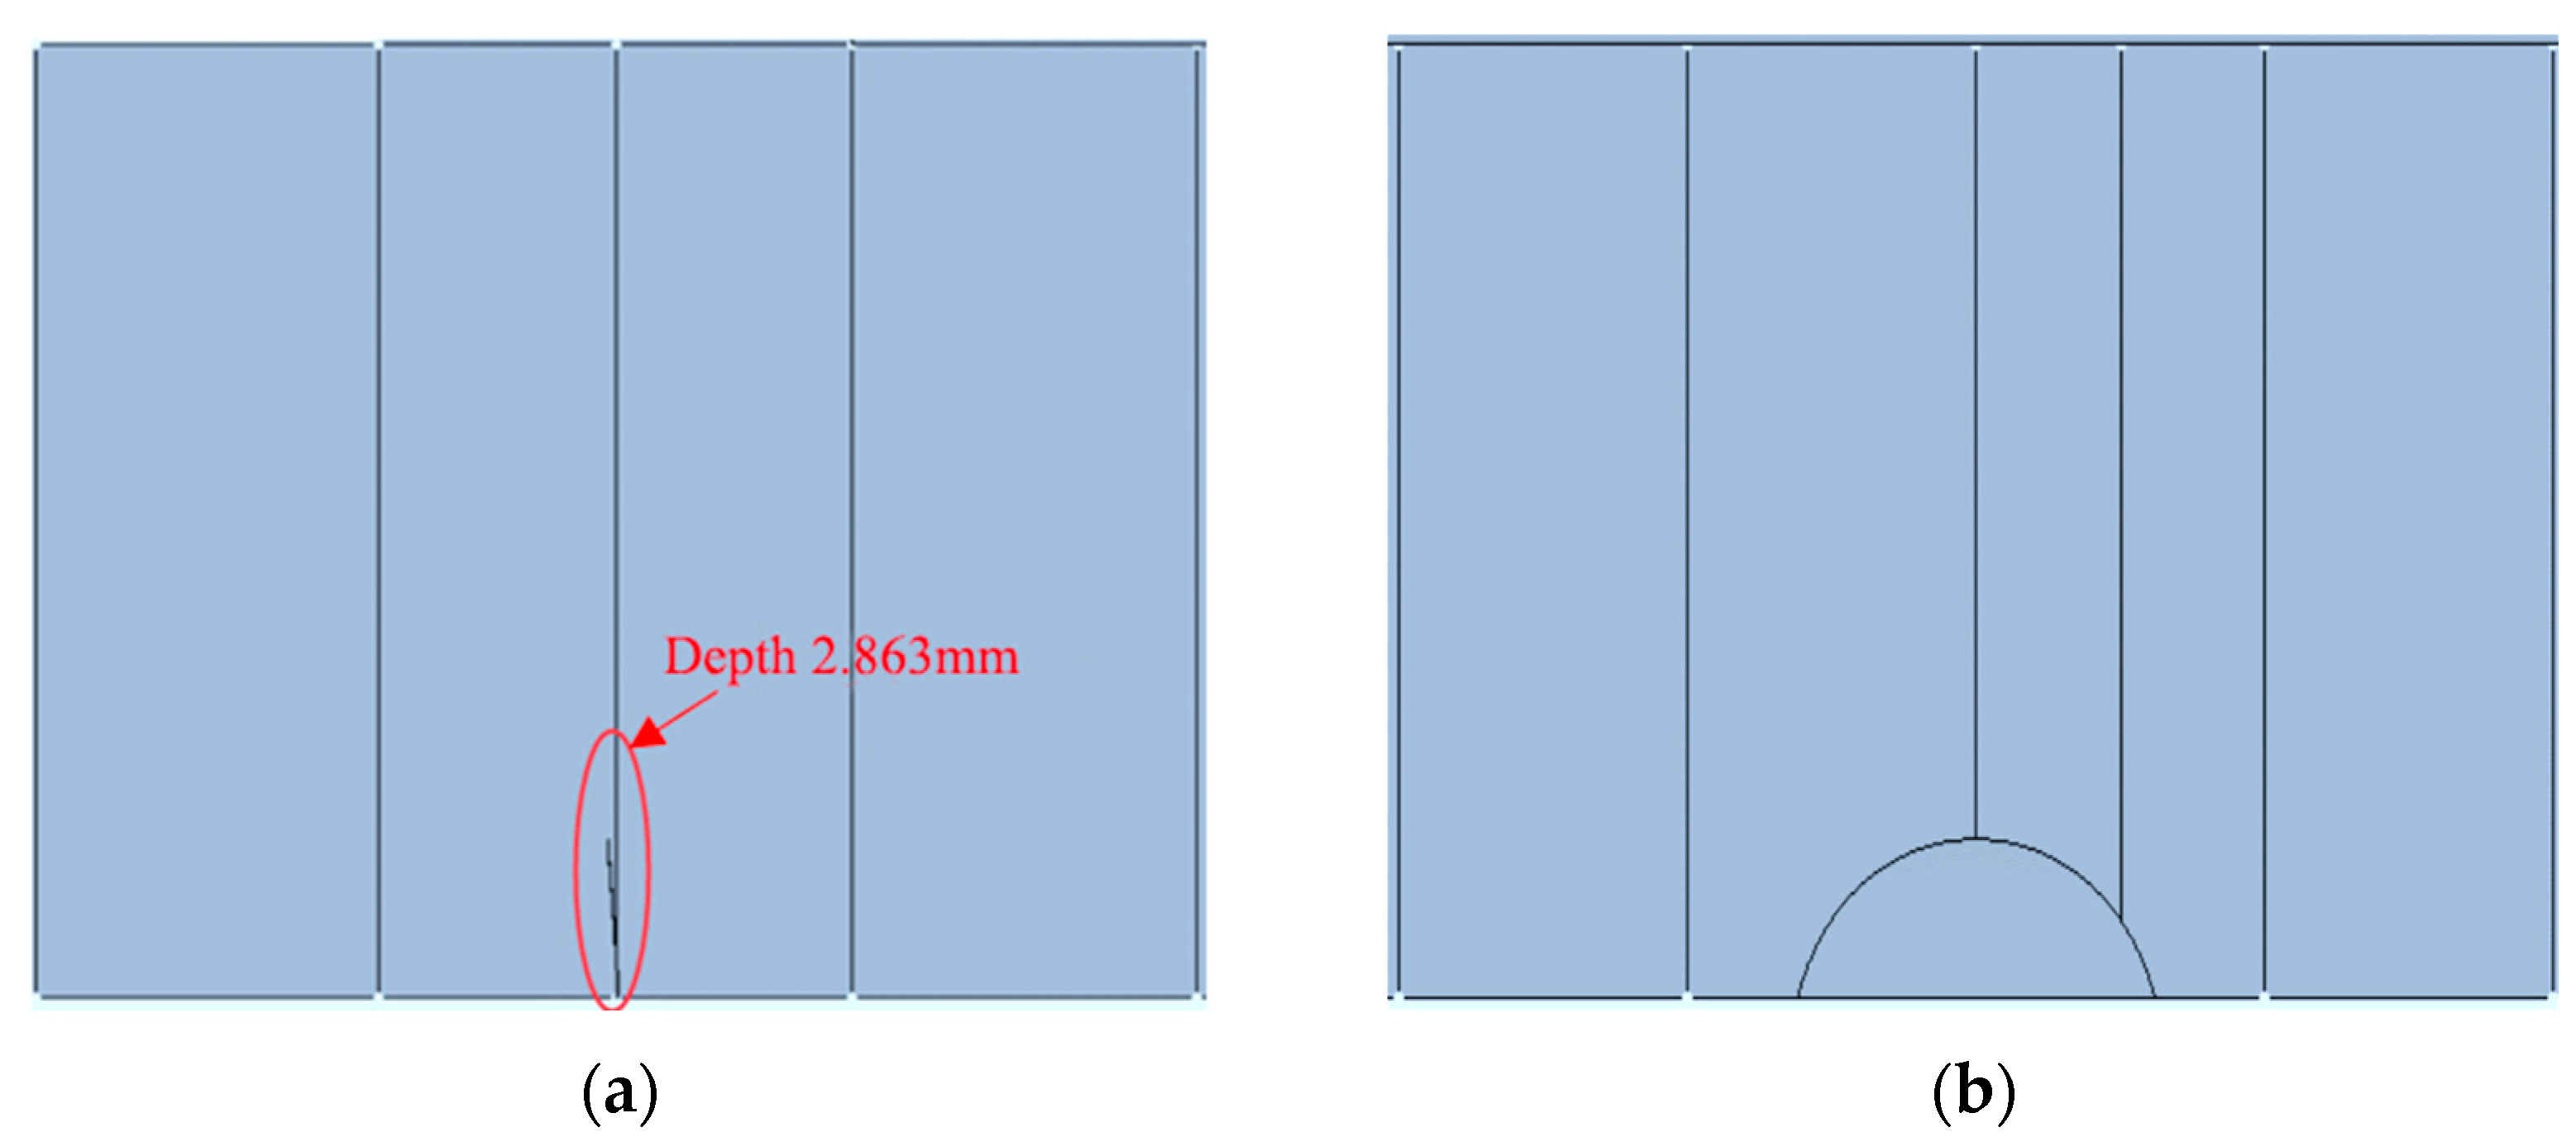
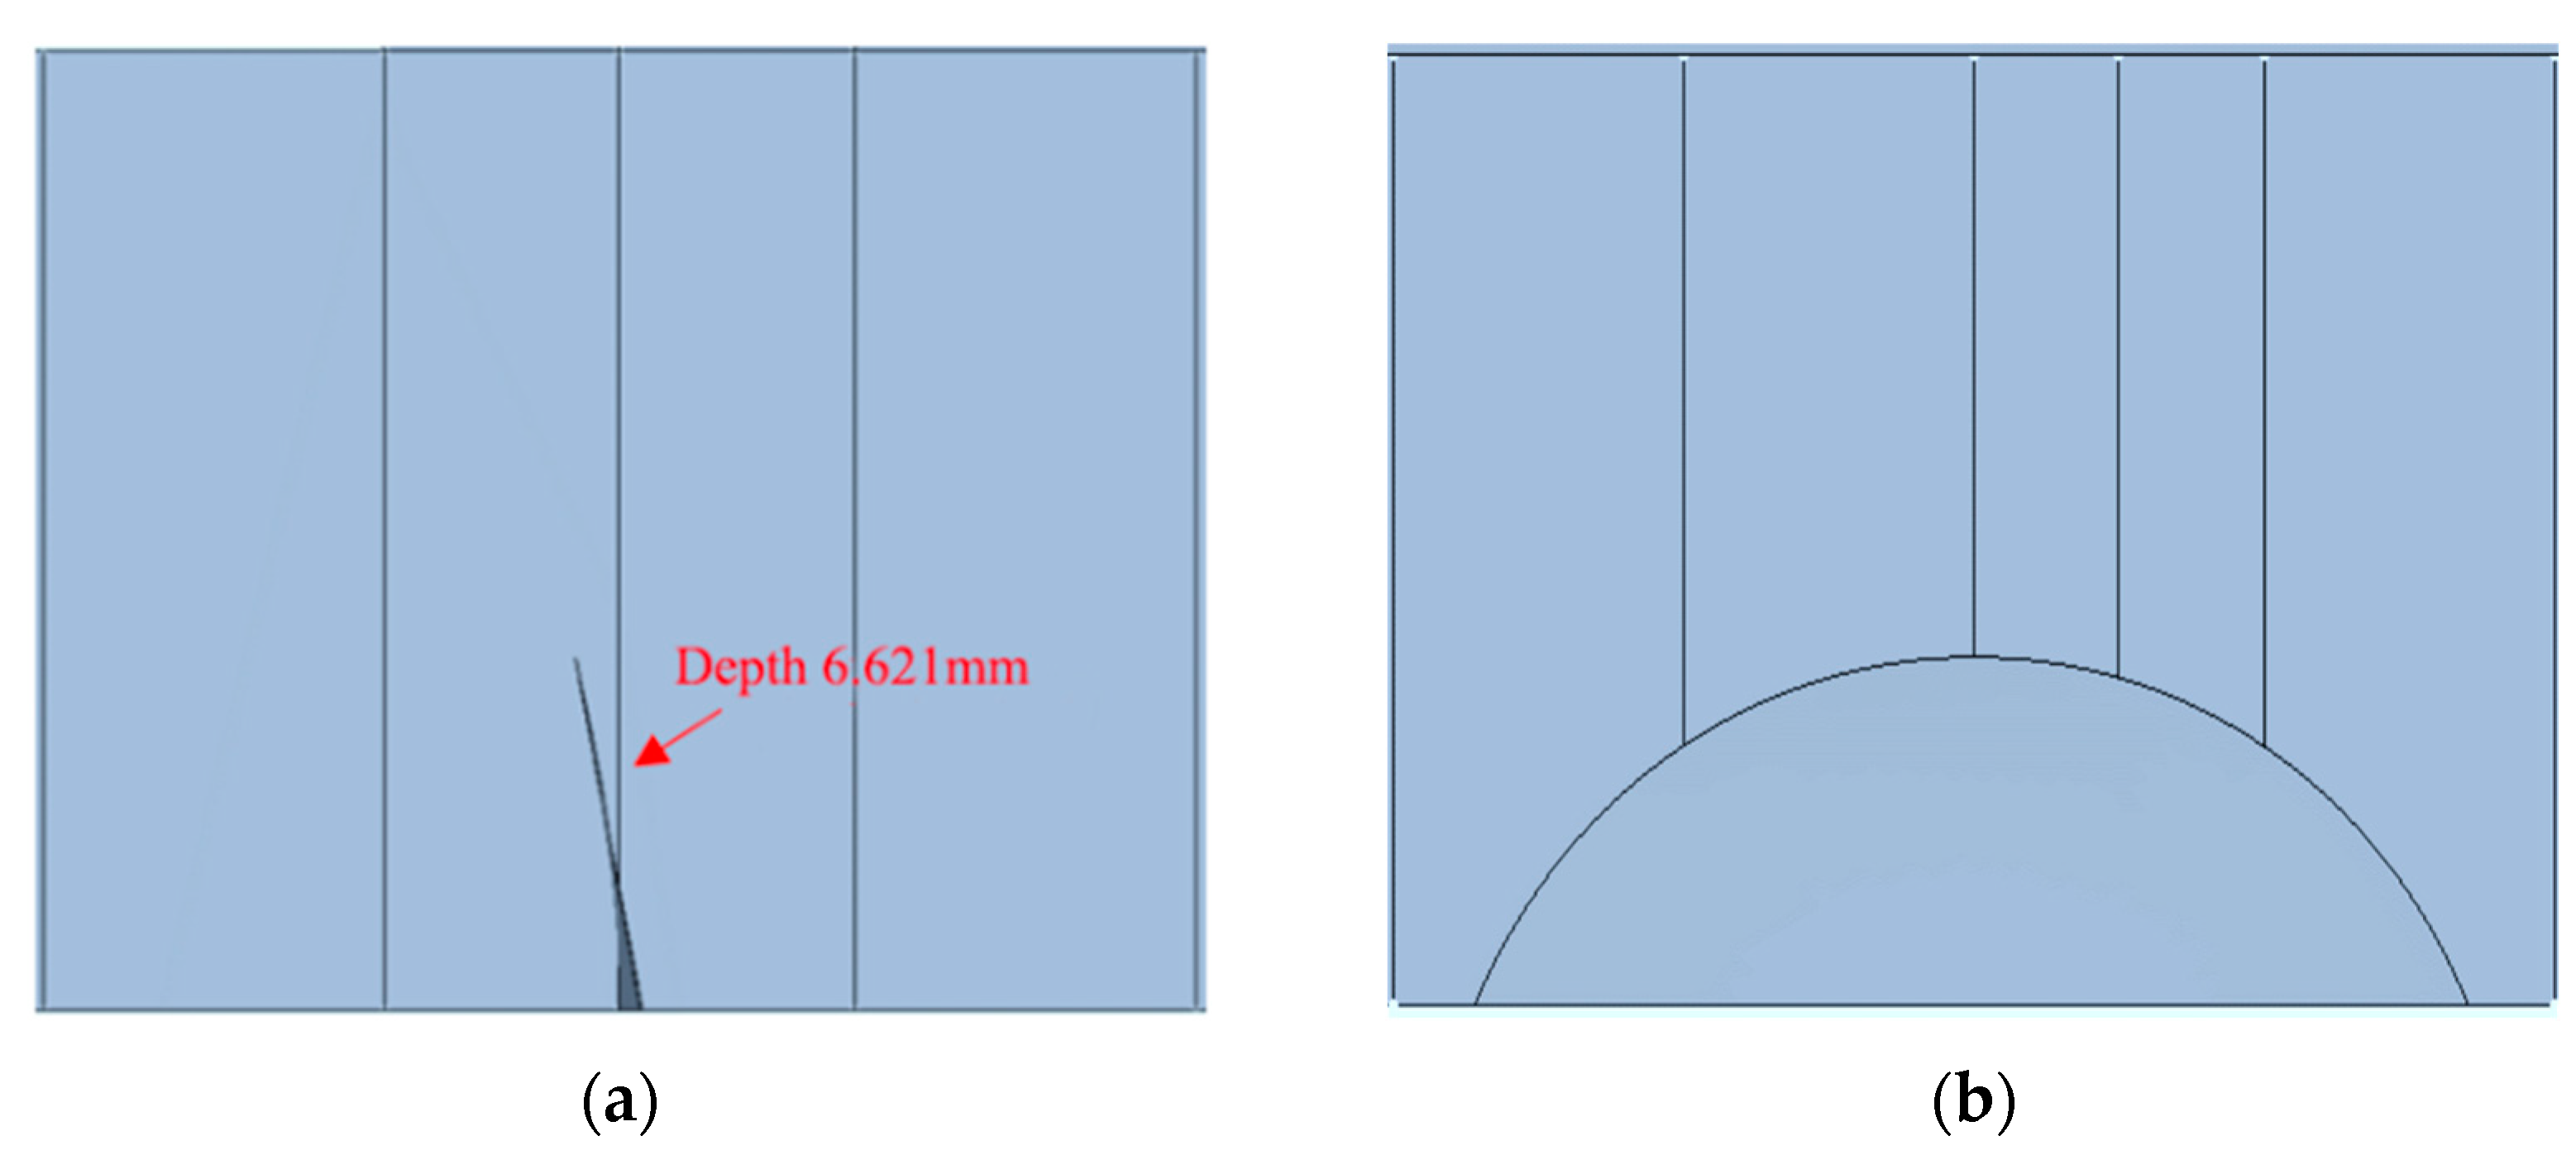
2.3. Simulation of Crack Extension
- (1)
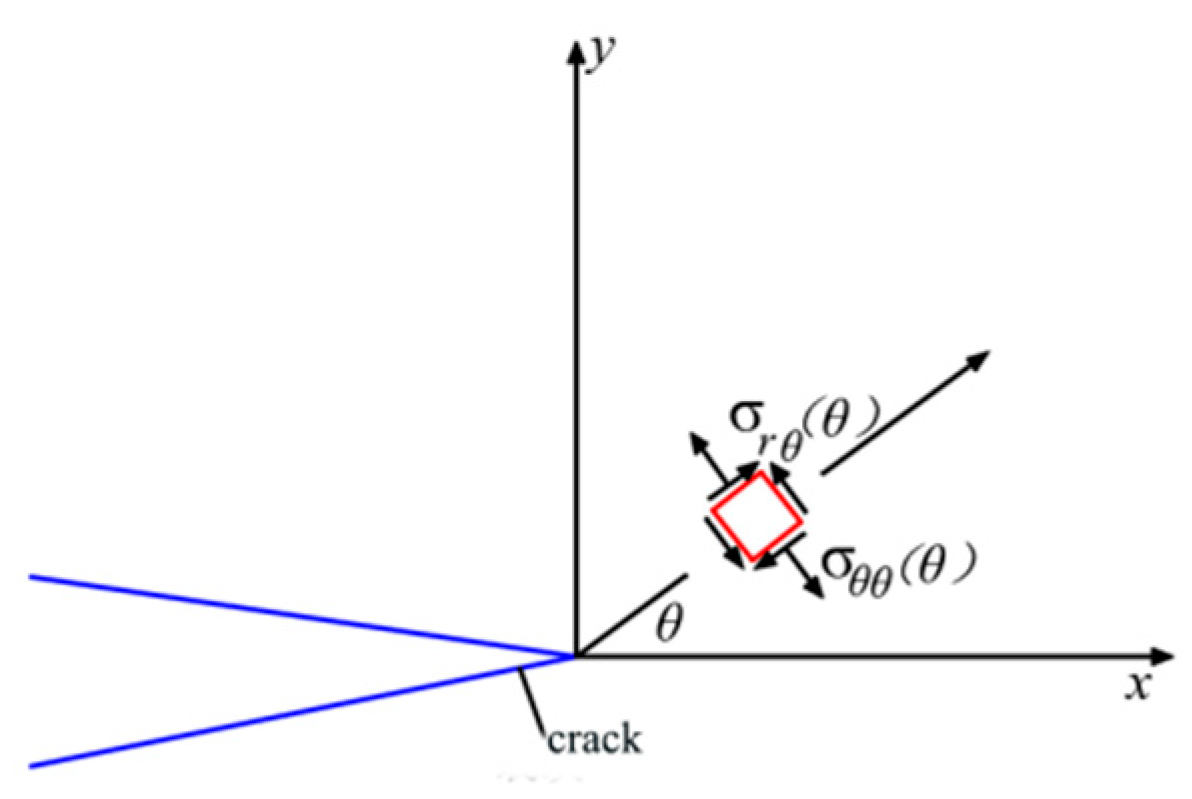
- The local torsion angle can be calculated based on the stress at the leading edge of the local crack in the local co-ordinate system, shown in Figure 4, where the stress is determined by the local stress intensity factor.
- (2)
- Solve for the length of the local extension at each point.
2.4. The Steps of Calculating Fracture Parameters by Finite Element Method
- (1)
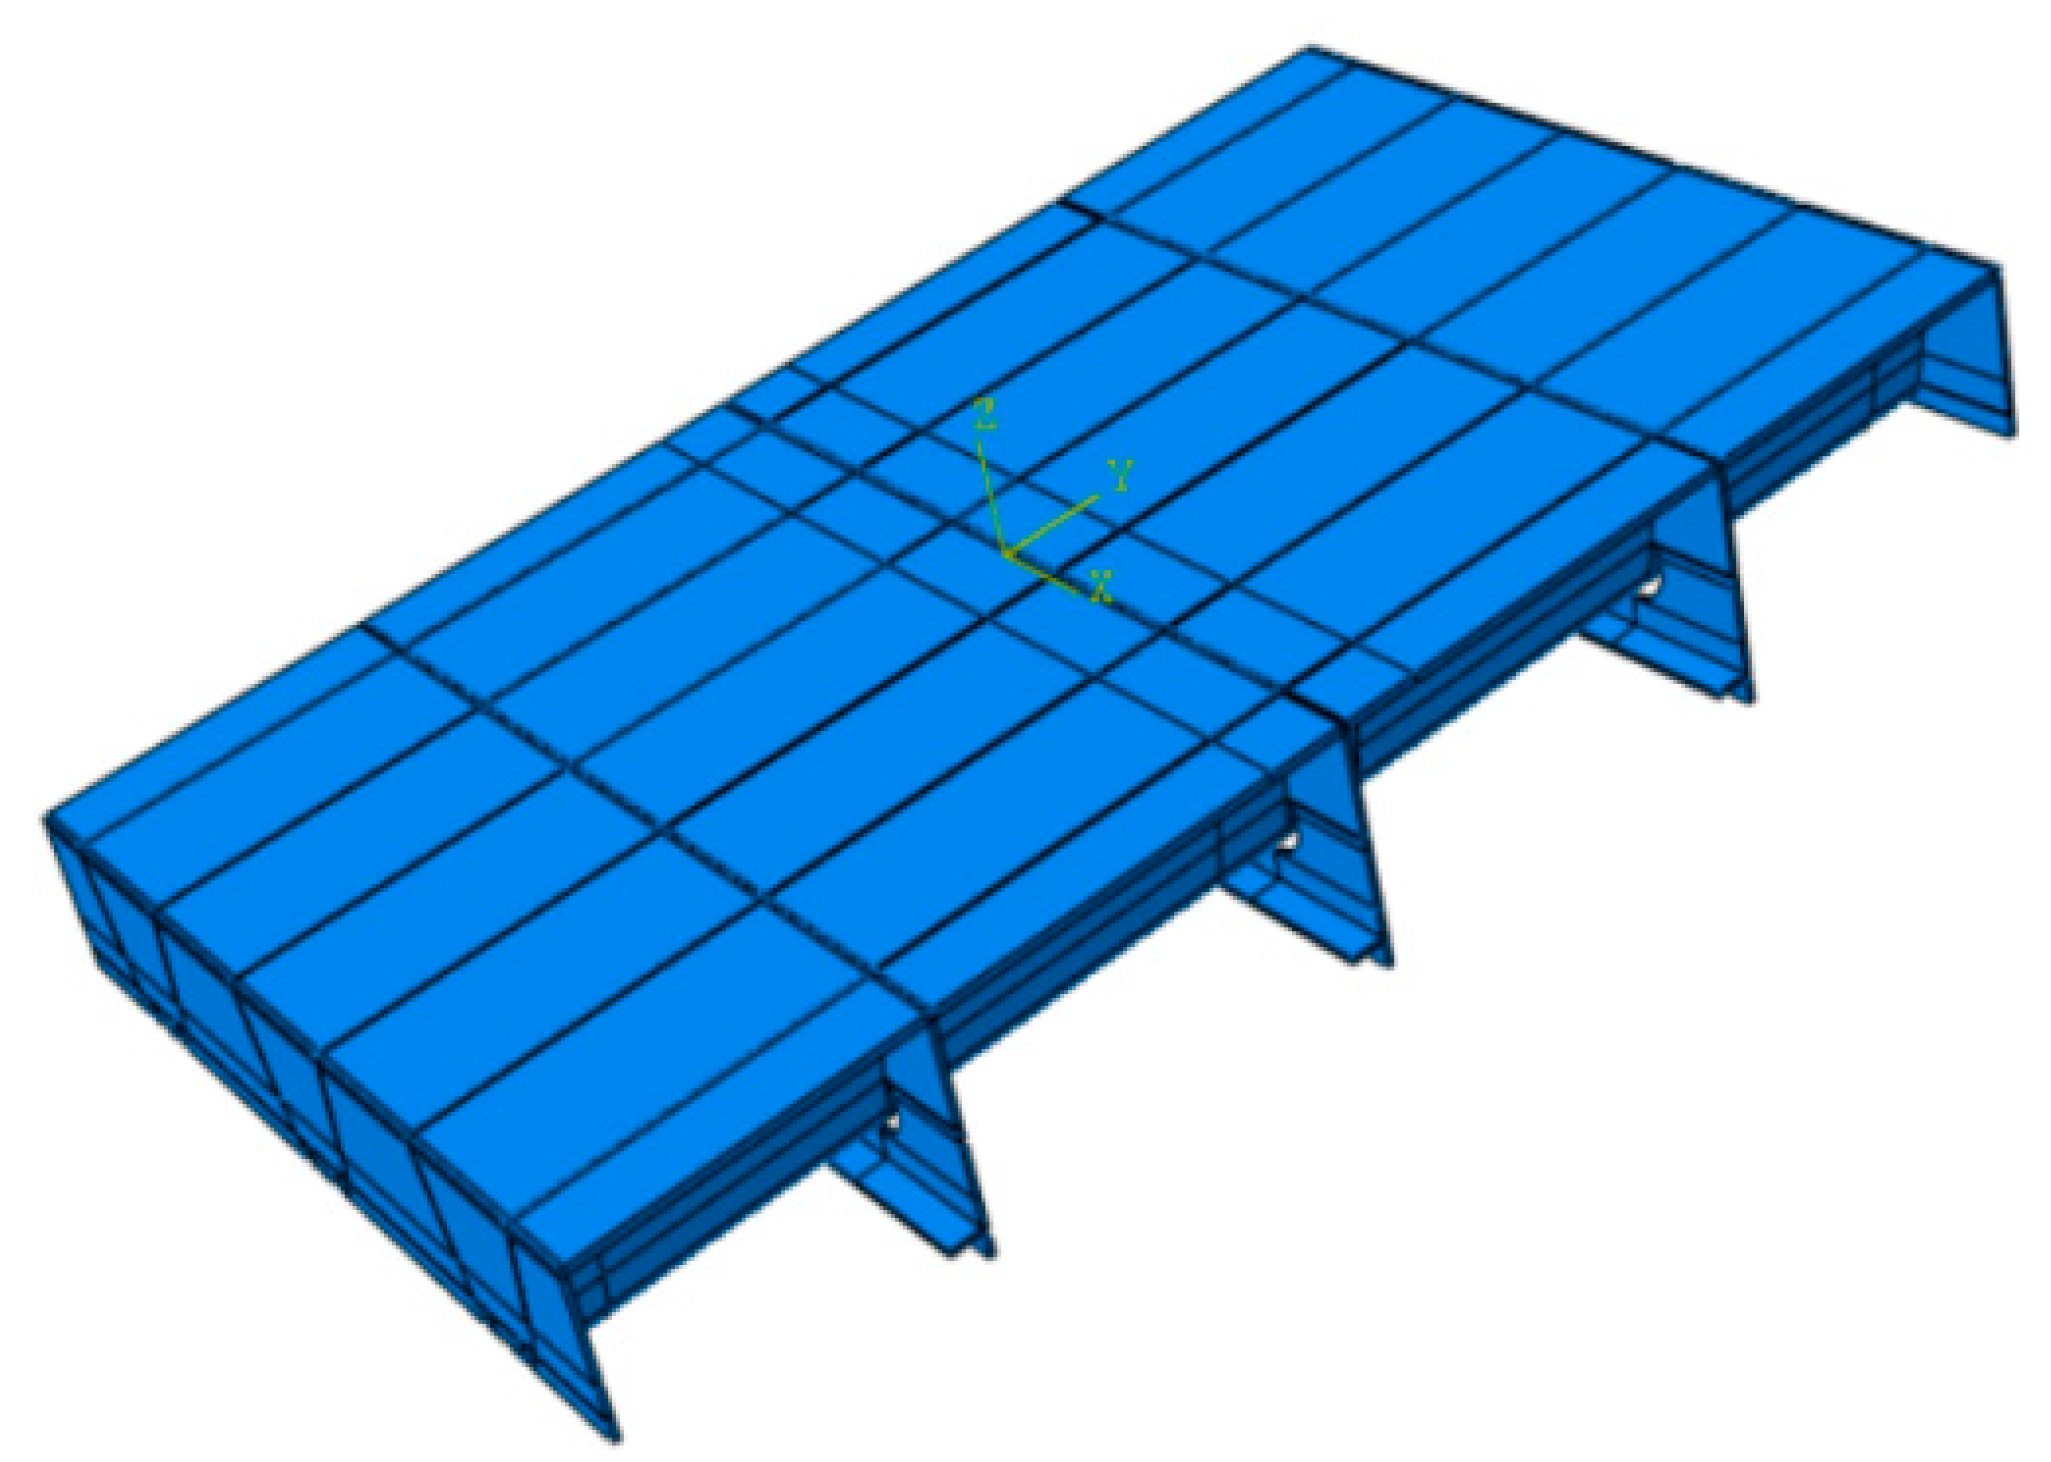
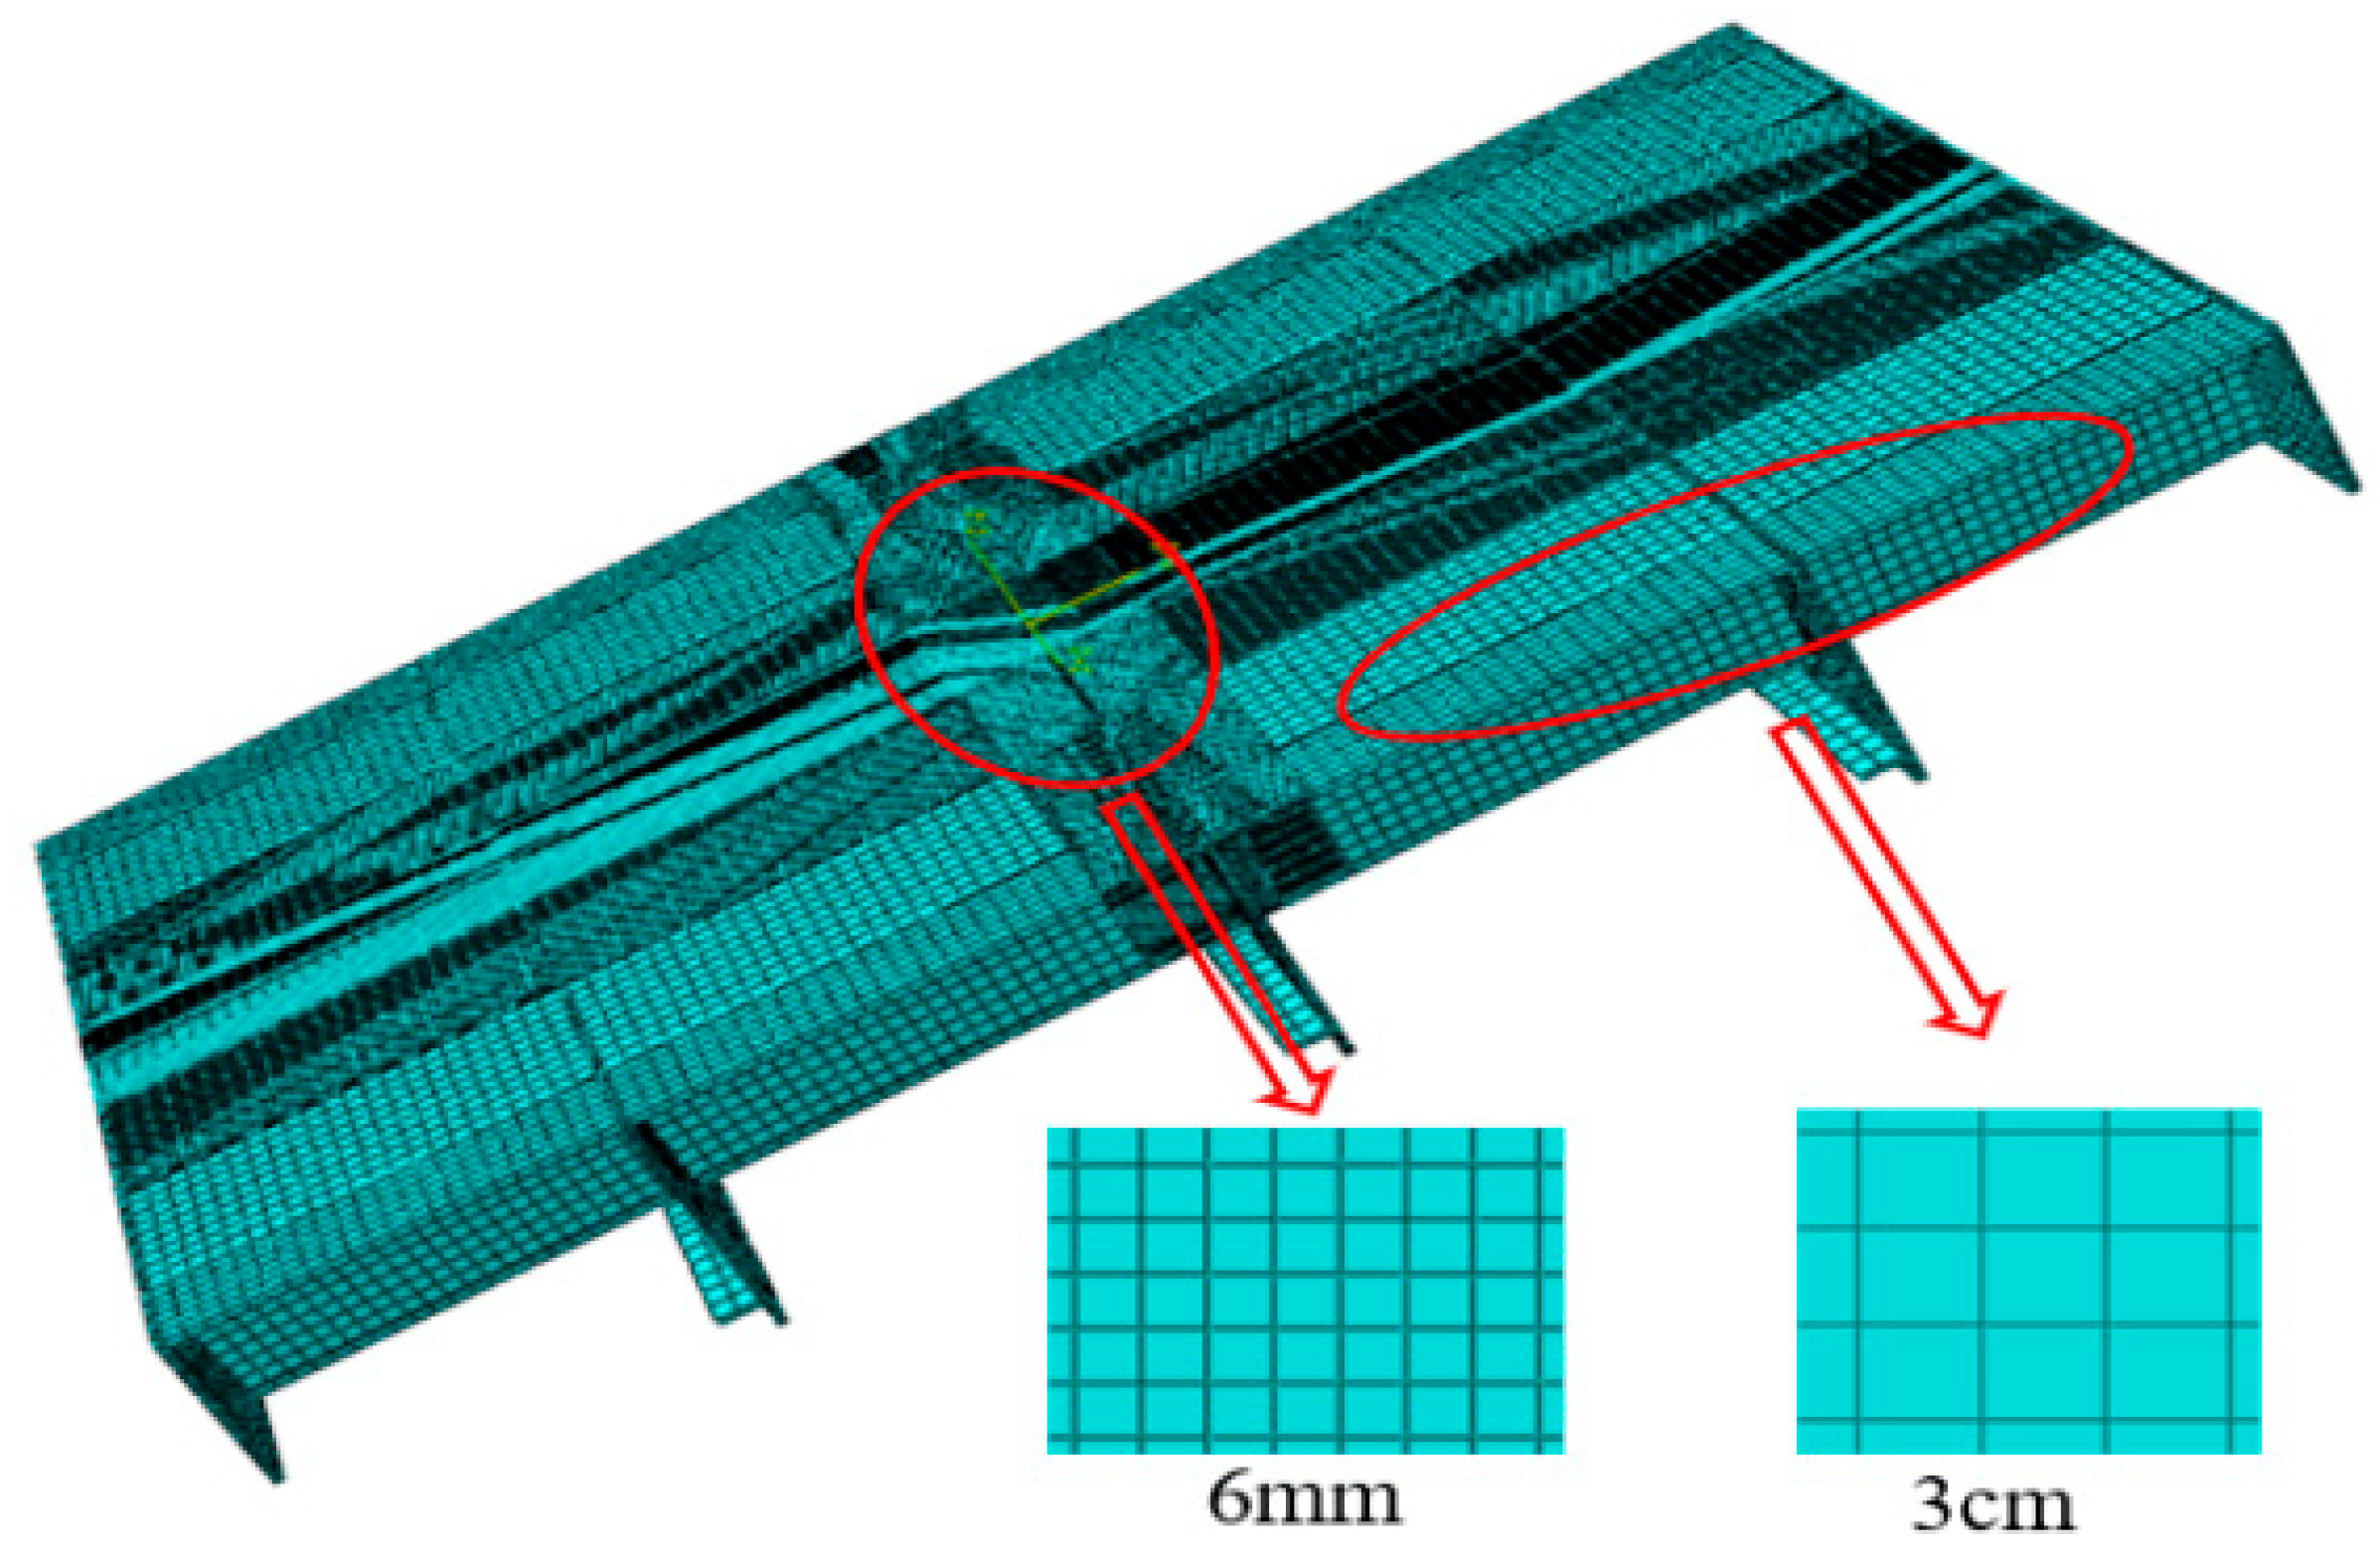
- Building the finite element model
- (2)
- Introduction of initial cracking
- (3)
- Finite element calculation
- (4)
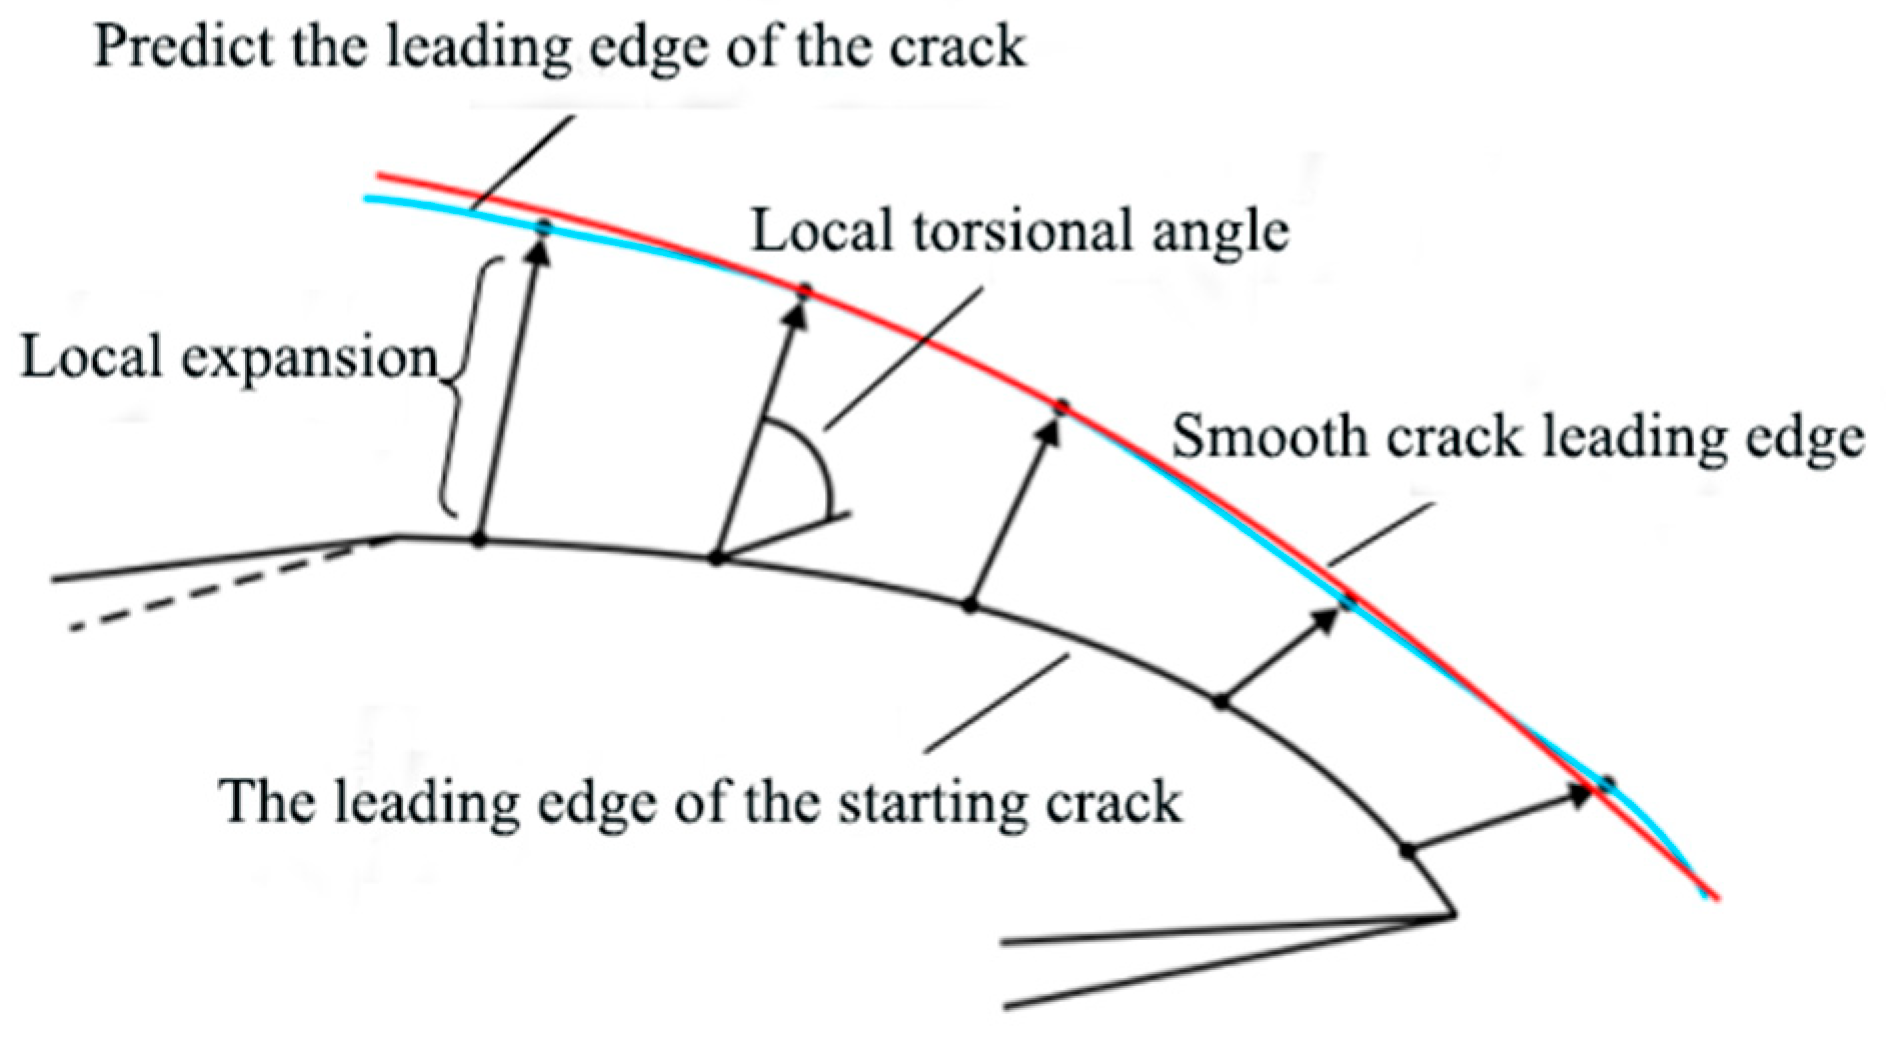
- Prediction of crack growth
- (5)
- Performing new finite element calculations
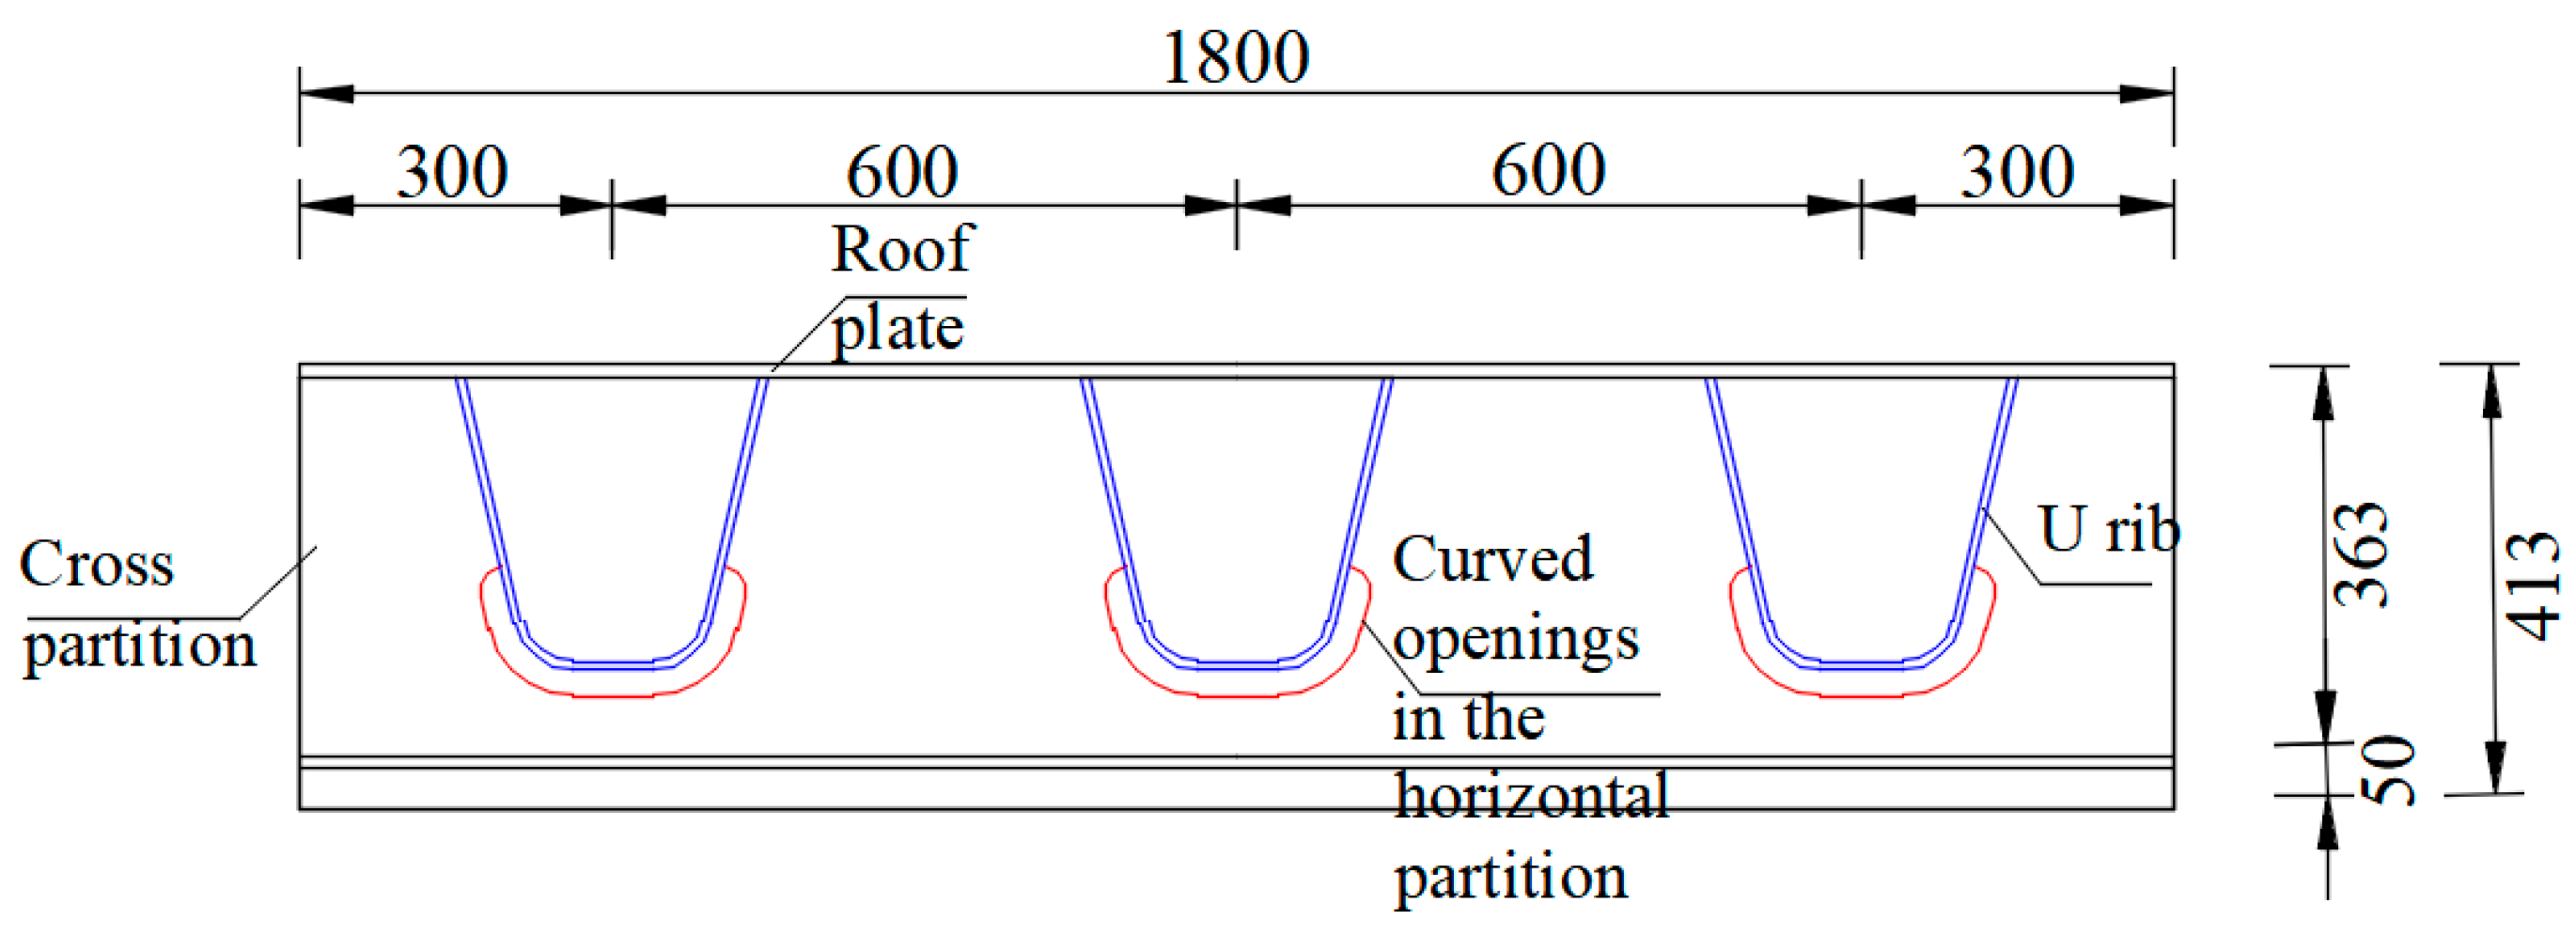
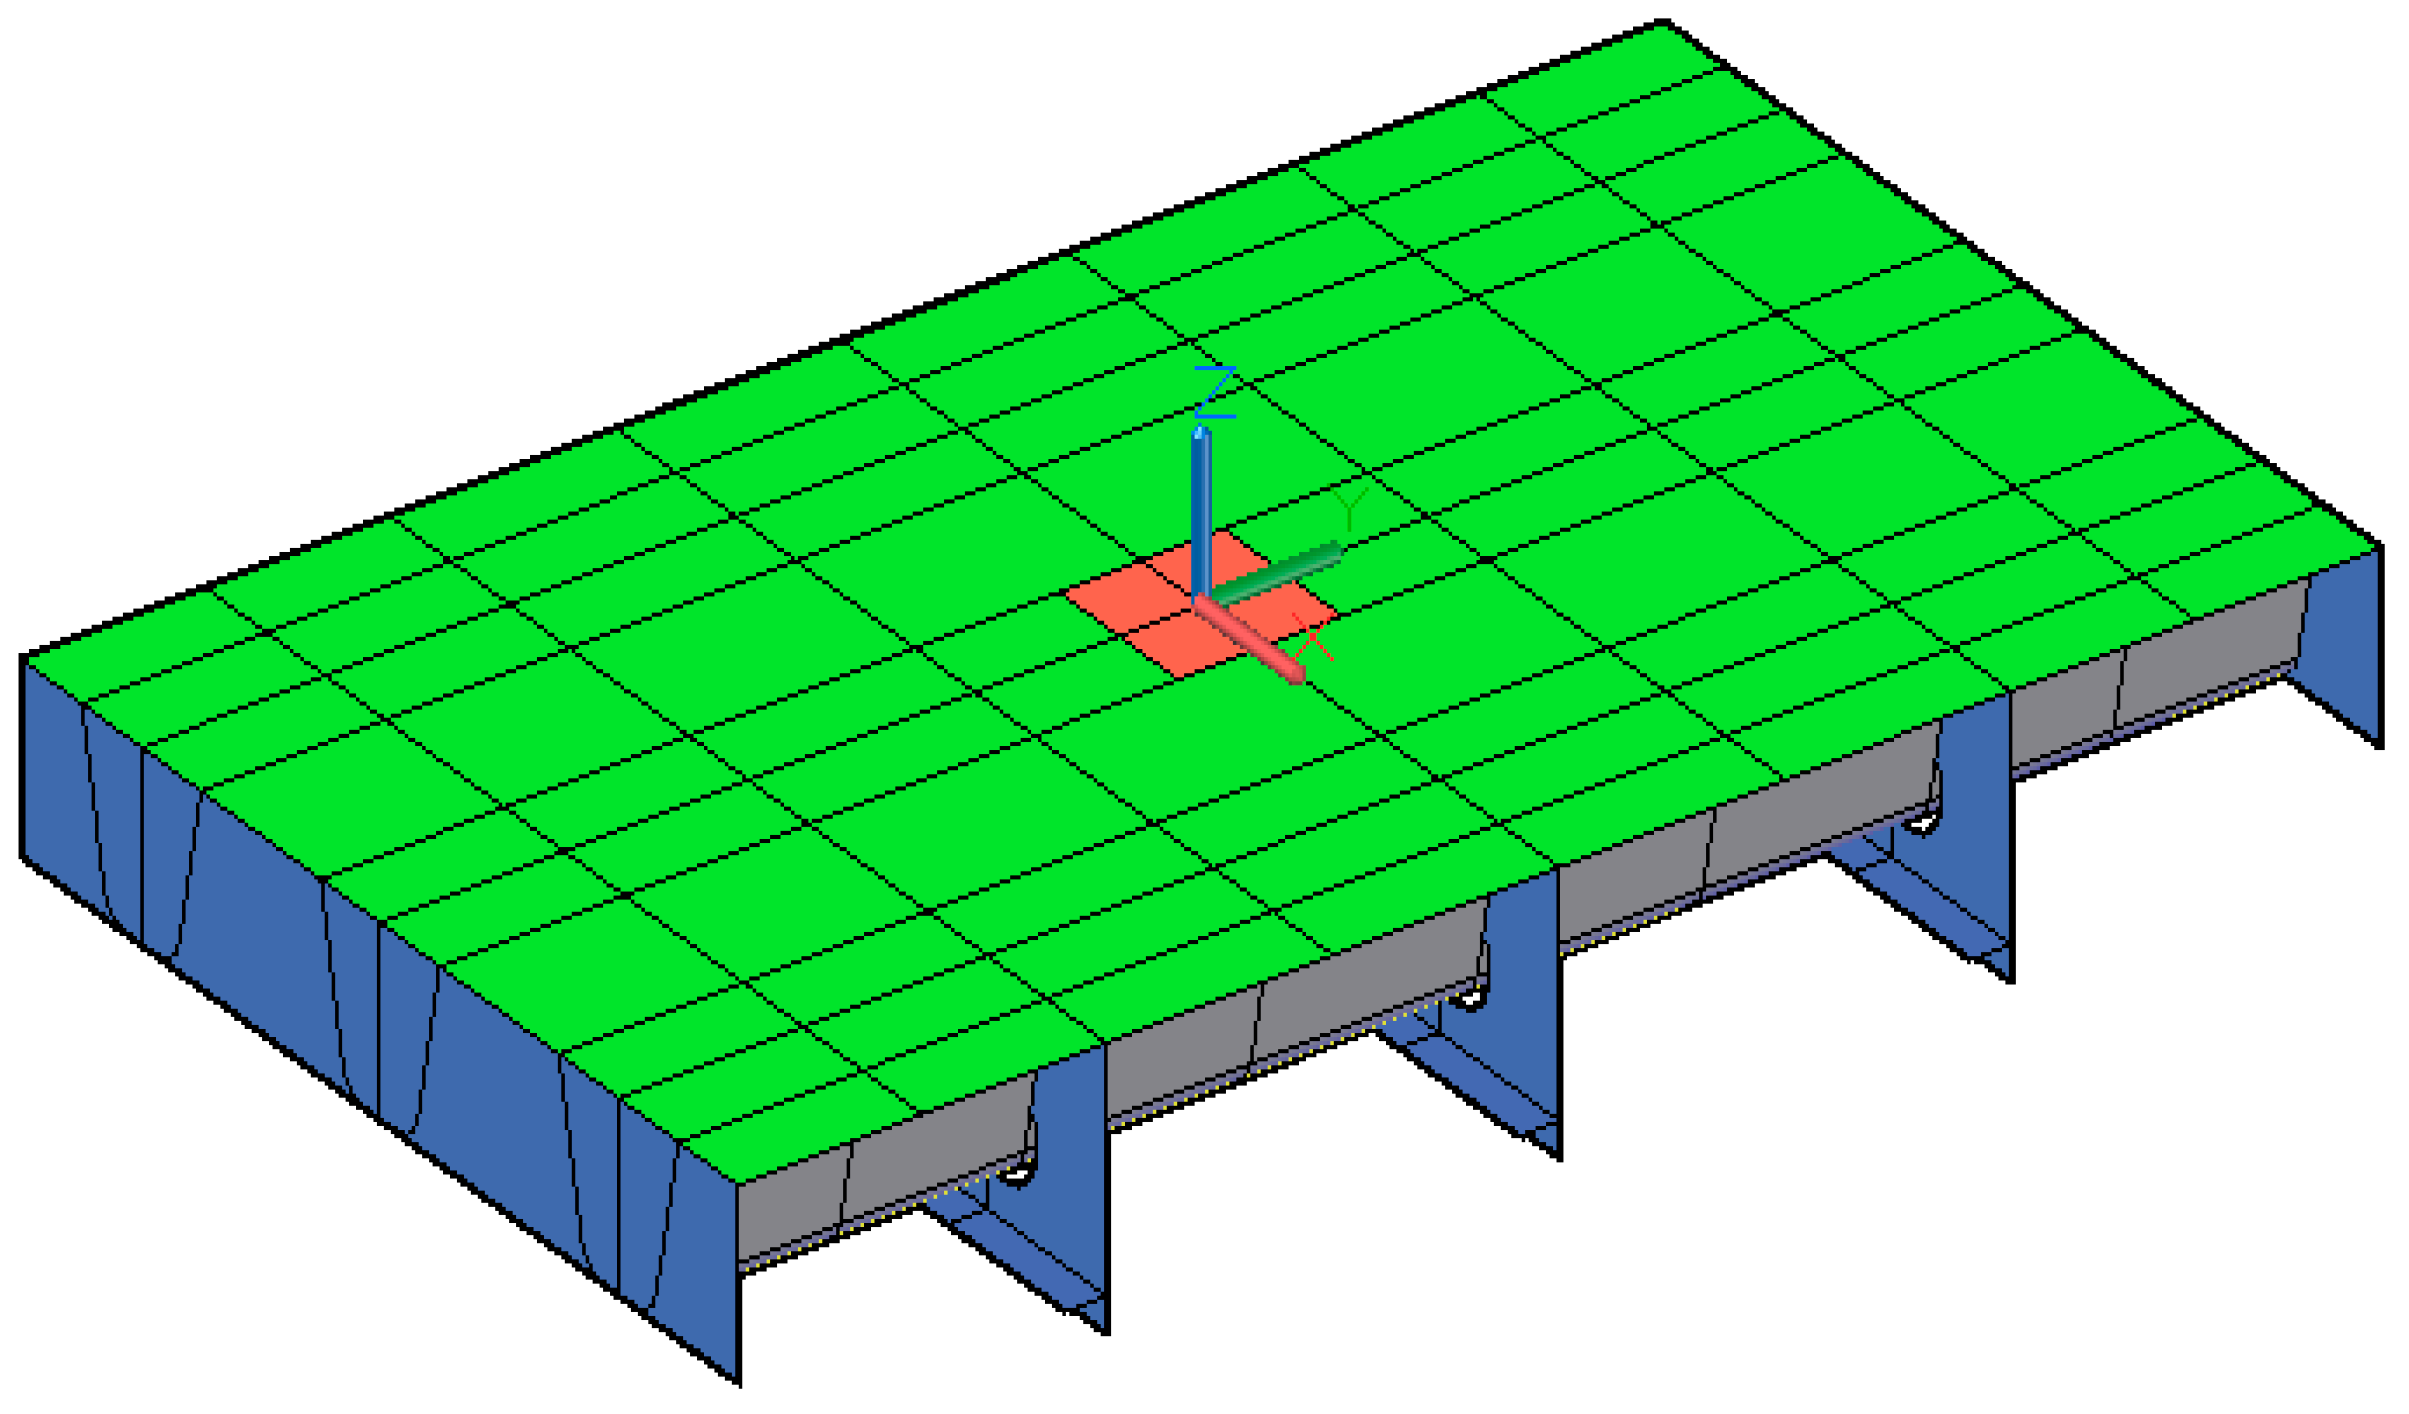
3. Model Design of Fatigue Test
3.1. Model Design
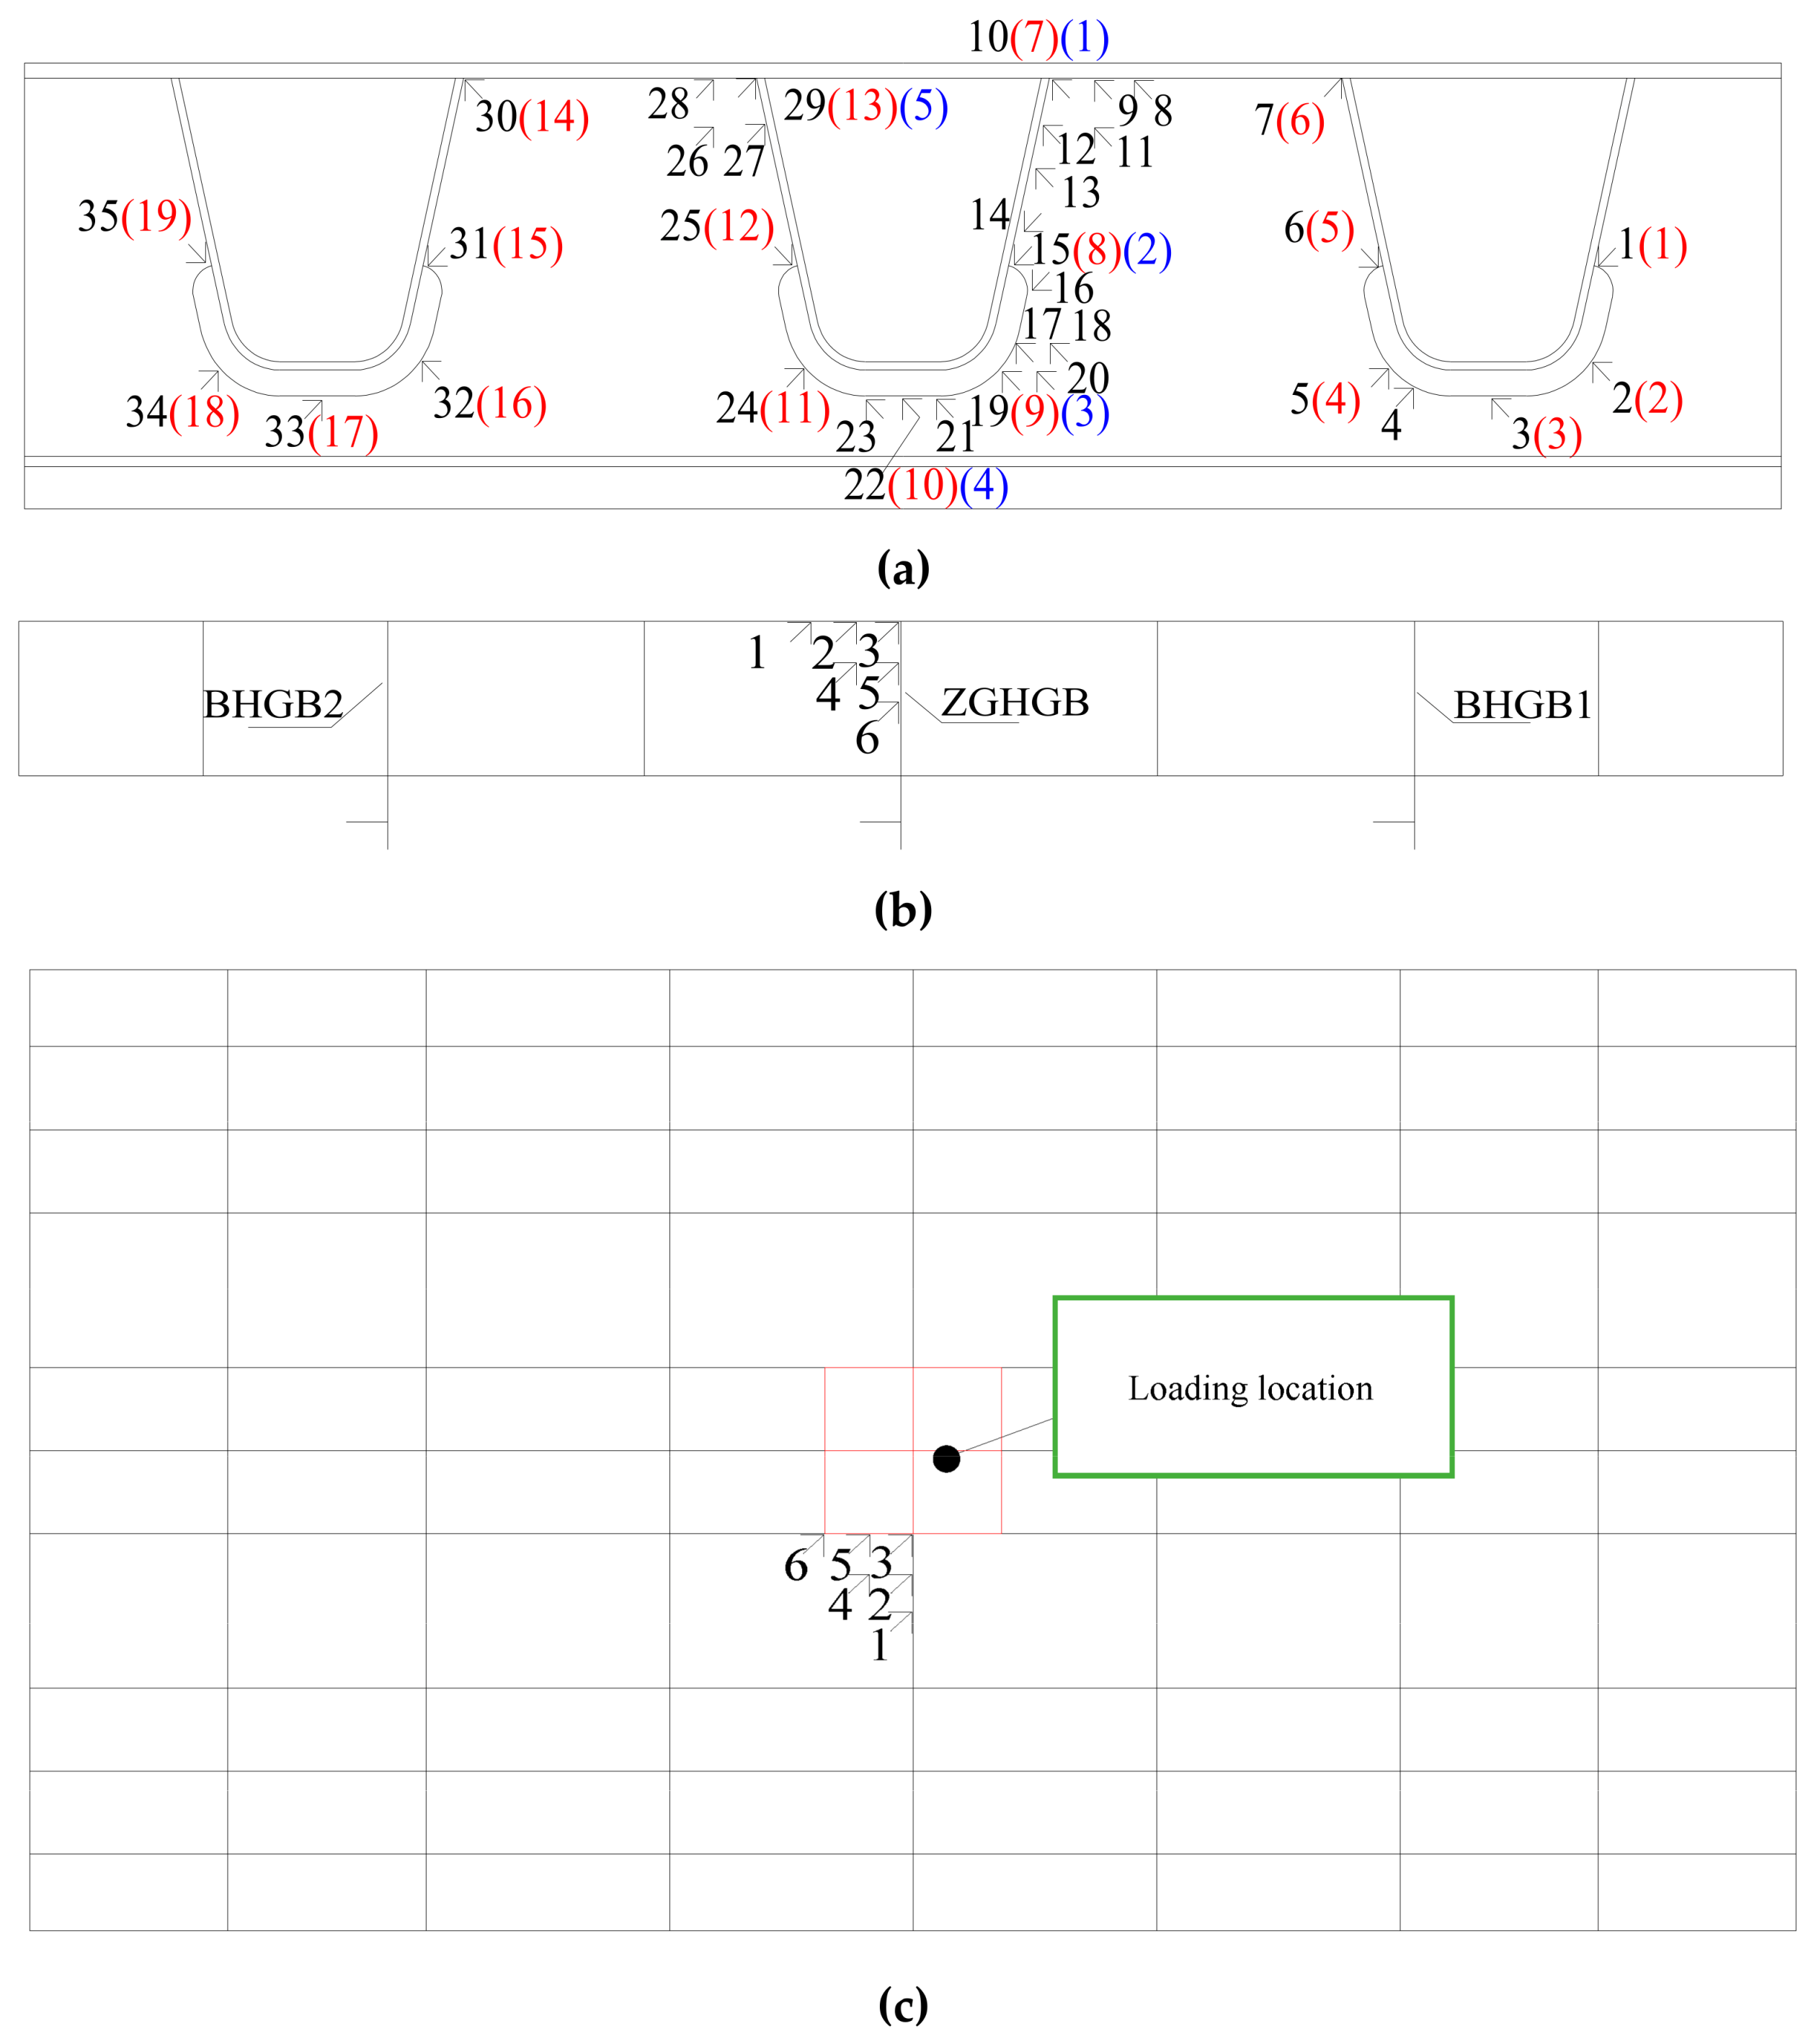
3.2. Layout of Measuring Points
4. Fatigue Test Results
4.1. Static Load Test Results
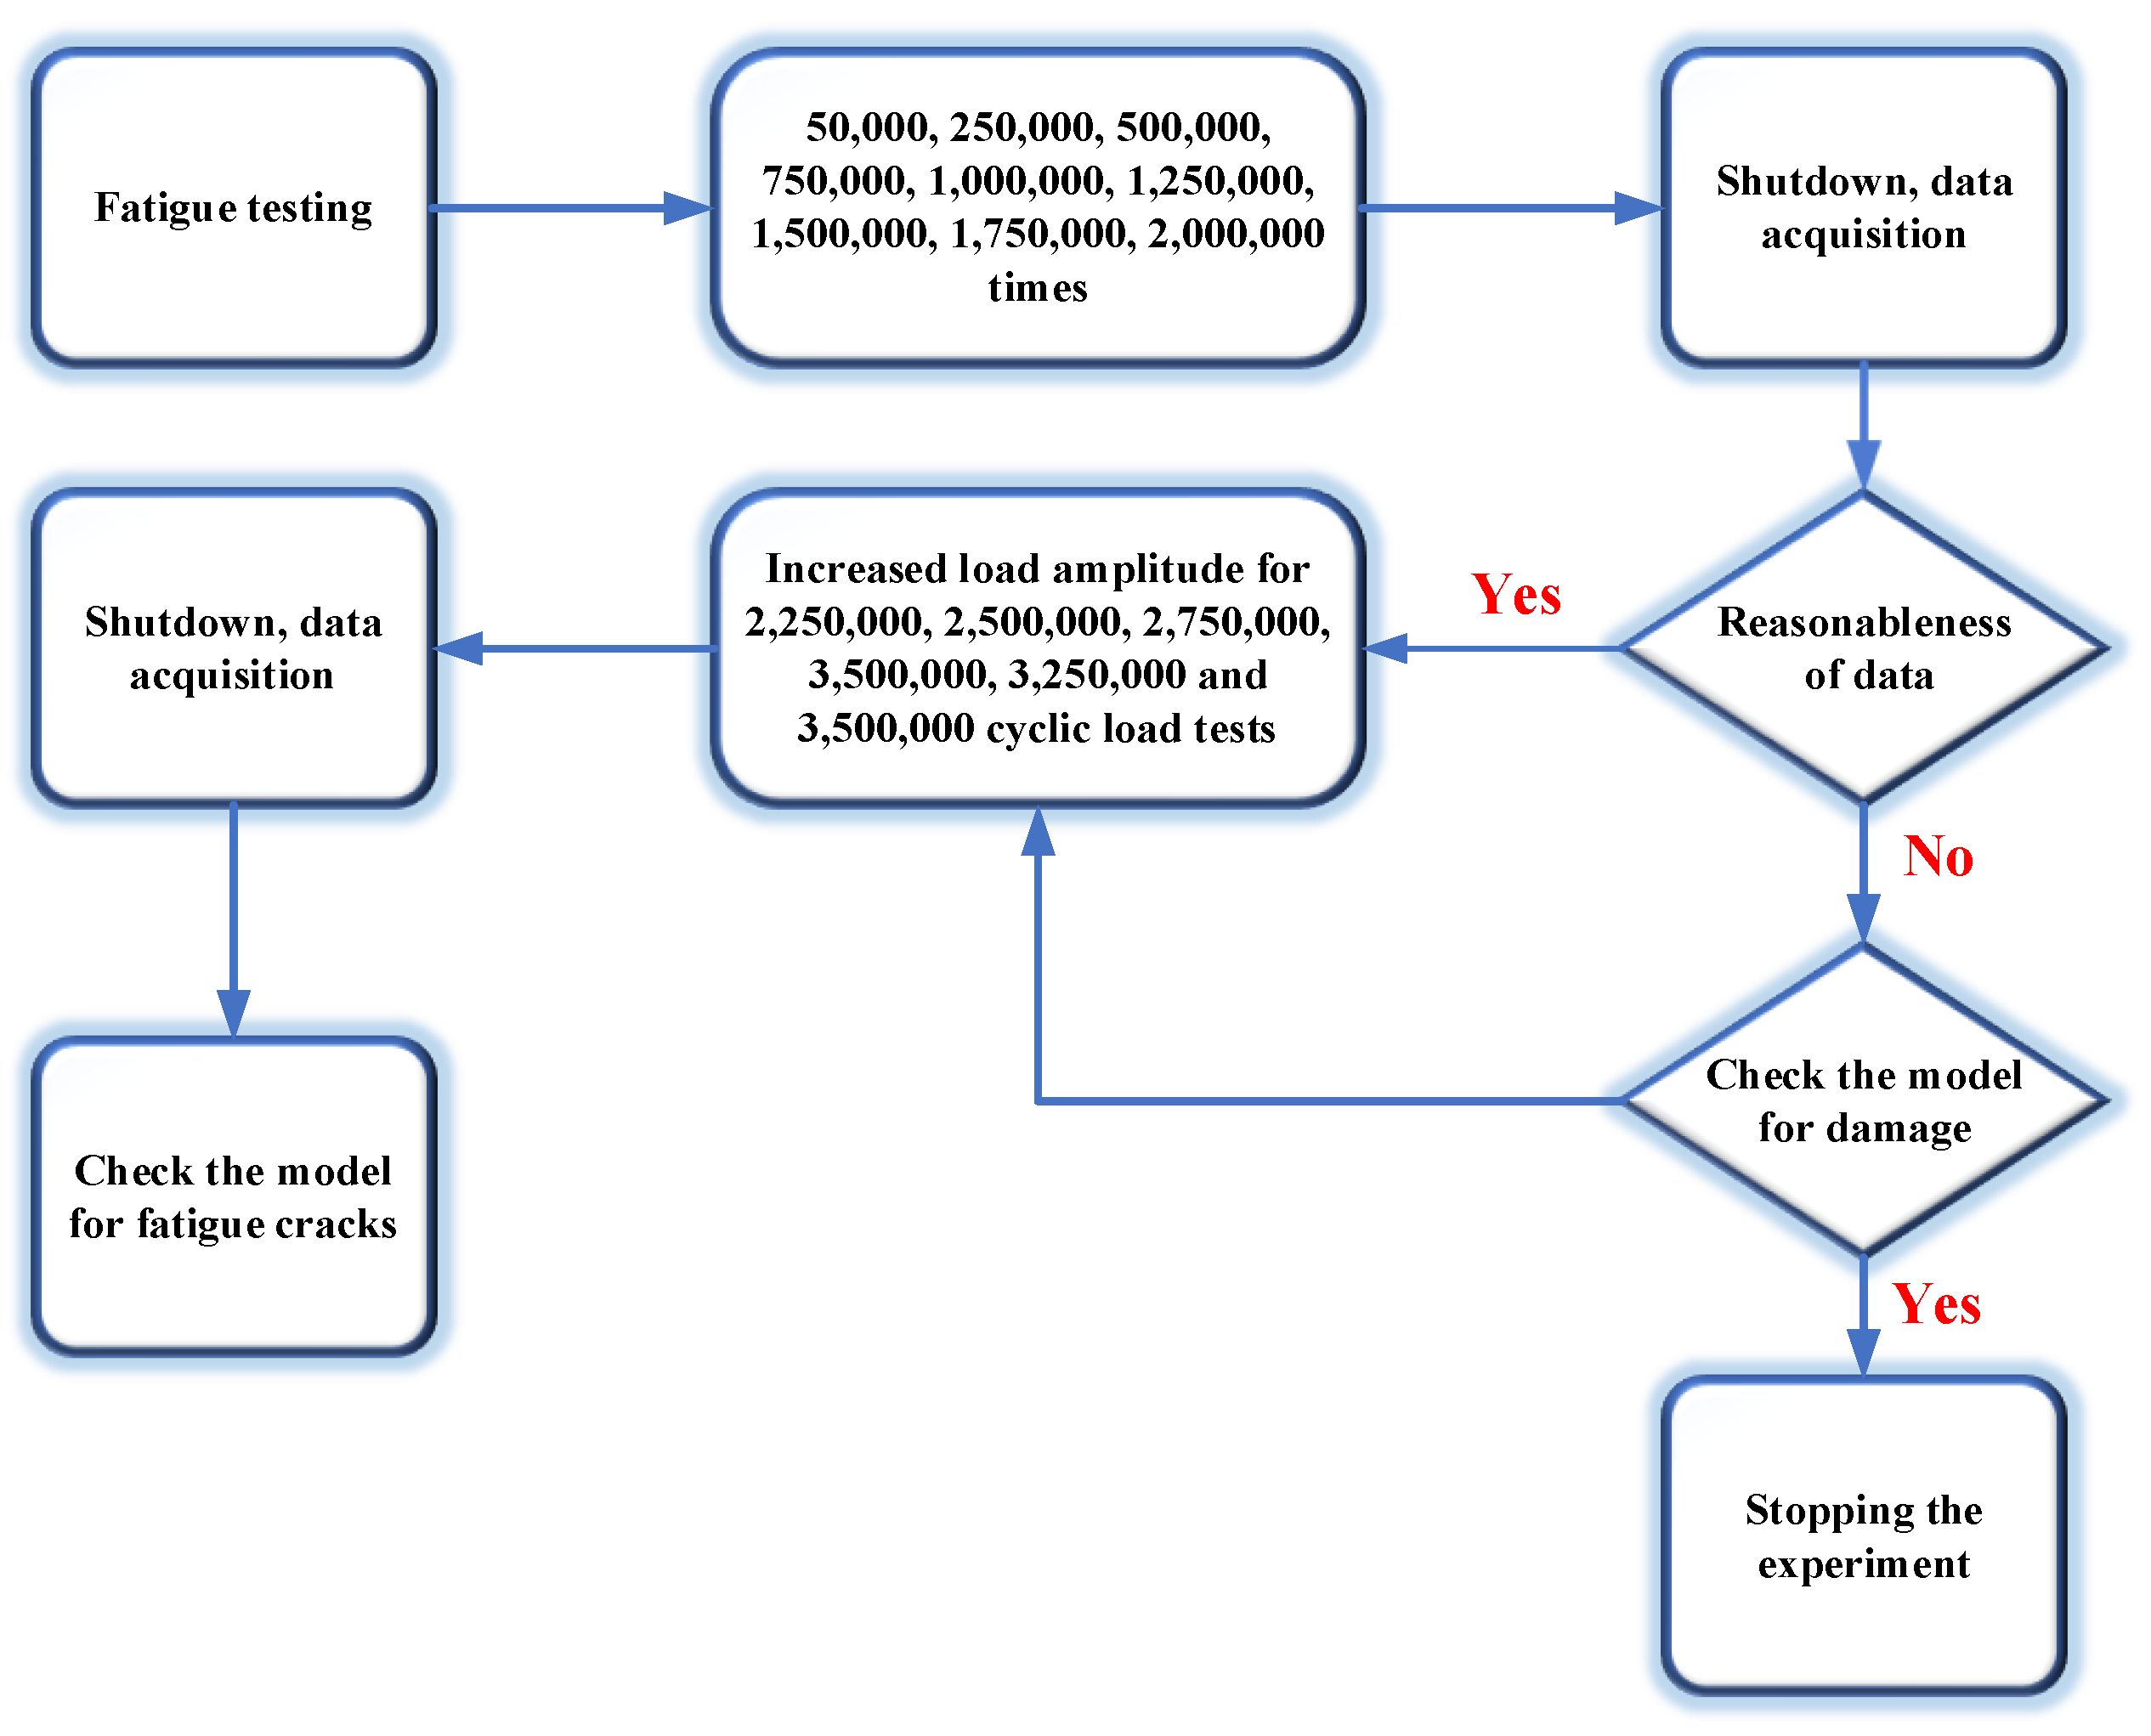
4.2. Fatigue Test Process
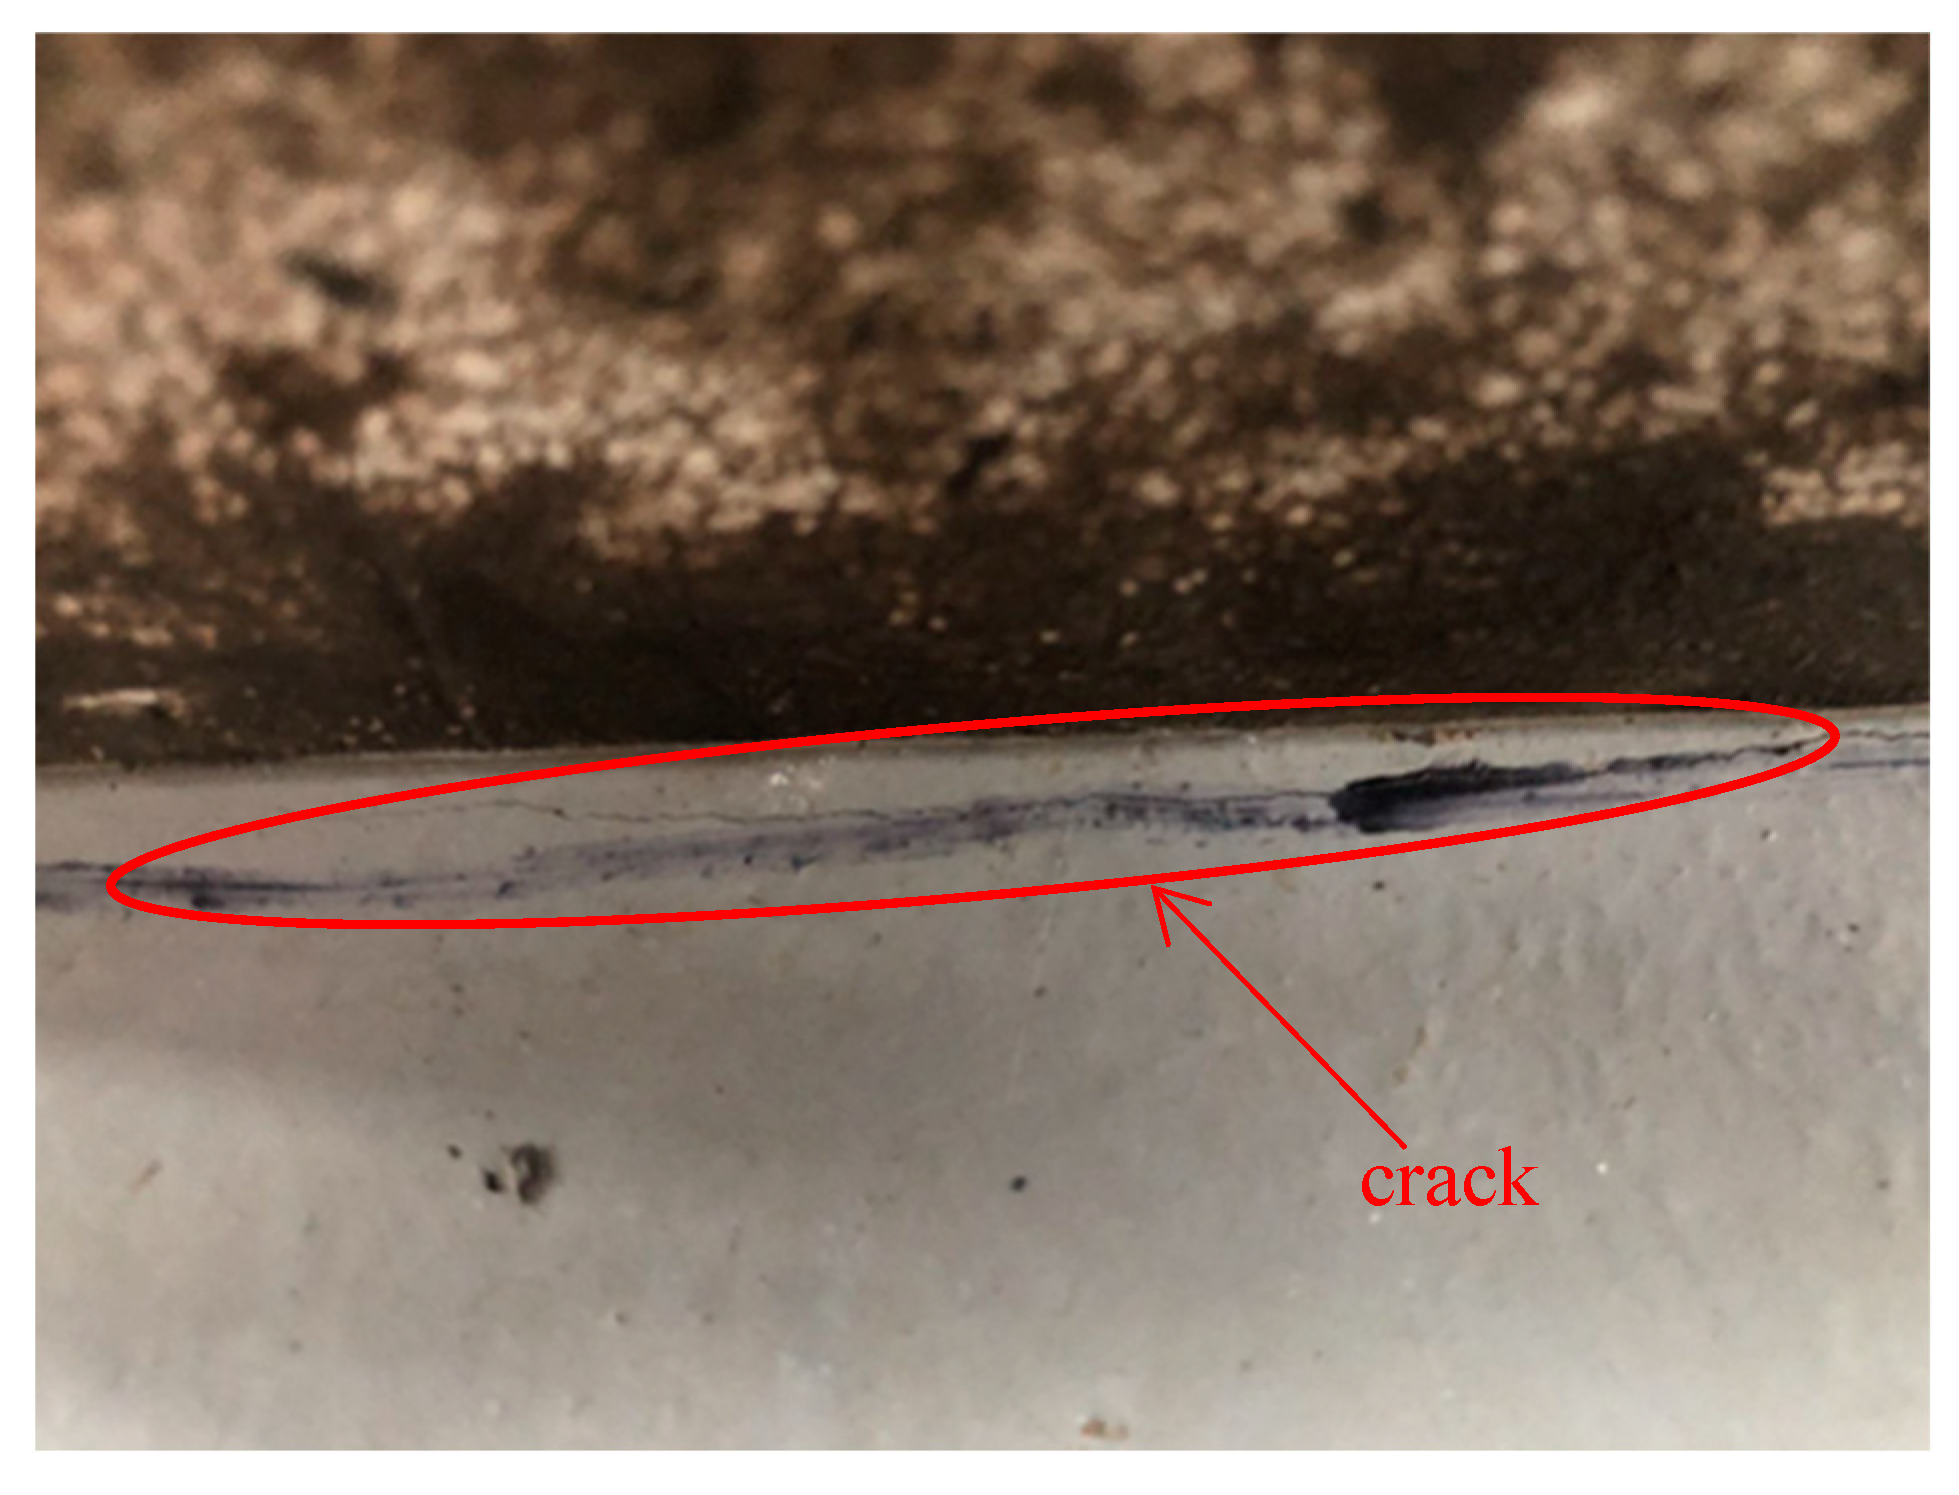
4.3. Fatigue Cracking’s Location
5. Fatigue Crack Life Prediction
5.1. Fatigue Cracking’s Location


5.2. Life Expectancy
6. Influences of Different Parameters on Residual Life of Structure
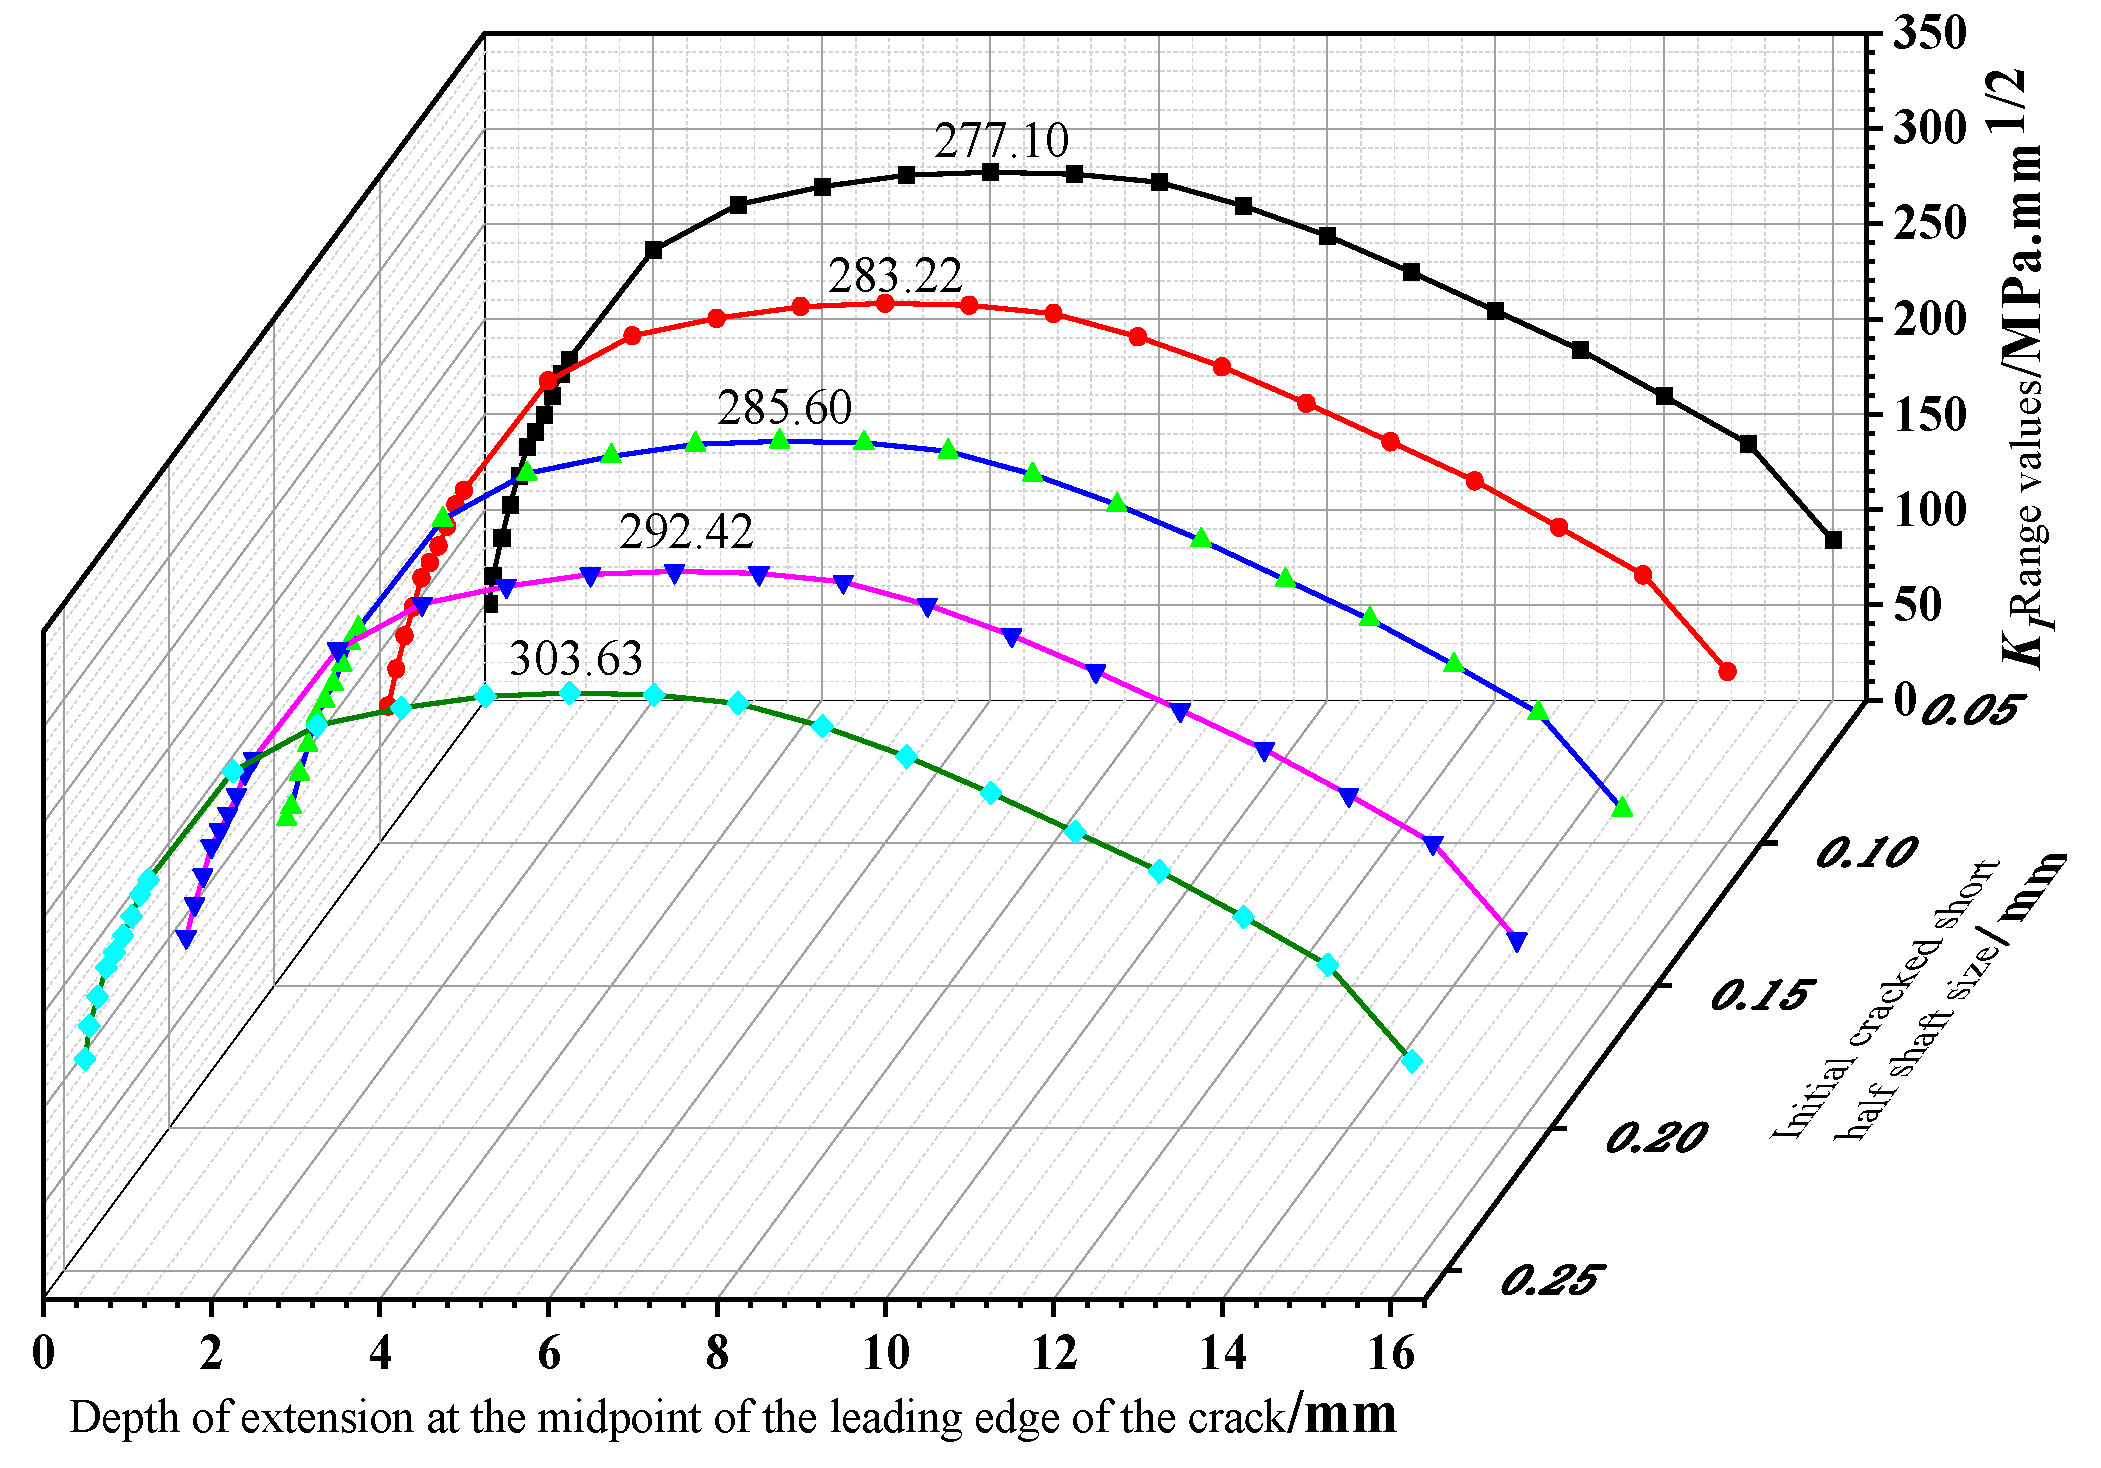
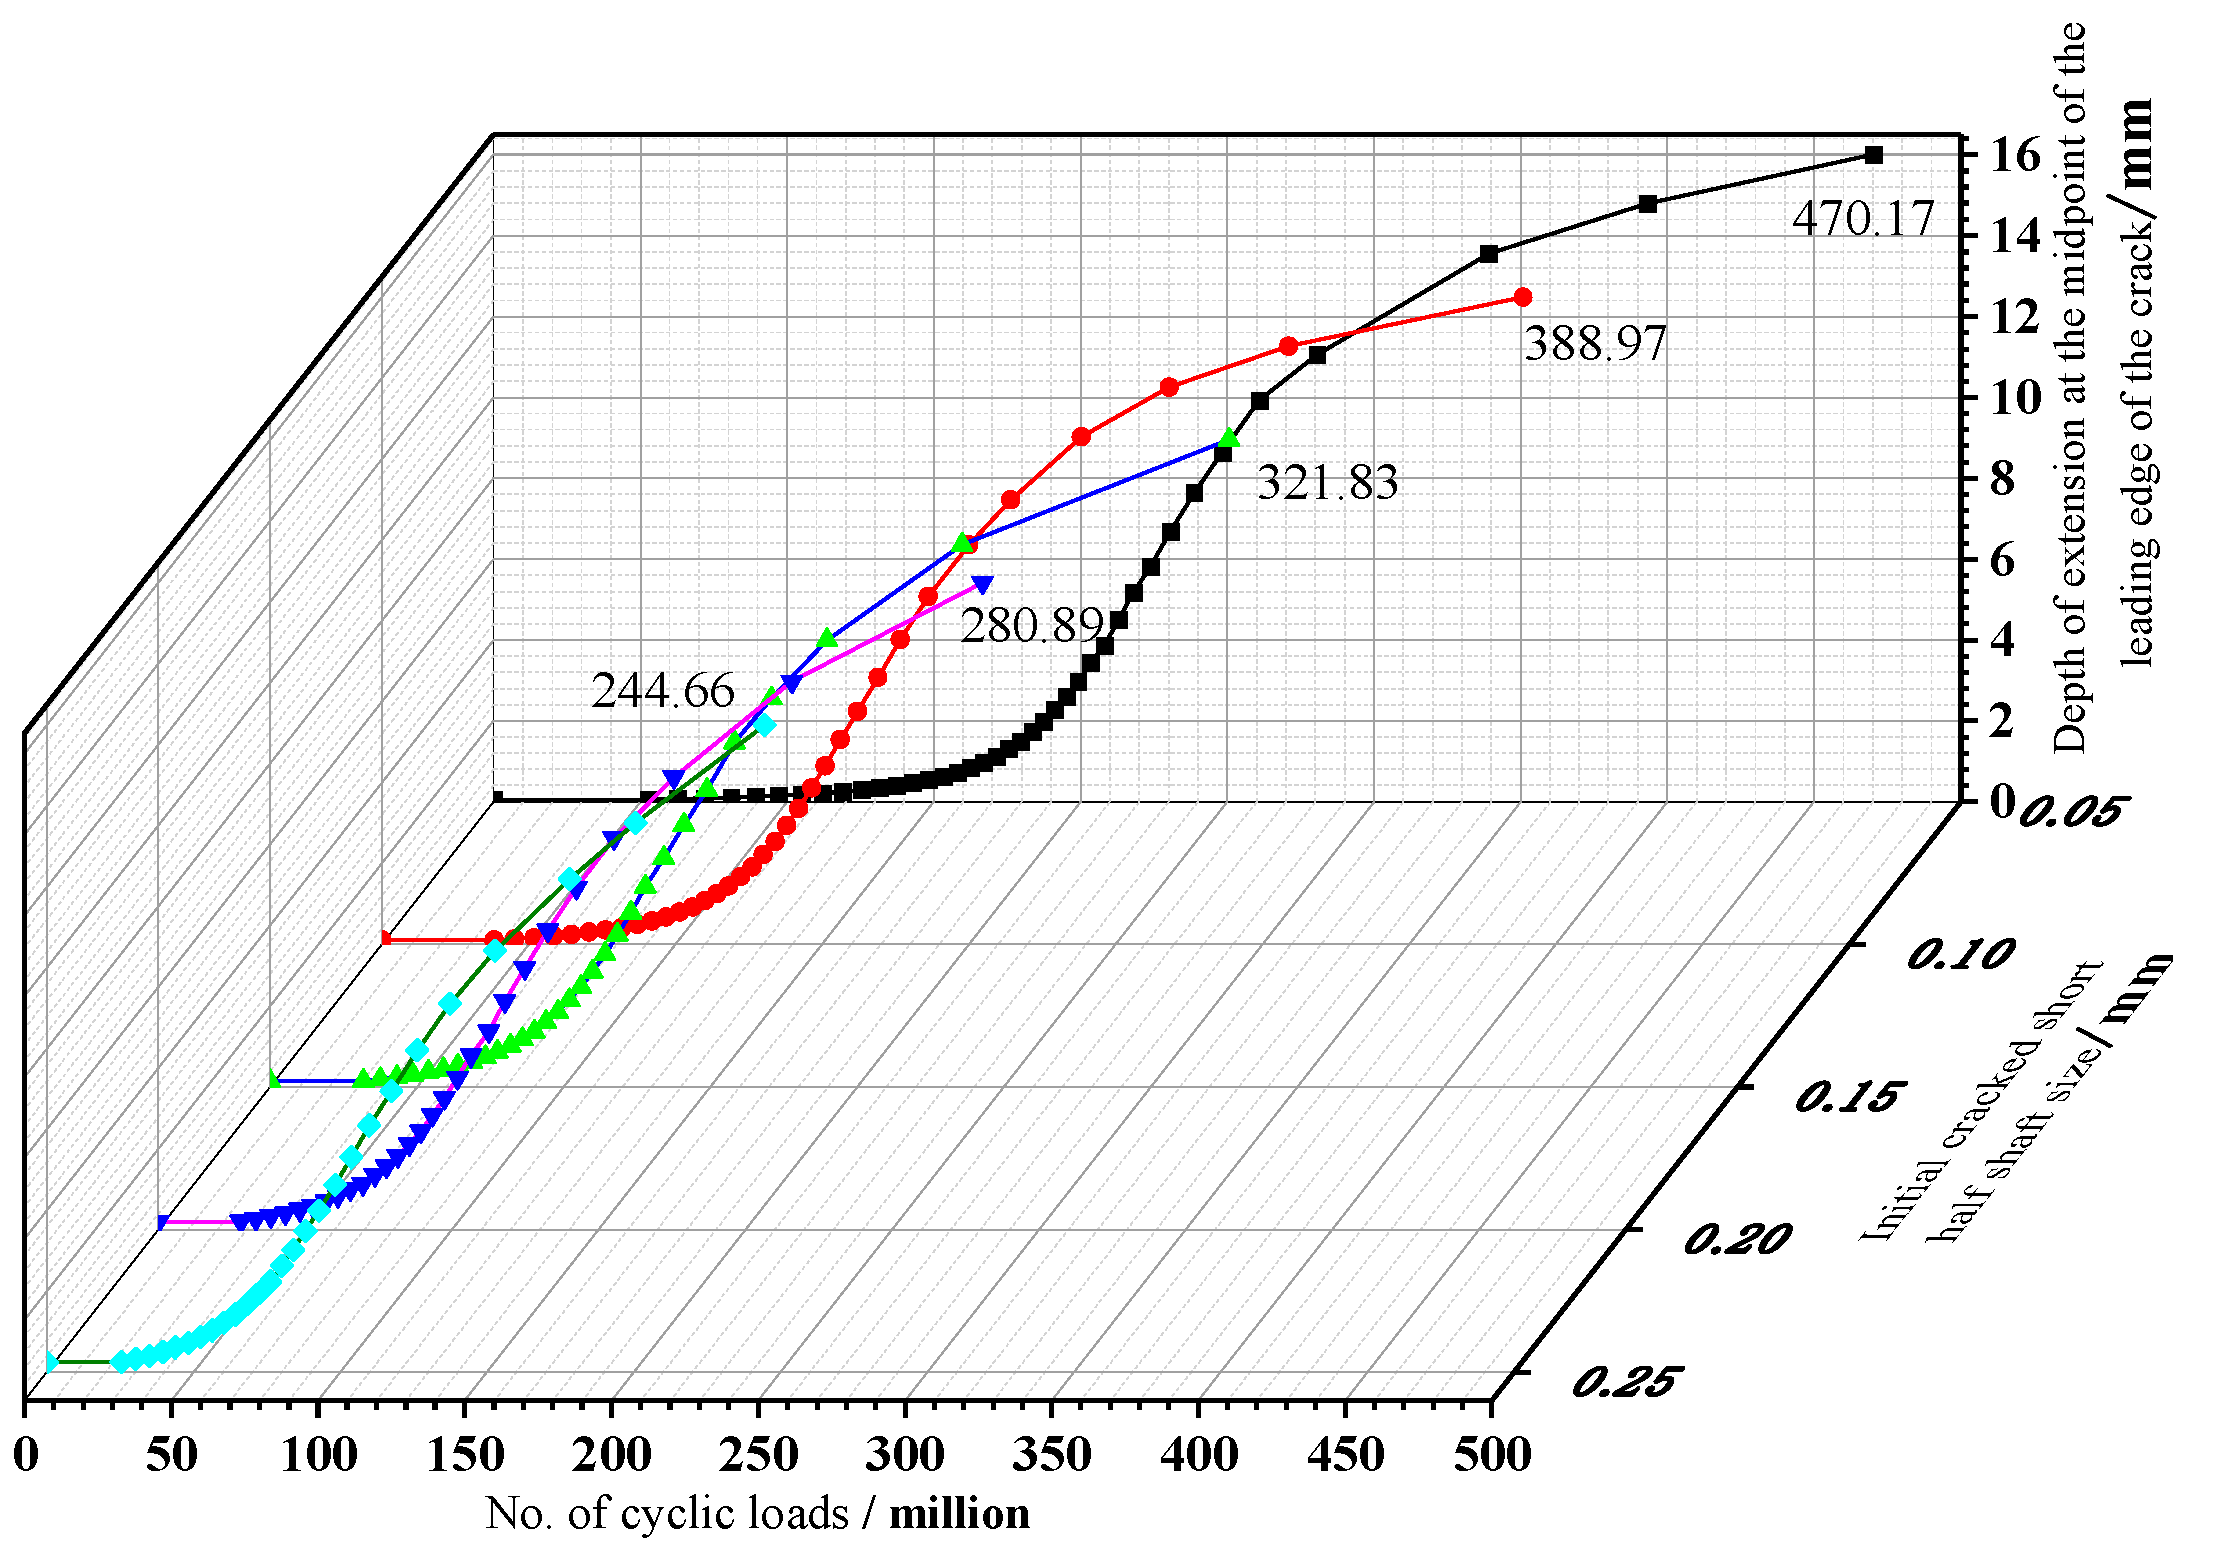
6.1. Initial Crack Size
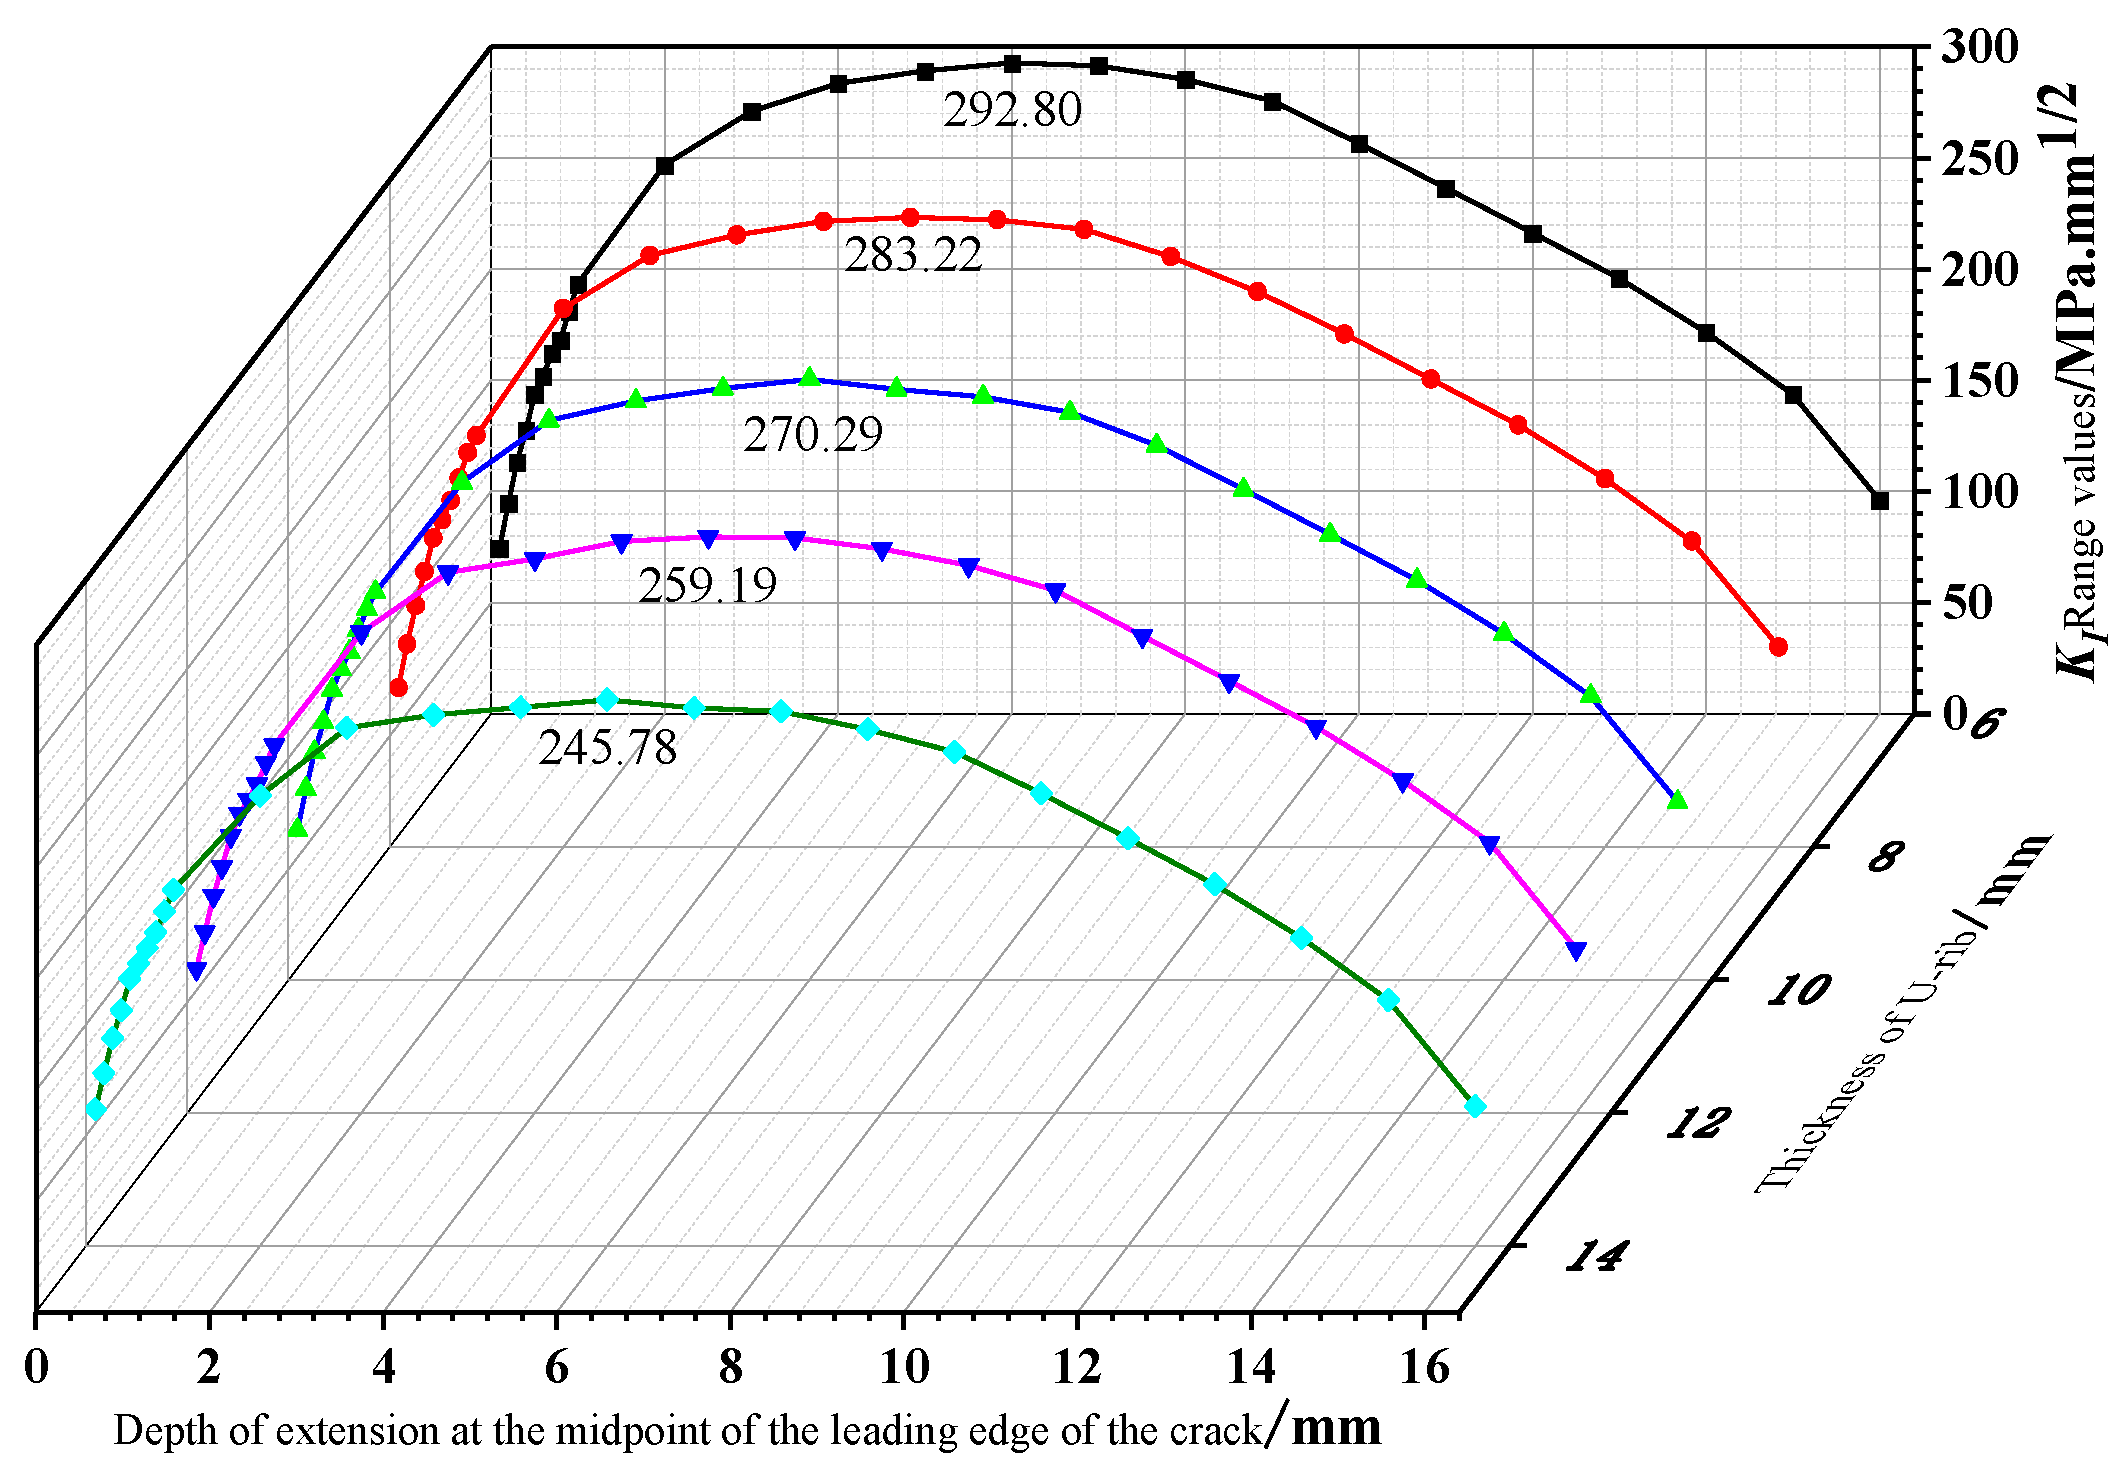
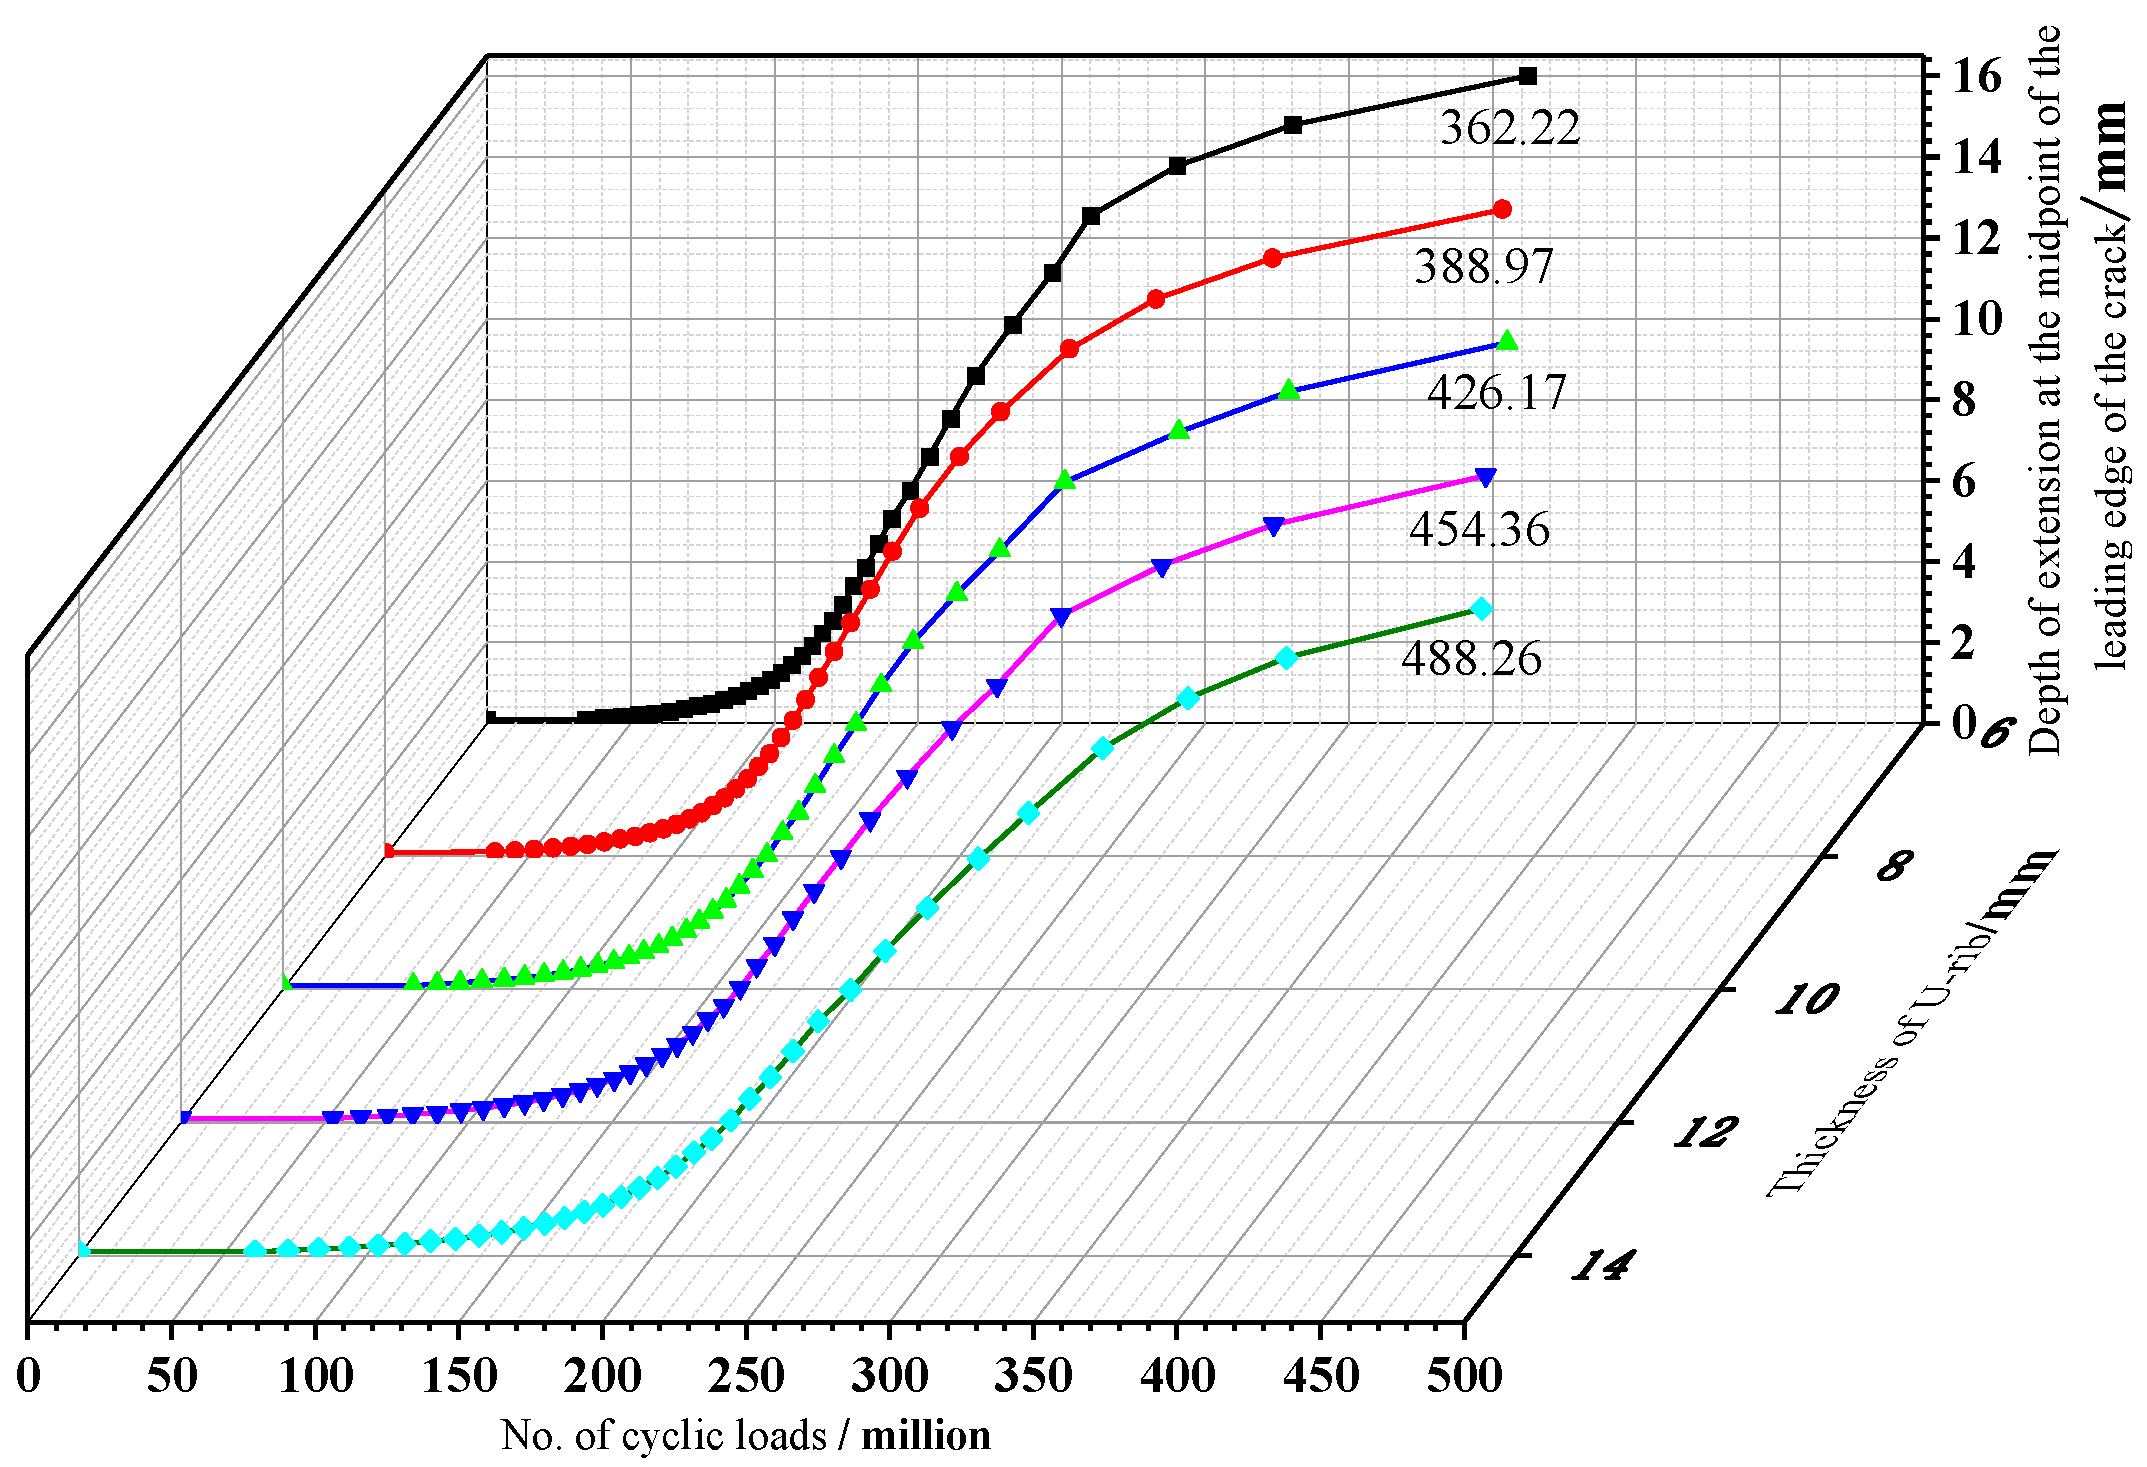
6.2. Thickness of U-Rib
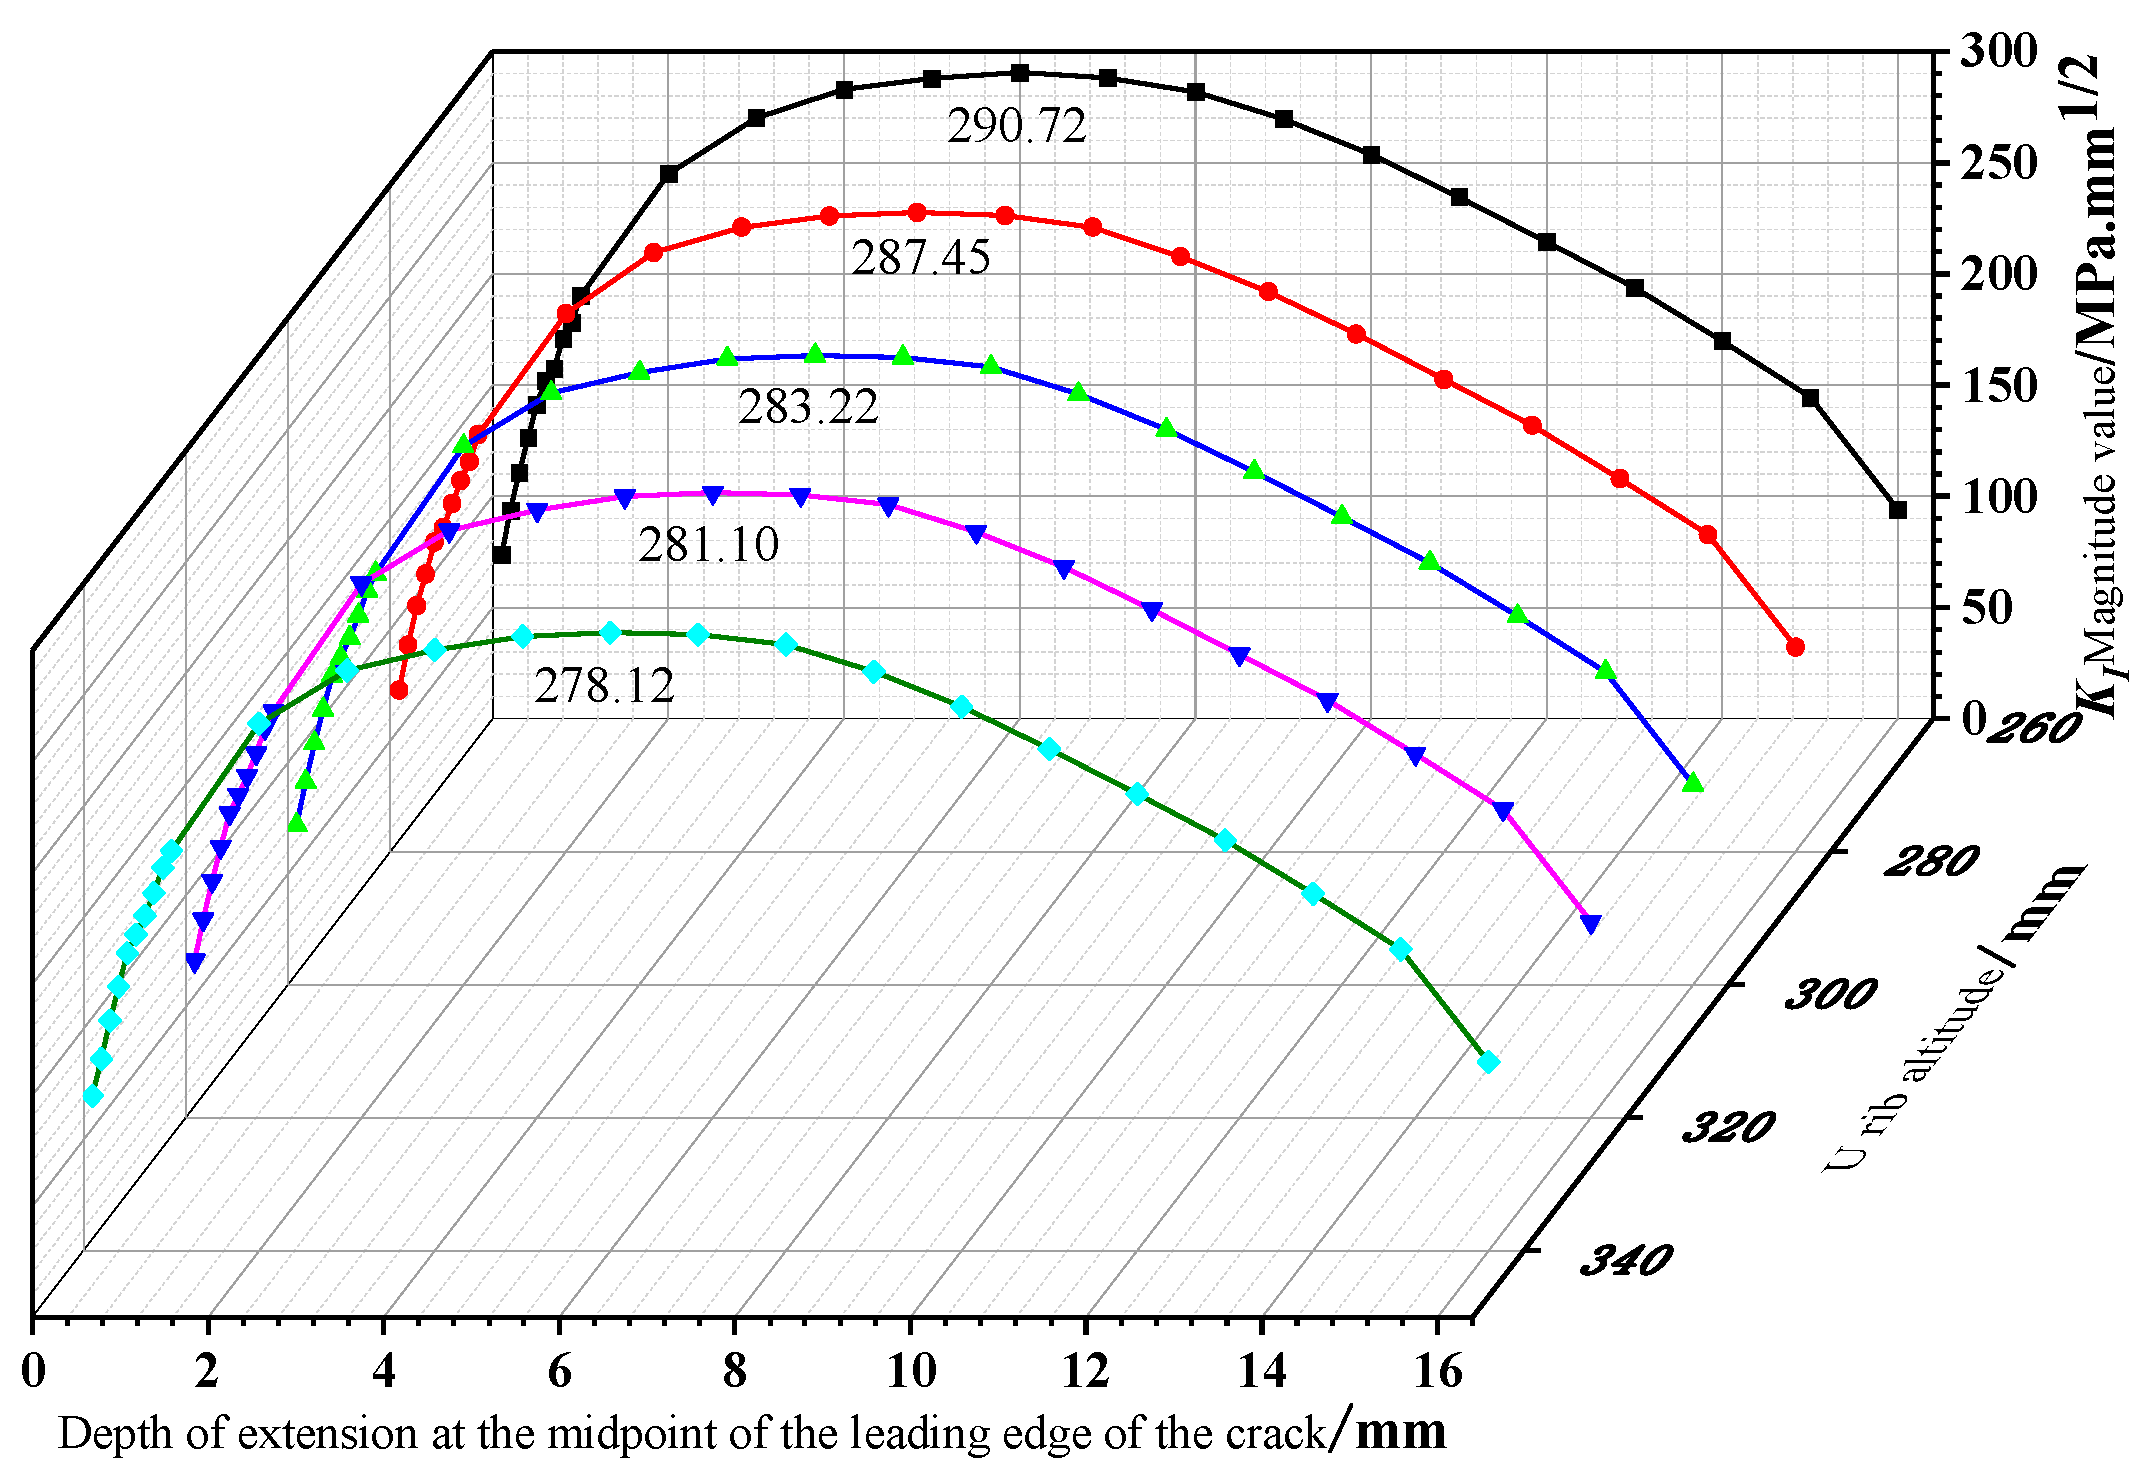
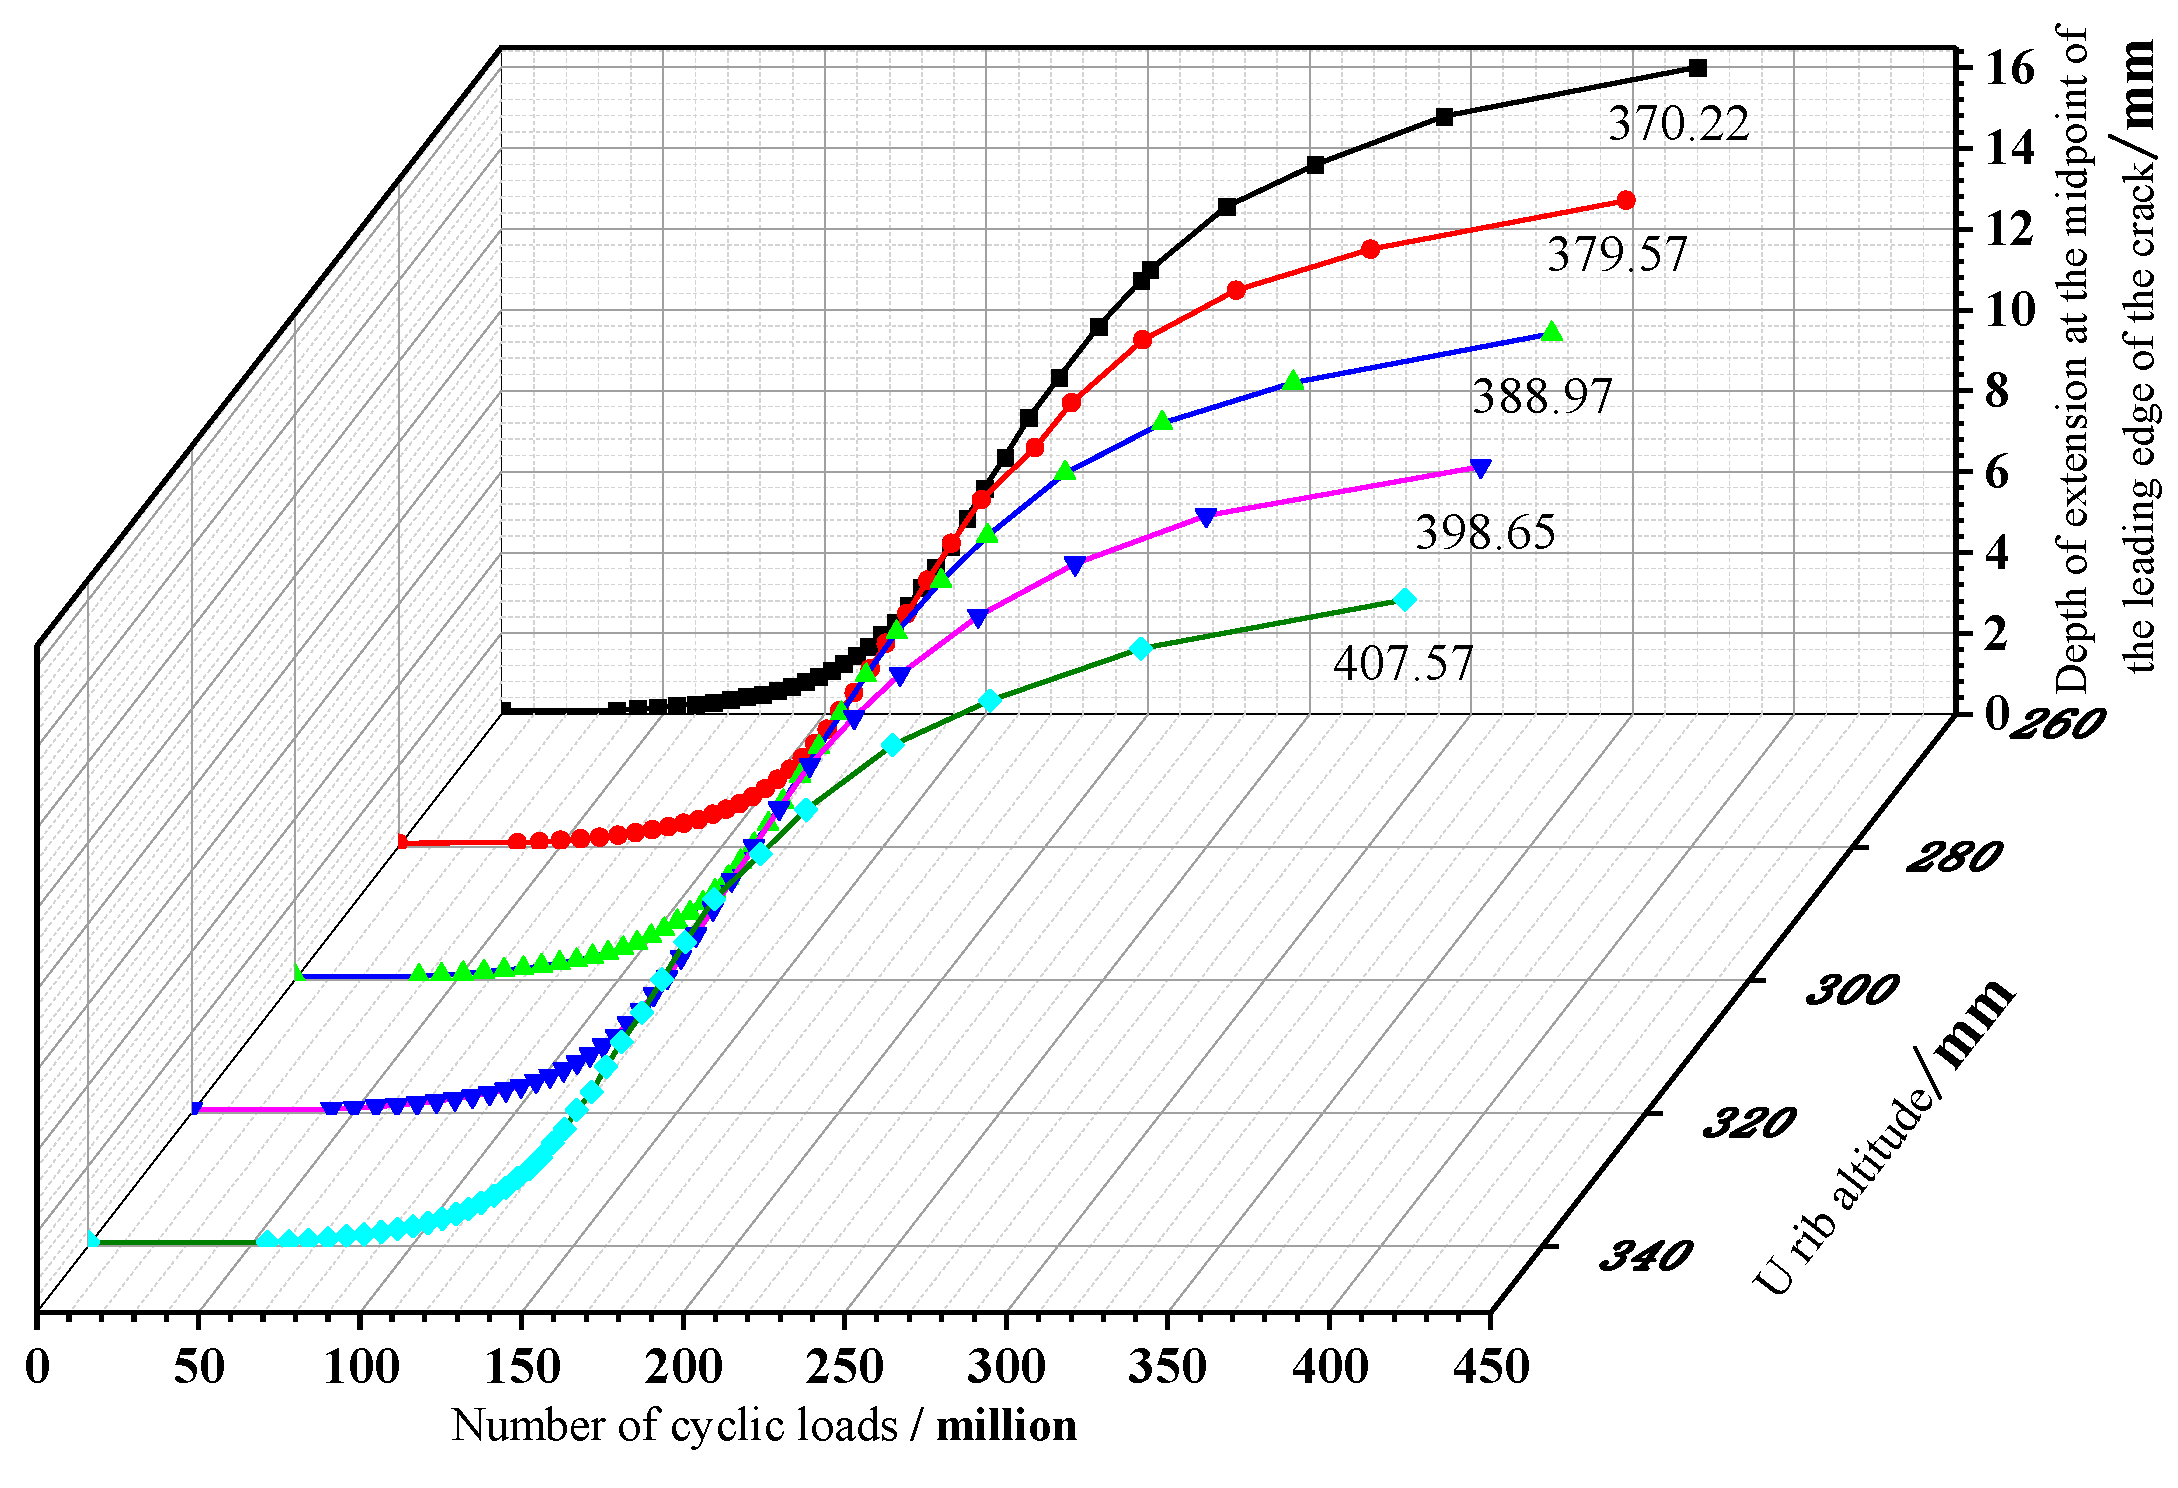
6.3. U-Rib Height
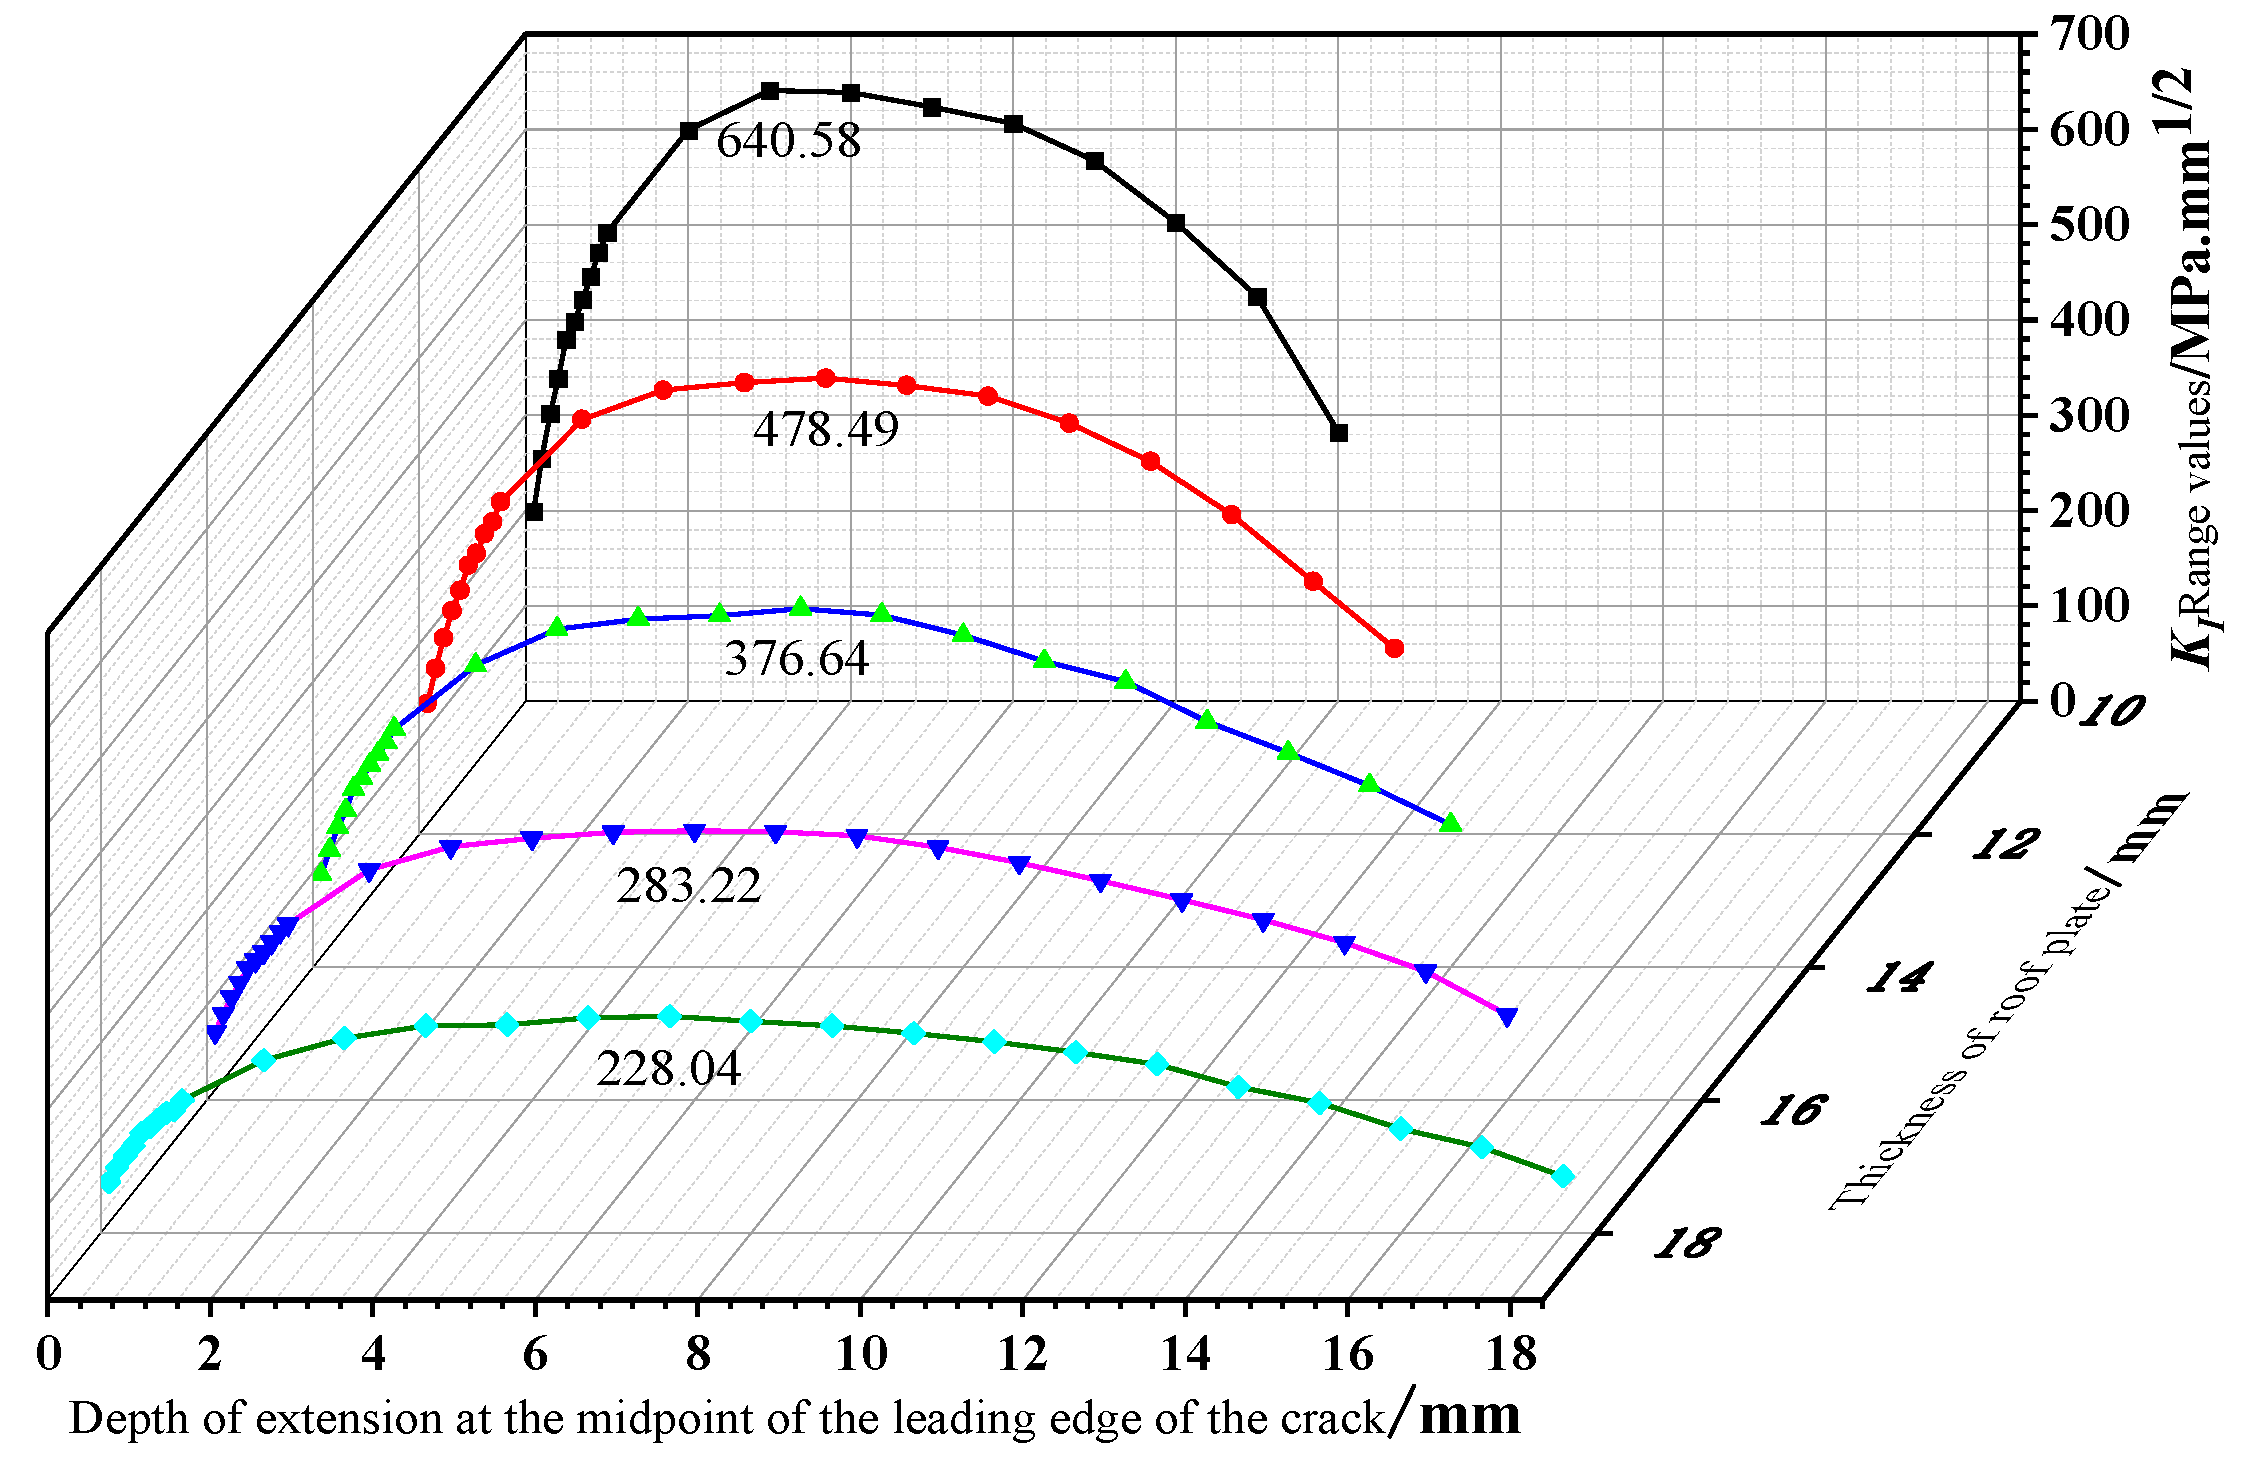
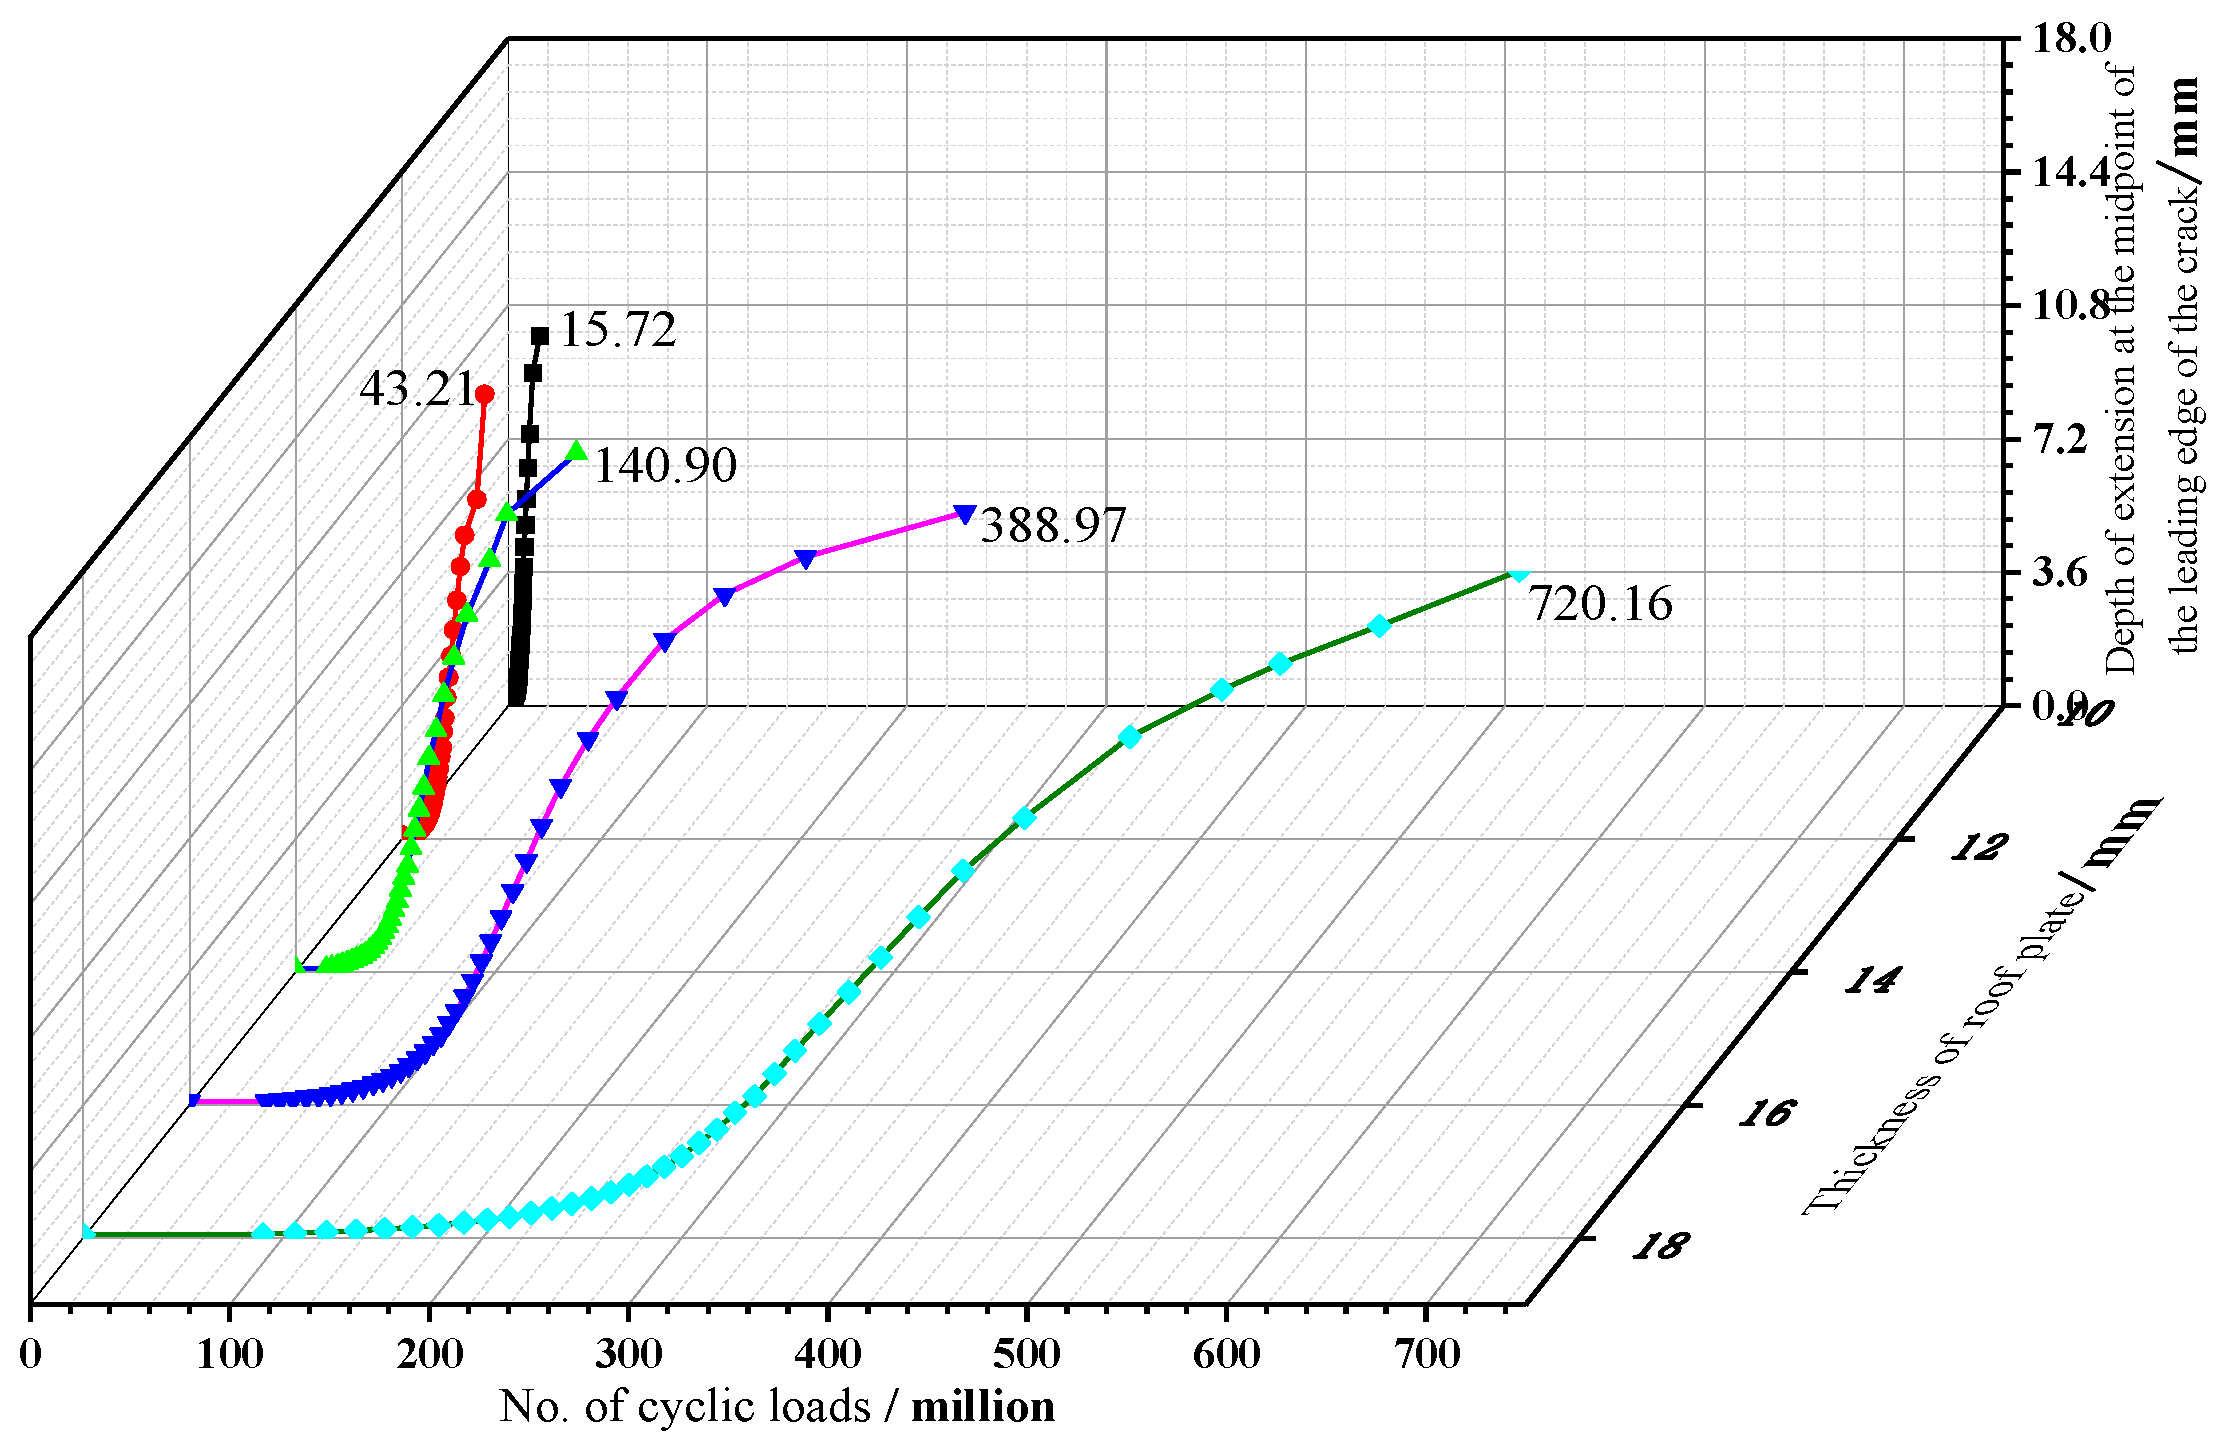
6.4. Thickness of Top Plate
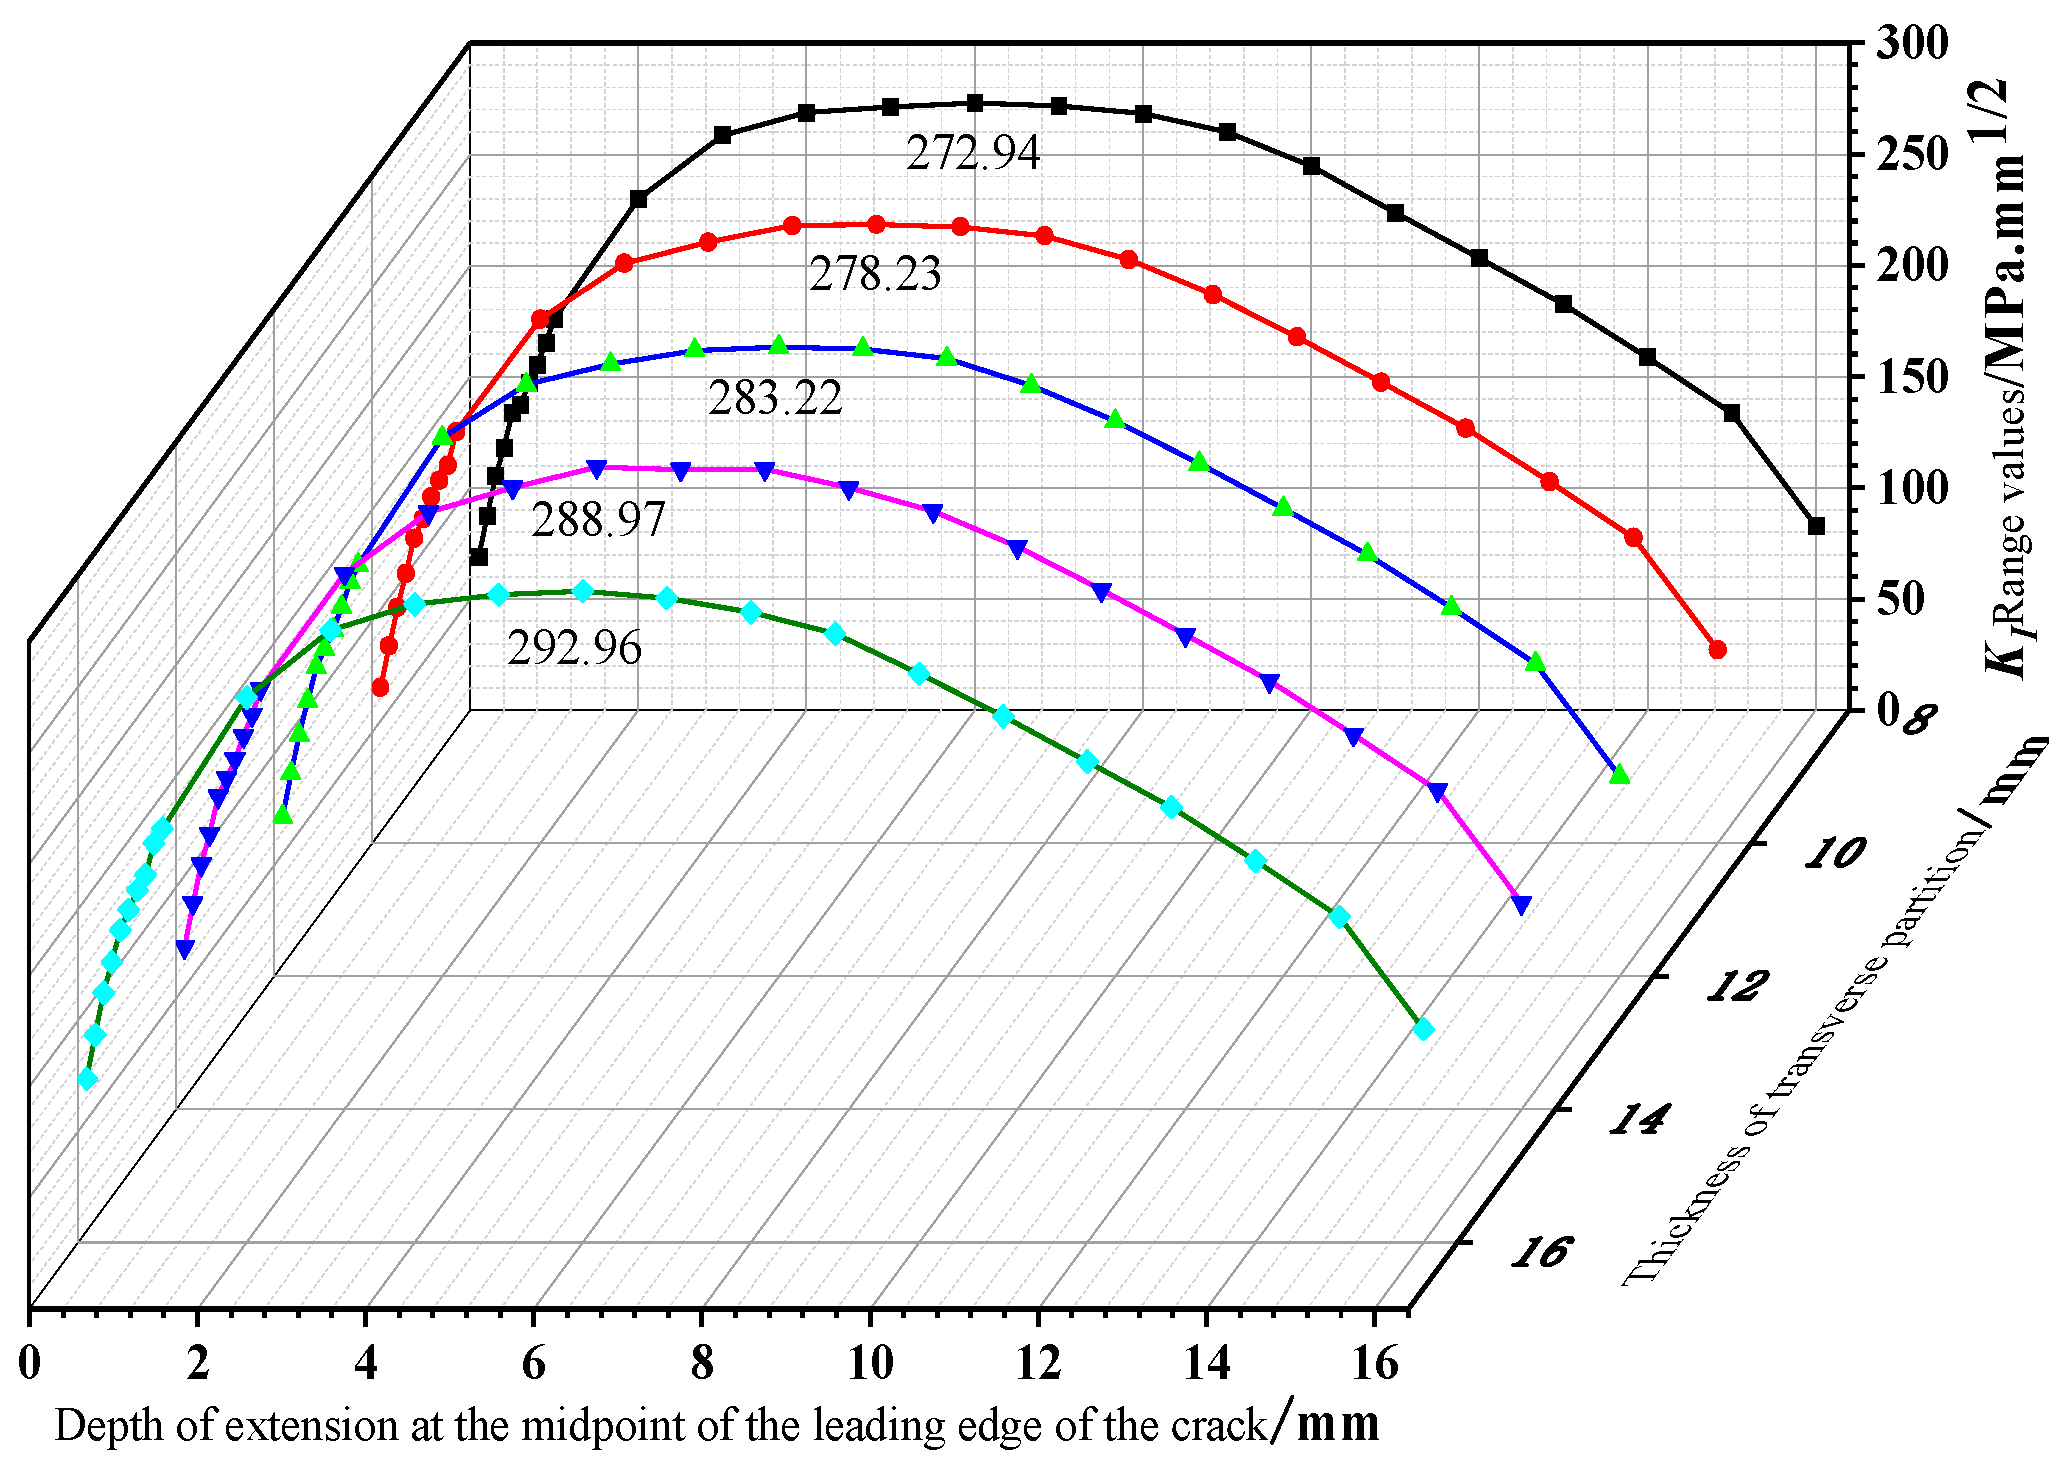
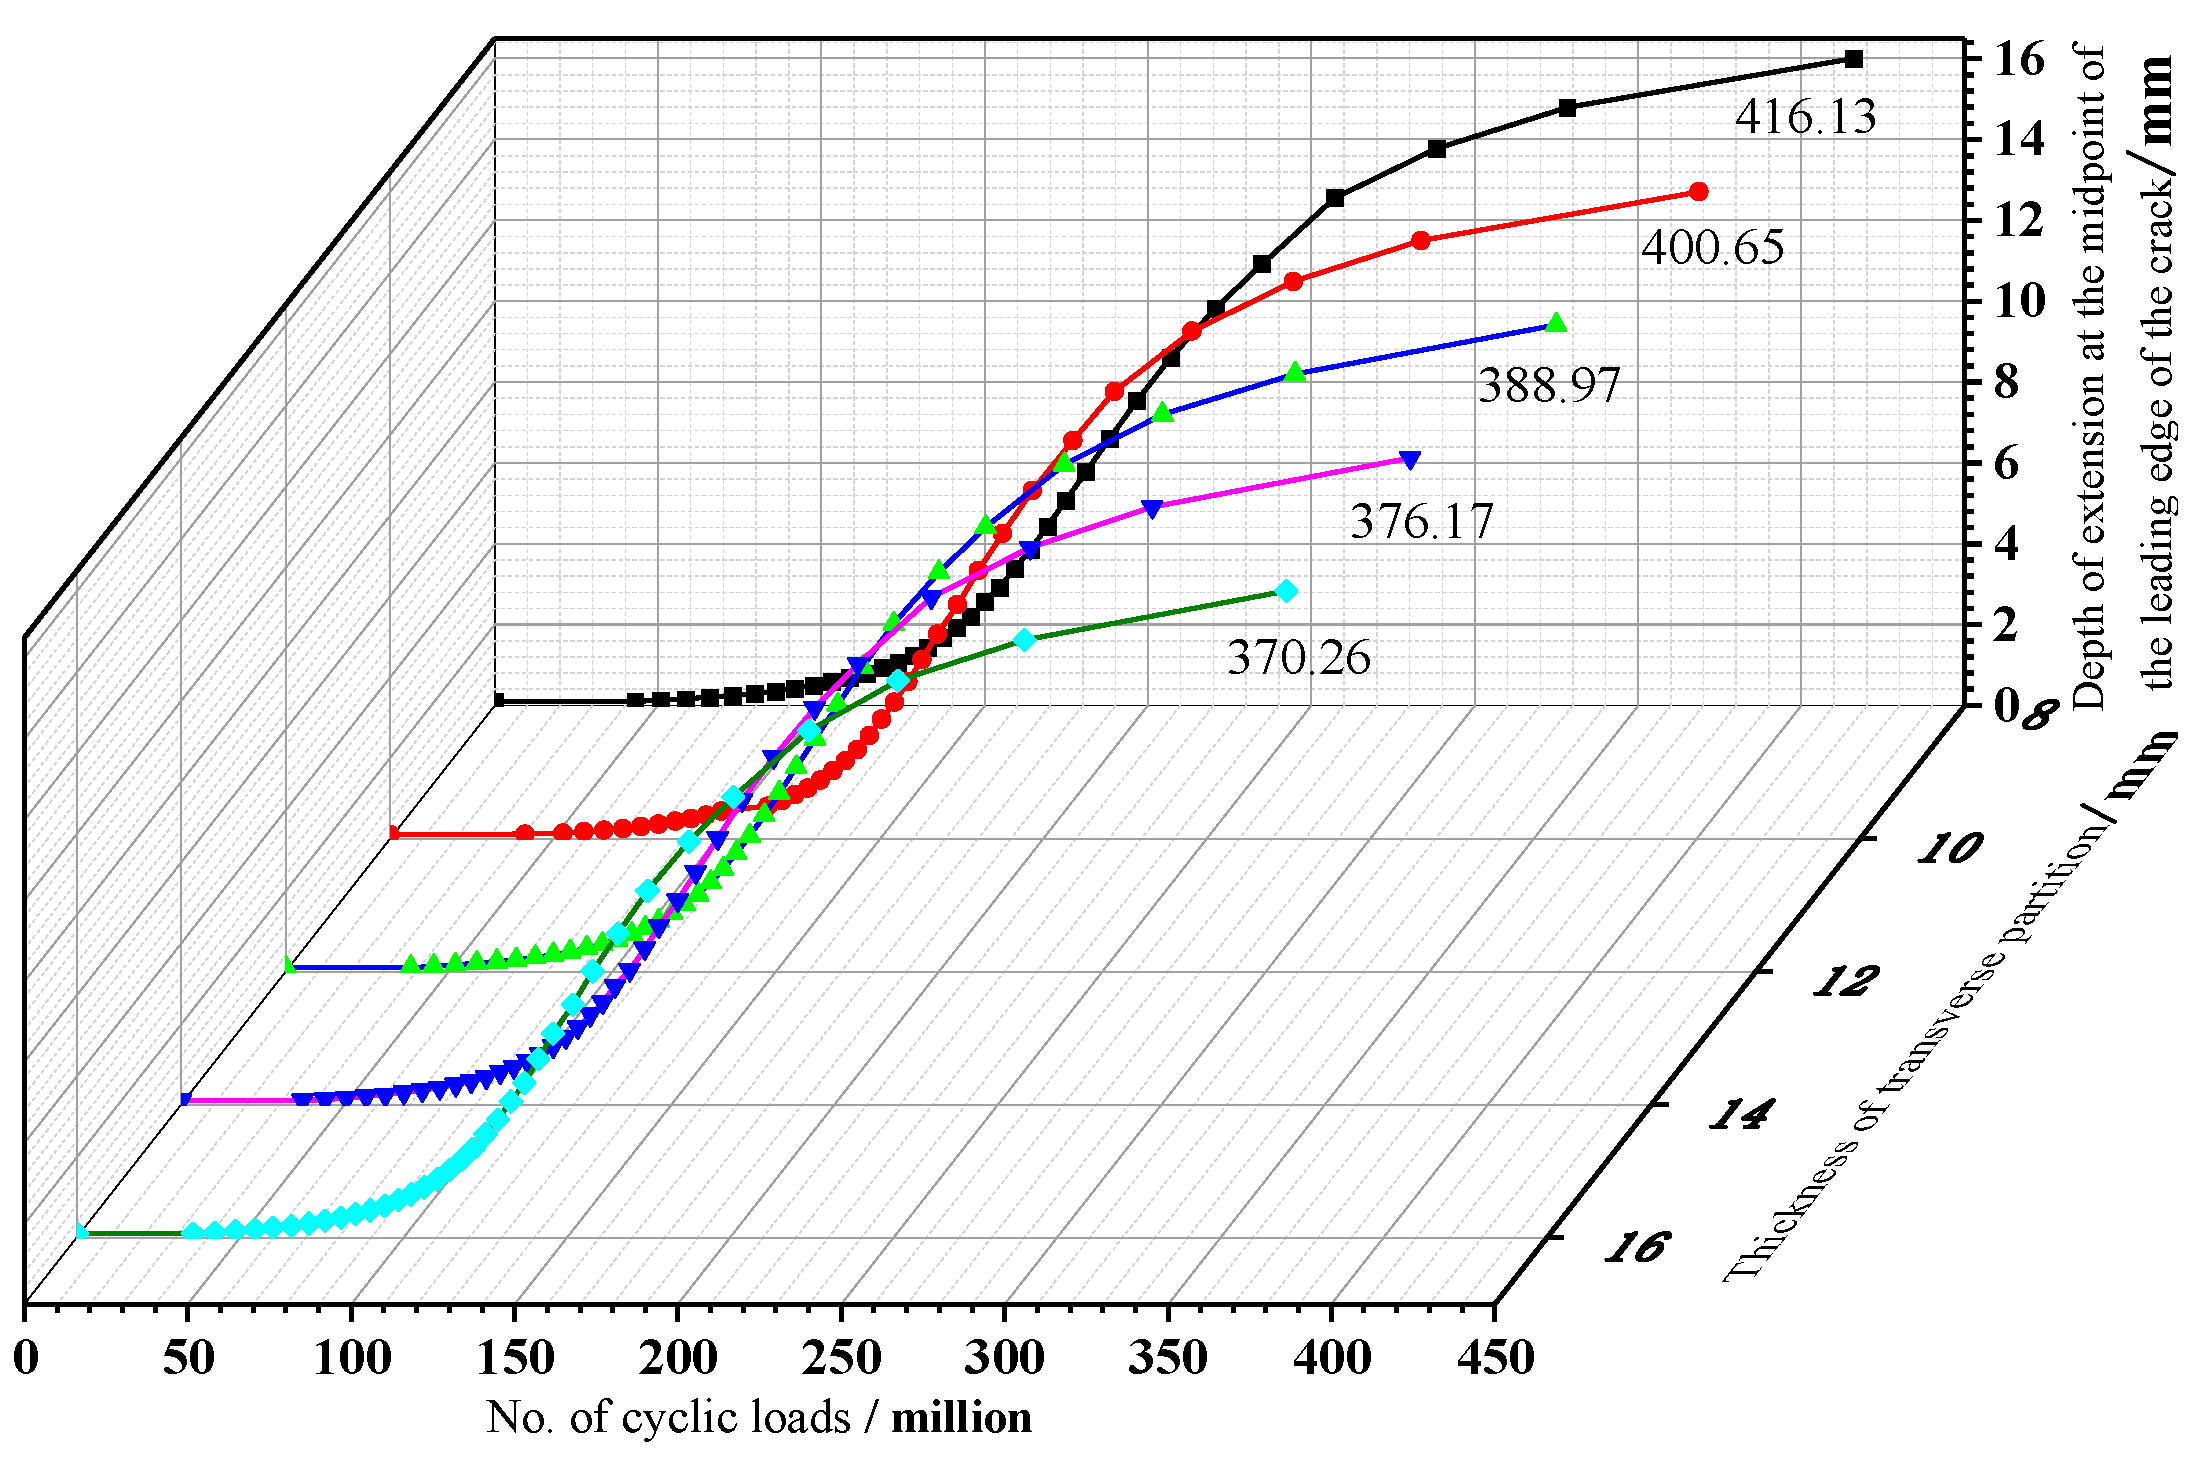
6.5. Thickness of the Horizontal Partition
7. Conclusions
- (1)
- A crack with a length of 15.1 cm appears near the boundary of the loading position for the first time after 3 million~3.25 million cycles of loading. After 3.25 million~3.5 million cycles of cyclic loading, the crack expanded to 18.6 cm in the model test;
- (2)
- The finite element calculation results and the test results are basically the same, so the test can reflect the real state of the model force, and the test data have real reliability;
- (3)
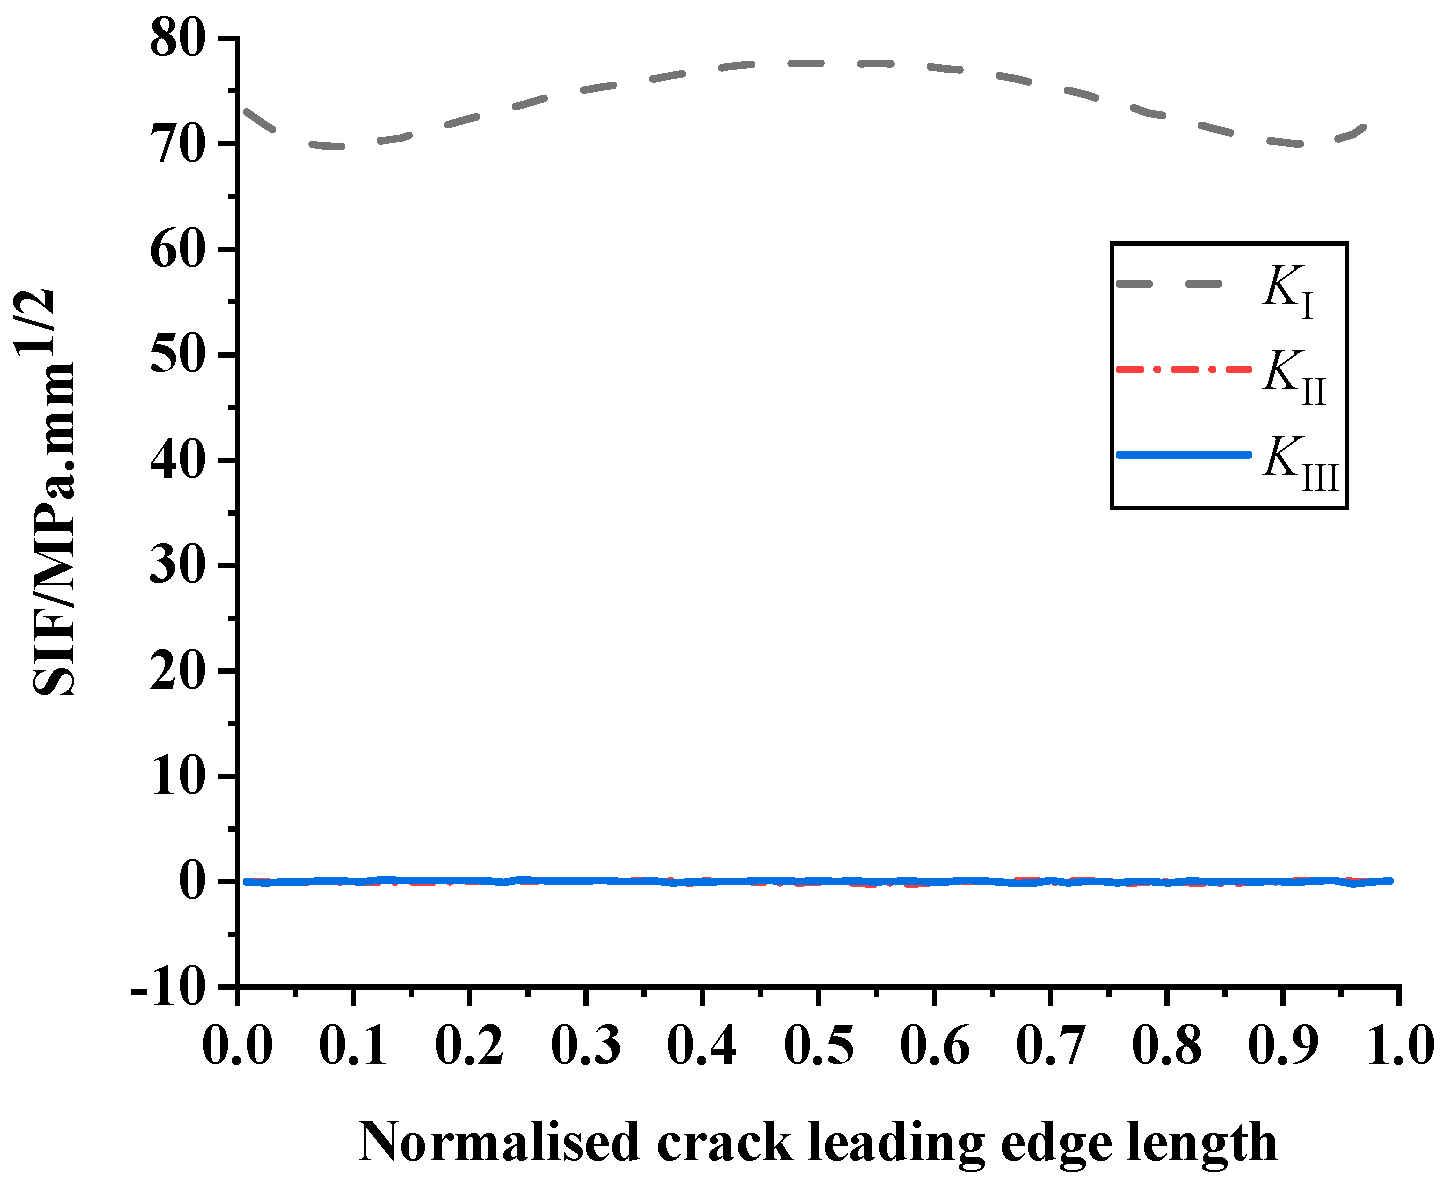
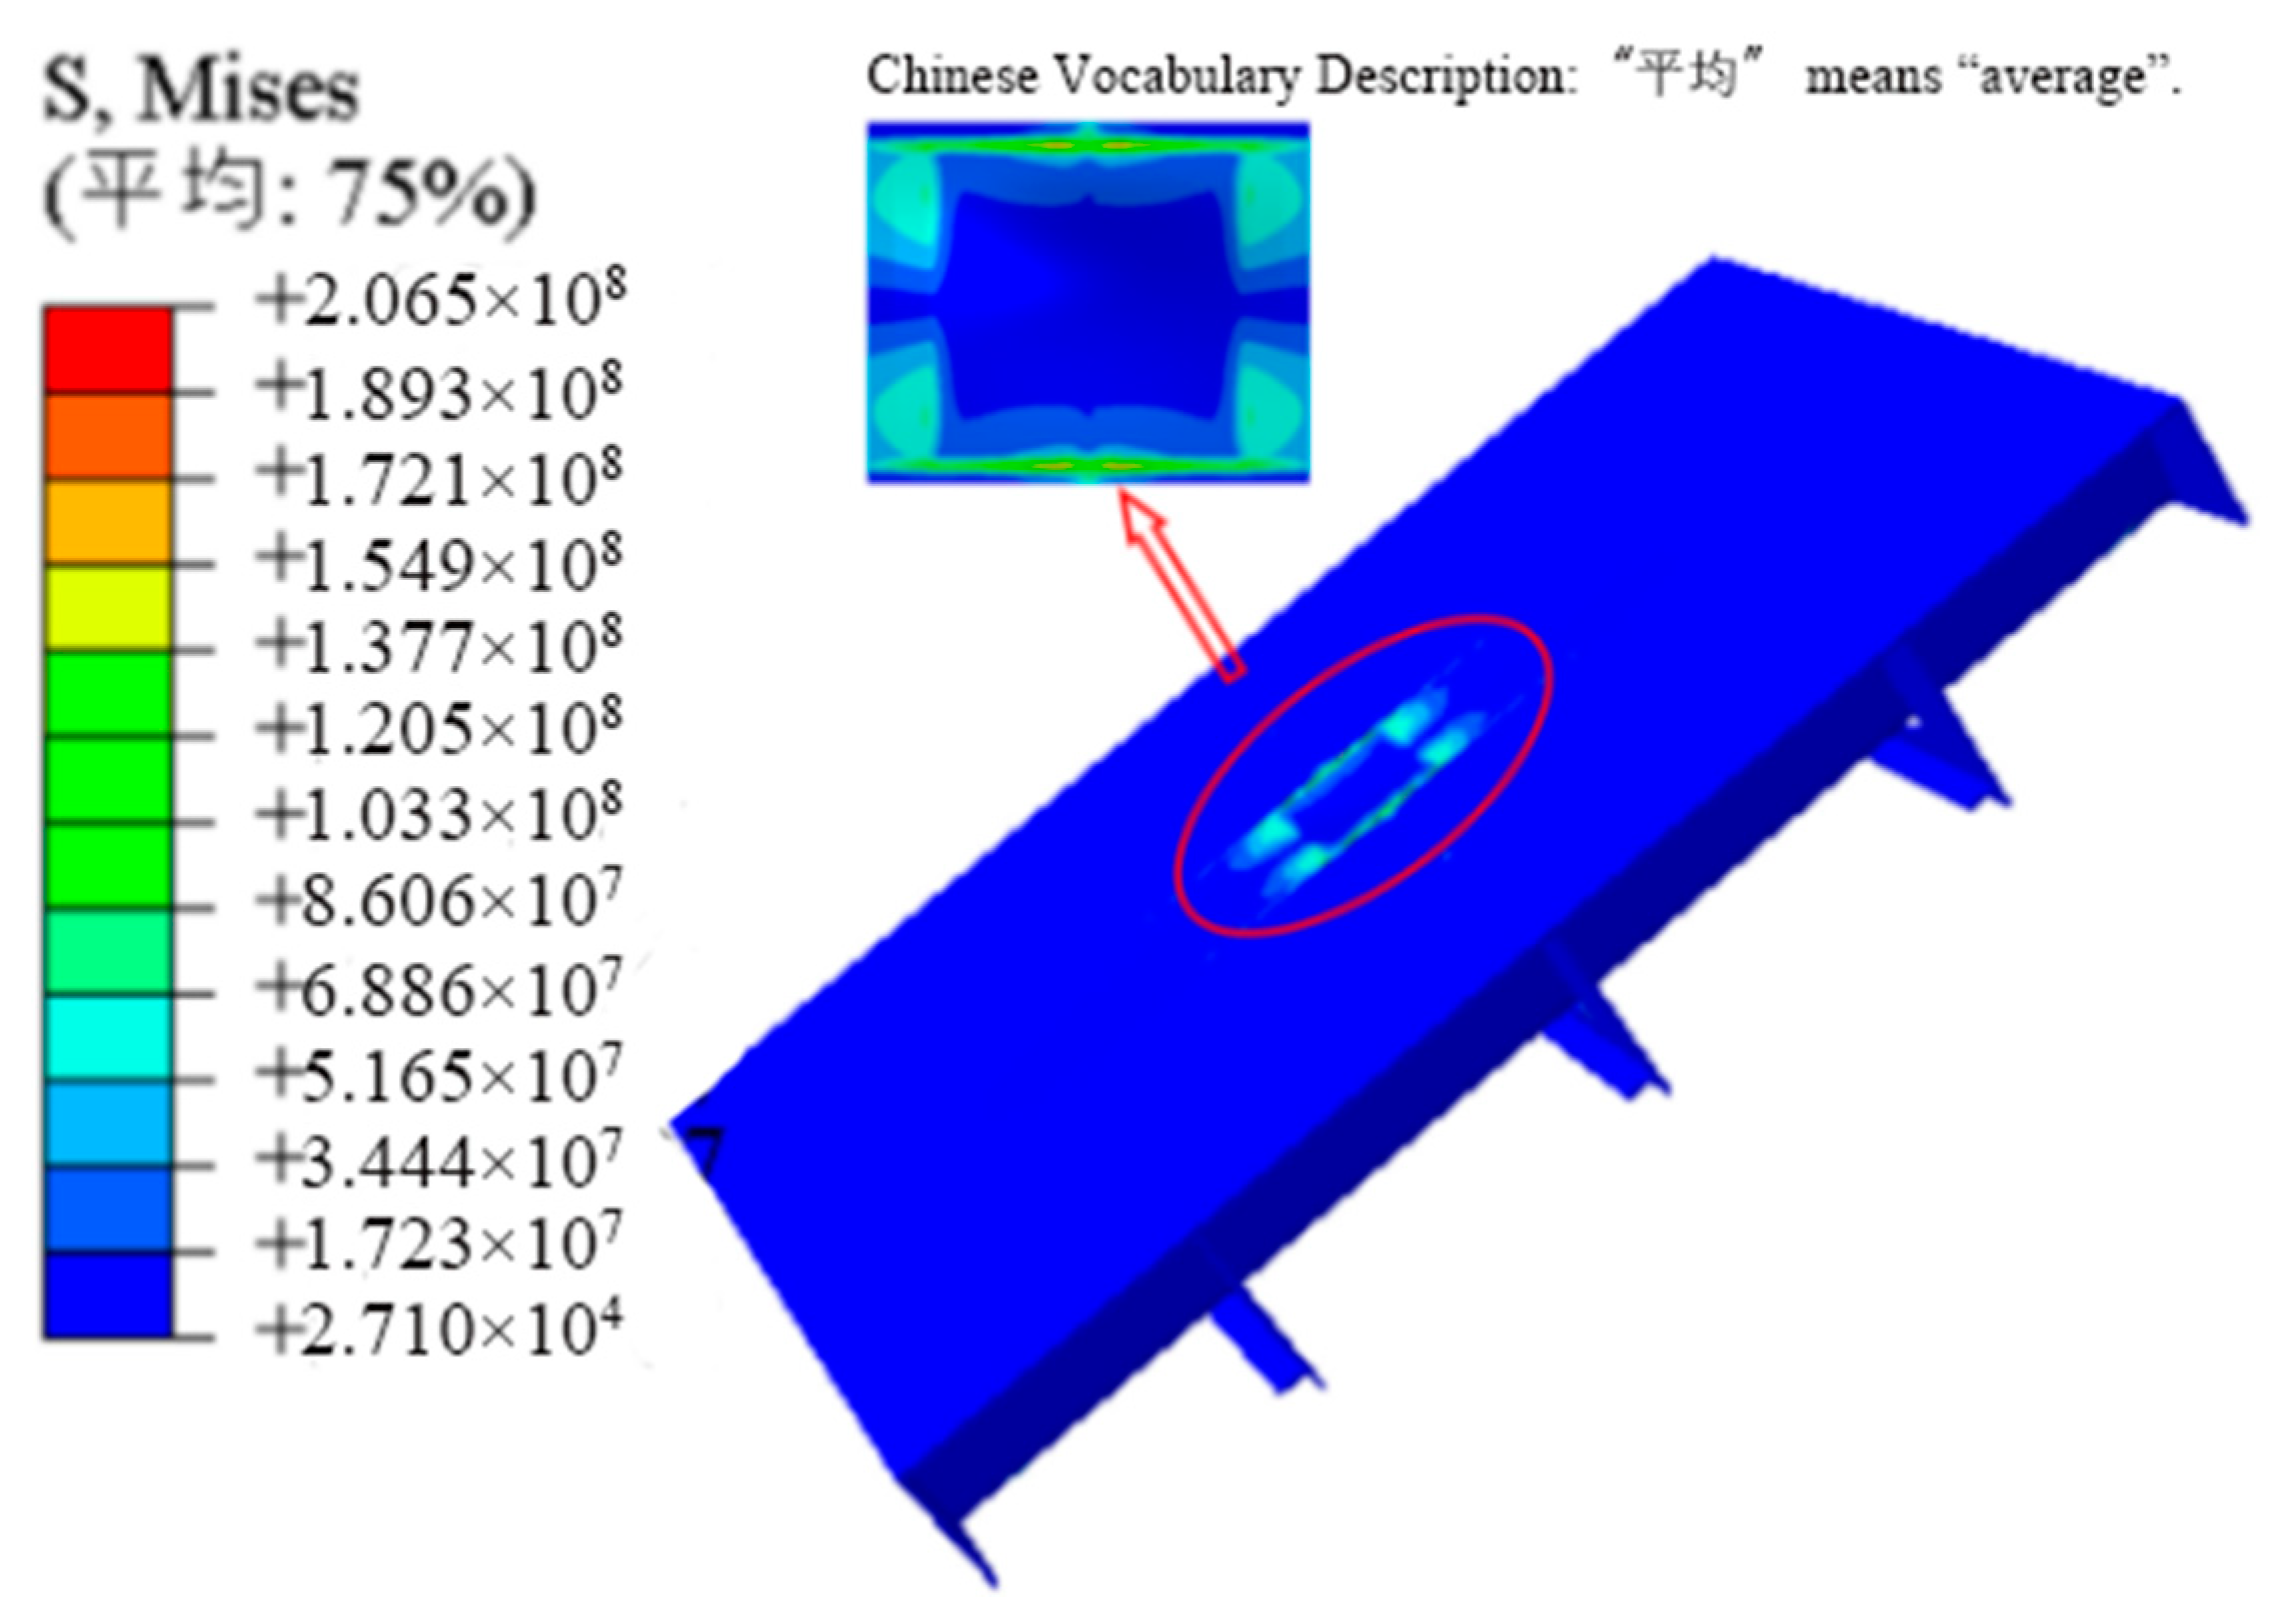
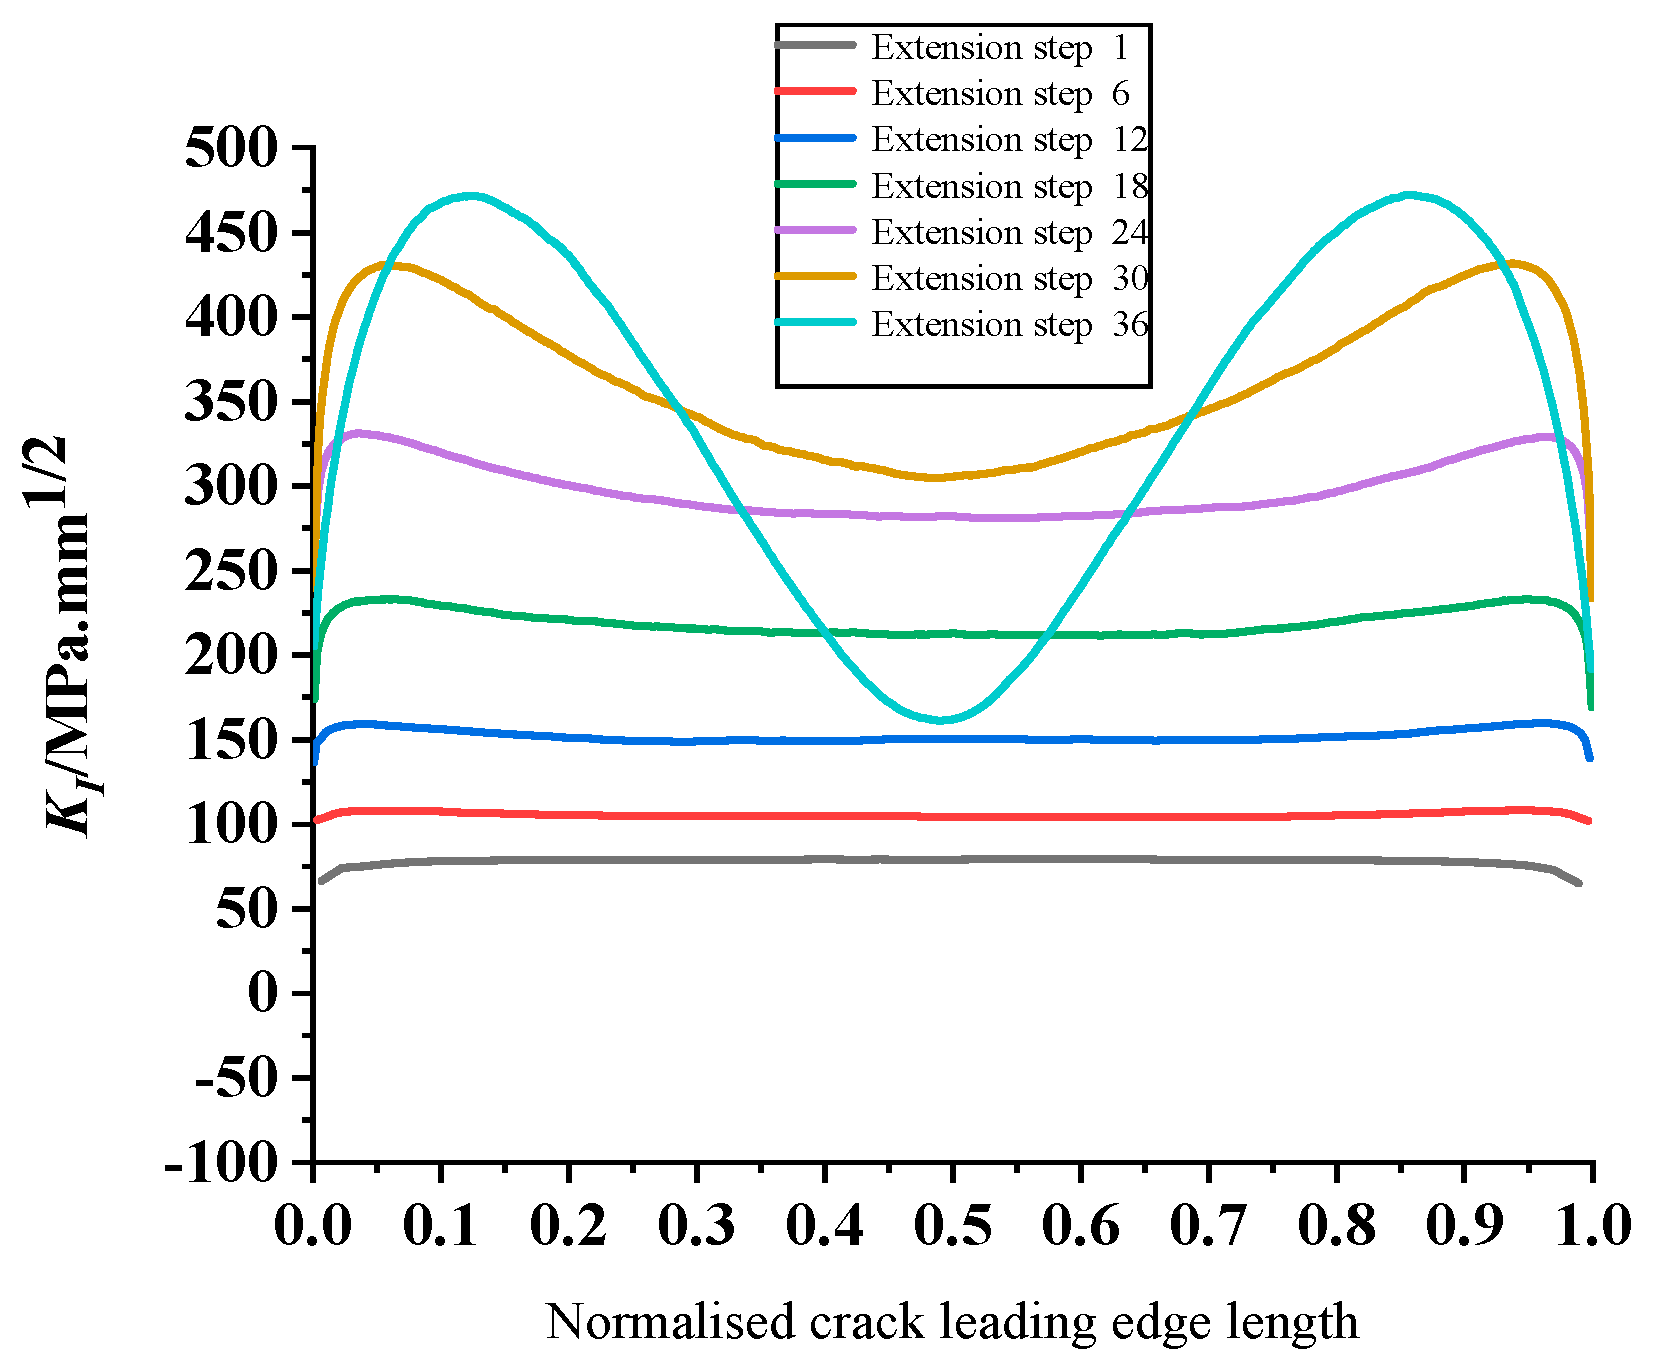
- The Mode I stress intensity factor of the initial crack is symmetrically distributed, and the value is large, reaching 77.67 MPa. The stress intensity factors of Type II and III fluctuate around 0 MPa·mm1/2, which belongs to the crack type dominated by the Mode I crack;
- (4)
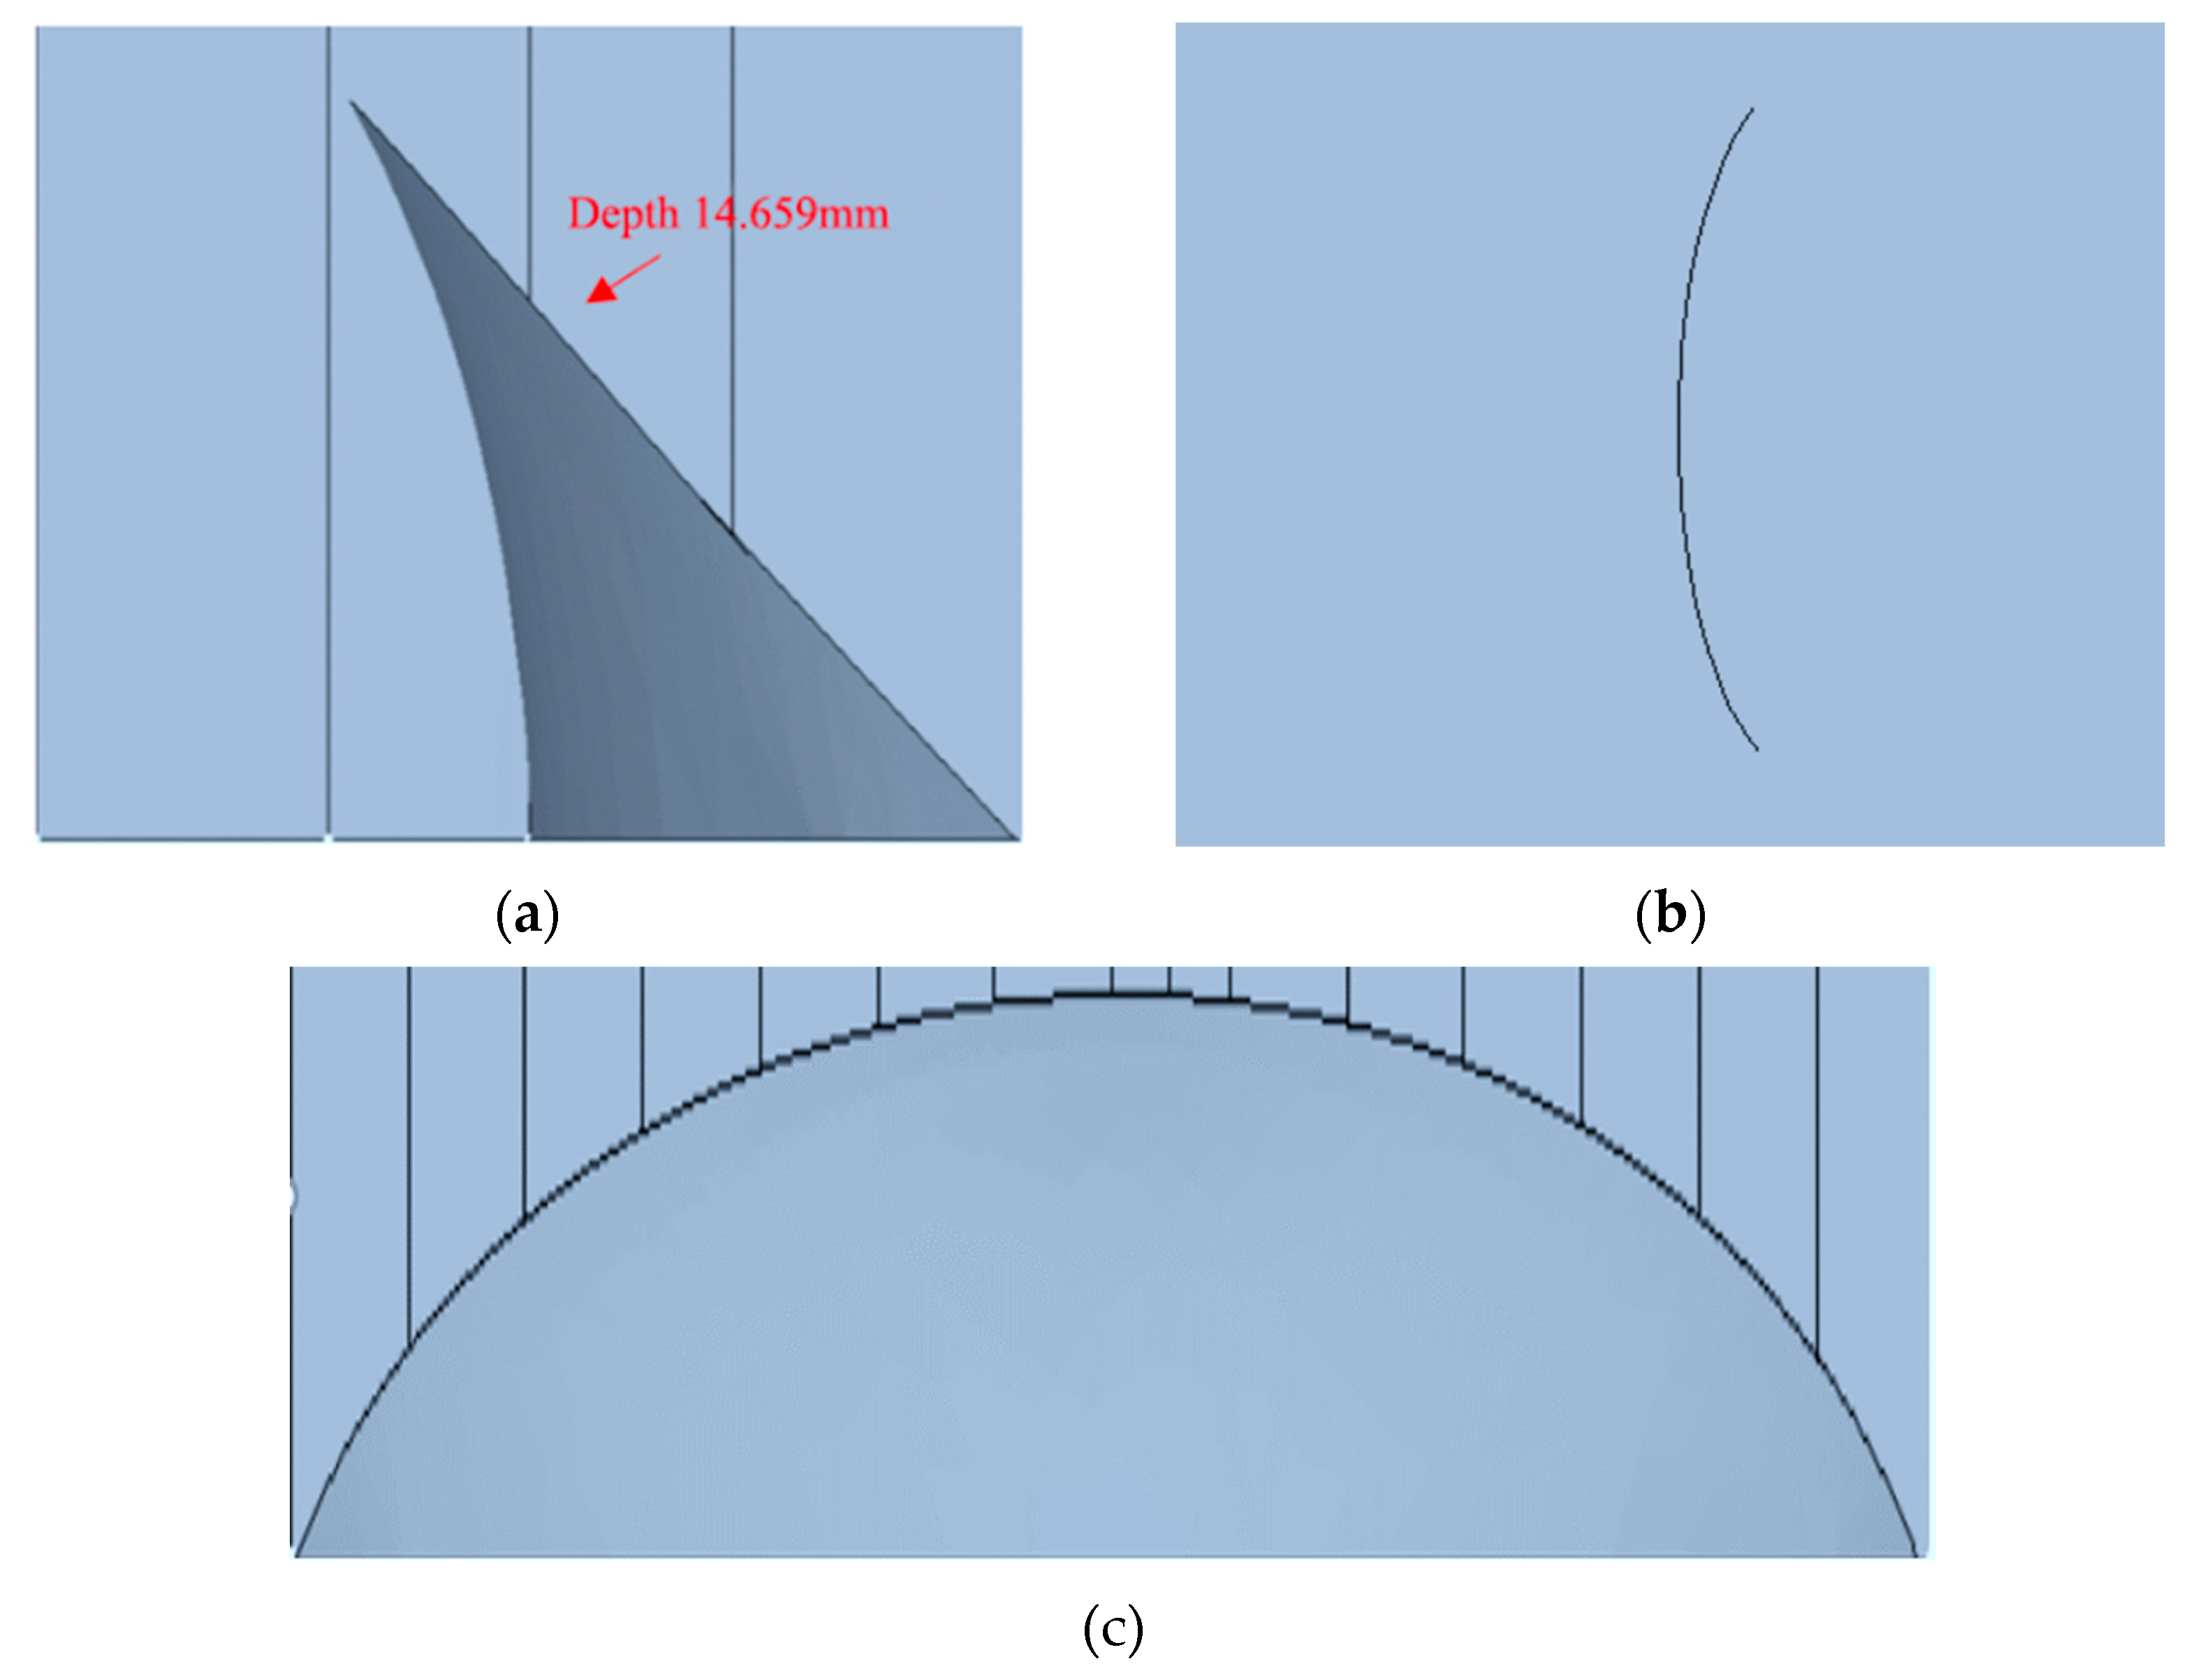
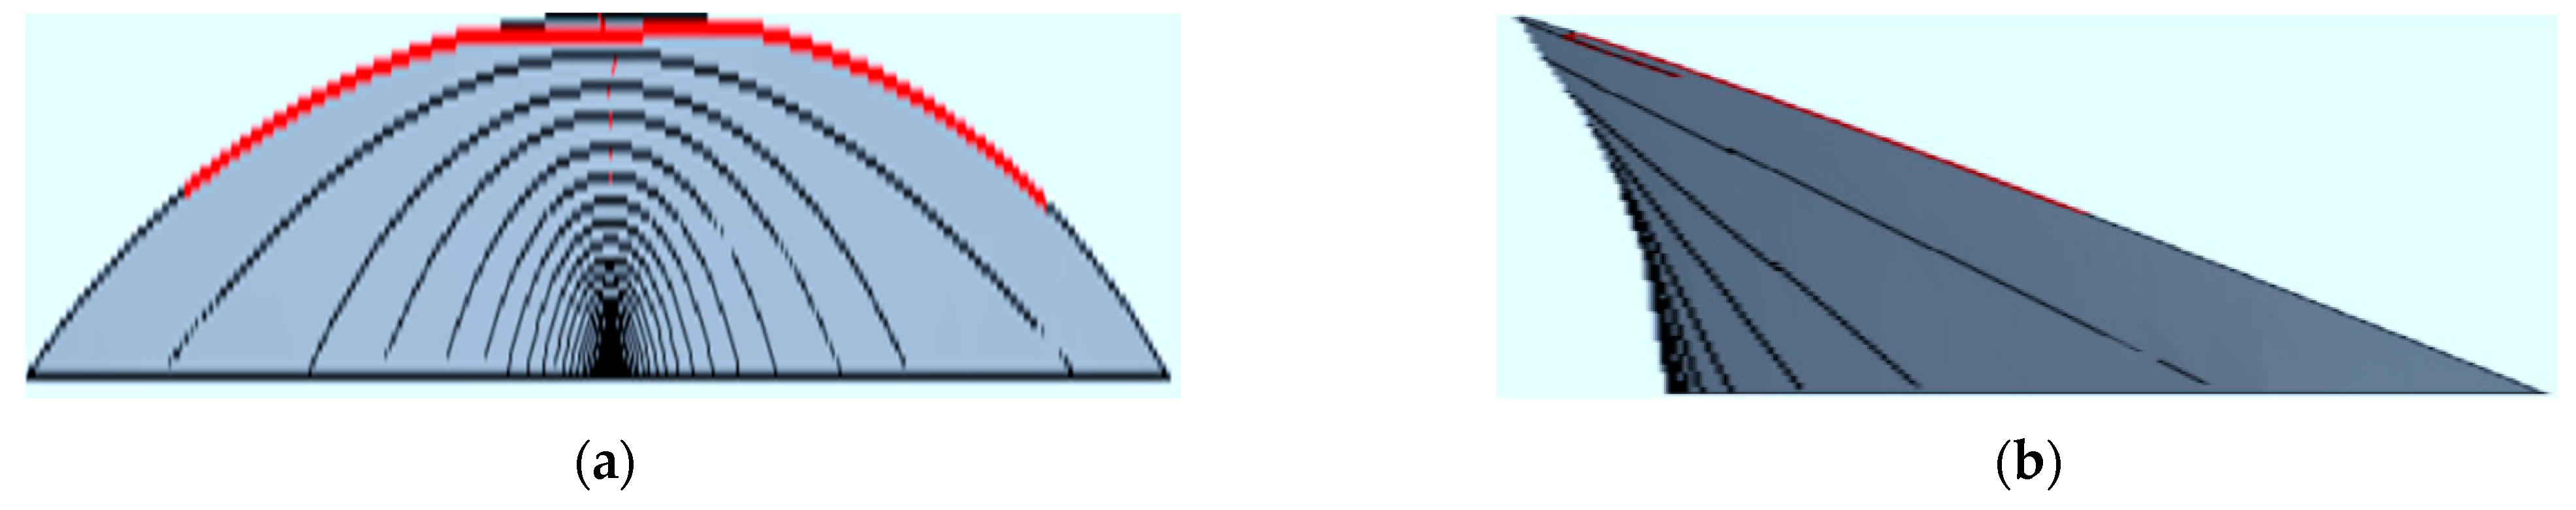
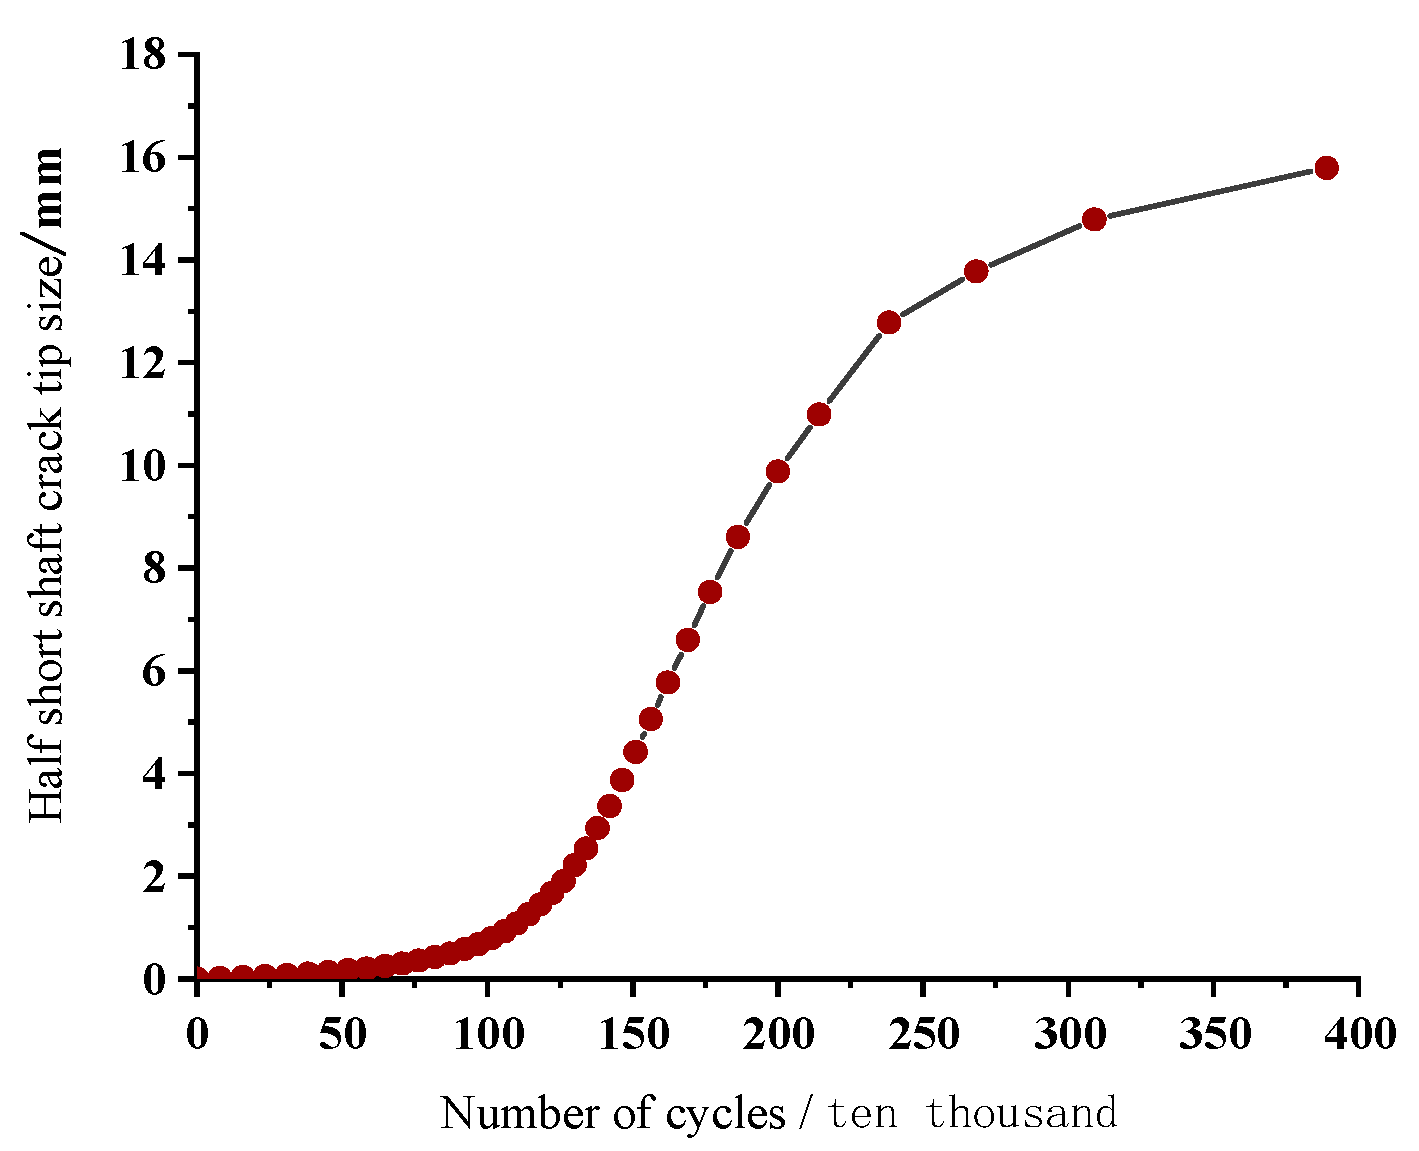
- With the expansion of the crack, the stress intensity factor at the middle point of the leading edge of the crack tends to increase and then decrease. When the size of the short semi-axis of the crack reaches 16 mm, the number of load cycles is nearly 3.9 million, while the number of fatigue cycle loads tested is 3.5 million, with a relative error of 11.4%, which is within an acceptable range.
- (5)
- The increases of U-rib thickness and roof thickness have the positive effect of prolonging the fatigue life of OSD. The influence of roof thickness is particularly significant. When the roof thickness increases from 10 mm to 18 mm, the amplitude of the stress intensity factor decreases by about 70%, which is more helpful in increasing the fatigue life.
Author Contributions
Funding
Institutional Review Board Statement
Informed Consent Statement
Data Availability Statement
Acknowledgments
Conflicts of Interest
References
- Wu, Z.; Jing, S.; Liu, J. Determination of Fatigue Load for Light Rail Support of Caiyuanba Yangtze Bridge in Chongqing. Adv. Mater. Res. 2012, 1615, 780–785. [Google Scholar] [CrossRef]
- Bai, G.; Tang, G. Fatigue tests of Overlapping Details for Orthotropic Steel Bridge Decks and Transverse Beams of Stay Cables. Adv. Mater. Res. 2012, 1615, 3202–3206. [Google Scholar] [CrossRef]
- Baietto, M.C.; Pierres, E.; Gravouil, A.; Berthel, B.; Fouvry, S.; Trolle, B. Fretting fatigue crack growth simulation based on a combined experimental and XFEM strategy. Int. J. Fatigue 2013, 47, 31–43. [Google Scholar] [CrossRef]
- Kainuma, S.; Yang, M.; Jeong, Y.-S.; Inokuchi, S.; Kawabata, A.; Uchida, D. Experiment on fatigue behavior of rib-to-deck weld root in orthotropic steel decks. J. Constr. Steel Res. 2016, 119, 113–122. [Google Scholar] [CrossRef]
- Zeng, Y.; Qu, Y.; Tan, Y.; Jiang, Y.; Gu, A. Analysis of fatigue cracking of orthotropic steel decks using XFEM. Eng. Fail. Anal. 2022, 140, 106536. [Google Scholar] [CrossRef]
- Shao, X.; Yi, D.; Huang, Z.; Zhao, H.; Chen, B.; Liu, M. Basic Performance of the Composite Deck System Composed of Orthotropic Steel Deck and Ultrathin RPC Layer. J. Bridge Eng. 2013, 18, 417–428. [Google Scholar] [CrossRef]
- Nur, Y.; Pedro, A. Crack Growth Rates of Structural Steel in Air and Aqueous Environments. Eng. Fract. Mech. 1989, 32, 997–1007. [Google Scholar]
- Yuichi, S.; Masahirro, S.; Chihiro, S.; Hideyuki, K.; Koichi, O. Proposal and Verification of Countermeasures against Fatigue Cracking from Weld Joints between Trough Ribs and Cross Ribs in Orthotropic Steel Decks. Procedia Struct. Integr. 2022, 38, 588–595. [Google Scholar]
- Takahide, H.; Shiro, S.; Masahiro, S. Fatigue durability of large-sized trough rib ortho-tropic steel deck for deck crack. ce/Papers 2021, 4, 1168–1171. [Google Scholar]
- Damien, C.; Grégory, G.; Ziad, H.; Alain, S.; Sébastien, F. Illzach Bridge: Innovative Repair of Orthotropic Deck Using Ultra-High-Performance Fibre-Reinforced Concrete—Return After 5 Years. Struct. Eng. Int. 2020, 30, 387–392. [Google Scholar]
- Cui, X.; Bao, P.; Li, T.; Qi, W. Research on the failure mechanism of elastic strip fracture in corrugated sections of metros. Eng. Fail. Anal. 2023, 143, 106837. [Google Scholar] [CrossRef]
- Kasprzak, A.; Berger, A. Strengthening and Widening of Steel Single Box Girder Bridge in Warsaw. Struct. Eng. Int. 2019, 29, 533–536. [Google Scholar] [CrossRef]
- Cătălin, M.; Claudia, P.; Mircea, S. Effect of Design Parameters on Shear Lag in Orthotropic Deck of Steel Road Bridges. Bull. Polytech. Inst. Iași Construct. Archit. Sect. 2021, 67, 95–104. [Google Scholar]
- Zeng, Y.; Li, X.; Zeng, Y. Investigation on Seismic Response of Long-Span Special Steel Truss Cable-Stayed Bridge. Adv. Civ. Eng. 2022, 2022, 2262289. [Google Scholar] [CrossRef]
- Jiang, F.; Ji, B.; Fu, Z.; Yao, Y. Effect of Weld Profiles on Fatigue Performance of Deck to U-Rib Weld in Orthotropic Steel Deck. Iran. J. Sci. Technol. Trans. Civ. Eng. 2021, 46, 1–15. [Google Scholar] [CrossRef]
- Chuang, C.; Lin, X.Y.; Hua, Z.Q.; Yang, W.F. Vehicle-induced dynamic stress analysis of orthotropic steel decks of cable-stayed bridges. Struct. Infrastruct. Eng. 2020, 16, 1067–1081. [Google Scholar]
- Nouman, I.; Heng, F.; Ahsan, N.; Muhammad, K.; Hans, D.B. A Numerical Evaluation of Structural Hot-Spot Stress Methods in Rib-To-Deck Joint of Orthotropic Steel Deck. Appl. Sci. 2020, 10, 6924. [Google Scholar]
- De Backer, H.; Outtier, A.; Nagy, W.; Schotte, K. Innovative fatigue design of orthotropic steel decks. Bridge Struct. 2017, 13, 69–80. [Google Scholar] [CrossRef] [Green Version]
- Heng, F.; Nouman, I.; Gilles, V.S.; Hans, D.B. Experimental and Numerical Investigation of Stress Concentration at Rib-to-Crossbeam Joint. Int. J. Steel Struct. 2021, 21, 360–380. [Google Scholar]
- Maggenti, R.; Shatnawi, S. Initial and replacement riding surface for the orthotropic San Mateo/Hayward Bridge. Bridge Struct. 2017, 13, 81–92. [Google Scholar] [CrossRef] [Green Version]
- Zeng, Y.; Li, Y.; Yu, T.; Wei, J. Analysis of Mechanical Performance of Steel-Concrete Composite Girder Bridge with V-Shaped Piers. Adv. Civ. Eng. 2022, 2022, 6489140. [Google Scholar] [CrossRef]
- Yu, Q.; Yong, Z.; Anbang, G.; Baisong, D. XFEM and its application in fatigue crack growth of orthotropic steel deck. J. Chongqing Jiaotong Univ. 2018, 37, 21–27. [Google Scholar]
- Gu, P.; Lu, F.; Tang, L.; Li, J. Study on fatigue performance of orthotropic steel deck beams. Struct. Eng. 2022, 38, 99–105. [Google Scholar]
- Novoselic, T.; Klähne, D.-I.T.; Dipl, I.T.; Schönburg, D.; Dipl, U.H. Neubau einer ÖPNV-Brücke für Straßenbahn, Radfahrer und Fußgänger zum Kienlesberg in Ulm. Stahlbau 2017, 86, 123–138. [Google Scholar] [CrossRef]
- Heng, J.; Zheng, K.; Kaewunruen, S.; Zhu, J.; Baniotopoulos, C. Probabilistic fatigue assessment of rib-to-deck jointsusing thickened edge U-ribs. Steel Compos. Struct. 2020, 35, 799–813. [Google Scholar]
- Zeng, Y.; Li, X.; Jiang, D.; Ran, J. Study on the Effects of Innovative Curing Combinations on the Early Temperature Field of Concrete Box Girders. Buildings 2022, 12, 1808. [Google Scholar] [CrossRef]
- Ju, X.; Tateishi, K. Fatigue Crack Behavior at Rib-To-Deck Weld Bead in Orthotropic Steel Deck. Adv. Struct. Eng. 2014, 17, 1459–1468. [Google Scholar] [CrossRef]
- Ya, S.; Yamada, K.; Ishikawa, T. Fatigue Evaluation of Rib-to-Deck Welded Joints of Orthotropic Steel Bridge Deck. J. Bridge Eng. 2011, 16, 492–499. [Google Scholar] [CrossRef]
- Liu, Y.; Chen, C.; Li, G. Fatigue Crack Growth and Control of 14MnNbq Welding Plates Used for Bridges. J. Eng. Mech. 2012, 138, 30–35. [Google Scholar] [CrossRef]
- Yang, J.; Chen, R.; Zhang, Z.; Zou, Y.; Zhou, J.; Xia, J. Experimental study on the ultimate bearing capacity of damaged RC arches strengthened with ultra-high performance concrete. Eng. Struct. 2023, 279, 115611. [Google Scholar] [CrossRef]
- Abdulnaser, M.A. Fatigue crack growth analysis under constant amplitude loading using finite element method. Materials 2022, 15, 2937. [Google Scholar]
- Zeng, Y.; Zheng, H.; Jiang, Y.; Ran, J.; He, X. Modal Analysis of a Steel Truss Girder Cable-Stayed Bridge with Single Tower and Single Cable Plane. Appl. Sci. 2022, 12, 7627. [Google Scholar] [CrossRef]
- Claudiu, G. The effects of fatigue cracks on fastener loads during cyclic loading and on the stresses used for crack growth analysis in classical linear elastic fracture mechanics approaches. Mater. Sci. Appl. 2020, 11, 505–551. [Google Scholar]
- Shahani, A.R.; Babaei, M. The crack propagation path for a system of surface and subsurface cracks and their interactions due to rolling contact fatigue. Acta Mech. 2020, 231, 1751–1764. [Google Scholar] [CrossRef]
- Andersson, R.; Kabo, E.; Ekberg, A. Numerical assessment of the loading of rolling contact fatigue cracks close to rail surface irregularities. Fatigue Fract. Eng. Mater. Struct. 2020, 43, 947–954. [Google Scholar] [CrossRef]
- Huang, B.; Hou, J.; Yang, Z.; Zhou, J.; Ren, Q.; Zhu, B. Influences of the pile-restrained floating breakwater on extreme wave forces of coastal bridge with box-girder superstructure under the action of two-dimensional focused waves. Appl. Ocean. Res. 2023, 134, 103508. [Google Scholar] [CrossRef]
- Zeng, Y.; He, H.; Qu, Y.; Sun, X.; Tan, H.; Zhou, J. Numerical Simulation of Fatigue Cracking of Diaphragm Notch in Orthotropic Steel Deck Model. Materials 2023, 16, 467. [Google Scholar] [CrossRef] [PubMed]
- Zeng, Y.; He, X.; Li, Y.; Zhou, J. Assessment of Modal Characteristics of Steel–Concrete Composite Girder Bridge with V-Shaped Piers. Appl. Sci. 2023, 13, 3421. [Google Scholar] [CrossRef]
- Tan, H.; Qian, D.; Xu, Y.; Yuan, M.; Zhao, H. Analysis of Vertical Temperature Gradients and Their Effects on Hybrid Girder Cable-Stayed Bridges. Sustainability 2023, 15, 1053. [Google Scholar] [CrossRef]
- Zeng, Y.; Qiu, Z.; Yang, C.; Su, H.; Xiang, Z.; Zhou, J. Fatigue experimental study on full-scale large sectional model of orthotropic steel deck of urban rail bridge. Adv. Mech. Eng. 2023, 15, 1–15. [Google Scholar] [CrossRef]
- Zhang, H.; Li, H.; Zhou, J.; Tong, K.; Xia, R. A multi-dimensional evaluation of wire breakage in bridge cable based on self-magnetic flux leakage signals. J. Magn. Magn. Mater. 2023, 566, 170321. [Google Scholar] [CrossRef]
- Xin, J.; Jiang, Y.; Zhou, J.; Peng, L.; Liu, S.; Tang, Q. Bridge deformation prediction based on SHM data using improved VMD and conditional KDE. Eng. Struct. 2022, 261, 114285. [Google Scholar] [CrossRef]
- Zeng, Y.; Zeng, Y.; Yu, H.; Tan, Y.; Tan, H.; Zheng, H. Dynamic Characteristics of a Double-Pylon Cable-Stayed Bridge with Steel Truss Girder and Single-Cable Plane. Adv. Civ. Eng. 2021, 2021, 9565730. [Google Scholar] [CrossRef]
- Li, S.; Xin, J.; Jiang, Y.; Wang, C.; Zhou, J.; Yang, X. Temperature-induced deflection separation based on bridge deflection data using the TVFEMD-PE-KLD method. J. Civil Struct. Health Monit. 2023. [Google Scholar] [CrossRef]


| Location | Measurement Points | Measured Values/MPa | Calculated Values/MPa |
|---|---|---|---|
| Roof plates | P2 | 56.6 | 55.5 |
| P3 | 156.6 | 160.1 | |
| P4 | 112.7 | 113.3 | |
| U-ribs | U2 | 53.4 | 55.0 |
| U3 | 64.7 | 63.9 | |
| U4 | 36.6 | 35.2 | |
| Side dividers 1 | BHGB1-6 | 9.3 | 9.6 |
| BHGB1-8 | 12.4 | 11.9 | |
| BHGB1-10 | 14.2 | 14.5 | |
| BHGB1-12 | 11.5 | 12.6 | |
| BHGB1-14 | 6.3 | 6.8 | |
| Mid-transom bulkhead | ZHGB1-7 | 29.0 | 29.3 |
| ZHGB1-9 | 39.8 | 40.2 | |
| ZHGB 1-10 | 89.3 | 90.0 | |
| ZHGB 1-19 | 21.6 | 21.9 | |
| ZHGB 1-22 | 50.9 | 51.2 | |
| ZHGB 1-31 | 19.3 | 18.7 | |
| ZHGB 1-33 | 29.1 | 30.3 | |
| ZHGB1-35 | 11.1 | 10.9 |
| Extension Steps | Current Size/mm | Extended Step Size/mm | Extension Steps | Current Size/mm | Extended Step Size/mm |
|---|---|---|---|---|---|
| 0 | 0.100 | 0.015 | 19 | 1.424 | 0.213 |
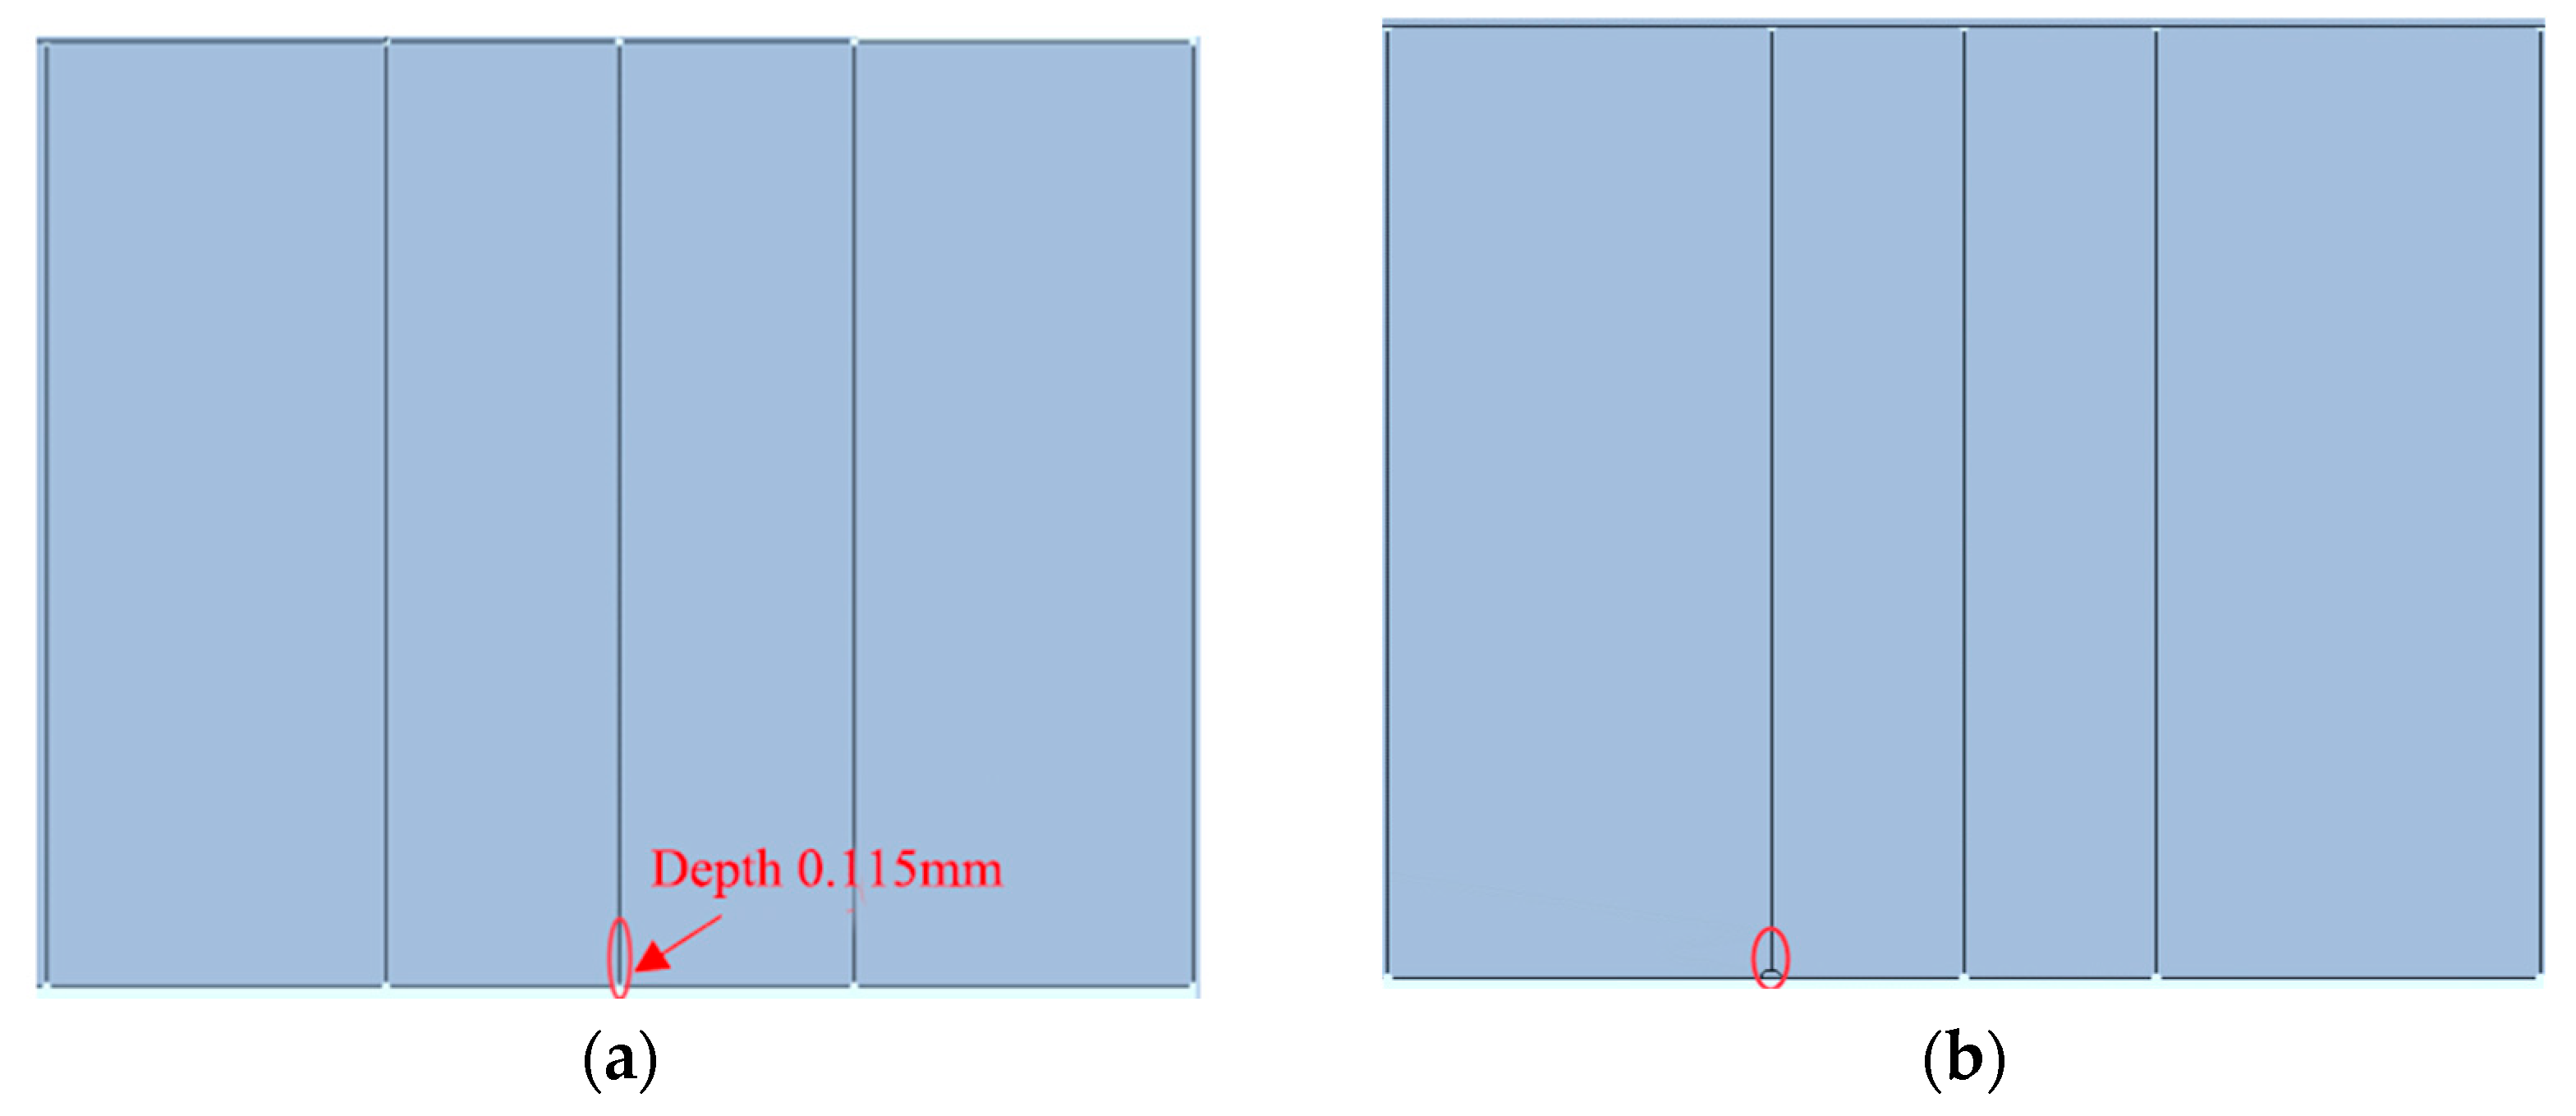
| 1 | 0.115 | 0.017 | 20 | 1.637 | 0.245 |
| 2 | 0.132 | 0.020 | 21 | 1.882 | 0.282 |
| 3 | 0.152 | 0.023 | 22 | 2.164 | 0.325 |
| 4 | 0.175 | 0.026 | 23 | 2.489 | 0.373 |
| 5 | 0.201 | 0.030 | 24 | 2.863 | 0.429 |
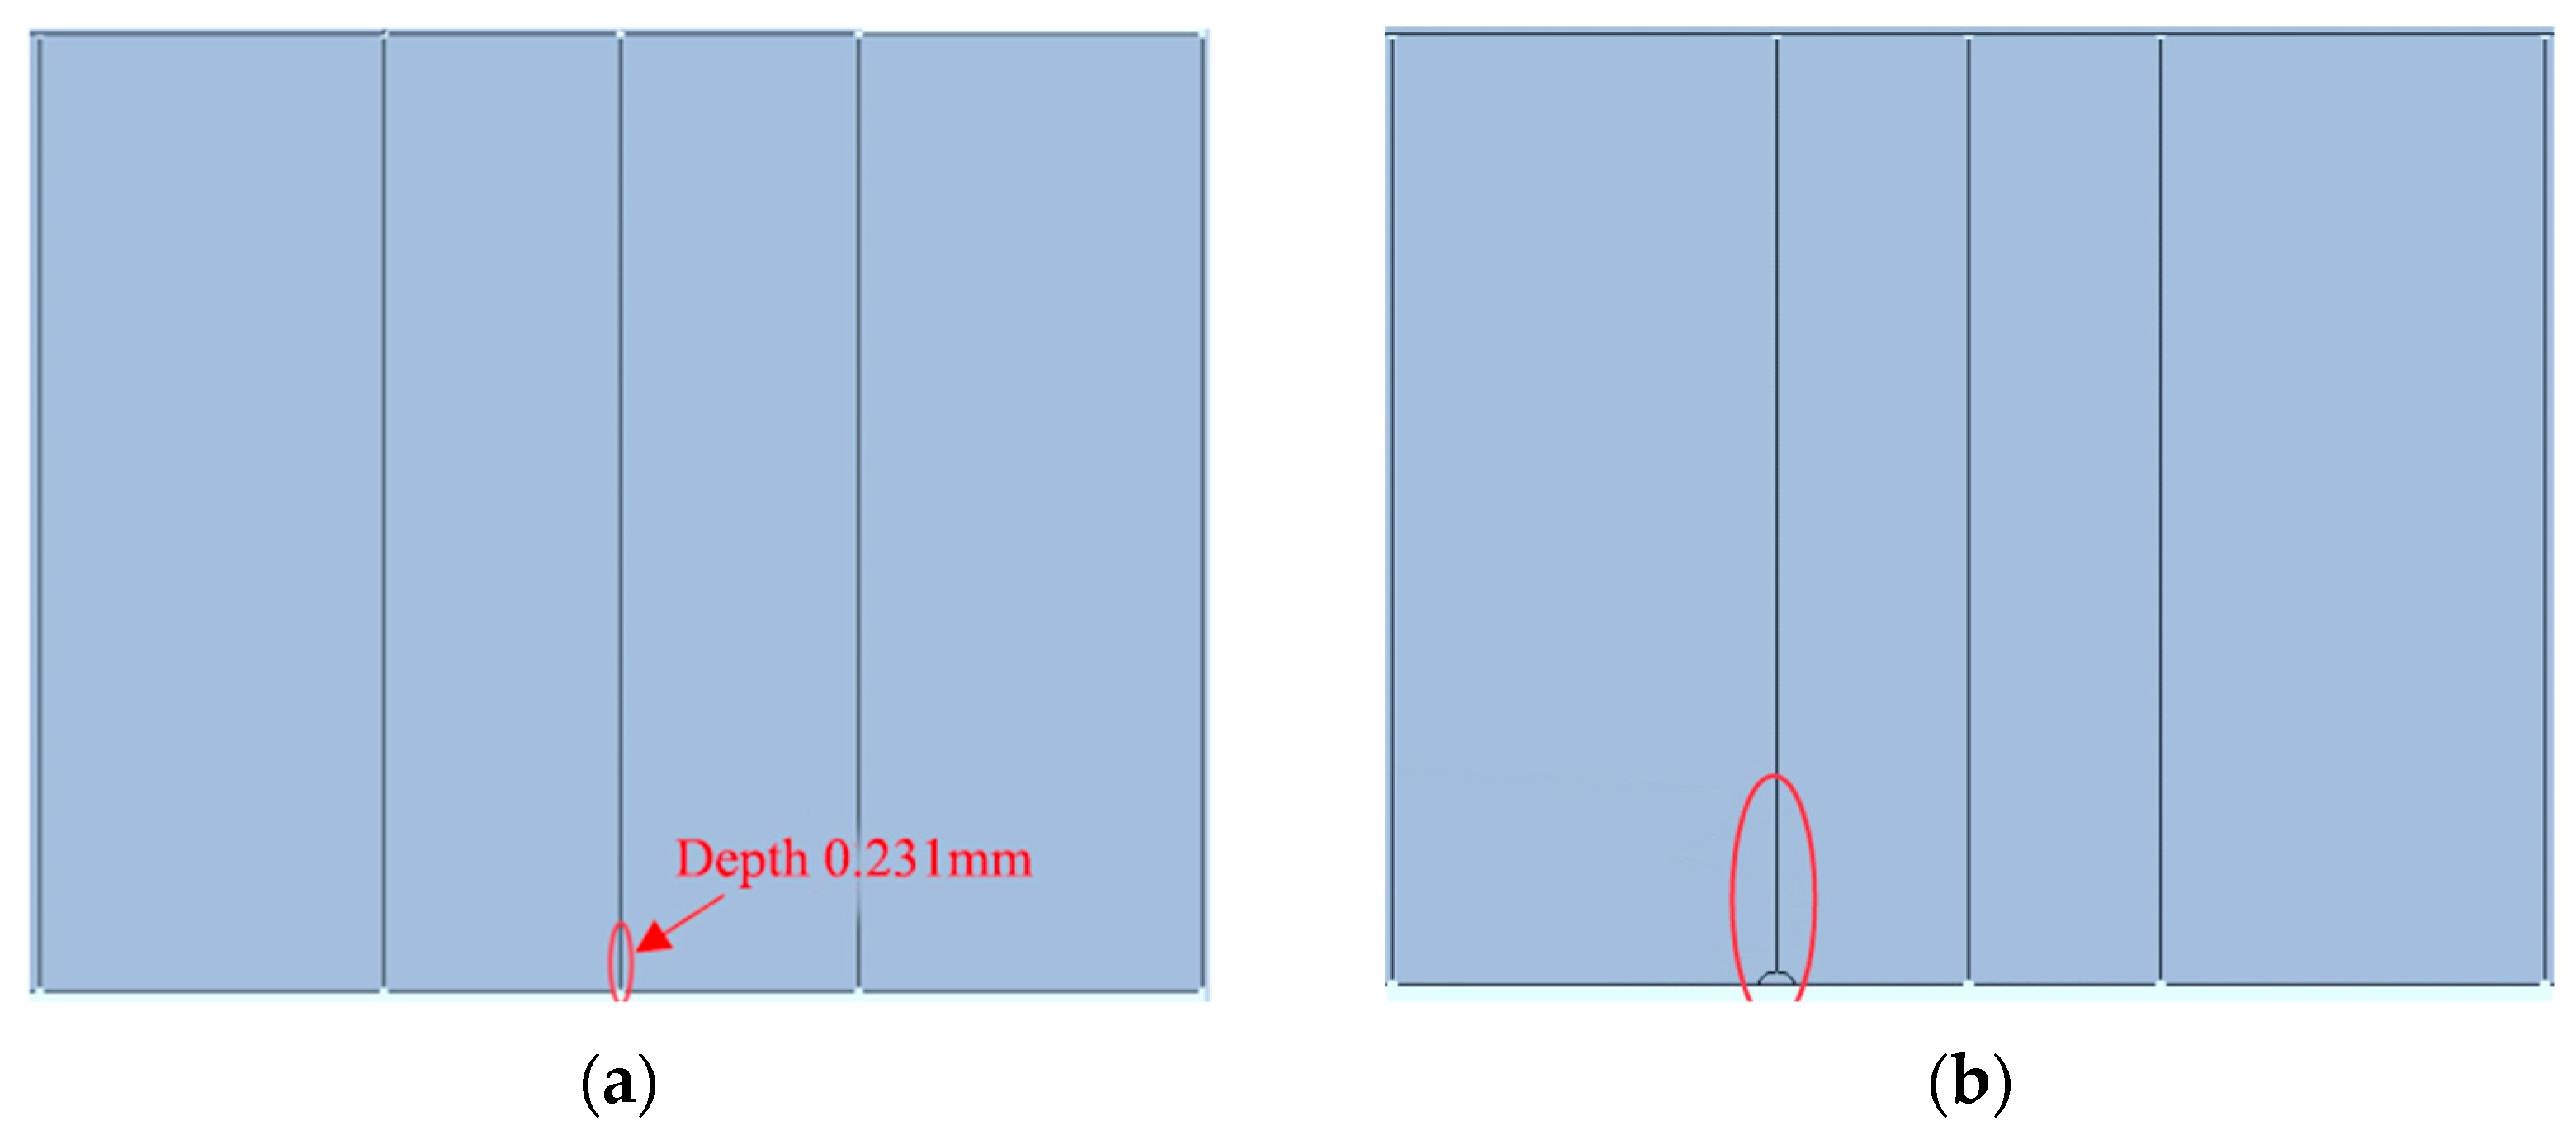
| 6 | 0.231 | 0.035 | 25 | 3.292 | 0.494 |
| 7 | 0.266 | 0.040 | 26 | 3.786 | 0.568 |
| 8 | 0.306 | 0.046 | 27 | 4.354 | 0.653 |
| 9 | 0.352 | 0.053 | 28 | 5.007 | 0.751 |
| 10 | 0.405 | 0.061 | 29 | 5.758 | 0.864 |
| 11 | 0.465 | 0.070 | 30 | 6.621 | 0.993 |
| 12 | 0.535 | 0.080 | 31 | 7.614 | 1.142 |
| 13 | 0.615 | 0.092 | 32 | 8.757 | 1.313 |
| 14 | 0.708 | 0.106 | 33 | 10.070 | 1.510 |
| 15 | 0.814 | 0.122 | 34 | 11.580 | 1.737 |
| 16 | 0.936 | 0.140 | 35 | 13.318 | 1.341 |
| 17 | 1.076 | 0.161 | 36 | 14.659 | 1.341 |
| 18 | 1.238 | 0.186 | 37 | 16.000 | / |
| N·mm−3/2 | 5.21 × 10⁻¹³ | 3 |
| MPa·m1/2 | 1.65 × 10⁻¹¹ | 3 |
Disclaimer/Publisher’s Note: The statements, opinions and data contained in all publications are solely those of the individual author(s) and contributor(s) and not of MDPI and/or the editor(s). MDPI and/or the editor(s) disclaim responsibility for any injury to people or property resulting from any ideas, methods, instructions or products referred to in the content. |
© 2023 by the authors. Licensee MDPI, Basel, Switzerland. This article is an open access article distributed under the terms and conditions of the Creative Commons Attribution (CC BY) license (https://creativecommons.org/licenses/by/4.0/).
Share and Cite
Zeng, Y.; Wang, S.; Xue, X.; Tan, H.; Zhou, J. Fatigue Life Evaluation of Orthotropic Steel Deck of Steel Bridges Using Experimental and Numerical Methods. Sustainability 2023, 15, 5945. https://doi.org/10.3390/su15075945
Zeng Y, Wang S, Xue X, Tan H, Zhou J. Fatigue Life Evaluation of Orthotropic Steel Deck of Steel Bridges Using Experimental and Numerical Methods. Sustainability. 2023; 15(7):5945. https://doi.org/10.3390/su15075945
Chicago/Turabian StyleZeng, Yong, Shenxu Wang, Xiaofang Xue, Hongmei Tan, and Jianting Zhou. 2023. "Fatigue Life Evaluation of Orthotropic Steel Deck of Steel Bridges Using Experimental and Numerical Methods" Sustainability 15, no. 7: 5945. https://doi.org/10.3390/su15075945