
Evaluation of Carbon Emission and Carbon Contribution Capacity Based on the Beijing–Tianjin–Hebei Region of China
Abstract
:1. Introduction
2. Research Methods
2.1. Literature Research
2.2. Carbon Emission Estimation Methods
2.3. Construction of the Carbon Contribution Capacity Index System
- (1)
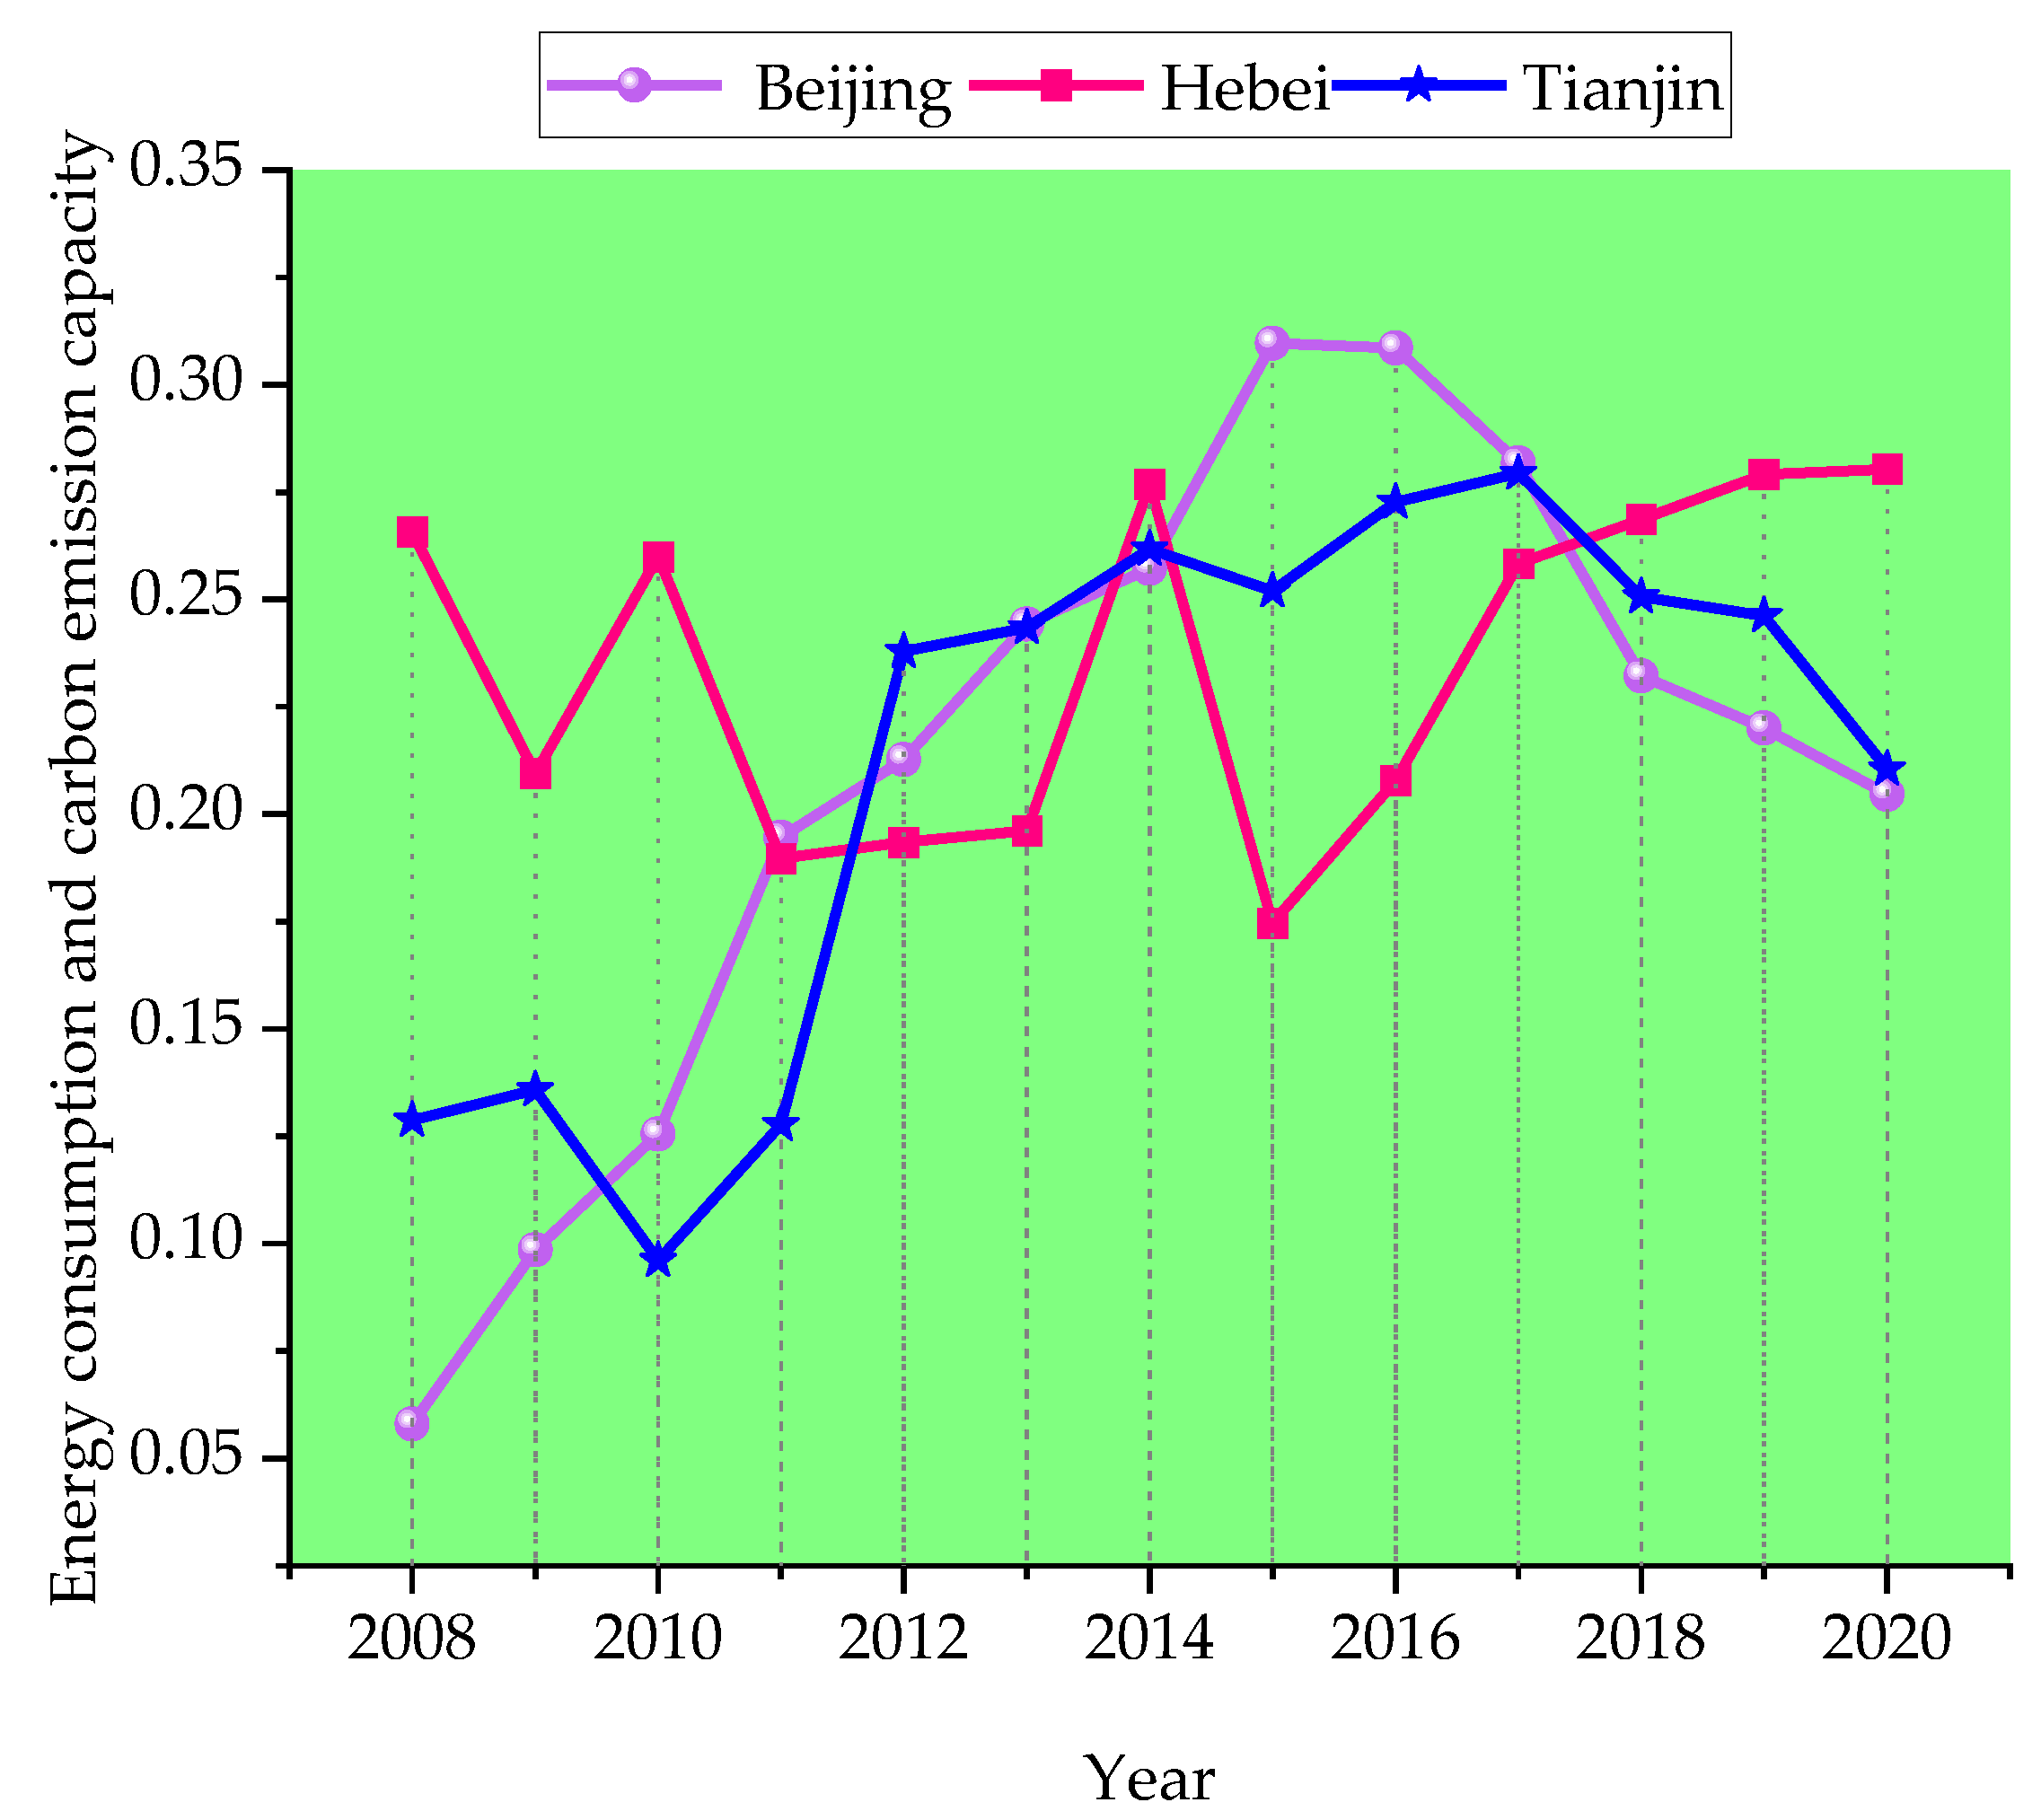
- Energy consumption and carbon emission capacity
- Energy intensity: energy consumption per unit GDP, used to explore the economic benefits brought by energy utilization.
- Carbon emission intensity: carbon dioxide emissions per unit GDP, mainly measures the relationship between the regional economic situation and carbon dioxide emissions.
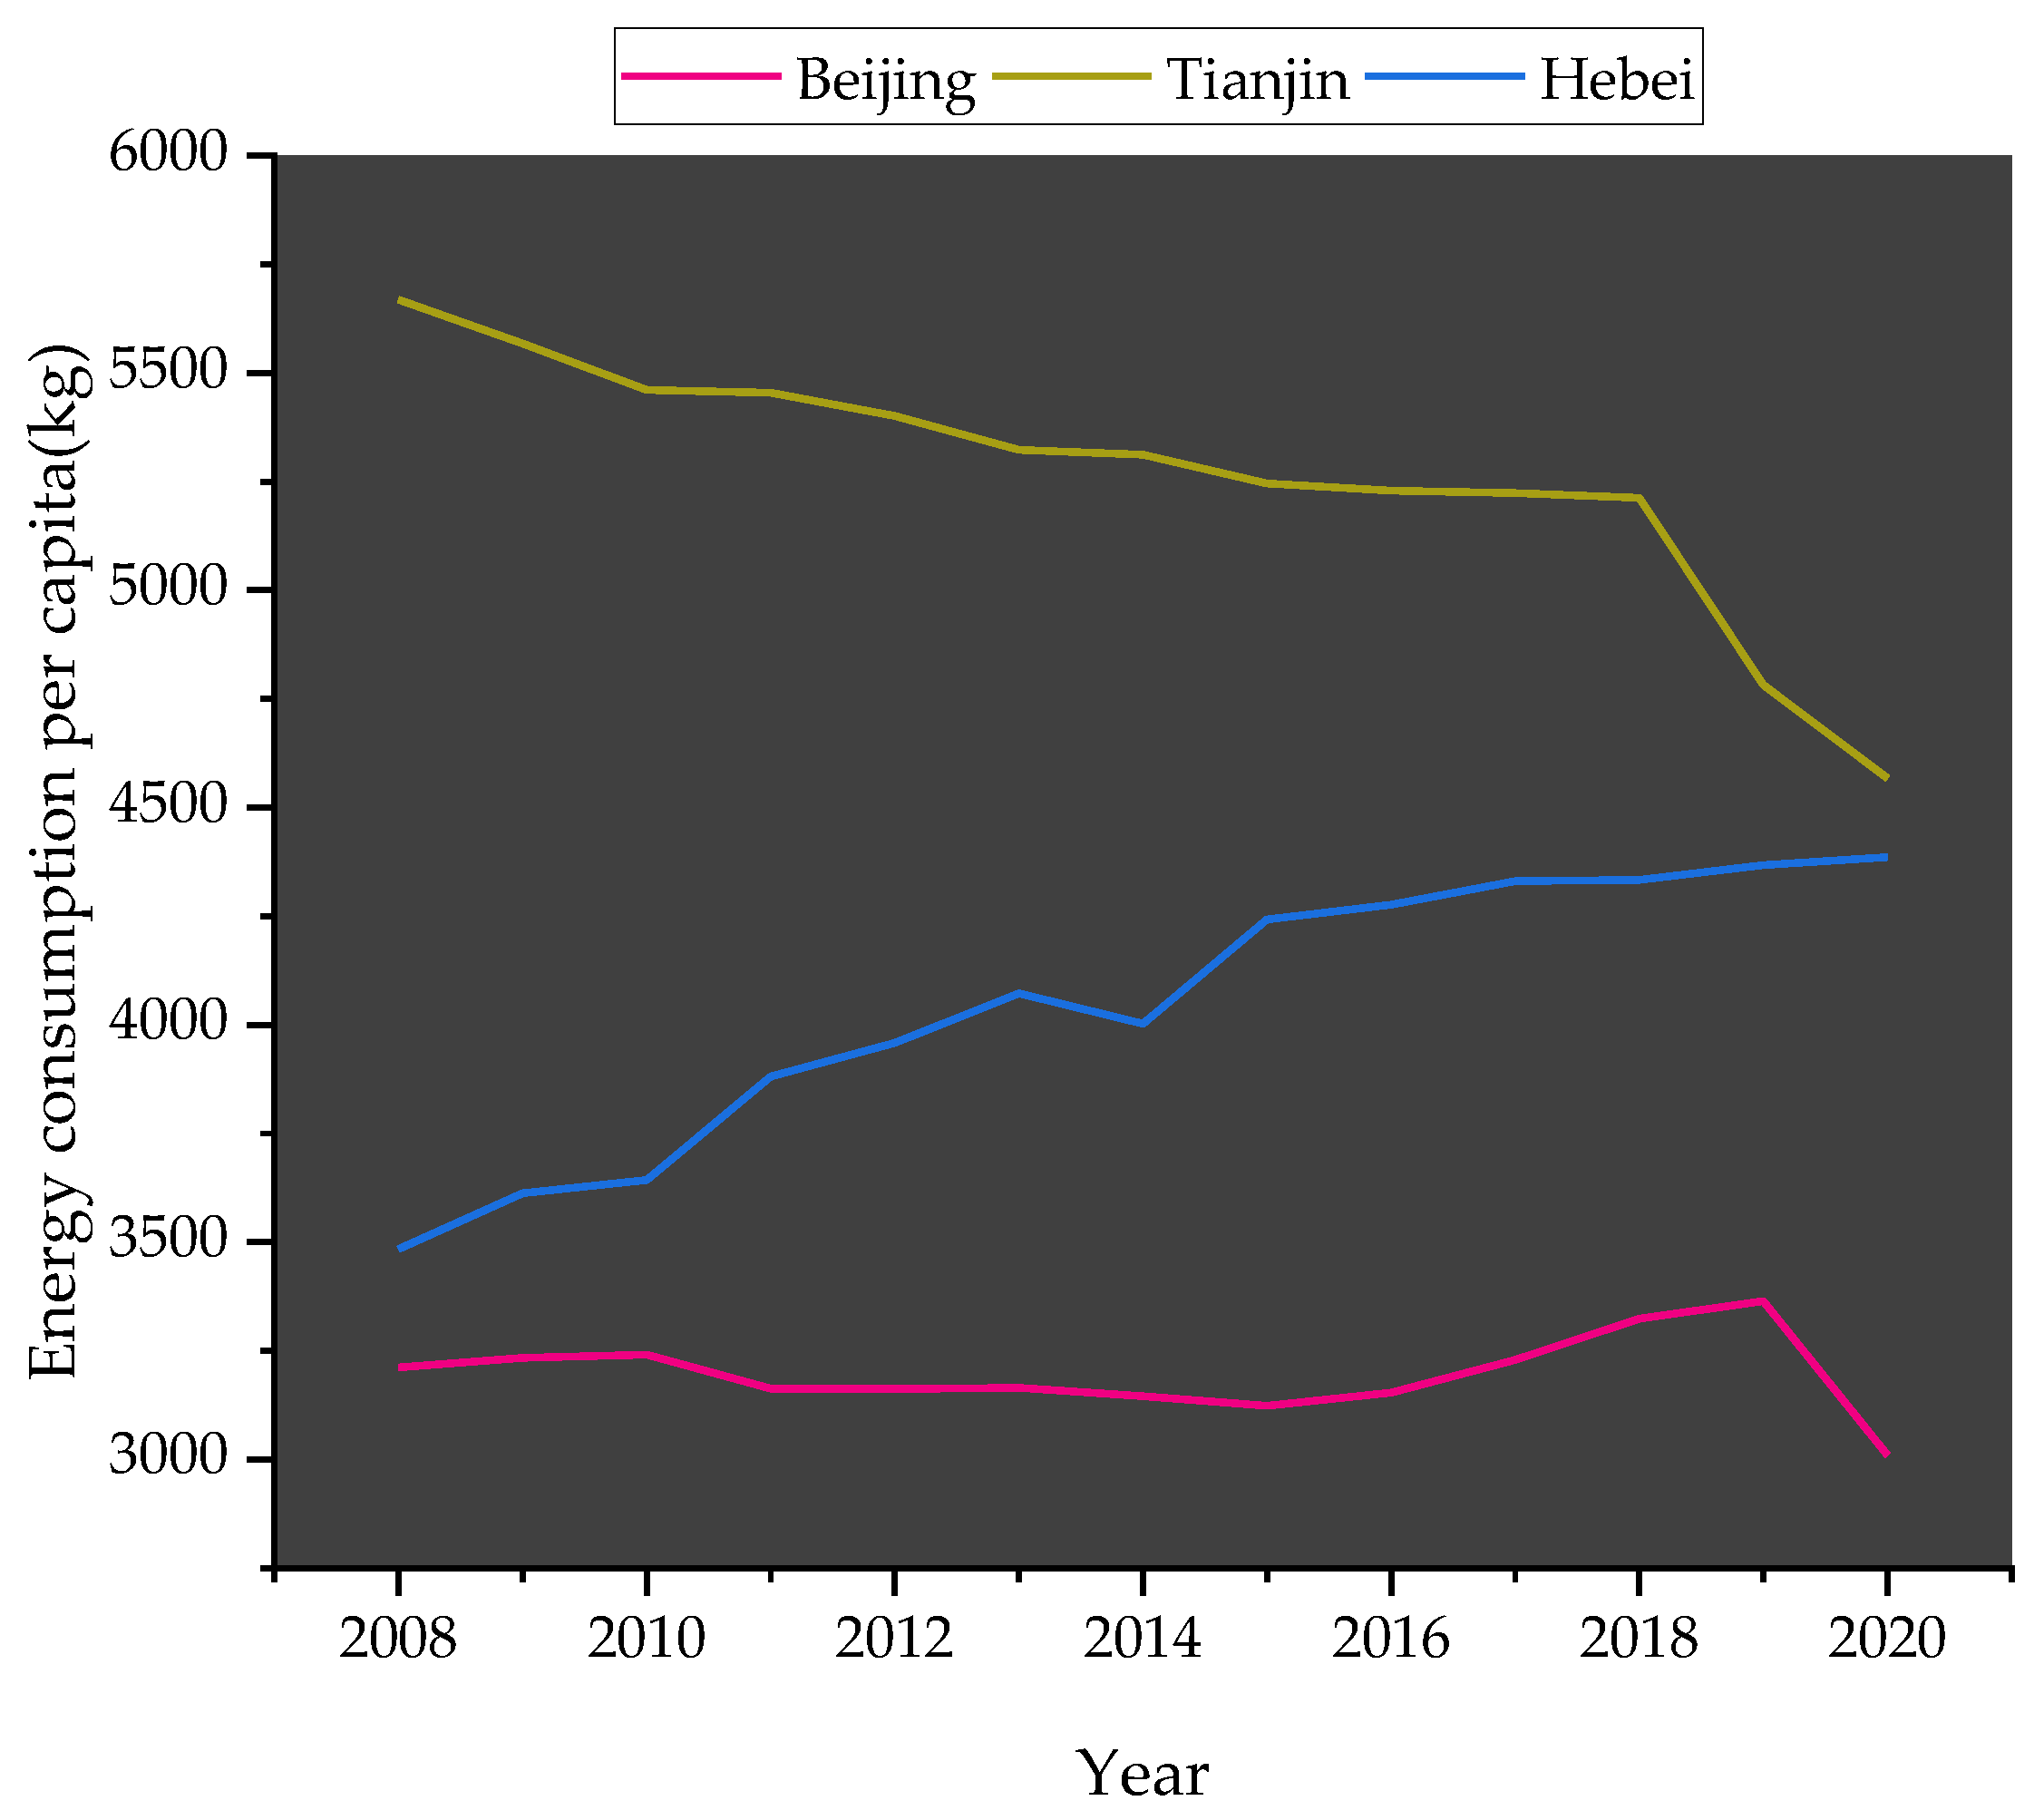
- Energy footprint: reflects per capita energy consumption in the region.
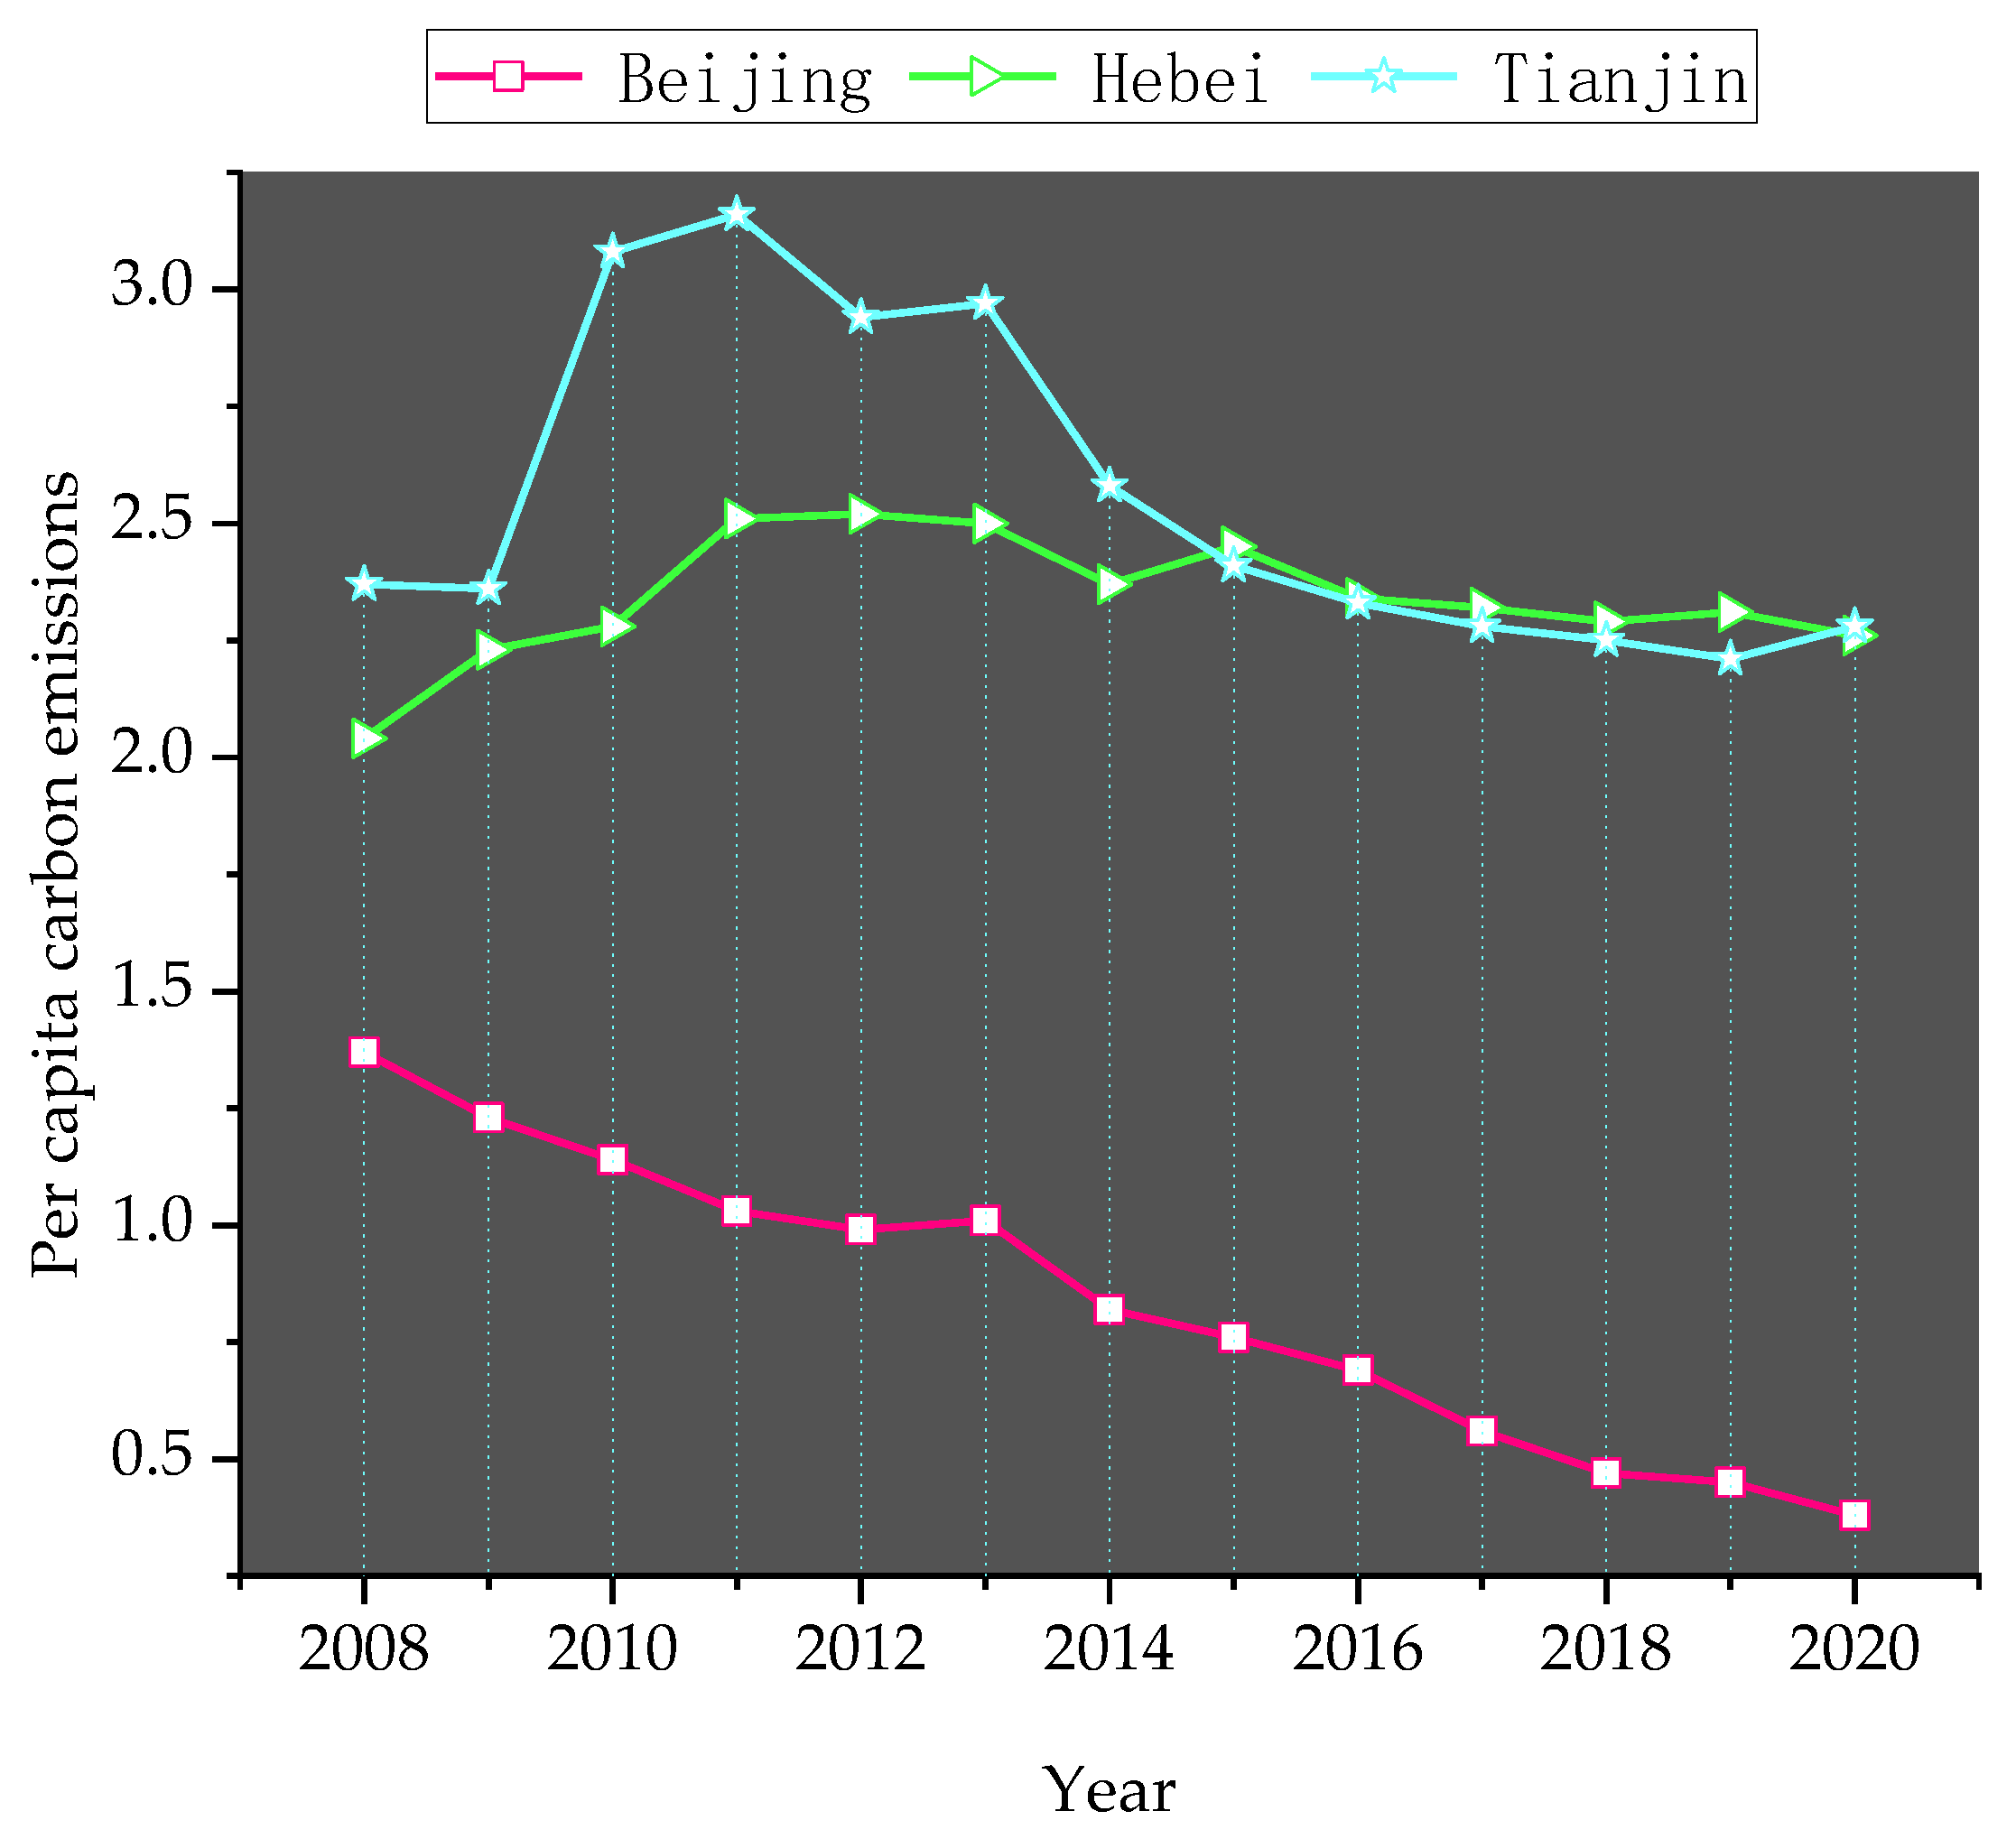
- Carbon footprint: reflects per capita carbon emissions in the region.
- (2)
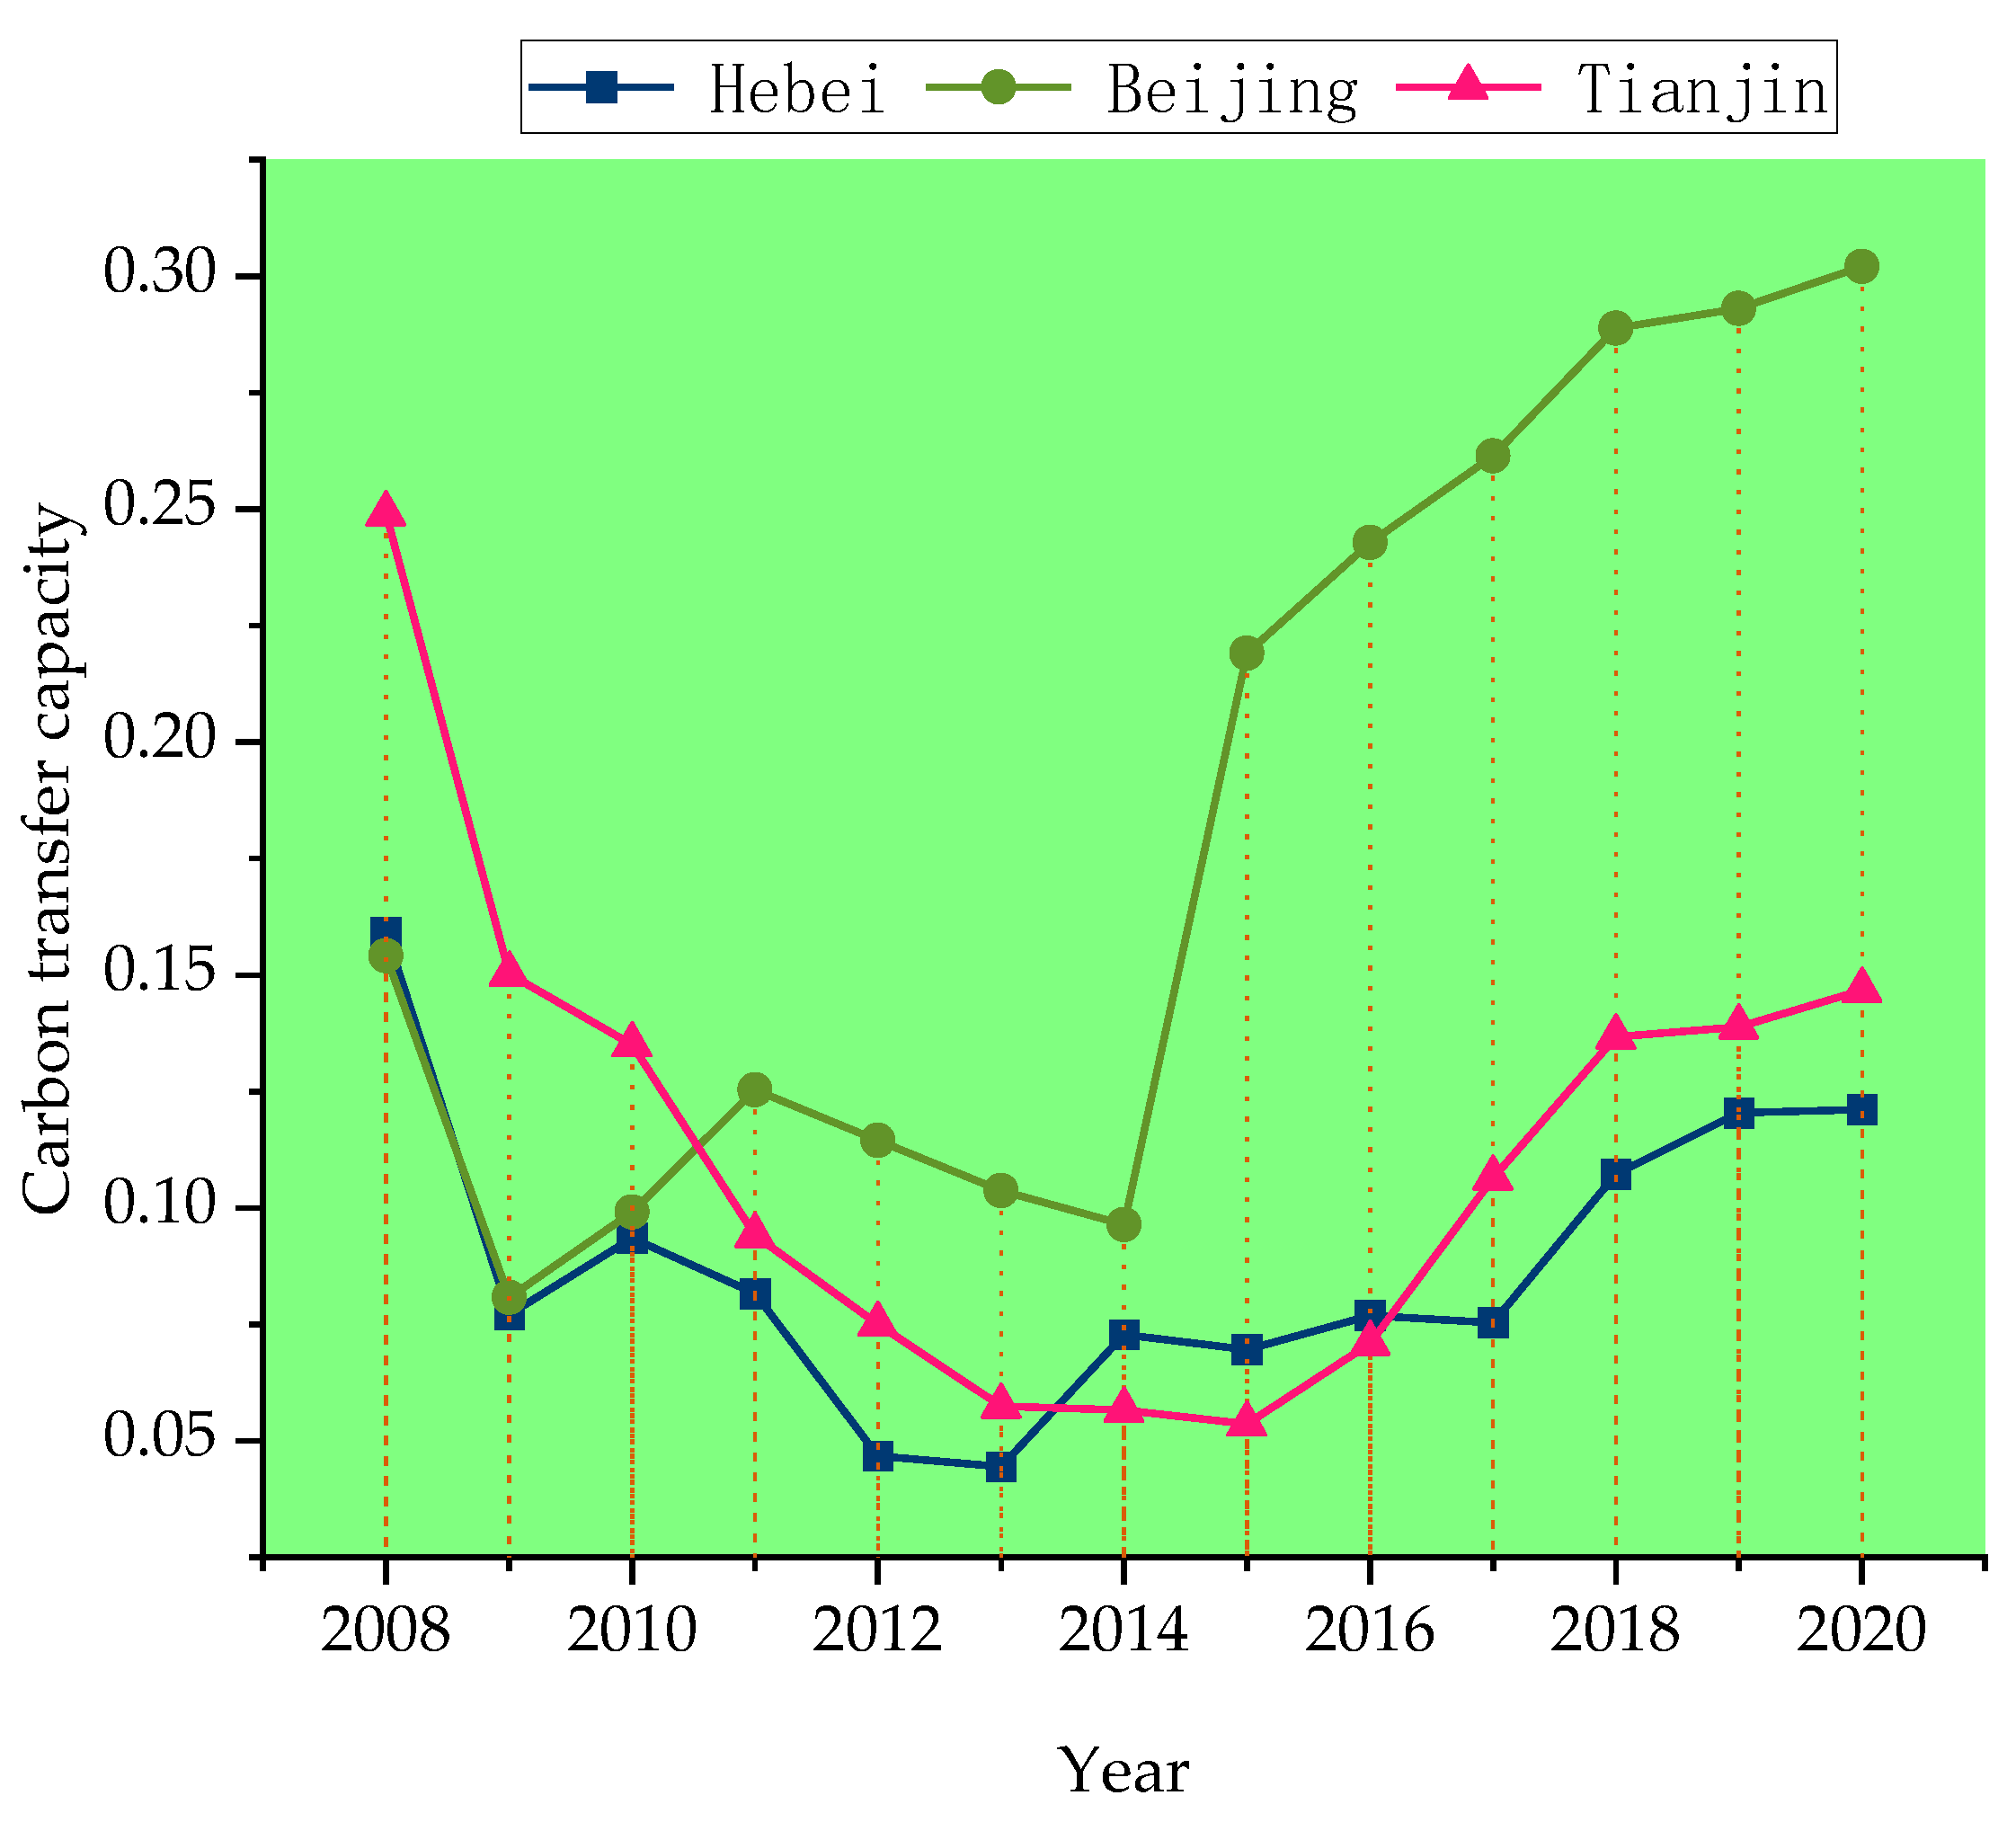
- Carbon transfer capacity
- Net carbon transfer level: the difference between carbon transfers in a province can reflect the degree of “carbon leakage” in the province, measured by the difference between carbon emissions measured by the production side and consumption side.
- Proportion of import and export trade in GDP: ratio of regional income from goods and labor trade activities to GDP.
- (3)
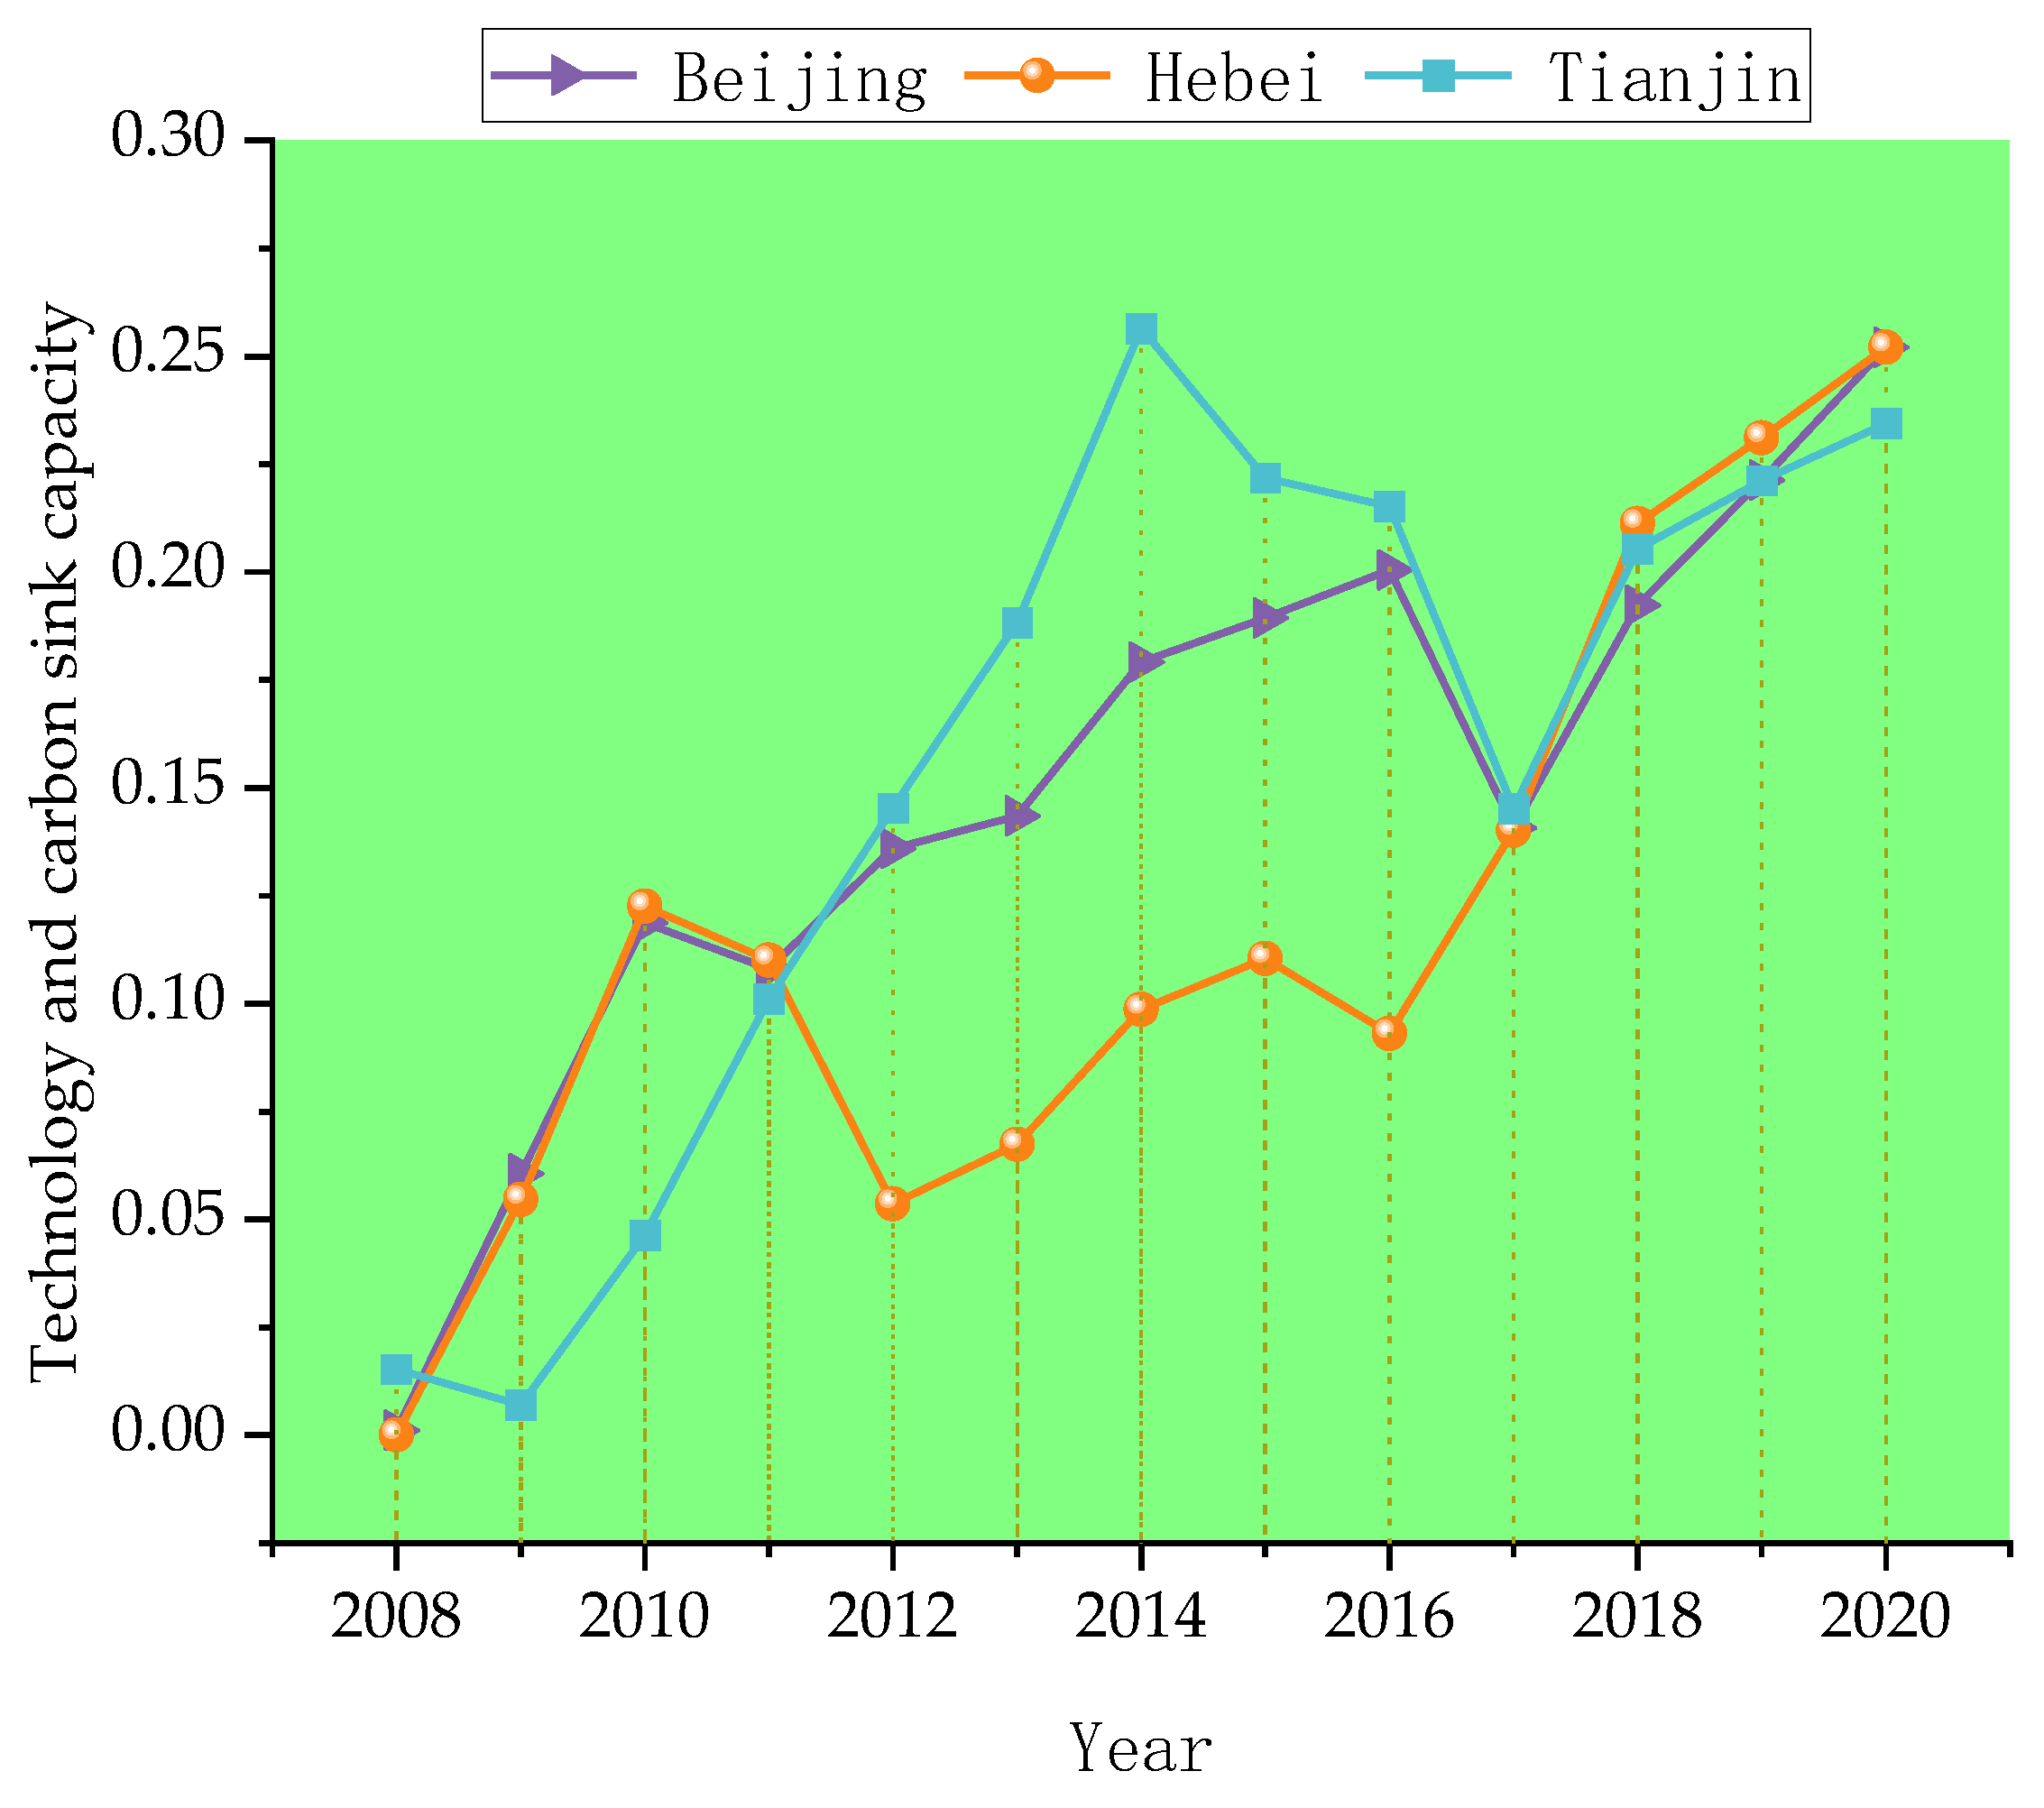
- Technology and carbon sink capacity
- Regional technology market turnover: reflects the regional technology investment situation.
- Regional (R&D) funding intensity: reflects the strength of regional support for scientific and technological innovation.
- Urban greening coverage rate: the ratio of the total area of all types of urban green space (public green space, street green space, courtyard green space, special green space, etc.) to the total urban area.
2.4. Comprehensive Evaluation Model Based on the CRITIC Weighting Method
- (1)
- Standardize the data to make them comparable.
- (2)
- The information quantity of the calculated index hypothesis Cj represents the amount of information contained in the j-th evaluation index. Cj can be expressed as:where σ is the standard deviation of the j-th index and rij is the correlation coefficient between the evaluation indices i and j, which is calculated as follows:where xhi and xhj are the values of the i-th and j-th indicators of h evaluation objects, respectively, and is the mean of the i-th and j-th indicators of n objects.
- (3)
- Calculate the weight of each index:
3. Empirical Data and Model Analysis
3.1. Overview of Energy Consumption in Beijing, Tianjin, and Hebei
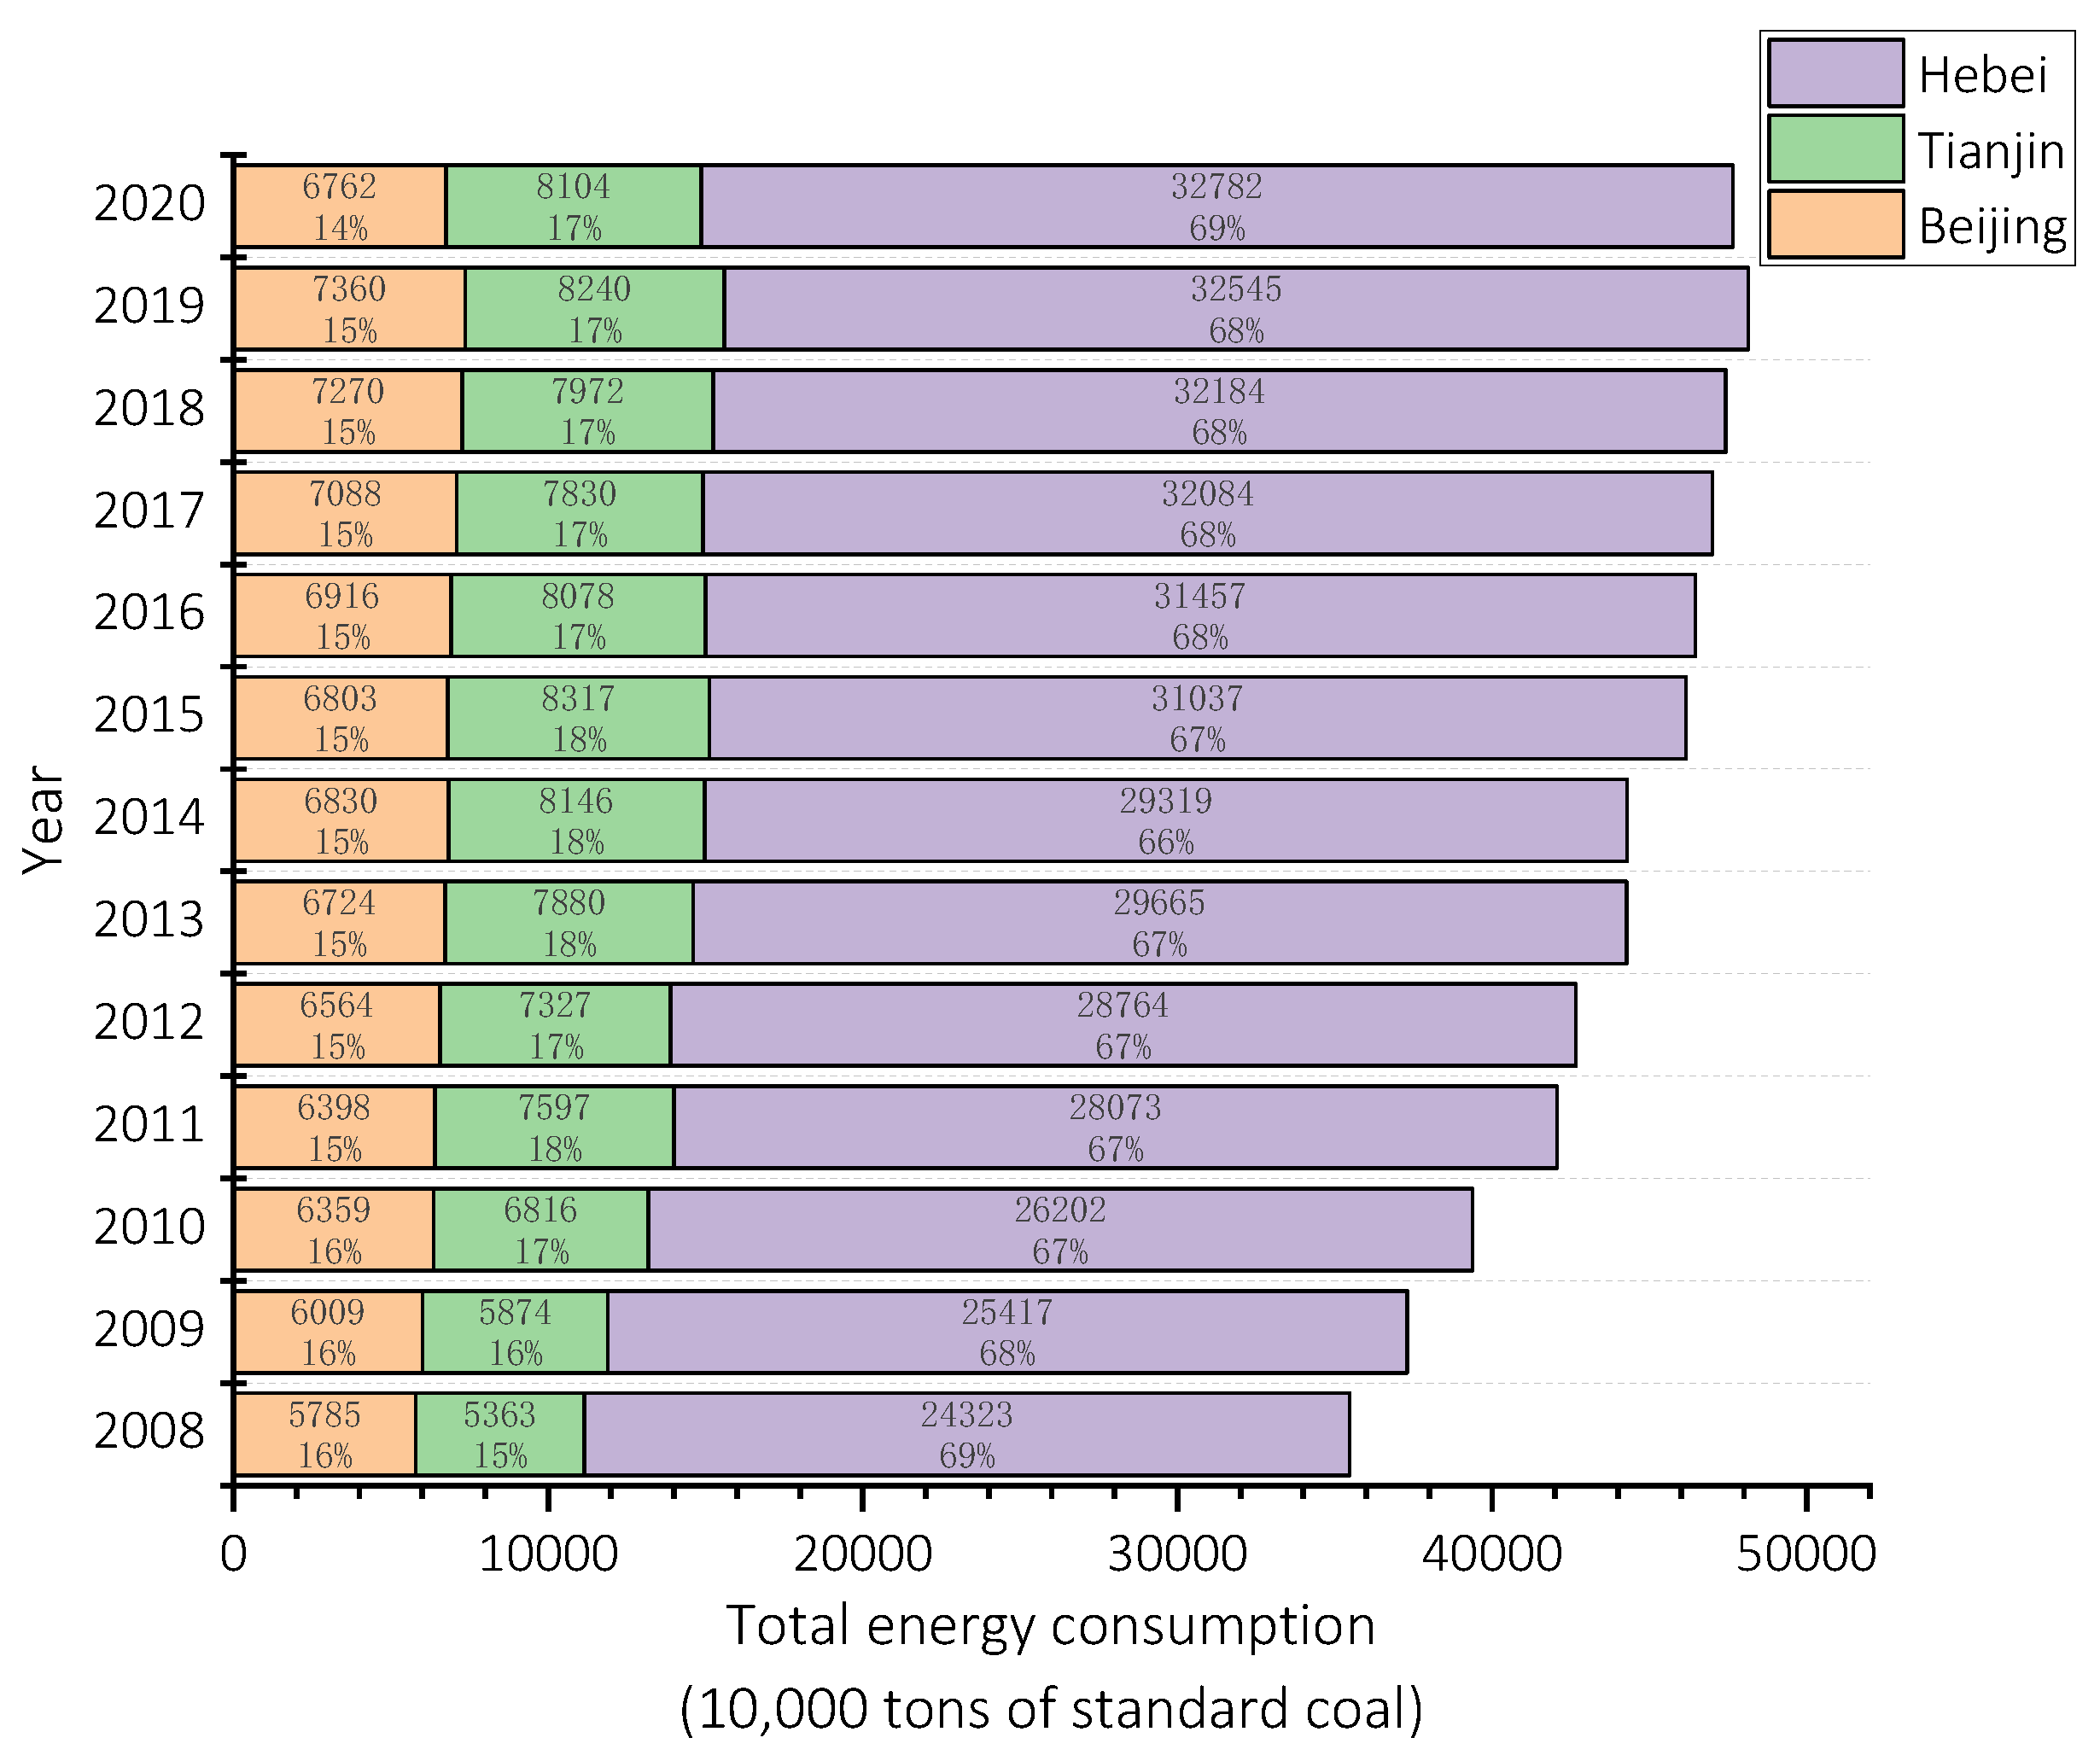
- (1)
- Total energy consumption
- (2)
- Types of energy consumption
- (3)
- Energy consumption per capita
- (4)
- Energy intensity analysis
- (5)
- Analysis of energy consumption structure
3.2. Carbon Emission Estimates in the Beijing–Tianjin–Hebei Region
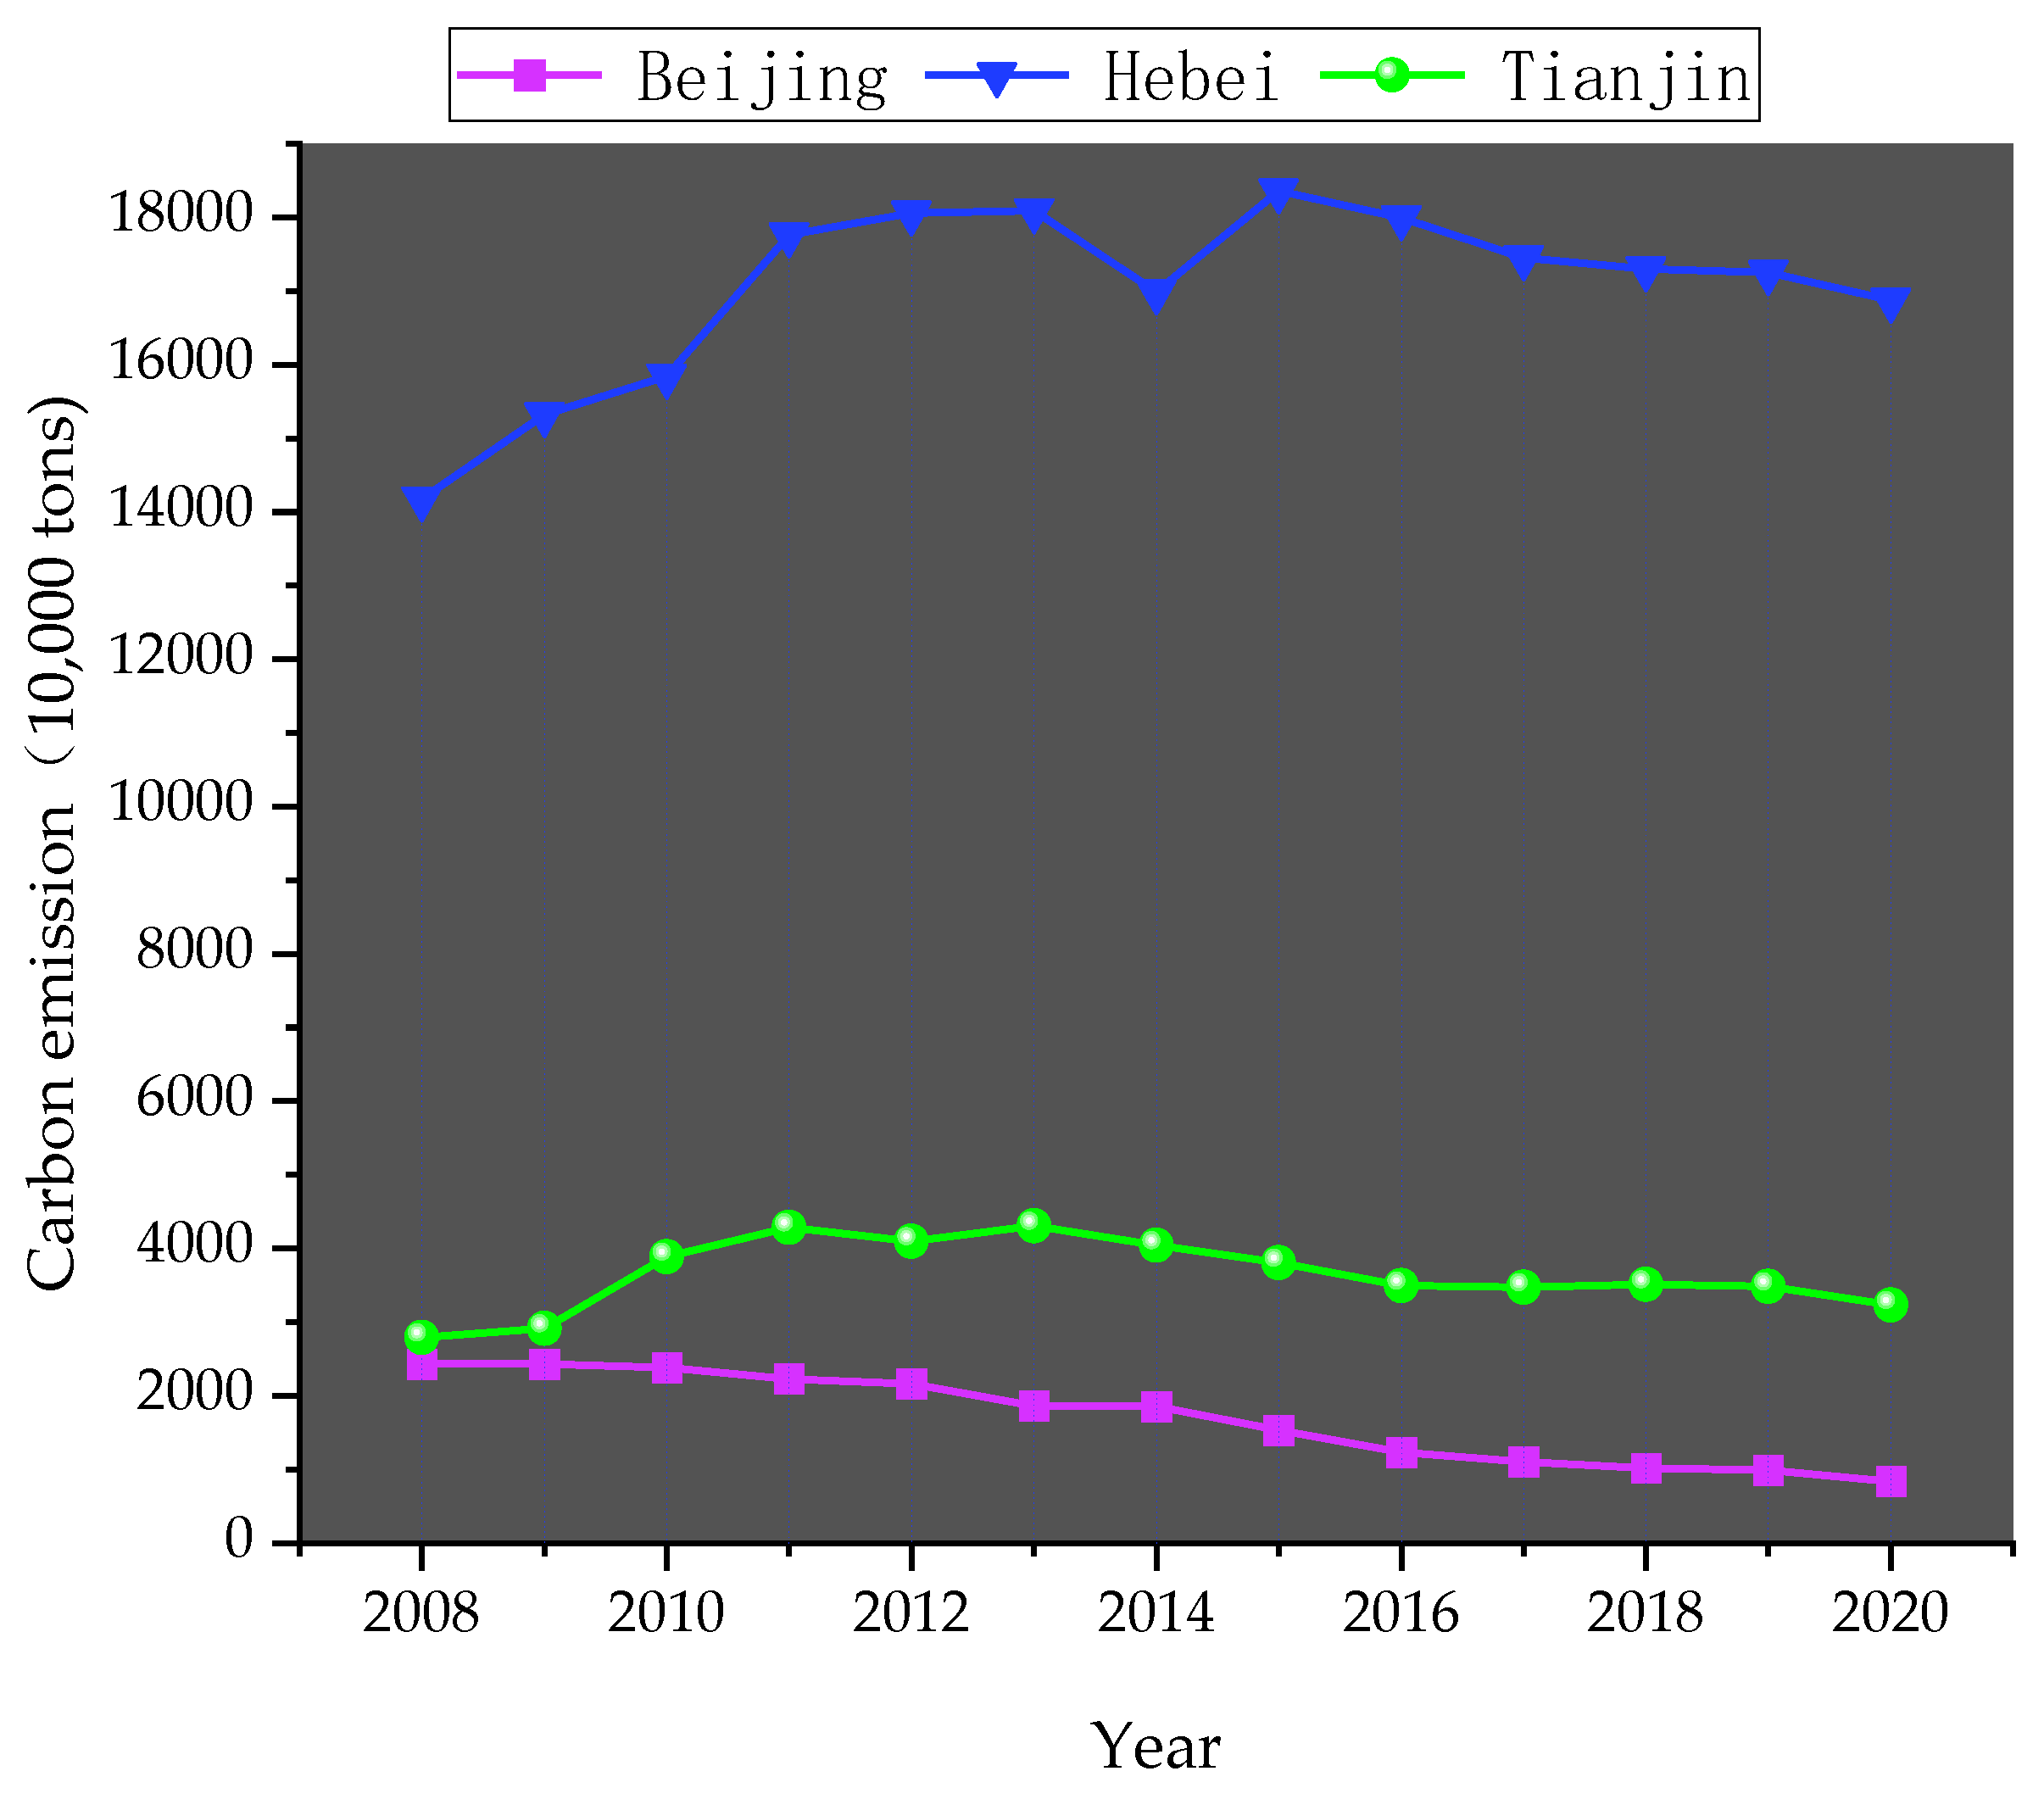
- (1)
- Estimation of carbon emissions
- (2)
- Estimation of carbon emission intensity
- (3)
- Estimate of per-capita carbon emissions
3.3. Analysis of Carbon Contribution Capacity in the Beijing–Tianjin–Hebei Region
- (1)
- The connotation of the carbon contribution capacity of Beijing, Tianjin, and Hebei
- (2)
- Data collection and processing
3.4. Analysis of Results
- (1)
- Comprehensive analysis of carbon contribution capacity in the Beijing–Tianjin–Hebei region.
- (2)
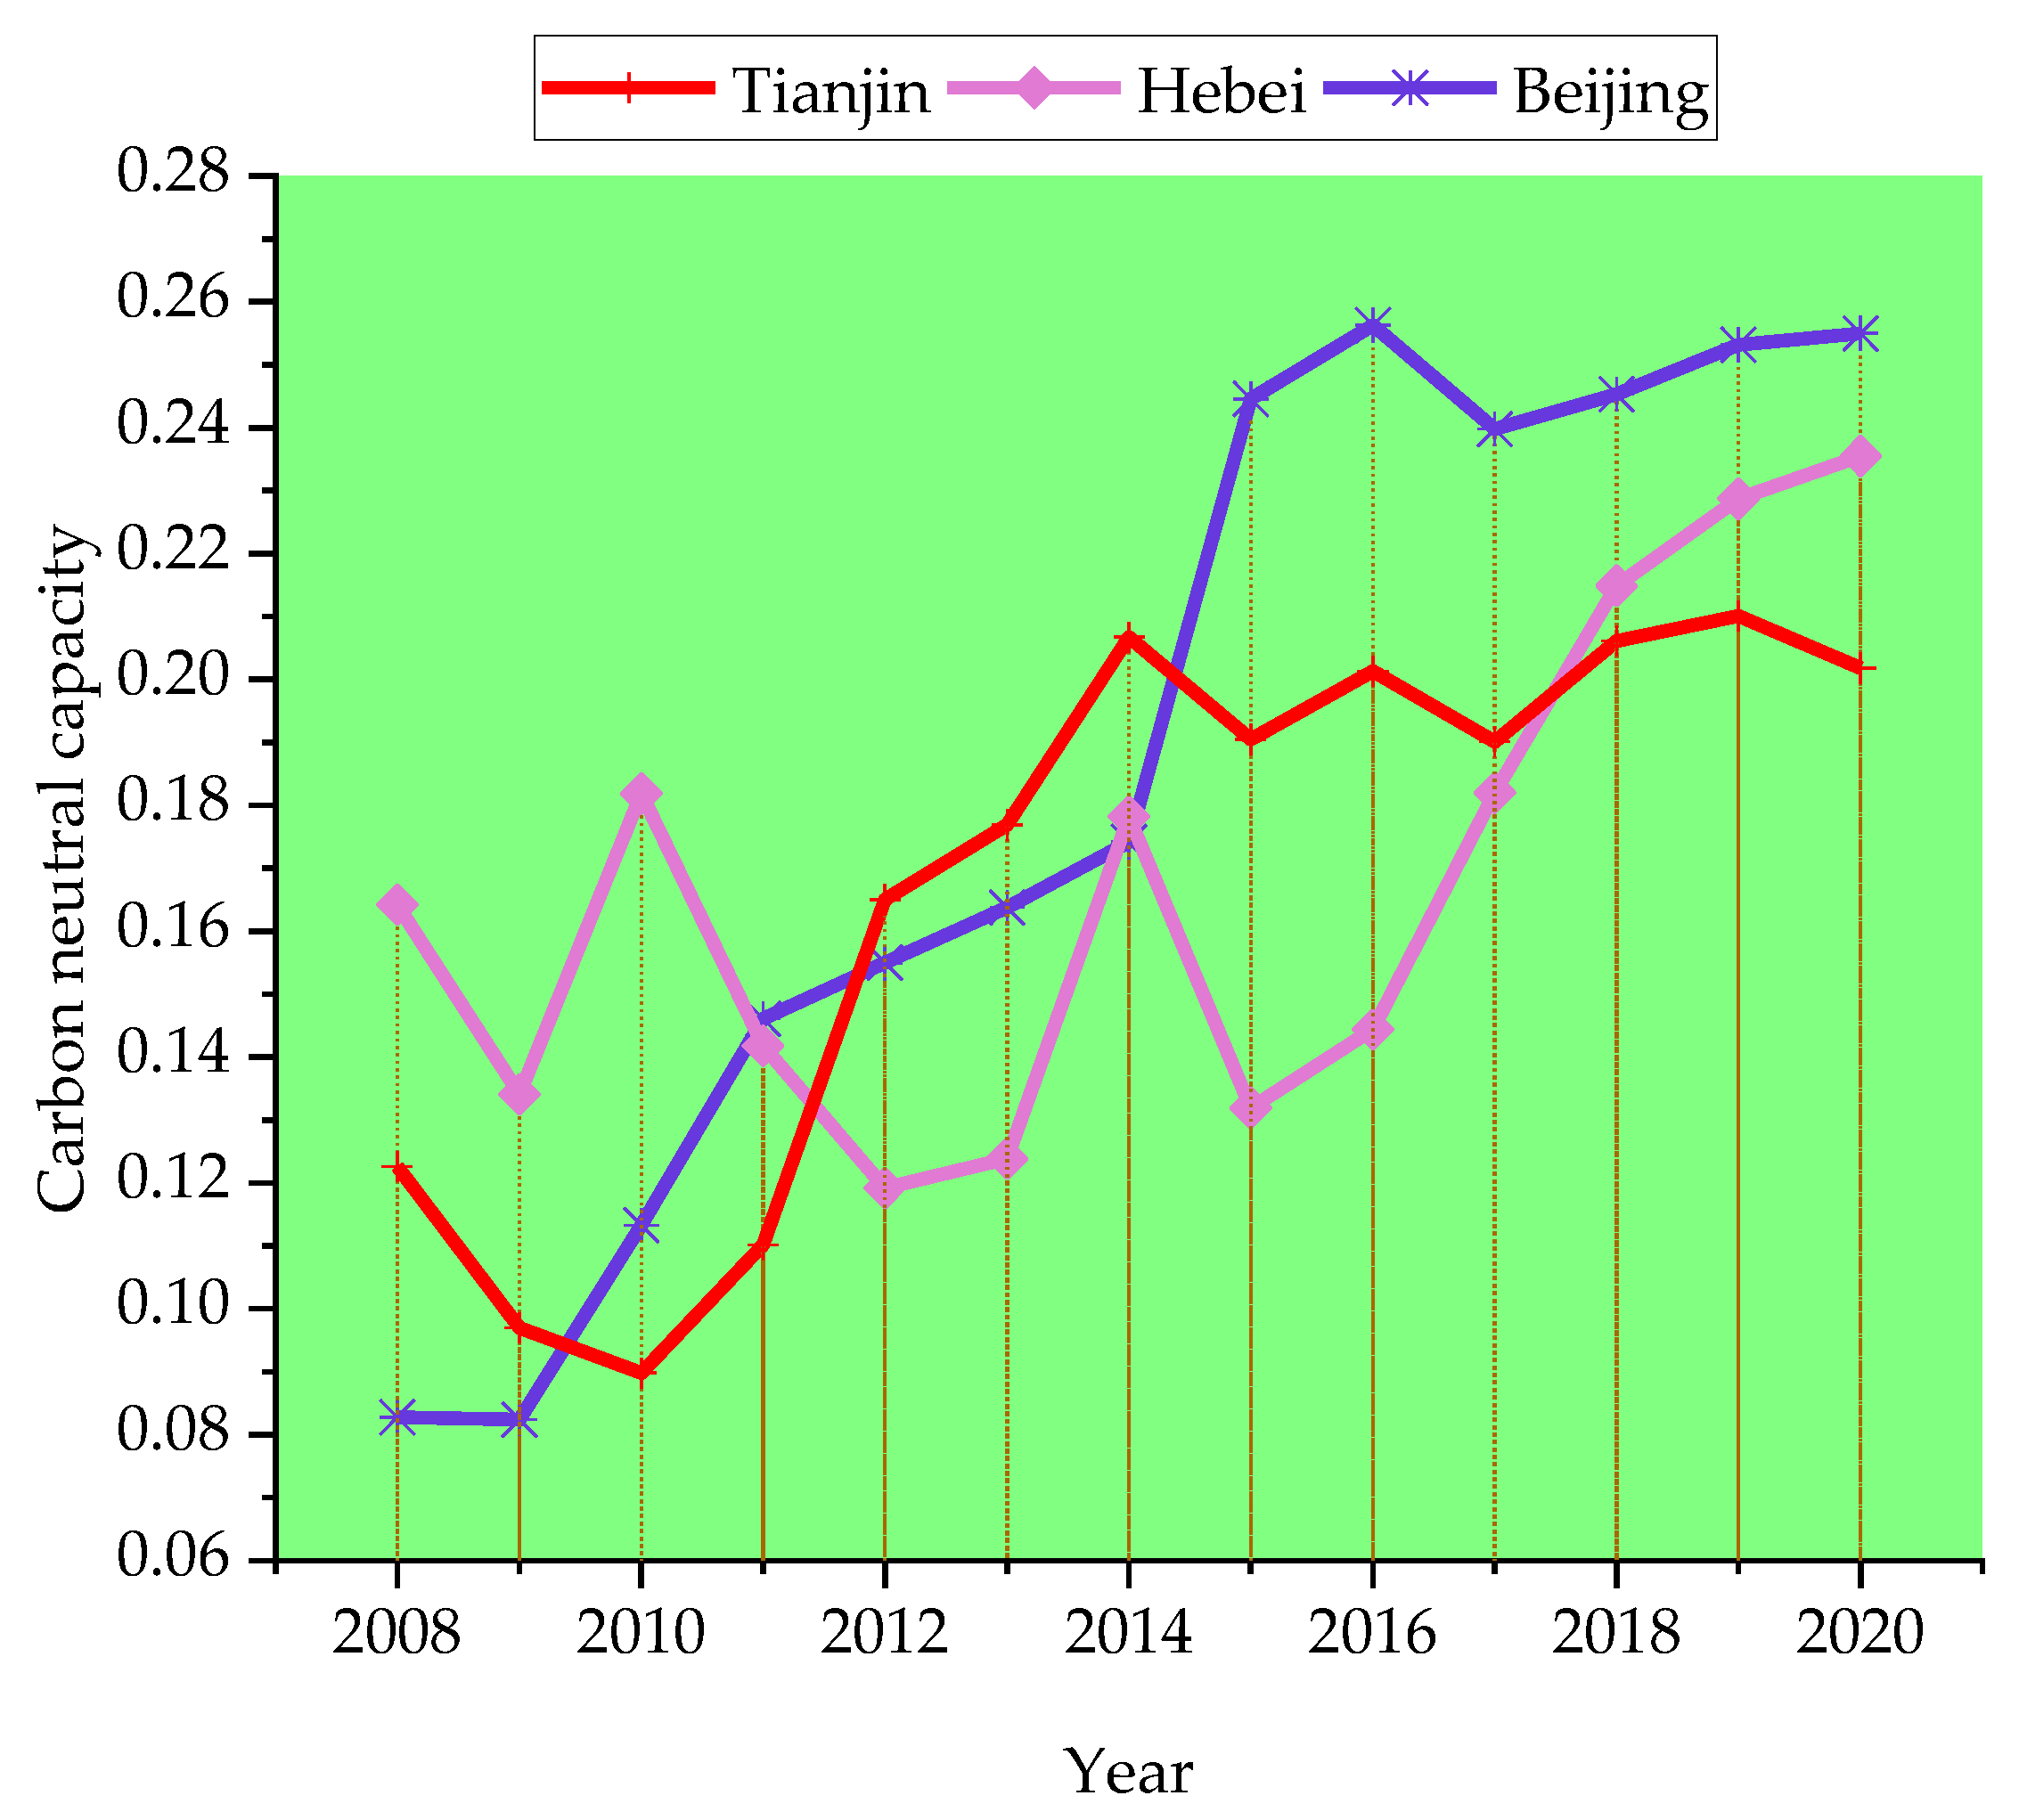
- Secondary index analysis of carbon contribution capacity in Beijing, Tianjin, and Hebei
4. Conclusions and Policy Recommendations
4.1. Conclusions
- (1)
- Beijing’s economic development from 2008 to 2020 has been dominated by the tertiary industry, showing an increasing trend each year; in 2020, tertiary industries accounted for more than 80% of industry in Beijing. In addition, the proportion of secondary industries has declined each year, which shows that Beijing has entered the late stage of industrialization. The developed proportion of secondary and tertiary industries in Tianjin is almost the same; however, in recent years, the development trend of the tertiary industry in Tianjin has been relatively fierce. Despite this, its economy still depends on secondary industries. This shows that Tianjin is in the middle stage of the industrialization process. In Hebei Province, although the ratio of primary industry to GDP has gradually declined in recent years, the tertiary industry has also grown to a certain extent, playing a leading role in the development of GDP. From our analysis of energy consumption in Beijing, Tianjin, and Hebei, Beijing and Tianjin have lower energy consumption that is still dominated by high-carbon coal and coke. From our regional analysis, energy consumption in Beijing, Tianjin, and Hebei depends on coal resources, and the region has an unbalanced consumption structure. Although the consumption of coal has decreased in recent years, it is still large, and the increasing trend of natural gas consumption is not obvious, which indicates that the transformation of energy consumption in Beijing, Tianjin, and Hebei is urgent. In Hebei Province, as the main body of regional energy consumption, carbon emissions are the highest of the three provinces and cities; this shows that energy consumption and carbon emissions in the Beijing–Tianjin–Hebei region are mainly determined by Hebei Province. Therefore, adjustment of the industrial structure and transformation of the energy consumption structure in Hebei Province are the key to reducing overall carbon emissions in the region.
- (2)
- In this research, we established three aspects (energy consumption and carbon emission capacity, carbon transfer capacity, and science and technology and carbon sink capacity) and carried out a comprehensive evaluation of carbon contribution capacity using nine three-level indicators. Using the CRITIC weighting method, we calculated the carbon contribution capacity of the Beijing–Tianjin–Hebei region from 2008 to 2020 and came to the following conclusions: First, Beijing has the highest overall contribution capacity, followed by Tianjin and Hebei. Beijing’s carbon transfer and technology and carbon sink capacities are higher than those of Tianjin and Hebei because Beijing pays more attention to regional openness and the role of science and technology in driving GDP. Finally, energy consumption and carbon emission capacity have basically formed a gradient difference in the Beijing–Tianjin–Hebei region. The key to regional cooperation that enhances carbon neutrality contributions is Hebei Province. Hebei should take advantage of the openness to foreign trade and science and technology found in Beijing and Tianjin. In addition, the location of Hebei Province should be taken advantage of as a traffic artery between Beijing and Tianjin for foreign trade. By addressing these issues, as well as industrial development, technology, the economy, policy, and other aspects restricting low-carbon development, the advancement of a low-carbon economy and the construction of a low-carbon city can be promoted in Hebei Province.
4.2. Policy Suggestion
- (1)
- Strengthening inter-regional intergovernmental cooperation
- (2)
- Strengthen cooperation in low-carbon industries
- (3)
- Strengthen inter-regional cooperation in low-carbon technology
5. Research Deficiencies and Future Prospects
- (1)
- The index system of carbon contribution capacity constructed in this paper lacks comprehensiveness. This paper constructs an evaluation system from three aspects: energy consumption and carbon emission, carbon transfer capacity, and science and technology and carbon sink capacity. However, there are many factors affecting carbon emissions that are not included in the evaluation index system of this paper, such as financial and regional policies. At the same time, this paper mainly introduces the evaluation indexes of energy consumption and carbon emissions that have a direct impact on reducing carbon emissions, namely, four indexes of energy intensity, carbon emission intensity, energy footprint. and carbon footprint; however, there is a lack of detailed indicators for carbon transfer capacity and science and technology and carbon sink capacity. Future studies can be supplemented and expanded to accelerate the realization of carbon neutrality goals more accurately and comprehensively.
- (2)
- This paper takes the Beijing–Tianjin–Hebei region as the research object and makes a comparison within the region in order to illustrate the necessity of coordinated development within the region; however, it lacks investigation of the external environment and has certain regional limitations. In the future, studies on the external environment can be added (such as the impact of new national energy policies and the overall carbon emission trend of the country) to show how the development of the Beijing–Tianjin–Hebei region matches the overall development of the country and realizes the coordinated development of both internal and external aspects of the Beijing–Tianjin–Hebei region.
- (3)
- The research conducted in this paper used 12 years of sample data from 2008 to 2020. Limited by the availability of data, the sample size is too small and lacks immediacy, which should be avoided in future research.
Author Contributions
Funding
Institutional Review Board Statement
Informed Consent Statement
Data Availability Statement
Conflicts of Interest
References
- Wang, C.J.; Wang, F. China can lead on climate change. Science 2017, 357, 764. [Google Scholar] [CrossRef]
- Yang, Y.T.; Qu, S.; Cai, B.F.; Wang, Z.; Wang, J.; Xu, M. Mapping global carbon footprint in China. Nat. Commun. 2020, 11, 2237. [Google Scholar] [CrossRef] [PubMed]
- Wang, C.; Zhang, Y.X. The realization path and policy system of the vision of carbon neutrality. China Environ. Manag. 2020, 12, 58–64. [Google Scholar] [CrossRef] [PubMed]
- Pan, J. Carbon neutrality should be highlighted in building beautiful cities. Economic Daily News, 27 November 2020; p. 11. [Google Scholar]
- Govindaraju, V.G.R.C.; Tang, C.F. The Dynamic Links between CO2 Emissions, Economic Growth and Coal Consumption in China and India. Appl. Energy 2013, 104, 310–318. [Google Scholar] [CrossRef]
- Hu, W.J.; He, J.K. China can and must achieve carbon neutrality by 2060. Econ. Guide Sustain. Dev. 2020, 12, 18–21. [Google Scholar]
- Wang, X. China aims to achieve carbon neutrality by 2060. Ecol. Econ. 2020, 36, 9–12. [Google Scholar]
- Zhang, Z.; Zhang, G.; Hu, Y.; Jiang, Y.; Zhou, C.; Ma, J. The evolutionary mechanism of haze collaborative governance: Novel evidence from a tripartite evolutionary game model and a case study in China. Humanit. Soc. Sci. Commun. 2023, 10, 69. [Google Scholar] [CrossRef]
- Wu, Y.Q.; Zhao, Y.A. Carbon emissions from energy consumption and economic growth in Beijing-Tianjin-Hebei. Econ. Manag. 2014, 28, 5–12. [Google Scholar]
- Chang, Z.; Panksey. Analysis of long-term energy consumption and carbon emission in Shanghai based on LEAP model. Contemp. Financ. Econ. 2014, 1, 98–106. [Google Scholar]
- Peng, J.W.; Huang, X.J.; Zhong, T.Y.; Zhao, Y.T. Research on the decoupling of Chinese economic growth and energy carbon emissions. Resour. Sci. 2011, 33, 626–633. [Google Scholar]
- Gai, M.; Cao, G.Y.; Tian, C.S.; Ke, L. Analysis on the decoupling of carbon emission and regional economic growth in Liaoning Coastal Economic Belt. Resour. Sci. 2014, 36, 1267–1277. [Google Scholar]
- Wang, S.J.; Tian, S.S.; Cai, Q.N.; Wu, H.Q.; Wu, C.X. Analysis of the driving factors of industrial carbon emission in Guangdong Province under the background of industrial transfer. Geogr. Res. 2021, 40, 2606–2622. [Google Scholar]
- Deng, M.J.; Luo, W.B.; Yin, L.J. Comment on the theoretical research and practical development of carbon neutrality abroad. Resour. Sci. 2013, 35, 1084–1094. [Google Scholar]
- Report on Carbon Neutral Contribution of Chinese Enterprises and Top 50 List released in 2022. China Energy News, 5 September 2022; 004, Special Issue.
- Xu, G.Q.; Liu, A.Y.; Jiang, Z.H. Factor decomposition model and empirical analysis of carbon emission in China: 1995–2004. Chin. Popul. Resour. Environ. 2006, 6, 158–161. [Google Scholar]
- Wang, H.K.; Zhang, R.R.; Bi, J. Chinese urban carbon emission accounting study—Take Wuxi city as an example. Environ. Sci. China 2011, 31, 1029–1038. [Google Scholar]
- Li, J.B.; Huang, X.J.; Wu, C.Y.; Zhou, Y.; Meng, H. Prediction and analysis of the spatial pattern of provincial carbon emission in China. Eco-Econ. 2017, 33, 46–52. [Google Scholar]
- Niu, D.; Wu, G.; Ji, Z.; Wang, D.; Li, Y.; Gao, T. Evaluation of Provincial Carbon Neutrality Capacity of China Based on Combined Weight and Improved TOPSIS Model. Sustainability 2021, 13, 2777. [Google Scholar] [CrossRef]
- Li, Q.W.; Long, R.Y.; Chen, H. Measurements and Factors That Influence the Carbon Capability of Urban Residents in China. Sustainability 2018, 10, 1292. [Google Scholar] [CrossRef] [Green Version]
- Sun, B.D.; Zhang, J.; Chun, Y.T. Evaluation and realization of carbon neutrality Capacity in China. Environ. Eng. 2023, 1–11. [Google Scholar] [CrossRef]
- Huang, Y.S.; Li, Z.B.; Shi, M.S. Prediction of plant carbon sink potential in Beijing-Tianjin-Hebei region of China. Environ. Dev. Sustain. 2022, 1–28. [Google Scholar] [CrossRef]
- Diakoulaki, D.; Mavrotas, G.; Papayannakis, L. Determining Objective Weights in Multiple Crireria Problems: The Critic method. Comput. Oper. Res. 1995, 22, 763–770. [Google Scholar] [CrossRef]
- Zhang, Y.; Wei, H.B. Multi-attribute decision combination assignment method based on CRITIC. Stat. Decis. Mak. 2012, 16, 75–77. [Google Scholar]
- Xu, M.; Qin, Z.; Zhang, S. Carbon dioxide mitigation co-effect analysis of clean air policies: Lessons and perspectives in China’s Beijing–Tianjin–Hebei region. Environ. Res. Lett. 2021, 16, 015006. [Google Scholar] [CrossRef]
- Zong, G.; Niu, Q.N.; Chi, Y.Y. Decomposition analysis of carbon emission factors for energy consumption in the Beijing-Tianjin-Hebei region. Ecol. Sci. 2016, 35, 111–117. [Google Scholar]
- Zhang, Z.; Zhang, J.; Feng, Y. Assessment of the carbon emission reduction effect of the air pollution prevention and control action plan in China. Int. J. Environ. Res. Public Health 2021, 18, 13307. [Google Scholar] [CrossRef] [PubMed]


| Order Number | Energy | Equivalent to Standard Coal Coefficient |
|---|---|---|
| 1 | coal | 0.7143 |
| 2 | crude oil | 1.4286 |
| 3 | natural gas | 1.33 |
| Metric | Coal | Crude Oil | Natural Gas |
|---|---|---|---|
| Carbon emission coefficient t (C)/t | 0.7476 | 0.5825 | 0.4435 |
| Primary Indicators | Secondary Indicators | Tertiary Indicators | Indicator Characterization |
|---|---|---|---|
| Regional carbon contribution capacity | Energy consumption and carbon emission capacity, B1 | Energy intensity, C1 (Tt of standard coal/10,000 CNY) | Energy consumption per unit GDP |
| Carbon emission intensity, C2 (ton/10,000 CNY) | Carbon emissions per unit GDP | ||
| Energy footprint, C3 (Tt of standard coal/person) | Per capita energy consumption | ||
| Carbon footprint, C4 (ton/person) | Per capita carbon emissions | ||
| Carbon transfer capacity, B2 | Net carbon transfer level, C5 (ton) | Carbon leakage capacity | |
| Share of import and export volume in GDP, C6 (%) | Transfer of carbon emission capacity | ||
| Technology and carbon sink capacity, B3 | Regional technology market transaction volume, C7 (CNY 10,000) | Low-carbon technology capabilities | |
| Regional (R&D) funding input intensity, C8 (%) | Support for scientific and technological innovation | ||
| Urban green coverage rate, C9 (%) | Carbon sink capacity |
| Year | Beijing’s Energy Consumption with Respect to National Total Energy Consumption (%) | Tianjin’s Energy Consumption with Respect to National Total Energy Consumption (%) | Hebei’s Energy Consumption with Respect to National Total Energy Consumption (%) | Total Energy Consumption in the Beijing–Tianjin–Hebei Region with Respect to National Total Energy Consumption (%) |
|---|---|---|---|---|
| 2008 | 1.80 | 1.67 | 7.59 | 11.06 |
| 2009 | 1.79 | 1.75 | 7.56 | 11.10 |
| 2010 | 1.76 | 1.89 | 7.27 | 10.92 |
| 2011 | 1.65 | 1.96 | 7.25 | 10.87 |
| 2012 | 1.63 | 1.82 | 7.15 | 10.61 |
| 2013 | 1.61 | 1.89 | 7.12 | 10.62 |
| 2014 | 1.59 | 1.90 | 6.85 | 10.34 |
| 2015 | 1.57 | 1.92 | 7.15 | 10.63 |
| 2016 | 1.57 | 1.83 | 7.13 | 10.52 |
| 2017 | 1.55 | 1.72 | 7.04 | 10.31 |
| 2018 | 1.54 | 1.69 | 6.82 | 10.05 |
| 2019 | 1.51 | 1.69 | 6.68 | 9.88 |
| 2020 | 1.36 | 1.63 | 6.58 | 9.57 |
| Year | Total Energy Consumption in the Beijing–Tianjin–Hebei Region (10,000 Tons of Standard Coal) | Total Energy Consumption in Beijing with Respect to Energy Consumption in the Beijing–Tianjin–Hebei Region (%) | Total Energy Consumption in Tianjin with Respect to Energy Consumption in the Beijing–Tianjin–Hebei Region (%) | Total Energy Consumption in Hebei with Respect to Energy Consumption in the Beijing–Tianjin–Hebei Region (%) |
|---|---|---|---|---|
| 2008 | 35,472.07 | 16.31 | 15.12 | 68.57 |
| 2009 | 37,301.39 | 16.11 | 15.75 | 68.14 |
| 2010 | 39,378.91 | 16.15 | 17.31 | 66.54 |
| 2011 | 42,070.33 | 15.21 | 18.06 | 66.73 |
| 2012 | 42,652.13 | 15.39 | 17.18 | 67.44 |
| 2013 | 44,270.11 | 15.19 | 17.80 | 67.01 |
| 2014 | 44,296.47 | 15.42 | 18.39 | 66.19 |
| 2015 | 46,159.00 | 14.74 | 18.02 | 67.24 |
| 2016 | 46,453.00 | 14.89 | 17.39 | 67.72 |
| 2017 | 47,003.00 | 15.08 | 16.66 | 68.26 |
| 2018 | 47,428.00 | 15.33 | 16.81 | 67.86 |
| 2019 | 48,146.45 | 15.29 | 17.12 | 67.59 |
| 2020 | 47,649.46 | 14.19 | 17.01 | 68.80 |
| Year | Coal | Coke | Crude Oil | Gasoline | Kerosene | Diesel Oil | Fuel Oil | Natural Gas | Power |
|---|---|---|---|---|---|---|---|---|---|
| 2008 | 22,243.30 | 6760.74 | 4663.98 | 1031.15 | 506.00 | 1528.07 | 262.76 | 1148.92 | 4139.86 |
| 2009 | 23,786.91 | 7080.98 | 4838.22 | 1113.42 | 542.82 | 1552.43 | 281.16 | 1342.75 | 4563.11 |
| 2010 | 24,934.07 | 7968.75 | 5828.30 | 1199.78 | 620.45 | 1840.17 | 355.59 | 1549.13 | 5206.60 |
| 2011 | 27,443.41 | 8881.26 | 6319.81 | 1350.90 | 667.05 | 2036.89 | 388.42 | 1634.64 | 5662.51 |
| 2012 | 27,805.55 | 9050.46 | 5954.41 | 1453.72 | 707.05 | 2063.09 | 321.46 | 2060.81 | 5900.04 |
| 2013 | 27,829.96 | 9030.25 | 5737.20 | 1446.98 | 810.40 | 1922.09 | 186.31 | 2263.29 | 6144.53 |
| 2014 | 26,000.07 | 8822.47 | 5706.40 | 1445.03 | 860.79 | 1922.92 | 165.43 | 2613.01 | 6290.50 |
| 2015 | 26,718.05 | 8558.75 | 6107.38 | 1670.47 | 909.91 | 1540.30 | 215.40 | 3445.22 | 6177.60 |
| 2016 | 25,672.85 | 8919.78 | 5738.01 | 1736.28 | 1011.95 | 1527.10 | 148.11 | 3857.47 | 6340.11 |
| 2017 | 24,672.34 | 9237.17 | 5799.48 | 1684.02 | 1137.48 | 1531.45 | 123.75 | 4163.44 | 6823.85 |
| 2018 | 24,073.93 | 9916.90 | 6149.33 | 1849.67 | 1217.72 | 1379.58 | 242.70 | 5158.85 | 7516.70 |
| 2019 | 23,348.57 | 9981.93 | 6868.53 | 1778.25 | 1236.78 | 1374.45 | 220.37 | 5539.18 | 7614.40 |
| 2020 | 22,898.41 | 10237.86 | 6095.80 | 1659.62 | 819.33 | 1296.98 | 209.12 | 5658.80 | 7621.40 |
| Year | Coal | Coke | Crude Oil | Gasoline | Kerosene | Diesel Oil | Fuel Oil | Natural Gas | Power |
|---|---|---|---|---|---|---|---|---|---|
| 2008 | 1962.90 | 226.21 | 1595.40 | 501.63 | 468.48 | 331.08 | 36.60 | 735.93 | 870.13 |
| 2009 | 1903.61 | 205.91 | 1661.36 | 535.02 | 503.12 | 349.97 | 60.57 | 842.10 | 932.81 |
| 2010 | 1882.18 | 214.15 | 1594.73 | 546.67 | 578.16 | 345.94 | 95.27 | 907.50 | 1021.30 |
| 2011 | 1690.03 | 32.43 | 1578.72 | 573.54 | 617.81 | 351.34 | 106.63 | 892.58 | 1049.57 |
| 2012 | 1621.46 | 31.35 | 1536.85 | 611.96 | 652.32 | 314.47 | 111.66 | 1117.18 | 1120.85 |
| 2013 | 1442.34 | 0.77 | 1244.20 | 623.30 | 701.95 | 282.53 | 11.86 | 1198.96 | 1116.79 |
| 2014 | 1240.41 | 0.62 | 1478.06 | 648.33 | 746.85 | 286.26 | 8.04 | 1379.64 | 1147.16 |
| 2015 | 832.29 | 0.43 | 1416.51 | 680.89 | 801.00 | 265.70 | 7.01 | 1782.24 | 1169.09 |
| 2016 | 605.45 | 0.20 | 1172.88 | 692.10 | 874.41 | 251.63 | 6.63 | 1969.47 | 1253.89 |
| 2017 | 350.34 | 0.17 | 1275.08 | 720.91 | 947.58 | 255.15 | 4.01 | 1996.77 | 1311.20 |
| 2018 | 197.28 | 0.01 | 1302.57 | 726.28 | 1016.78 | 260.50 | 2.20 | 2279.74 | 1403.99 |
| 2019 | 130.57 | 0.01 | 1338.58 | 737.02 | 1026.74 | 235.86 | 0.69 | 2292.35 | 1433.51 |
| 2020 | 96.42 | 0.01 | 1116.84 | 622.49 | 673.72 | 164.00 | 0.39 | 2326.18 | 1407.33 |
| Year | Coal | Coke | Crude Oil | Gasoline | Kerosene | Diesel Oil | Fuel Oil | Natural Gas | Power |
|---|---|---|---|---|---|---|---|---|---|
| 2008 | 2837.91 | 698.66 | 1129.07 | 218.89 | 26.68 | 422.21 | 132.13 | 204.49 | 694.97 |
| 2009 | 2942.92 | 843.81 | 1206.65 | 266.37 | 30.50 | 442.33 | 135.22 | 220.03 | 749.52 |
| 2010 | 3433.64 | 644.92 | 2238.32 | 301.81 | 31.49 | 486.00 | 205.28 | 280.50 | 876.83 |
| 2011 | 3758.65 | 689.19 | 2505.79 | 327.49 | 36.09 | 525.52 | 214.23 | 315.96 | 944.37 |
| 2012 | 3784.36 | 857.47 | 2206.64 | 373.37 | 43.27 | 551.82 | 174.76 | 395.62 | 996.33 |
| 2013 | 3770.55 | 928.15 | 2513.12 | 312.29 | 82.57 | 473.05 | 124.19 | 458.88 | 1032.03 |
| 2014 | 3590.99 | 927.09 | 2290.29 | 333.74 | 88.06 | 487.30 | 111.72 | 552.39 | 1070.30 |
| 2015 | 3242.09 | 878.82 | 2309.65 | 393.19 | 96.79 | 569.10 | 134.49 | 776.91 | 1105.62 |
| 2016 | 3021.60 | 861.91 | 2048.04 | 404.33 | 120.68 | 541.69 | 64.76 | 905.02 | 1119.22 |
| 2017 | 2768.35 | 785.57 | 2321.26 | 403.40 | 149.35 | 508.69 | 58.12 | 1011.63 | 1113.24 |
| 2018 | 2737.83 | 842.43 | 2411.81 | 402.65 | 160.26 | 475.10 | 67.13 | 1263.24 | 1220.06 |
| 2019 | 2690.13 | 878.14 | 2419.12 | 418.55 | 162.71 | 461.78 | 71.43 | 1334.43 | 1185.12 |
| 2020 | 2675.25 | 902.79 | 1991.70 | 418.95 | 125.54 | 473.63 | 75.16 | 1439.47 | 1195.52 |
| Year | Coal | Coke | Crude Oil | Gasoline | Kerosene | Diesel Oil | Fuel Oil | Natural Gas | Power |
|---|---|---|---|---|---|---|---|---|---|
| 2008 | 17,442.49 | 5835.87 | 1939.51 | 310.63 | 10.84 | 774.78 | 94.03 | 208.50 | 2574.76 |
| 2009 | 18,940.38 | 6031.26 | 1970.21 | 312.03 | 9.20 | 760.13 | 85.37 | 280.62 | 2880.78 |
| 2010 | 19,618.25 | 7109.68 | 1995.25 | 351.30 | 10.80 | 1008.23 | 55.04 | 361.13 | 3308.47 |
| 2011 | 21,994.73 | 8159.64 | 2235.30 | 449.87 | 13.15 | 1160.03 | 67.56 | 426.10 | 3668.57 |
| 2012 | 22,399.73 | 8161.97 | 2210.92 | 468.39 | 11.46 | 1196.80 | 35.04 | 548.01 | 3782.86 |
| 2013 | 22,617.07 | 8101.33 | 1979.88 | 511.39 | 25.88 | 1166.51 | 50.26 | 605.45 | 3995.71 |
| 2014 | 21,168.67 | 7894.76 | 1938.05 | 462.96 | 25.88 | 1149.36 | 45.67 | 680.98 | 4073.04 |
| 2015 | 22,643.67 | 7679.50 | 2381.22 | 596.39 | 12.12 | 705.50 | 73.90 | 886.07 | 3902.89 |
| 2016 | 22,045.80 | 8057.67 | 2517.09 | 639.85 | 16.86 | 733.78 | 76.72 | 982.98 | 3967.00 |
| 2017 | 21,553.65 | 8451.43 | 2203.14 | 559.71 | 40.55 | 767.61 | 61.62 | 1155.04 | 4399.41 |
| 2018 | 21,138.82 | 9074.46 | 2434.95 | 720.74 | 40.68 | 643.98 | 173.37 | 1615.87 | 4892.65 |
| 2019 | 20,527.87 | 9103.78 | 3110.83 | 622.68 | 47.33 | 676.81 | 148.25 | 1912.40 | 4995.77 |
| 2020 | 20,126.74 | 9335.06 | 2987.26 | 618.18 | 20.07 | 659.35 | 133.57 | 1897.15 | 5018.55 |
| Year | Energy Consumption per Unit GDP in Beijing | Energy Consumption per Unit GDP in Tianjin | Energy Consumption per Unit GDP in Hebei Province |
|---|---|---|---|
| 2008 | 0.49 | 0.79 | 1.51 |
| 2009 | 0.47 | 0.77 | 1.47 |
| 2010 | 0.42 | 0.74 | 1.28 |
| 2011 | 0.39 | 0.67 | 1.15 |
| 2012 | 0.37 | 0.57 | 1.08 |
| 2013 | 0.34 | 0.55 | 1.04 |
| 2014 | 0.32 | 0.52 | 1.00 |
| 2015 | 0.30 | 0.50 | 1.04 |
| 2016 | 0.28 | 0.45 | 0.99 |
| 2017 | 0.25 | 0.42 | 0.89 |
| 2018 | 0.24 | 0.42 | 0.89 |
| 2019 | 0.21 | 0.58 | 0.93 |
| 2020 | 0.19 | 0.57 | 0.90 |
| Year | Proportion of Coal in Total Energy Consumption (%) | Proportion of Oil in Total Energy Consumption (%) | Proportion of Natural Gas in Total Energy Consumption (%) |
|---|---|---|---|
| 2008 | 46.13 | 27.57 | 12.72 |
| 2009 | 43.08 | 27.65 | 14.01 |
| 2010 | 29.59 | 30.94 | 14.58 |
| 2011 | 26.66 | 32.92 | 14.02 |
| 2012 | 25.22 | 31.61 | 17.11 |
| 2013 | 23.31 | 32.19 | 18.20 |
| 2014 | 20.37 | 32.56 | 21.09 |
| 2015 | 13.05 | 33.79 | 29.18 |
| 2016 | 9.22 | 33.14 | 31.88 |
| 2017 | 5.06 | 34.00 | 32.00 |
| 2018 | 2.77 | 34.14 | 34.17 |
| 2019 | 1.81 | 34.55 | 34.01 |
| 2020 | 1.50 | 29.27 | 37.16 |
| Year | Proportion of Coal in Total Energy Consumption (%) | Proportion of Oil in Total Energy Consumption (%) | Proportion of Natural Gas in Total Energy Consumption (%) |
|---|---|---|---|
| 2008 | 64.00 | 23.10 | 4.20 |
| 2009 | 68.13 | 20.54 | 3.75 |
| 2010 | 68.49 | 32.83 | 4.11 |
| 2011 | 67.27 | 32.98 | 4.16 |
| 2012 | 70.25 | 30.12 | 5.40 |
| 2013 | 65.06 | 31.88 | 5.82 |
| 2014 | 59.96 | 28.12 | 6.78 |
| 2015 | 53.00 | 27.76 | 9.34 |
| 2016 | 50.87 | 25.35 | 11.20 |
| 2017 | 48.07 | 29.64 | 12.92 |
| 2018 | 46.70 | 30.25 | 15.84 |
| 2019 | 43.30 | 29.36 | 16.19 |
| 2020 | 44.14 | 24.57 | 17.71 |
| Year | Proportion of Coal in Total Energy Consumption (%) | Proportion of Oil in Total Energy Consumption (%) | Proportion of Natural Gas in Total Energy Consumption (%) |
|---|---|---|---|
| 2008 | 92.31 | 6.67 | 0.94 |
| 2009 | 92.51 | 6.21 | 1.21 |
| 2010 | 89.71 | 7.75 | 1.51 |
| 2011 | 89.09 | 8.12 | 1.66 |
| 2012 | 88.86 | 7.48 | 2.04 |
| 2013 | 88.69 | 7.22 | 2.23 |
| 2014 | 88.46 | 6.98 | 2.54 |
| 2015 | 88.83 | 5.99 | 3.13 |
| 2016 | 87.33 | 6.23 | 3.42 |
| 2017 | 86.05 | 6.14 | 3.94 |
| 2018 | 83.61 | 4.47 | 5.49 |
| 2019 | 81.96 | 5.86 | 6.61 |
| 2020 | 80.51 | 5.67 | 7.00 |
| Year | Beijing | Tianjin | Hebei |
|---|---|---|---|
| 2008 | 2432.56 | 2789.24 | 14,179.90 |
| 2009 | 2431.82 | 2913.69 | 15,321.11 |
| 2010 | 2380.16 | 3884.43 | 15,846.38 |
| 2011 | 2226.46 | 4284.94 | 17,766.02 |
| 2012 | 2161.72 | 4098.95 | 18,060.52 |
| 2013 | 1861.32 | 4304.74 | 18,091.22 |
| 2014 | 1855.37 | 4045.31 | 16,987.69 |
| 2015 | 1533.98 | 3806.89 | 18,358.51 |
| 2016 | 1231.58 | 3495.90 | 17,995.39 |
| 2017 | 1101.71 | 3470.89 | 17,452.94 |
| 2018 | 1017.06 | 3513.04 | 17,300.23 |
| 2019 | 987.27 | 3484.27 | 17,250.41 |
| 2020 | 834.19 | 3229.21 | 16,877.81 |
| Year | Beijing | Tianjin | Hebei |
|---|---|---|---|
| 2008 | 0.21 | 0.41 | 0.88 |
| 2009 | 0.19 | 0.38 | 0.88 |
| 2010 | 0.16 | 0.42 | 0.77 |
| 2011 | 0.14 | 0.38 | 0.72 |
| 2012 | 0.12 | 0.32 | 0.68 |
| 2013 | 0.09 | 0.30 | 0.64 |
| 2014 | 0.09 | 0.26 | 0.58 |
| 2015 | 0.07 | 0.23 | 0.62 |
| 2016 | 0.05 | 0.20 | 0.57 |
| 2017 | 0.04 | 0.19 | 0.49 |
| 2018 | 0.03 | 0.19 | 0.48 |
| 2019 | 0.03 | 0.25 | 0.49 |
| 2020 | 0.02 | 0.23 | 0.47 |
| Secondary Indicators | Tertiary Indicators | Indicator Variability | Indicator Conflict | Amount of Information | Weight |
|---|---|---|---|---|---|
| B1 (0.3600) | C1 | 0.338 | 3.867 | 1.307 | 0.0744 |
| C2 | 0.347 | 3.828 | 1.327 | 0.0755 | |
| C3 | 0.282 | 8.094 | 2.281 | 0.1299 | |
| C4 | 0.357 | 4.05 | 1.447 | 0.0823 | |
| B2 (0.4000) | C5 | 0.363 | 12.793 | 4.647 | 0.2645 |
| C6 | 0.444 | 5.352 | 2.378 | 0.1354 | |
| B3 (0.2400) | C7 | 0.335 | 4.21 | 1.411 | 0.0803 |
| C8 | 0.288 | 4.443 | 1.278 | 0.0728 | |
| C9 | 0.29 | 5.131 | 1.49 | 0.0848 |
| Secondary Indicators | Tertiary Indicators | Indicator Variability | Indicator Conflict | Amount of Information | Weight |
|---|---|---|---|---|---|
| B1 (0.4100) | C1 | 0.376 | 5.737 | 2.159 | 0.1022 |
| C2 | 0.389 | 5.336 | 2.075 | 0.0982 | |
| C3 | 0.28 | 8.087 | 2.268 | 0.1074 | |
| C4 | 0.37 | 5.625 | 2.08 | 0.0985 | |
| B2 (0.2600) | C5 | 0.351 | 7.162 | 2.511 | 0.1189 |
| C6 | 0.279 | 11.365 | 3.168 | 0.1500 | |
| B3 (0.3300) | C7 | 0.354 | 5.343 | 1.894 | 0.0896 |
| C8 | 0.361 | 7.944 | 2.871 | 0.1359 | |
| C9 | 0.293 | 7.164 | 2.098 | 0.0993 |
| Secondary Indicators | Tertiary Indicators | Indicator Variability | Indicator Conflict | Amount of Information | Weight |
|---|---|---|---|---|---|
| B1 (0.4800) | C1 | 0.342 | 7.696 | 2.631 | 0.1114 |
| C2 | 0.348 | 7.348 | 2.557 | 0.1083 | |
| C3 | 0.35 | 10.18 | 3.563 | 0.1509 | |
| C4 | 0.326 | 8.274 | 2.696 | 0.1141 | |
| B2 (0.2300) | C5 | 0.34 | 6.851 | 2.331 | 0.0987 |
| C6 | 0.299 | 9.968 | 2.984 | 0.1263 | |
| B3 (0.2900) | C7 | 0.29 | 6.612 | 1.918 | 0.0812 |
| C8 | 0.325 | 7.26 | 2.36 | 0.0999 | |
| C9 | 0.304 | 8.489 | 2.581 | 0.1093 |
| Year | Energy Consumption and Carbon Emission Capacity | Carbon Transfer Capacity | Technology and Carbon Sink Capacity | Carbon Achievement Contributing to Comprehensive Capacity |
|---|---|---|---|---|
| 2008 | 0.0580 | 0.1541 | 0.0011 | 0.0828 |
| 2009 | 0.0986 | 0.0808 | 0.0606 | 0.0824 |
| 2010 | 0.1255 | 0.0991 | 0.1187 | 0.1133 |
| 2011 | 0.1946 | 0.1253 | 0.1081 | 0.1461 |
| 2012 | 0.2127 | 0.1145 | 0.1359 | 0.1550 |
| 2013 | 0.2442 | 0.1037 | 0.1435 | 0.1638 |
| 2014 | 0.2572 | 0.0964 | 0.1792 | 0.1742 |
| 2015 | 0.3096 | 0.2191 | 0.1894 | 0.2446 |
| 2016 | 0.3085 | 0.2428 | 0.2005 | 0.2563 |
| 2017 | 0.2818 | 0.2614 | 0.1407 | 0.2398 |
| 2018 | 0.2322 | 0.2888 | 0.1923 | 0.2453 |
| 2019 | 0.2201 | 0.2931 | 0.2213 | 0.2532 |
| 2020 | 0.2046 | 0.3021 | 0.2521 | 0.2550 |
| Year | Energy Consumption and Carbon Emission Capacity | Carbon Transfer Capacity | Technology and Carbon Sink Capacity | Carbon Achievement Contributing to Comprehensive Capacity |
|---|---|---|---|---|
| 2008 | 0.1287 | 0.2490 | 0.0153 | 0.1226 |
| 2009 | 0.1358 | 0.1502 | 0.0070 | 0.0970 |
| 2010 | 0.0961 | 0.1350 | 0.0464 | 0.0898 |
| 2011 | 0.1277 | 0.0941 | 0.1011 | 0.1102 |
| 2012 | 0.2379 | 0.0750 | 0.1453 | 0.1650 |
| 2013 | 0.2434 | 0.0574 | 0.1884 | 0.1769 |
| 2014 | 0.2617 | 0.0566 | 0.2565 | 0.2067 |
| 2015 | 0.2520 | 0.0536 | 0.2218 | 0.1905 |
| 2016 | 0.2727 | 0.0709 | 0.2152 | 0.2013 |
| 2017 | 0.2794 | 0.1064 | 0.1452 | 0.1901 |
| 2018 | 0.2506 | 0.1367 | 0.2054 | 0.2061 |
| 2019 | 0.2462 | 0.1388 | 0.2212 | 0.2101 |
| 2020 | 0.2105 | 0.1467 | 0.2344 | 0.2018 |
| Year | Energy Consumption and Carbon Emission Capacity | Carbon Transfer Capacity | Technology and Carbon Sink Capacity | Carbon Achievement Contributing to Comprehensive Capacity |
|---|---|---|---|---|
| 2008 | 0.2657 | 0.1592 | 0.0001 | 0.1642 |
| 2009 | 0.2095 | 0.0771 | 0.0546 | 0.1341 |
| 2010 | 0.2600 | 0.0935 | 0.1226 | 0.1819 |
| 2011 | 0.1897 | 0.0816 | 0.1101 | 0.1418 |
| 2012 | 0.1935 | 0.0467 | 0.0536 | 0.1192 |
| 2013 | 0.1961 | 0.0444 | 0.0674 | 0.1239 |
| 2014 | 0.2768 | 0.0728 | 0.0987 | 0.1782 |
| 2015 | 0.1746 | 0.0696 | 0.1105 | 0.1319 |
| 2016 | 0.2078 | 0.0769 | 0.0931 | 0.1444 |
| 2017 | 0.2583 | 0.0753 | 0.1402 | 0.1820 |
| 2018 | 0.2686 | 0.1073 | 0.2113 | 0.2149 |
| 2019 | 0.2791 | 0.1204 | 0.2311 | 0.2287 |
| 2020 | 0.2803 | 0.1211 | 0.2521 | 0.2355 |
Disclaimer/Publisher’s Note: The statements, opinions and data contained in all publications are solely those of the individual author(s) and contributor(s) and not of MDPI and/or the editor(s). MDPI and/or the editor(s) disclaim responsibility for any injury to people or property resulting from any ideas, methods, instructions or products referred to in the content. |
© 2023 by the authors. Licensee MDPI, Basel, Switzerland. This article is an open access article distributed under the terms and conditions of the Creative Commons Attribution (CC BY) license (https://creativecommons.org/licenses/by/4.0/).
Share and Cite
Wang, J.; Qin, L.; Chu, H. Evaluation of Carbon Emission and Carbon Contribution Capacity Based on the Beijing–Tianjin–Hebei Region of China. Sustainability 2023, 15, 5824. https://doi.org/10.3390/su15075824
Wang J, Qin L, Chu H. Evaluation of Carbon Emission and Carbon Contribution Capacity Based on the Beijing–Tianjin–Hebei Region of China. Sustainability. 2023; 15(7):5824. https://doi.org/10.3390/su15075824
Chicago/Turabian StyleWang, Junling, Lihong Qin, and Hanfang Chu. 2023. "Evaluation of Carbon Emission and Carbon Contribution Capacity Based on the Beijing–Tianjin–Hebei Region of China" Sustainability 15, no. 7: 5824. https://doi.org/10.3390/su15075824