Article

Early Highway Construction Cost Estimation: Selection of Key Cost Drivers

Faculty of Civil Engineering, University of Belgrade, 11000 Belgrade, Serbia
*
Author to whom correspondence should be addressed.
Sustainability 2023, 15(6), 5584; https://doi.org/10.3390/su15065584
Submission received: 15 February 2023 / Revised: 15 March 2023 / Accepted: 20 March 2023 / Published: 22 March 2023
(This article belongs to the Special Issue Value Co-Creation in Sustainable Project Society)

Abstract

:
Cost estimates in the early stages of project development are essential for making the right decisions, but they are a huge challenge and risk for owners and potential contractors due to limited information about the characteristics of a future highway project. Whereas previous studies were mainly focused on achieving the highest possible estimation accuracy, this paper aims to propose cost-estimation models that can provide satisfactory accuracy with the least possible effort and to compare the perspectives of owners and contractors as the key stakeholders on projects. To determine cost drivers (CDs) that have a high influence on highway-construction costs and require low effort for their establishment, a questionnaire survey was conducted. Based on the key stakeholders’ perceptions and collected data set, cost-estimation models were developed using multiple-regression analysis, artificial neural networks, and XGBoost. The results show that reasonable cost-estimation accuracy can be achieved with relatively low effort for three CDs for the owners’ perspective and five CDs for the contractors’ perspective. Additional inclusion of input CDs in models does not necessarily imply an increase in accuracy. Also, the questionnaire results show that owners are more concerned about environmental issues, whereas contractors are more concerned about the possible changes in resource prices (especially after recent high increases caused by COVID-19 and the Russia–Ukraine war). These findings can help owners and potential contractors in intelligent decision-making in the early stages of future highway-construction projects.

1. Introduction

One of the bases for the functioning of a society and its economy is the transport of goods and passengers. Roads, as the most common type of transport infrastructure, present their main foundation. According to the modal split for three types of transport infrastructure, 77.4% of the total freight traffic in the EU in 2020 was carried out using road infrastructure, followed by rail and inland waterways (16.8% and 5.8%, respectively) [1]. Moreover, road infrastructure presents the most dominant type of transport infrastructure for passenger traffic, with a share of over 90% in 2018 [2]. Although roads play a vital role in social and economic development [3], it must not be ignored that they are at the same time a major cause of environmental disturbances [4,5,6].
Highways are the highest class of roads. Most developed countries have a well-developed highway network. It is undeniable that there is a need to expand the highway infrastructure in developing countries. Statistics from the International Transport Forum (ITF) show that investments in highway-construction projects in developing countries that aspire to EU membership in the last decade have seen a large increase compared to the previous period [7].
Planning of new highways is based on consideration of current and future transportation needs, keeping in mind the request to complete the highway construction with minimal costs and environmental impact. In the early stages of planning, it is difficult to obtain accurate cost estimates for new highway construction [8]. These estimates are crucial for prefeasibility and feasibility studies and to make the right decisions on whether to construct a new highway [9,10]. When the budget for roadwork programs is constrained, cost underestimations and overestimations could cause serious problems [9]. Cost underestimations [11] lead to inappropriate resource allocations and large cost overruns [12], whereas overestimations could detain funds that might be applied elsewhere [9].
Worldwide, a large number of government institutions in charge of transportation infrastructure encounter numerous challenges when making cost estimates for new highway-construction projects. Their estimates may differ significantly from the estimates provided by contractors [13]. In particular, cost estimations for design–build projects in the early planning stages, when scarce information is available and only the first steps in the design process have started, are a huge challenge and risk both for government institutions [14] and potential contractors. Cost estimates in the initial stages of project development mean that cost conclusions are drawn based on historical data from previous projects. The lack of a database built on previous projects and the unavailability of reports on finished projects are frequent issues in developing countries. Even when they exist, available databases are often unstructured, limited in scope, and contain incoherent and incomplete information that can impact sound decision-making. Historical data collection requires great effort [15]. Apart from a reasonable level of accuracy, for the cost estimates at the initial stages of planning highway construction, the relatively low effort required to conduct them could be essential.
In addition, in the initial phases of a project, only the rough design outline is available, so assumptions must be made about the characteristics of the future construction project, which makes the cost estimate even more difficult and imprecise.
The most recent studies have shown that cost estimations in the early stages of project development are still a challenging problem. Keeping in mind that cost estimates are one of the most important parameters for the planning and successful completion of complex infrastructure projects, in [16] the authors proposed models for obtaining early cost and material-quantity estimates for underground metro stations. Uysal and Sonmez recognized the problem with a limited number of data in the early stages of project development and presented the bagging case-based reasoning (CBR) method to improve the accuracy of conceptual cost estimation [17].
The unit costs of highway construction vary considerably across countries and over time, and also in the same country in the same year [9] due to topography and terrain type, resource prices, inflation rate, and so on. Apart from the aforementioned, the country’s economic and construction-market conditions [18], as well as the state of the society in which the project is implemented, can be substantial cost drivers (CDs).
The establishment of CD values for a certain project requires some effort. The effort here refers to the time and money that needs to be invested to determine the value of the CD. Among all categories, design-related CDs require the highest degree of effort for their establishment. Design development is a time-consuming process that demands large costs for its preparation. To conduct the cost estimates in the initial stages of project development, a particular level of project definition (or effort) is required [15]. Gardner et al. investigated the effort required for conceptual cost estimation and stated that the sooner the initial estimate is developed, the cost and time required is commensurately lower [15]. As the project phases progress, the design-related CDs’ details and accuracy increase, whereas other CDs, which are mostly publicly available (e.g., inflation rate), remain the same.
Determining the key CDs is a critical stage in the development of the cost-estimation model because the accuracy of the estimate depends on it [19]. Hashemi et al. reviewed current practices in cost estimation in construction projects based on machine-learning (ML) techniques and concluded that expert knowledge has a valuable influence on key CD selection [20]. Kim conducted the AHP method and evaluated key CDs and determined their weights based on experts’ viewpoints [21]. Adel et al. performed in-depth interviews with 14 professionals and asked them to choose variables that are traditionally available in the conceptual-planning stage and examine their characteristics [22]. One of the most widely used methods for CD selection is a questionnaire [15,23,24,25,26,27]. In addition to other methods, Meharie et al. used a questionnaire to select input variables for preliminary cost estimation of highway-construction projects and concluded that the most significant variables are project size, bridge number, and inflation rate [28].
Considering different stakeholders’ views is very important for facilitating the abovementioned cost-estimation issues. The questionnaire proved to be a suitable tool for gathering information about the perceptions of different stakeholders [29,30]. For example, the questionnaire survey was implemented in [25] to gather information about stakeholders’ perceptions of factors affecting the accuracy of cost estimates. The authors concluded that there is a strong agreement between contractors and consultants. Doloi explored the perceptions of different stakeholders on attributes influencing cost estimation using structured interviews [31]. Structured interviews were conducted with six stakeholders operating as major contractors, land developer, investor, financier, and consultant. Although rich in a wide range of respondents’ project roles, the study could not provide a deeper insight into stakeholders’ perceptions since it covered 13 key attributes that are universal and not related to the specific type of construction projects.
Numerous variables can be tested on their significance in the cost estimations [9] of road-infrastructure projects and selected as key CDs. For example, Mahdavian et al. tested 69 input variables grouped into five categories—socio-economic, energy market, construction market, U.S. economy, and temporal category—and concluded that the construction-market category has the greatest influence [18]. Peško et al. established the correlations between the amounts of basic materials necessary for the realization of roadway construction and landscaping works and the costs and duration of construction of urban roads [32]. Sodikov introduced the concept of levels of data analysis (regional, country, and project level) and analyzed various input variables, such as terrain type, country GDP, and work duration per pavement area [33]. Cirilovic et al. explored the idea of considering some more specific variables, such as whether the country is a net oil exporter or importer, fuel prices, and the country’s climate conditions [9]. Zhang et al. developed a parametric cost-estimation model while simultaneously analyzing the leading economic indicators and project-related factors [34]. Wilmot and Cheng proposed a composite highway-construction cost-estimation model constructed of submodels that were developed based on independent variables, such as price-index values for labor, materials, and equipment, and variables describing contract characteristics and the contracting environment [35].
The application of regression analysis and artificial neural networks (ANN) for the development of cost-estimation models for road-infrastructure projects is widespread. Regression analysis has been used as both a CD-selection and predictive method [19]. Mahamid developed 10 multiple-regression analysis (MRA) models for road-construction cost estimation in the early stages of the project as a function of the amount of work and road dimensions [36]. Hegazy and Ayed modeled the costs of highway-construction projects in Canada based on the ANN algorithm [37]. In [38], the authors tested whether the greater flexibility in the relationship between input and output variables in ANNs leads to better performance than that achievable with regression analysis. Gardner et al. combined ANNs and bootstrap sampling to develop a stochastic cost-estimation model for highway projects [39]. Tijanić et al. modeled expected road-construction costs using a multilayer perceptron, a general-regression neural network, and a radial-basis-function neural network. For modeling purposes, the database of roads constructed in Croatia was used, and MLP and GRNN provided acceptable results [40].
Apart from already highlighted ML techniques, the current state-of-the-art techniques should be tested for the development of highway-construction cost-estimation models. eXtreme gradient boosting (XGBoost) is a recently developed [41] integrated machine-learning algorithm [42] based on gradient boosting [43]. Since it does not require substantial feature engineering and provides high performance, it has been widely employed [44]. In the construction-industry domain, XGBoost was used in several studies. Shehadeh et al. examined the potential of predicting the residual value of heavy construction equipment using XGBoost regression [41]. Among other algorithms, in [42], the authors used XGBoost to develop a prediction model for the productivity of a cutter-suction dredger, resulting in better prediction effects than other ML algorithms provided. In [45], the authors employed XGBoost integrated with genetic algorithms to predict the post-accident disability status of construction workers based on a data set of construction accidents recorded in Turkey. In [46], an XGBoost-based model for predicting green-building construction costs was developed as a decision-support tool for selecting the best bidder.
Despite the recognized challenges of and risks affiliated with cost estimates for new highway-construction projects, previous authors have remained silent on examining the perspectives of different stakeholders. This paper provides insight into the perspectives of owners and contractors as the key stakeholders on highway-construction projects concerning cost-estimation issues. It aims to identify key stakeholders’ perceptions of the degree of influence of CDs and the degree of effort required to establish CD values for a certain project. Additionally, it will compare the owners’ and contractors’ perspectives. Its secondary aim is to provide a model for the cost estimation of highway-construction projects in the early stages of project development and test the methodology for key CD selection in a case study based on stakeholders’ perspectives. This article examines 34 project characteristics clustered in seven categories (highway alignment, bridge, tunnel, contract, economic, social, and environmental) and their selection as the key CDs.

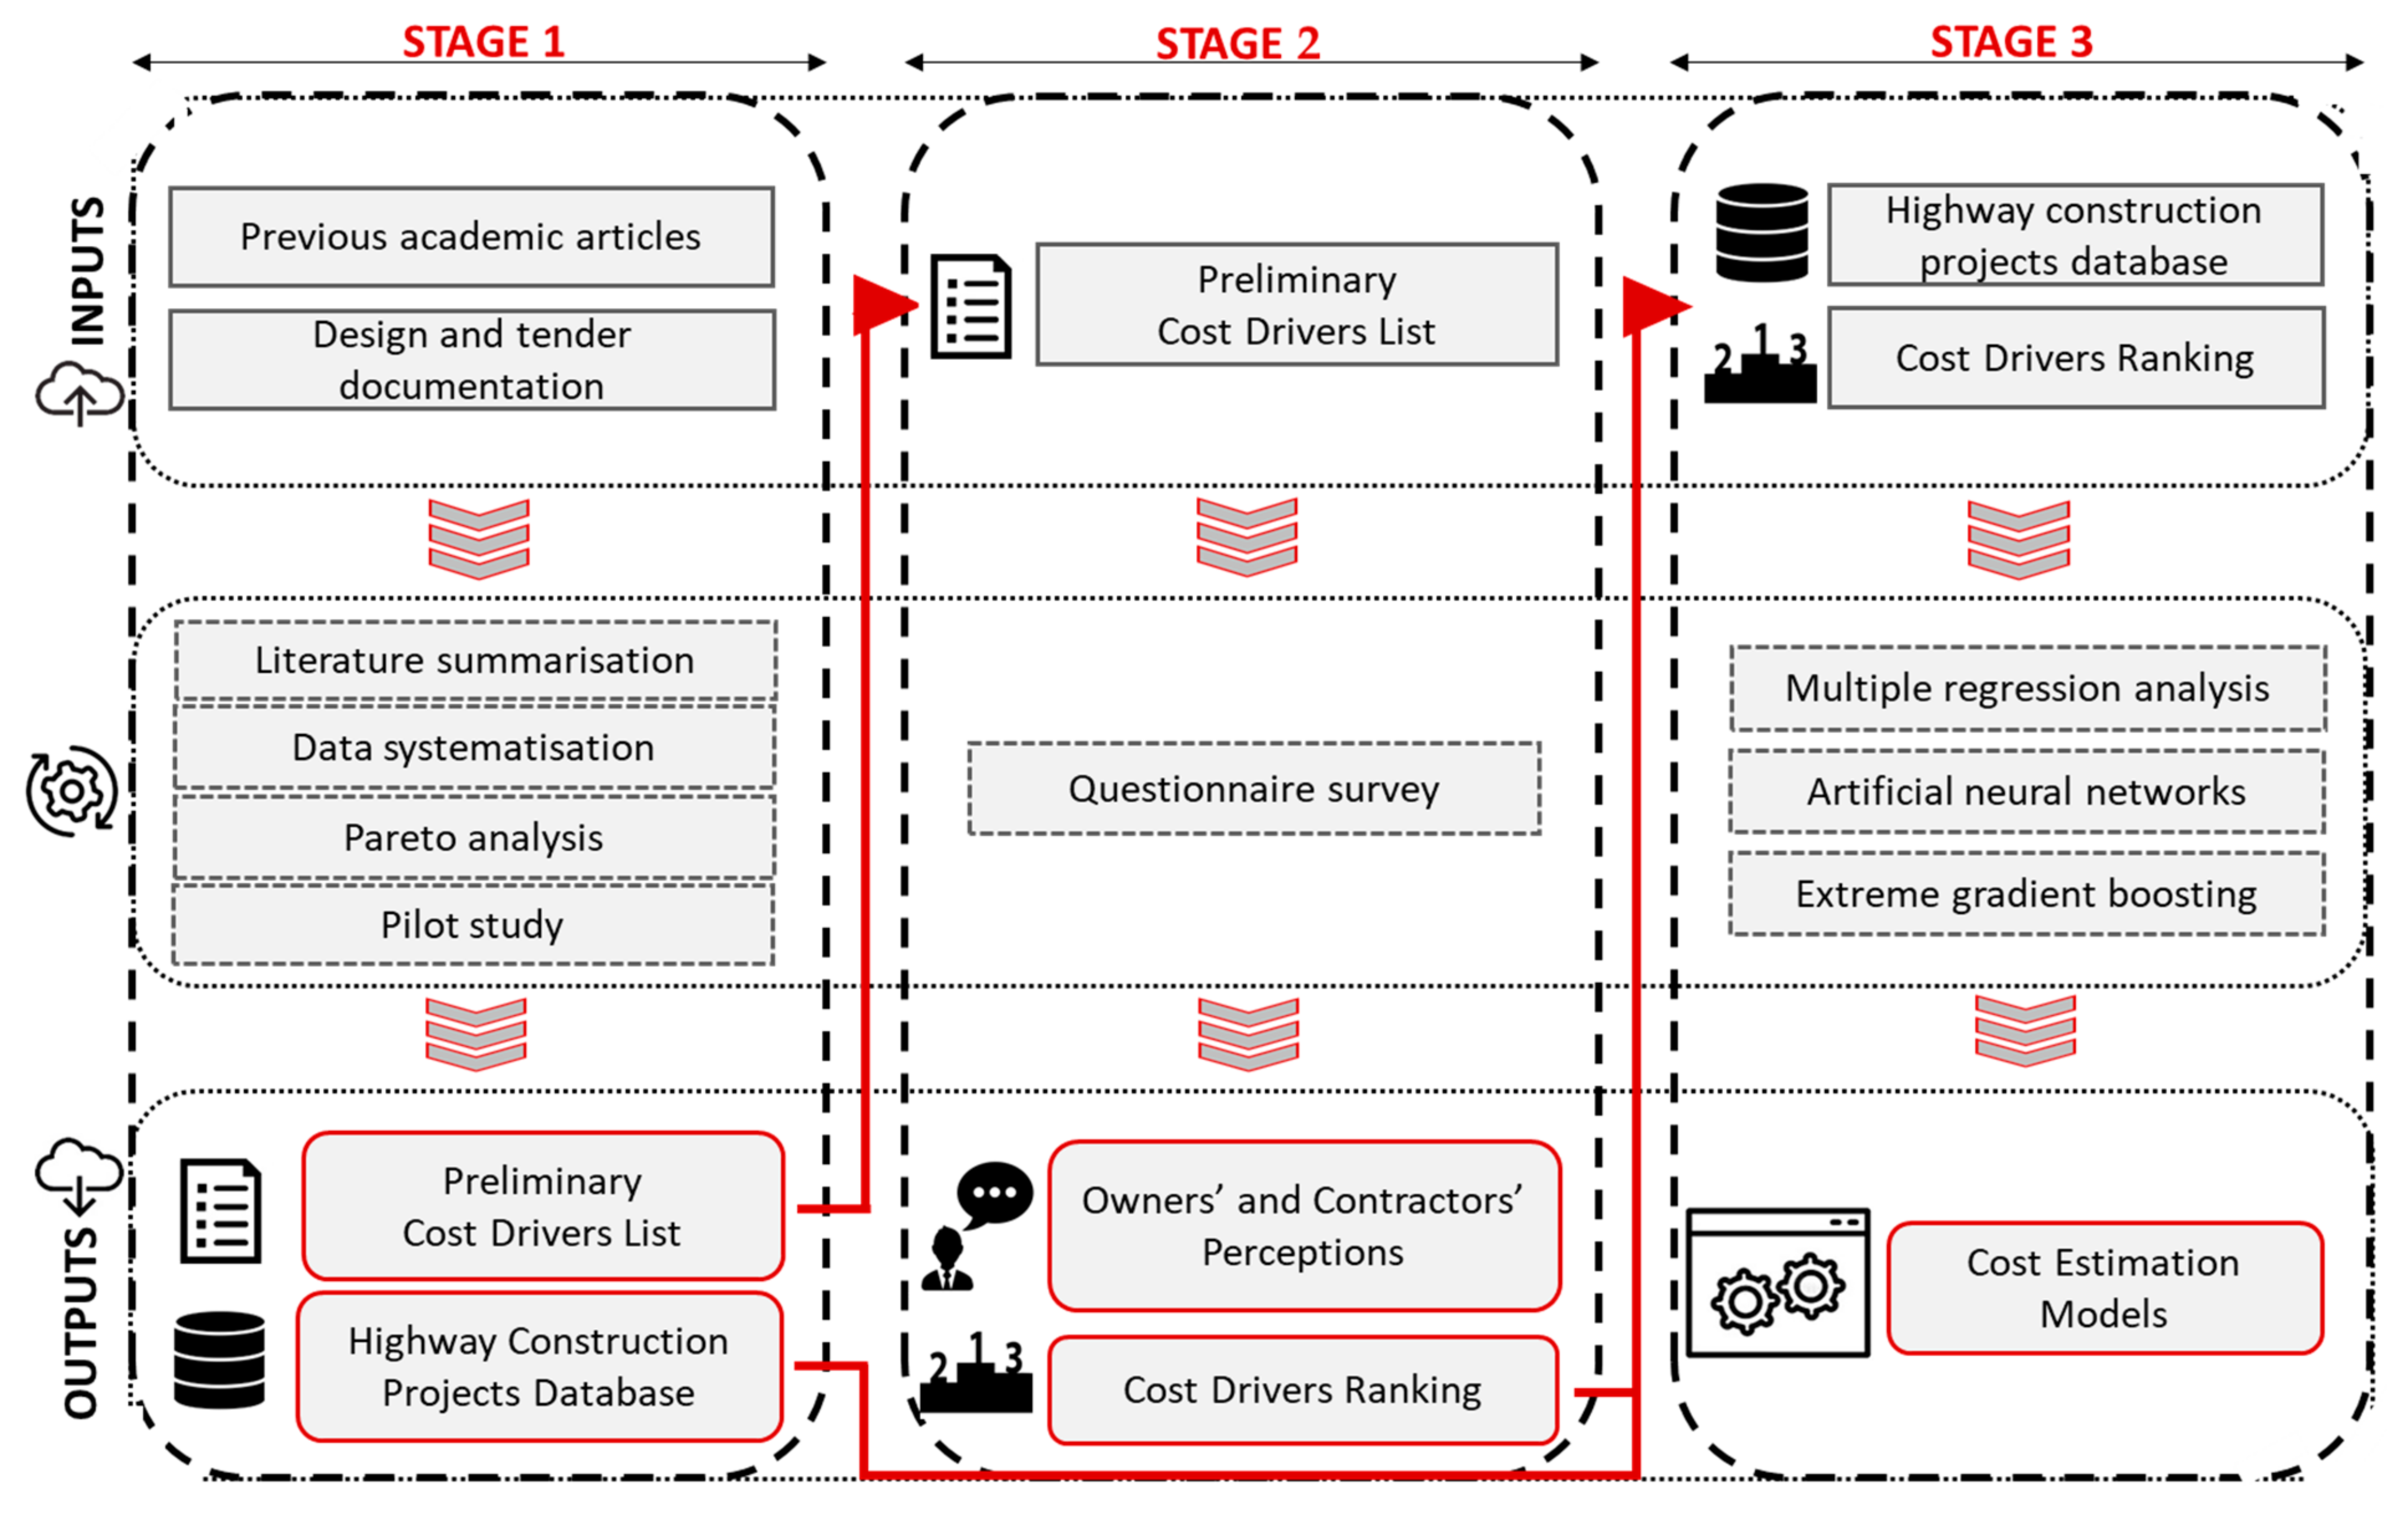
2. Research Methodology

In order to facilitate the above identified problems with highway-construction cost estimation in the early stages of project development, the main research objectives were identified: to determine key cost drivers and to compare key stakeholders’ points of view on this issue. The research objectives will be achieved with the proposed research methodology, organized into three stages.
Two main hypotheses were formulated in order to achieve the stated main research objectives:
  • The satisfactory accuracy of the early highway-construction cost estimation can be achieved with low effort and only a few key CDs.
  • The key CDs are different from the owners’ and contractors’ points of view.
The research methodology, consisting of three stages, is shown in Figure 1. The outputs of every stage present the inputs for the next stages. The purpose of the first stage was to collect data on previous highway-construction projects and to form the Highway Construction Projects Database. An additional output of this stage is the Preliminary Cost Drivers List, which will serve as input for the second stage. The second stage of the research methodology refers to a questionnaire survey aimed at gathering owners’ and contractors’ perceptions on cost drivers from the Preliminary Cost Drivers List and thus lead to Cost Drivers Ranking List based on respondents’ perceptions. In the third stage, highway-construction cost-estimation models are developed and validated based on the previously formed Highway Construction Projects Database (output of stage 1) and the Cost Drivers Ranking List (output of stage 2). In order to enable comparison between different estimation results, several methods were used for the development of the cost-estimation models: multiple-regression analysis, artificial neural networks, and eXtreme gradient boosting. Detailed explanations of all stages are provided in the following sections.

3. Preliminary Identification of Cost Drivers

This stage of research was aimed at identifying the Preliminary CDs List, which will be assessed further. CDs were identified based on a literature review and available historical data from previous projects. The literature review and data-collection and database-formation processes were conducted simultaneously. The literature review gave insight into relevant previously used CDs, whereas data collection enabled the identification of available project characteristics. The second step relied on Pareto analysis, which identified cost-significant types of works and thus their corresponding CDs. The final step was a pilot study with the goal to determine the final version of the Preliminary CDs List and questionnaire form.

3.1. Cost Drivers Identified through the Literature Review

An intensive literature review led to a comprehensive list of 189 CDs used in previous articles on road-cost estimation published between 1998 and 2021. After the elimination of duplicates and CDs irrelevant to the case study, Table 1 was formed, containing 18 CDs used in 20 selected studies. It can be concluded that the most frequent CDs were project duration and road length and width, followed by terrain type.
In addition, the authors reviewed academic articles on the cost estimation of bridge and tunnel projects. The most commonly used bridge CDs were bridge width and length, average pier height, and average span [52,53,54]. However, it is expected that extreme structures within the route will have a significant influence on costs, so the focus of this study is on the existence and characteristics of such structures. Consequently, the bridge CDs included in the analysis were the longest bridge length, the great pier height of extreme bridges, and the large span of extreme bridges.
The literature review of academic papers on tunnel-project cost estimation [55,56,57,58,59] gave insight into the previously used tunnel CDs. Some authors used tunnel dimensions, such as tunnel diameter [58,59], as input variables for model development. Given that the case study in this paper is highway-construction projects that have standardized dimensions, dimension-related variables were excluded from the analysis. The variables that define tunnel-construction technology were the soil category and tunneling-excavation method. One must note that the tunneling-excavation method incorporates soil conditions, since for certain geologic conditions there are more or fewer habitual excavation methods [58]. Accordingly, to avoid the multicollinearity problem only the tunneling-excavation method was examined.

3.2. Data Collection and Database Formation

This process aimed to systematize the data from the collected documentation to form a database of historical data on highway-construction projects. Collecting documentation required significant effort. Documentation was collected by contacting owners and design and contractor firms, and an agreement on data protection was made. Missing data on project characteristics were collected by interviewing project participants and from secondary sources. It took 10 months to collect the documentation and organize the data. For this research, historical documentation included highway-construction projects from Serbia, Bosnia and Herzegovina, North Macedonia, and Montenegro. Documentation included tender documentation and design documentation.
Four separate databases were created. The first and the most comprehensive one included detailed data on the characteristics of highway projects (e.g., number of interchanges, design speed, etc.) and their construction costs, systemized from the collected documentation. Besides the data on projects’ internal characteristics, the authors intended to collect the data on external parameters that might be correlated with highway-construction costs. The main objective was to include parameters whose determination in the early stages of project development does not require high effort [15], i.e., is not expensive and time consuming. Therefore, in an effort to satisfy the stated objective, publicly available external project characteristics were identified (e.g., unemployment rate, GDP growth rate, etc.).
The remaining databases contained detailed data on technical characteristics of cost-significant entities (see Section 3.3) within the highway alignment: tunnels, bridges, and interchanges. The purpose of creating separate databases was to enable in-depth analysis of individual cost-significant entities within each project and thus identification of their corresponding CDs.
The data sample included a total of 92 projects. Out of these 92 projects, five projects were related to highway reconstruction and rehabilitation and were excluded from further analysis. The aim was to achieve the highest possible homogeneity of the database. Eight contracts included the construction of large structures within the highway route (bridges, tunnels, and interchanges) and were only analyzed for the purpose of determining CDs related to the mentioned structures. Since 11 projects had incomplete data, they were left out of the scope of further analysis. The final number of analyzed projects was 68 highway construction projects (Table 2).
The data set covered highway-construction projects contracted in the period from September 2004 to September 2021. General information regarding the construction projects is shown in Table 3. The cost of the construction works of the case-study projects ranged from EUR 4.04 million to EUR 203.98 million. The average price of the works for the analyzed data sample was EUR 52.14 million, whereas the total value of all analyzed projects was EUR 3.55 billion. All values in local currencies were converted into EUR based on the average rate on the date the contract was signed. The planned duration of contracted works ranged between 480 days and 1440 days, whereas the total length of the sections varied between 1259 m and 36,609 m. The average length of highway-construction projects from the data set was 10,081 m.

3.3. Pareto Analysis

The second step in the preliminary identification of CDs was the identification of cost-significant types of works. The concept of cost-significant types of works is based on the so-called Pareto principle, which states that in most cases approximately 80% of the consequences come from 20% of the causes. The Pareto principle has been applied in few studies on cost estimation. For example, Sayed et al. [60] determined the key factors affecting the cost-estimation accuracy, Shehab et al. [61] identified 23 cost-significant bid items of water and sewer repair and replacement projects, and Beljkaš et al. [62] concluded that concrete and reinforcement types of works have a total percentage share of 77.3% of the total costs of integral bridges.
In an effort to apply this principle in determining cost-significant types of works and CDs, all cost items from the cost-breakdown structure (CBS) relating to the collected data set were examined. As the tender and design documentation for the analyzed data set were prepared in different countries and by different design and construction firms, their form differs from case to case. For this reason, the process of data preparation and analysis was complex and time consuming. Firstly, it was necessary to identify the identical types of works for all projects and their corresponding cost items in order to achieve data uniformity. Item-cost analysis and regrouping resulted in a uniform list of 15 types of works.
An analysis of the percentage share of all types of works in the total costs was carried out. The analysis of the data sample revealed that the cost-significant types of works contributed to an average of 76.34% of the total project cost. These types of works were highway alignment, bridges, tunnels, and interchanges, and they constituted 26.67% of types of works involved in highway-construction projects. The stated percentages are consistent with the Pareto principle, i.e., the 80:20 rule applies to the analyzed data set. Based on the cost-significant types of works, it can be concluded that within the highway route, the cost-significant entities are highway alignment, bridges, tunnels, and interchanges.

3.4. Pilot Study

The final step was a pilot study. The authors conducted separate interviews with three academic experts with more than 20 years of experience in construction-project management. The purpose of the pilot study was to clean up the proposed list of CDs by eliminating irrelevant CDs and adding new ones that experts considered significant, and to determine the final version of the questionnaire.
The experts’ suggestion, inter alia, was that the list of CDs should include variables related to environmental-protection measures, keeping in mind the importance of environmental issues. Hence, the additional Environmental category of CDs was included in the updated list. The need to consider environmental issues when making cost estimations of highway-construction projects has been suggested in the literature [63]. In addition, the variable expressing the existence of extreme structures within the highway route was introduced. This information is available in the early stages of project development, and experts deemed it crucial for cost estimation.
The pilot study also resulted in the suggestion of the elimination of some CDs from the Preliminary CDs List and questionnaire. Besides basic technical parameters that describe characteristics of a highway route and cost-significant entities (e.g., design speed, longest tunnel length, and length of bridges within the interchanges), additional requirements for the civil-engineering objects (e.g., durability, stability, and load capacity) were originally considered by the authors as potential CDs. Experts deemed that these additional technical parameters as requirements for objects on highway construction should not be included in the questionnaire survey given that they are considered to be in line with standard requirements and legally binding technical specifications.
The result of the pilot study was the final version of the Preliminary CDs List, which contained 34 drivers clustered in seven categories: Highway alignment, Bridge, Tunnel, Contract, Economic, Social, and Environmental. These CDs can be seen in Section 4.4.3, where their rankings according to the questionnaire results are shown.

4. Questionnaire Survey

A questionnaire survey is an effective approach for gathering information about opinions, attitudes, perceptions, and characteristics of a population sample [64,65]. In this research, the purpose of a questionnaire was to gather information about the key stakeholders’ perceptions of the degree of influence of CDs and the degree of effort required to establish CDs’ values. The targeted population in this research was experienced professionals that have been involved in highway-construction projects as owners or contractors.

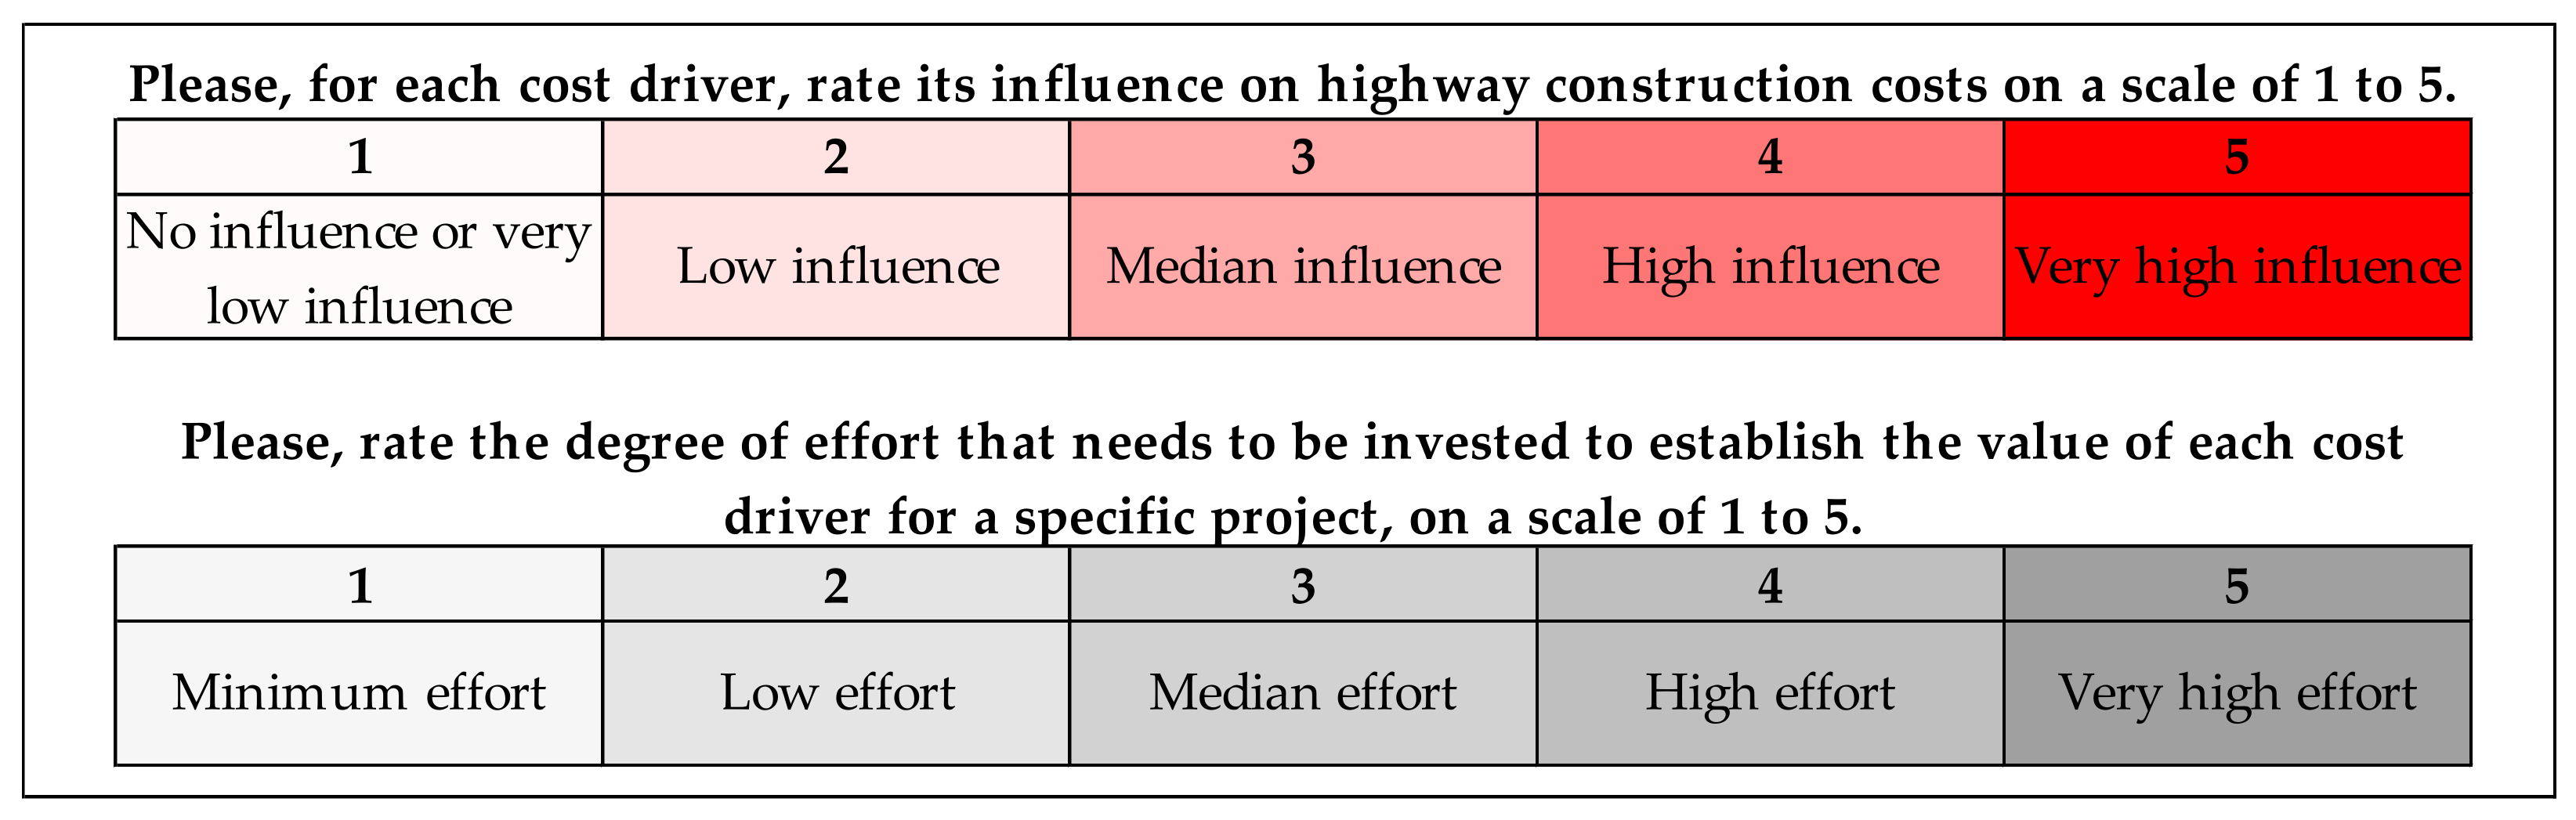
4.1. Questionnaire Design

The questionnaire was organized into three sections. The first section aimed to establish the respondents’ profiles. This section contained questions about the years of respondents’ professional experience and their role in highway-construction projects. The second section included the previously identified Preliminary CDs List and aimed to determine the perceived degree of influence of CDs on highway-construction costs. The respondents were asked to rate the degree of influence that each of the CDs has on highway-construction costs. The same Preliminary CDs List was used in the third section, where respondents were asked to rate the degree of effort that has to be invested to establish a CD’s value for a certain project.
As shown in Figure 2, the questions within the second and third sections were designed using a five-point Likert scale, with respondents being asked to select the most appropriate response. In order to reduce respondent bias, the response option “I don’t know” was included following the literature recommendations [66].

4.2. Respondents’ Profile

The questionnaire survey was conducted in December 2022. The targeted respondents were professionals engaged in highway-construction projects in Serbia, Bosnia and Herzegovina, North Macedonia, and Montenegro who had experience as contractors or owners. A total of 150 designed questionnaires were distributed either by hard copy or online via email to the addresses of professionals. Respondent professionals came from owner companies or domestic- and foreign-contractor companies operating in the abovementioned countries. In order to ensure a high response rate and the best possible proportionate distribution by stakeholder type and years of experience, respondents were introductorily contacted via telephone or email. They became familiar with the survey objectives and instructions for filling out the questionnaire.
Out of 150 distributed questionnaires, 96 responses were obtained, which resulted in a response rate of 64%. Compared to other studies conducted in the construction-management field [67,68], this can be considered a satisfactory response rate. A brief summarization of the respondents’ profile is given in Table 4.
Despite the relatively small sample, the response quality can be considered quite reliable due to the fact that respondents were closely related to the subject of study and highly experienced. Most of the respondents (73%) had long professional experience (more than 10 years), of which 35% had more than 20 years of professional experience. The distribution among contractors and owners was commensurate, with contractors participating at 53.13% and owners at 46.87%. All participants were informed that their responses would be treated in line with the anonymity-protection statement.

4.3. Questionnaire Reliability

The questionnaire reliability was assessed using Cronbach’s α coefficient, as one of the most widely used reliability tests for a questionnaire with Likert scales. It measures the internal consistency of survey items. If Cronbach’s α coefficient is equal to or greater than 0.7, the indicator is thought to be credible [69]. In this research, the overall Cronbach’s α coefficient was 0.963, and the values for the second and third sections were 0.936 and 0.969, respectively. Since Cronbach’s α values exceeded 0.7, the survey can be considered consistent and reliable.

4.4. Questionnaire Results and Discussion

This section shows and discusses the findings and results of the questionnaire survey. The survey objectives were:
  • To identify stakeholders’ perceptions of the degree of influence of CDs on highway-construction costs and the degree of effort required to establish CD values for a certain project;
  • To compare owners’ and contractors’ perceptions and to test the degree of agreement between them;
  • To rank CDs according to Euclidean distance from the ideal CD.

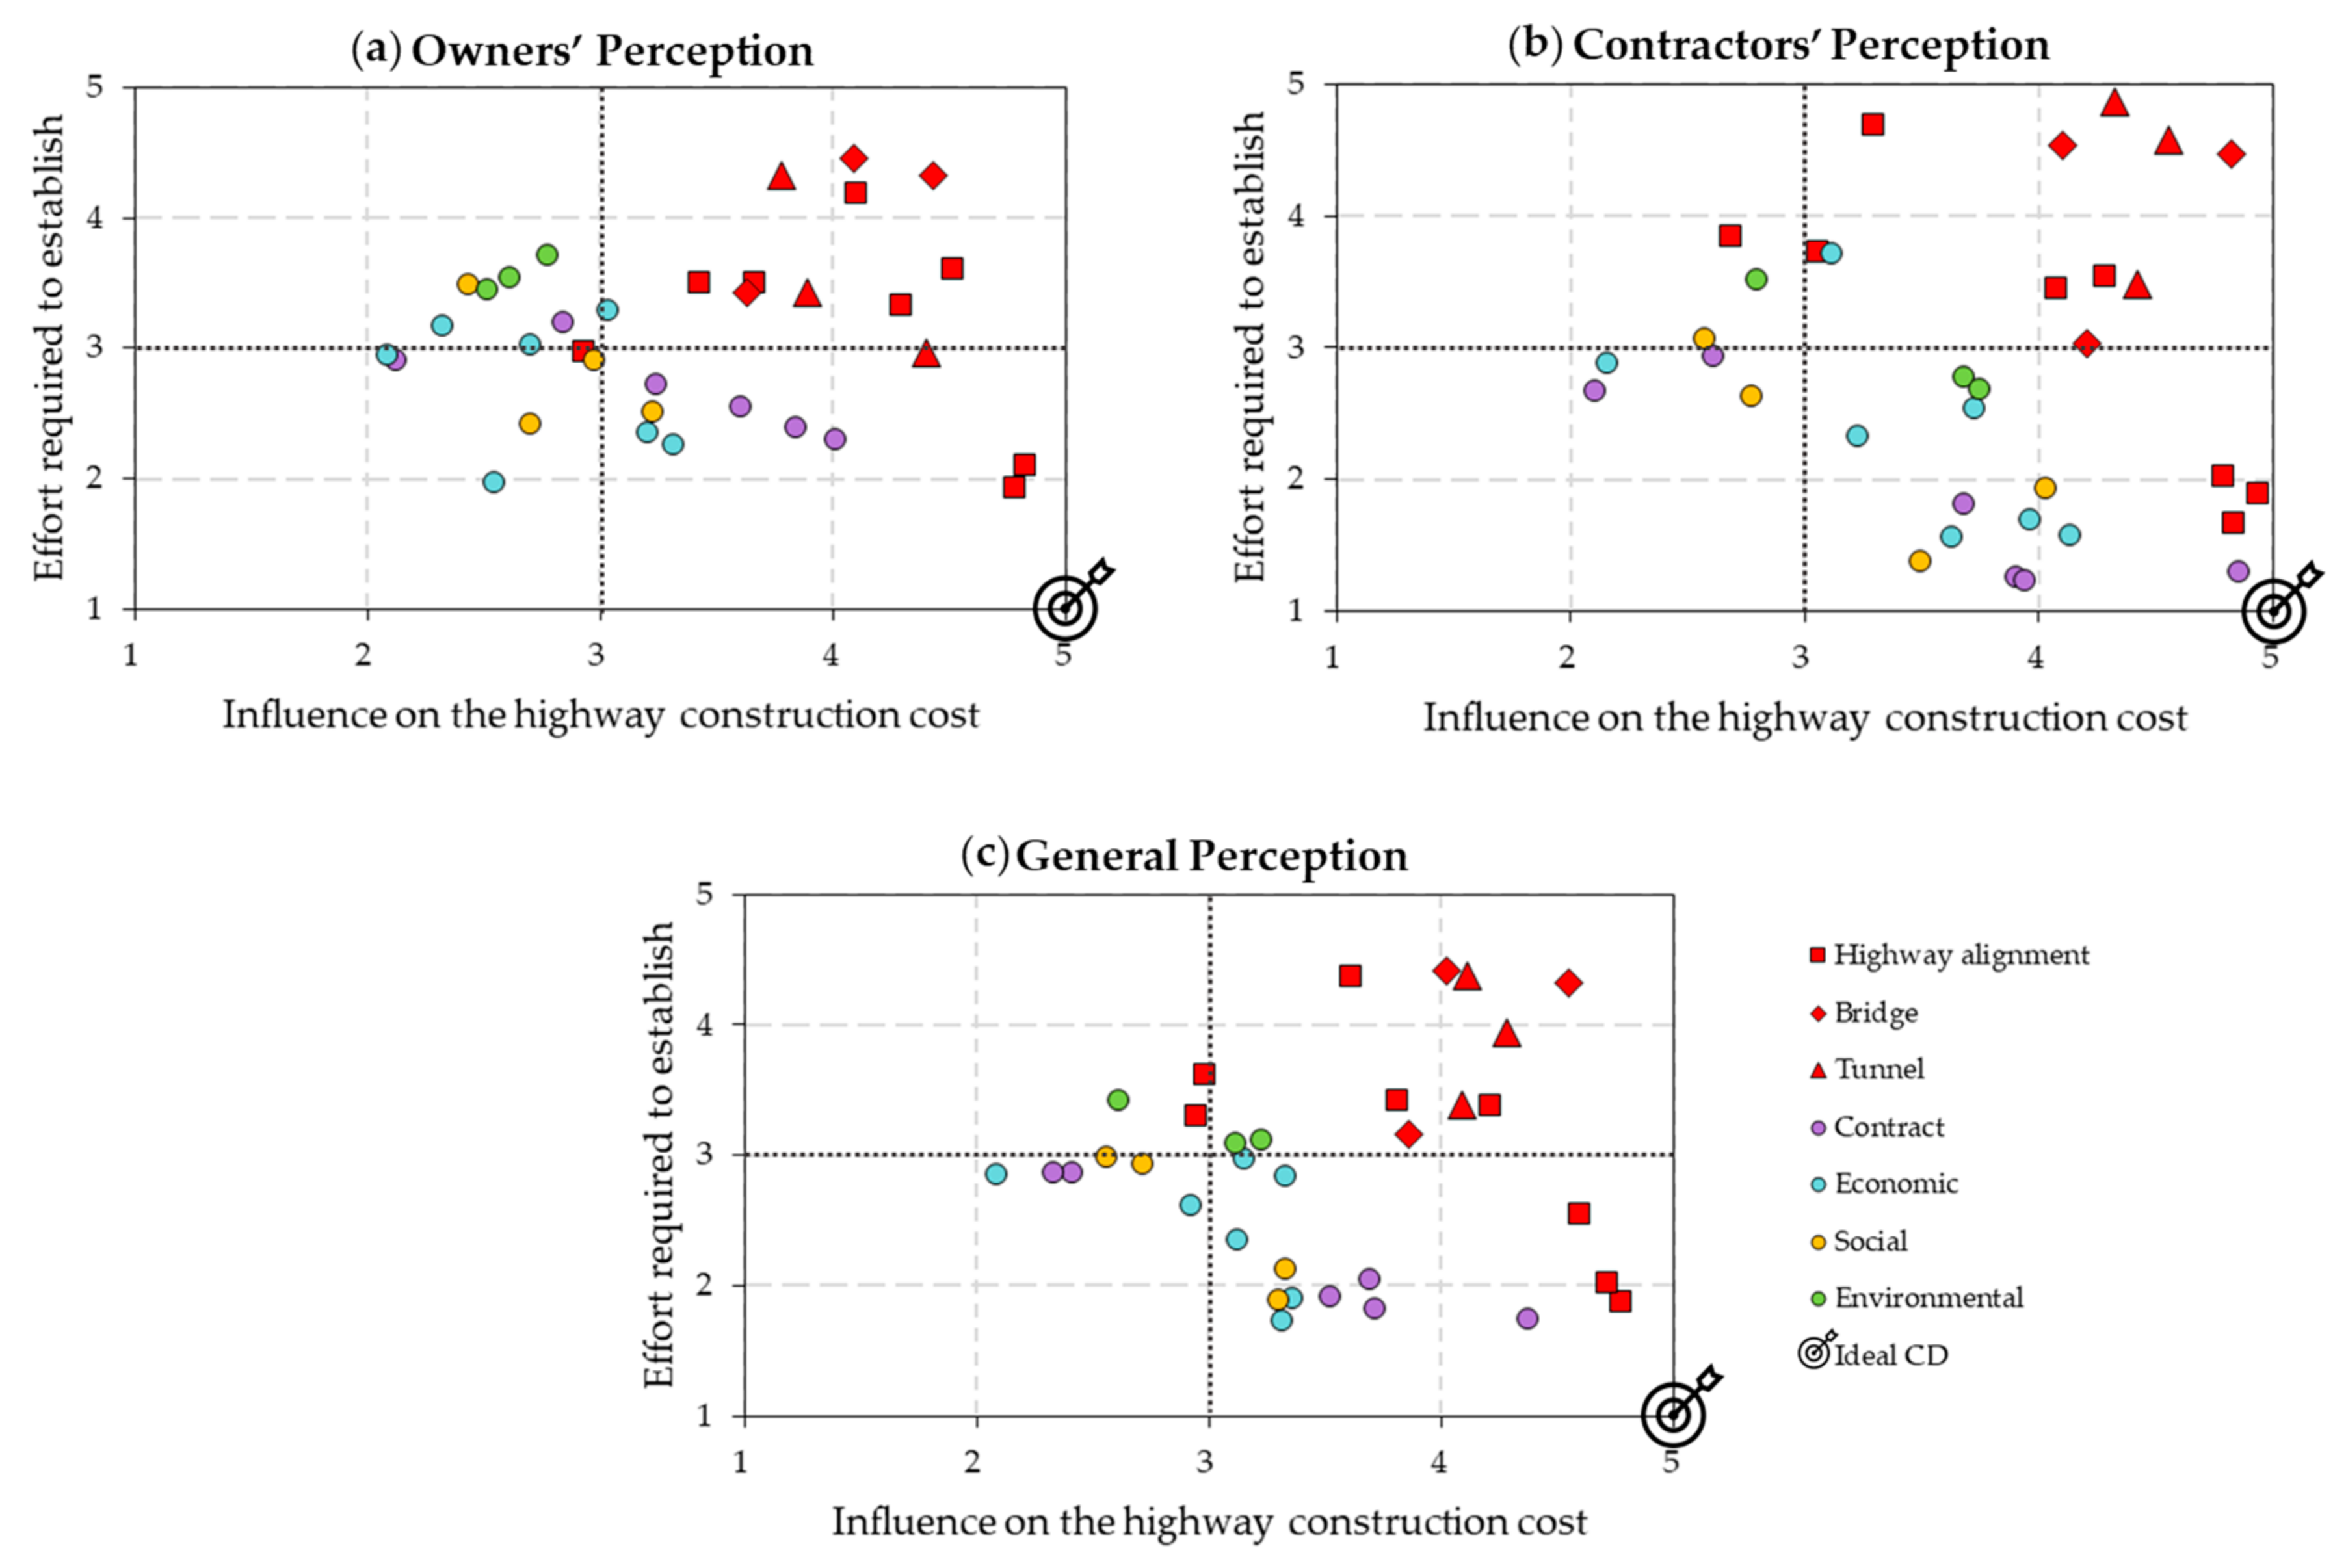
4.4.1. Respondent Perceptions

The average respondent perceptions from the received questionnaires are shown in Figure 3. The data points represent the CDs from the Preliminary CDs List, where the x-axis corresponds to the average perceived influence on the highway-construction cost and the y-axis corresponds to the average perceived effort required to establish a CD’s value.
The CD categories are presented with different colors of data points. Since Highway alignment, Bridge, and Tunnel are design-related categories, they were assigned the same (red) color but with different shapes. This provided a better visual recognition of the results.
The results can be interpreted as follows:
  • All three graphs in Figure 3 show that the design-related CDs (i.e., Highway alignment, Bridge, and Tunnel categories) mostly fell in the upper right quadrant, whereas other categories of CDs were not part of this quadrant. This can be interpreted as a logical result keeping in mind that preparation of the design requires a substantial amount of money to be spent and is time consuming (high effort), whereas design has a significant influence on the highway-construction cost.
  • It can be noted that the CDs occupying the bottom-right quadrant, which was the most preferable (high influence–low effort) [15], in all three perceptions included only three design-related CDs. These drivers describe the terrain type, the presence of extreme structures, and the number of tunnel tubes. These variables can be relatively easily established by experts in early project phases with reasonable confidence. The remaining CDs from this quadrant belonged to the Contract, Economic, and Social categories, and this was expected due to the fact that they are publicly available and may be highly correlated to the construction costs [18,34].
  • From the contractor’s point of view, in the most preferred quadrant, there were six CDs more than from the owner’s point of view, which means that owners rated these six CDs with a higher effort and lower influence.
  • It can be seen that from the owner’s point of view, a larger number of CDs (especially Environmental) occupied the upper left quadrant compared to the contractors’ perspective. This indicates greater concern of the owners regarding environmental issues and thus a higher effort by the owners, but that contractors are more concerned about high environmental costs.
  • When comparing the perceptions of owners and contractors, contractors rated Economic and Contract CDs with a higher influence and lower effort. The most probable explanation is that contractors are more familiar with these categories due to the most common contract types recently used in the respondents’ countries.
  • According to contractors, the CD closest to the ideal CD (Figure 3) was C.4 (the existence of contract-price adjustments). Contractors assigned this CD the highest influence. Given the ongoing problems with the large increase in resource prices caused by the COVID-19 pandemic and the Russia–Ukraine war, payment for a contractor’s performed work is inadequate without contract-price adjustments. Therefore, the high perceived influence on cost is absolutely logical. Previous financial crises also had a particular impact on road-infrastructure projects [70].
  • Finally, all CDs had an average perceived influence larger than 2 (low influence), which indicates that the CDs within the Preliminary CDs List were correctly identified, as no CD was characterized as having no influence or very low influence.

4.4.2. Agreement between Stakeholders’ Perceptions

To test the consensus between owners’ and contractors’ perceptions, Spearman’s rank correlation was used. This is a non-parametric test that has been recognized in previous studies as a suitable measure for comparison of the agreement of attitudes and perceptions of different project parties [71,72,73]. The correlation coefficient can have values in the interval from +1 to −1. The values of +1 or −1 indicate a perfect Spearman correlation (total agreement or total disagreement). The Spearman’s rank correlation coefficient (r) is calculated according to the following equation:
r = 1 6 Σ d 2 n 3 n
where r is Spearman rank correlation, d is the difference between rank assigned to each CD, and n is the number of CDs, which in this case was 34.
The Spearman’s rank non-parametric test results indicate the relatively good consensus between owners’ and contractors’ perceptions of the degree of influence of CDs (about 0.753) as well as the degree of effort required to establish their values (about 0.579). When comparing owner- and contractor-respondents’ results, shown in Figure 3, this statement was also evident; the data points of each category occupied more or less the same quadrants for both groups of respondents. Less agreement between the perceptions of owners and contractors on the level of effort was expected, considering that these experts were not designers and almost half of the CDs belonged to design-related categories. From the results, it follows that the respondents were not so familiar with the design process.

4.4.3. Cost-Driver Ranking

The accuracy of highway-construction cost estimation in previous studies was expressed as being in the function of the degree of the influence of CDs on highway-construction costs. Accordingly, the authors ranked CDs based on average perceived influence on construction costs [26] and the relative-importance index [27]. When considering input variables to be included in the model, besides influence, it is necessary to take into account the degree of effort that needs to be invested to determine the value of the variable for a specific project. Gardner et al. built a data-driven cost-estimation model that included variables one at a time, starting with the one closest to the ideal CD (with the highest possible value of influence on cost and lowest possible effort) [15].
In this research, the authors ranked CDs according to the Euclidean distance from the ideal CD based on owners’ and contractors’ perceptions, as well as general perception (Table 5). The ideal CD is the one that has the highest influence on highway-construction costs and requires the lowest effort to establish its value (Figure 3). Euclidean distance from the ideal CD was calculated based on the following Equation (2) [15]:
Distance from the Ideal cost driver = x i A 2 + y i B 2  
where xi is the average perceived influence on cost for CDi; A is the maximum influence from the Likert scale, which is 5; yi is the average perceived effort for CDi; B is the minimum required effort from the Likert scale, which is 1; and i is the CD being measured, ranging from 1 to the total number of CDs (in this case 34)

5. Cost-Estimation Models

The questionnaire results and collected data set were used to develop and validate cost-estimation models applicable in the early stages of project development. The authors intended to propose cost-estimation models that can provide satisfactory accuracy with the least possible effort.
Three cost-estimation models were developed and validated using the formed highway-construction-project database and the CD ranking according to the Euclidean distance from the ideal cost driver. The proposed approach also enabled the comparison of the results between owners and contractors. For the development of three cost-estimation models, different methods were used: multiple-regression analysis, artificial neural networks, and eXtreme gradient boosting. The use of different methods enabled comparison between the results of the three models.

5.1. Model Development and Validation

As the most commonly used techniques for highway-construction cost-estimation model development, multiple-regression analysis (MRA) and artificial neural network (ANN) were selected as a starting point for model development. Furthermore, this paper proposes the model based on the eXtreme-gradient-boosting (XGBoost) approach. To the best of the authors’ knowledge, eXtreme gradient boosting has not been used for the development of cost-estimation models of road-infrastructure projects.
All of the models were implemented using scikit-learn (https://scikit-learn.org/stable, accessed on 23 January 2023), a popular ML library in Python. MRA was implemented using the LinearRegression model class, with a default parameter set. ANN was employed via the MLPRegressor model class, with the solver parameter set to “lbfgs”. The solver parameter determines the algorithm used to optimize the network weights. Lbfgs is a robust solver for multi-layer perceptrons, which uses an approximation of the Hessian matrix to optimize the weights, making it well suited for smaller datasets as it is less prone to overfitting.
Finally, XGBoost was implemented using the HistGradientBoostingRegressor model class. The model was initialized with the following parameters:
  • Learning rate = 1—controls the step-size shrinkage used in updates to prevent overfitting;
  • max_iter = 100—the number of iterations of the boosting process;
  • min_samples_leaf = 2—minimum number of samples required to be at a leaf node (used to regularize the model and prevent overfitting, which is especially useful for smaller datasets).
The first CD added to the model was closest to the ideal CD shown in Figure 3. Subsequent CDs were added to the model following the rankings in Table 5. With each addition of a new input CD, the performance of the model and cumulative effort were recorded. The model performance was presented using the mean absolute percentage error (MAPE), which was calculated according to Equation (3):
M A P E = 100 % n * t = 1 n   A t P t A t  
where n is the number of iterations, At is the actual contracted value of project t, and Pt is the predicted value of project t.
For the relatively small data sets, previous studies used leave-one-out cross-validation (LOOCV), which has n iterations and leaving one data point out of the training sample each time [9]. Therefore, LOOCV was used as a validation method in this paper.
Given that case-study projects were contracted in different periods, it was necessary to convert their costs to the same base date to make them comparable. According to the price adjustments stated in the contracts of the data set, all changes in resource prices were expressed through price indices. Therefore, the resource price indices were converted to the same base date. The adopted base date for the case study was mid-September 2021. After conversion to the same base date, project prices were directly comparable.

5.2. Results and Discussion

The input variables (CDs) were added one by one to the three models according to rankings based on owners’, contractors’, and general perceptions (Table 5). When a new input CD was added to the model, the MAPE and cumulative effort (as the sum of efforts for CDs included in the model) were recorded each time. Figure 4 presents the results obtained using MRA, ANN, and XGBoost. The results are shown concluding with the CD ranked 17th because the inclusion of additional CDs did not contribute to significant changes in the performance of the model.
As illustrated in Figure 4, the initial error of the MRA model with only one input CD was about 37% for the owners’ and the general perspective and about 72% for the contractors’ perspective. Although the initial error was relatively large, with the inclusion of additional input CDs the error decreased quickly. The model achieved the best performance with an error of about 25% and a cumulative effort of about 5. This performance was achieved with three to five input CDs. In the case of all three perspectives, after adding new CDs and investing extra effort, the prediction error increased.
The accuracy of the ANN model increased with the increase in the number of CDs and reached a maximum accuracy of about 28% of MAPE with a cumulative effort of 5.02 for three input CDs for the general perspective, a cumulative effort of 3.72 for three input CDs for the owners’ perspective, and cumulative effort of 4.02 for five input CDs for the contractors’ perspective. After this point, the accuracy showed an unstable trend. With the addition of new CDs, the error sometimes increased and sometimes decreased. The reason for this phenomenon may be that, in this case, ANN was a more sensitive algorithm than MRA and XGBoost. This means that for each combination of input CDs, hyperparameters would need to be examined and set in order to provide a good performance of the ANN model.
In the case of all three perspectives (contractors’, owners’, and general), the XGBoost model showed similar results to the other two methods to the effort of 5, but showed the best results for effort larger than 5. For the general perspective, the XGBoost model quickly achieved a prediction error below 24% with five CDs and a cumulative effort of 9. According to the owners’ perspective, a MAPE of 27% was achieved with the addition of the fifth CD and a cumulative effort of 7.6. With additional CDs, the MAPE oscillated around 30% up to the 12th CD. It was observed that with the addition of the 13th input CD, the error significantly decreased to about 22% (with a cumulative effort higher than 26.6) and stayed around 20% with the addition of new CDs. From the contractors’ perspective, the XGBoost model showed a quick increase in accuracy. With five CDs and a cumulative effort of only 4, the MAPE was 24.75% and stayed around 22% when adding new CDs. The model kept yielding similar accuracy with the addition of new CDs but cumulative effort gradually increased.
In the early stages of project development when only scarce project information is available, quick and reasonably accurate cost estimates are required for sound decision-making. When it comes to the requirements of cost estimation in the early project stages, there are several guidelines and reports available with the suggested ranges of estimation accuracies depending on the level of the project definition [74,75,76]. For example, in [76], it was considered that the planning phase of project development implies 0% to 15% of completed project definition and a suggested estimate-accuracy range of −40% to +100%. Similarly, in the same source, it was stated that the scoping phase means that 10% to 30% of the project definition is completed and estimation accuracy in this early project phase ranges between −30% and +50%. It is important to point out that the prediction errors achieved by the three models in this research are consistent with the acceptable range of errors in the early project phases stated in the literature. With all three methods used for cost-estimation model development (MRA, ANN, and XGBoost), a satisfactory estimation accuracy of 25% to 30% was achieved. Reasonably accurate cost estimates were quickly achieved with only three to five key CDs.
For all three models (ANN, MRA, and XGBoost), the CDs were added one by one in order of their rankings given in Table 5. It must be noted that the rankings of CDs were different for the owners’, contractors’, and general perceptions.
For all three points of view, within the first five CDs were:
  • HA.1: The participation of certain terrain type in the total length of the section;
  • HA.2: The presence of extreme structures within the route;
  • C.4: The existence of contract-price adjustments.
From the general point of view, the following two were within the first five CDs:
  • C.2: Contract type;
  • HA.8: The participation of tunnels in the total length of the section.
The following two were also within the first five CDs from the owners’ point of view:
  • C.3: Procurement method;
  • T.1: Number of tunnel tubes.
From the contractors’ point of view, the following two were within the first five CDs:
  • HA.8: The participation of tunnels in the total length of the section;
  • EC.3: Average gross wages per employee in the construction industry.
In [15], the authors tested the key CD-selection methodology based on survey results from 31 respondents who were employed by the same owner company (highway agency). According to [15], satisfactory accuracy was achieved with five key CDs for the ANN model and nine key CDs for the MRA model. As the methodology was tested only on pavement-preservation projects, the results are not directly comparable and the key CDs were different from those obtained in this study. Only the CD describing terrain type was shown to be among the key CDs in both studies.

6. Conclusions

Cost estimation in the early project stages is accompanied by uncertainties and risks for both owners and contractors. Additionally, it has to provide satisfactory accuracy while being cost and time effective, i.e., with low effort required. The aim of the research was to find the key cost drivers (CDs) that would be used for proposal of cost-estimation models with minimal effort needed.
A questionnaire survey included a list of 34 CDs clustered into seven categories (Highway alignment, Bridge, Tunnel, Contract, Economic, Social, and Environmental). Owners and contractors, as key stakeholders in a project, rated the degree of influence each of the CDs has on highway-construction costs and the degree of effort that has to be invested to establish a CD’s value for a certain project. The results show that there were some disagreements between owners’ and contractors’ perceptions of the CDs.
By gradually adding CDs with the closest distances from the ideal CD (which has the highest possible value of influence on cost and at the same time the lowest possible effort), three cost-estimation models were developed using MRA, ANN, and XGBoost methods. The results indicate that in all three models reasonable accuracy (25–30%) could be achieved with a relatively low effort for three to five CDs. In addition, increasing the number of input CDs did not necessarily imply an increase in accuracy. Moreover, it could cause the opposite; after some point, the inclusion of additional CDs may have led to an error increase in the models. The XGBoost model showed the best results for an effort larger than 5 and reached an accuracy of around 20%.
The research in this paper is limited to the collected data set, so further research will include a wider database in spatial and temporal terms. In addition, the data set was based on the contracted project values. The next step could be the collection of actual contract costs instead of contracted values. Probably the most important direction of further research should consider the proposed approach in a broader context in terms of sustainability. Examining the key stakeholders’ perspectives regarding the life-cycle costs of highway-infrastructure projects could be essential for sustainable decision-making. Accordingly, the next step would include the consideration of CDs related to other phases of the project life cycle, in addition to the construction phase.
Finally, the findings of this study could be particularly useful for decision-makers (owners and potential contractors) in the early stages of project development. They highlight that only three to five CDs are required to achieve a reasonable estimation accuracy on which the initial decision can be made. Investing extra effort, especially in design development, may lead to greater accuracy but requires significant time and money.

Author Contributions

Conceptualization, N.S. and N.I.; methodology, N.S.; software, Đ.N.; validation, N.S. and Đ.N.; formal analysis, N.S.; investigation, N.S.; resources, A.S. and M.I.; data curation, A.S. and M.I.; writing—original draft preparation, N.S.; writing—review and editing, N.I.; visualization, N.S. and M.I.; supervision, N.I. and Z.S. All authors have read and agreed to the published version of the manuscript.

Funding

This research received no external funding.

Institutional Review Board Statement

The study was conducted in accordance with the Declaration of Helsinki, and approved by the Data Protection Officer of the University of Belgrade Faculty of Civil Engineering (protocol code 396, 29 December 2022).

Informed Consent Statement

Informed consent was obtained from all subjects involved in the study.

Data Availability Statement

Not applicable.

Conflicts of Interest

The authors declare no conflict of interest.

References

  1. Eurostat. Freight Transport Statistics-Modal Split. Available online: https://ec.europa.eu/eurostat/statistics-explained/index.php?title=Freight_transport_statistics_-_modal_split (accessed on 30 January 2023).
  2. Eurostat European Commission. Energy, Transport and Environment Statistics; Publications Office of the European Union: Luxembourg, 2020. [Google Scholar]
  3. Weiss, D.J.; Nelson, A.; Gibson, H.S.; Gething, P.W. A Global Map of Travel Time to Cities to Assess Inequalities in Accessibility in 2015. Nature 2018, 553, 333–336. [Google Scholar] [CrossRef]
  4. Creutzig, F.; Jochem, P.; Edelenbosch, O.; Mattauch, D.; Van Vuuren, D.; Miccollum, D.; Minx, J. Transport: A Roadblock to Climate Change Mitigation? Science 2015, 350, 911–912. [Google Scholar] [CrossRef] [Green Version]
  5. Shannon, G.; Angeloni, L.M.; Wittemyer, G.; Fristrup, K.M.; Crooks, K.R. Road Traffic Noise Modifies Behaviour of a KeyStone Species. Anim. Behav. 2014, 94, 135–141. [Google Scholar] [CrossRef]
  6. Torres, A.; Jaeger, J.A.G.; Alonso, J.C. Assessing Large-Scale Wildlife Responses to Human Infrastructure Development. Proc. Natl. Acad. Sci. USA 2016, 113, 8472–8477. [Google Scholar] [CrossRef] [Green Version]
  7. OECD. Transport Infrastructure Investment and Maintenance Spending. Available online: https://stats.oecd.org/ (accessed on 30 January 2023).
  8. Chou, J.S. Cost Simulation in an Item-Based Project Involving Construction Engineering and Management. Int. J. Proj. Manag. 2011, 29, 706–717. [Google Scholar] [CrossRef]
  9. Cirilovic, J.; Vajdic, N.; Mladenovic, G.M.; Queiroz, C. Developing Cost Estimation Models for Road Rehabilitation and Reconstruction: Case Study of Projects in Europe and Central Asia. J. Constr. Eng. Manag. 2014, 140, 04013065-1–04013065-9. [Google Scholar] [CrossRef]
  10. Kim, G.H.; An, S.H.; Kang, K.I. Comparison of Construction Cost Estimating Models Based on Regression Analysis, Neural Networks, and Case-Based Reasoning. Build. Environ. 2004, 39, 1235–1242. [Google Scholar] [CrossRef]
  11. Flyvbjerg, B.; Holm, M.S.; Buhl, S. Underestimating Costs in Public Works Projects: Error or Lie? J. Am. Plan. Assoc. 2002, 68, 279–295. [Google Scholar] [CrossRef] [Green Version]
  12. Odeck, J. Cost Overruns in Road Construction-What are their Sizes and Determinants ? Transp. Policy. 2004, 11, 43–53. [Google Scholar] [CrossRef]
  13. Li, M.; Baek, M.; Ashuri, B. Forecasting Ratio of Low Bid to Owner’s Estimate for Highway Construction. J. Constr. Eng. Manag. 2021, 147, 04020157-1–04020157-12. [Google Scholar] [CrossRef]
  14. Liang, Y.; Ashuri, B.; Li, M. Forecasting the Construction Expenditure Cash Flow for Transportation Design-Build Projects with a Case-Based Reasoning Model. J. Constr. Eng. Manag. 2021, 147, 04021043. [Google Scholar] [CrossRef]
  15. Gardner, B.J.; Gransberg, D.; Jeong, H.D. Reducing Data-Collection Efforts for Conceptual Cost Estimating at a Highway Agency. J. Constr. Eng. Manag. 2016, 142, 04016057-1–04016057-9. [Google Scholar] [CrossRef]
  16. Antoniou, F.; Aretoulis, G.; Giannoulakis, D.; Konstantinidis, D. Cost and Material Quantities Prediction Models for the Construction of Underground Metro Stations. Buildings 2023, 13, 382. [Google Scholar] [CrossRef]
  17. Uysal, F.; Sonmez, R. Bootstrap Aggregated Case-Based Reasoning Method for Conceptual Cost Estimation. Buildings 2023, 13, 651. [Google Scholar] [CrossRef]
  18. Mahdavian, A.; Shojaei, A.; Salem, M.; Yuan, J.S.; Oloufa, A.A. Data-Driven Predictive Modeling of Highway Construction Cost Items. J. Constr. Eng. Manag. 2021, 147, 04020180-1–04020180-14. [Google Scholar] [CrossRef]
  19. Elmousalami, H.H. Artificial Intelligence and Parametric Construction Cost Estimate Modeling: State-of-the-Art Review. J. Constr. Eng. Manag. 2020, 146, 03119008-1–03119008-30. [Google Scholar] [CrossRef]
  20. Hashemi, S.T.; Ebadati, O.M.; Kaur, H. Cost Estimation and Prediction in Construction Projects: A Systematic Review on Machine Learning Techniques. SN Appl. Sci. 2020, 2, 1703. [Google Scholar] [CrossRef]
  21. Kim, S. Hybrid Forecasting System based on Case-Based Reasoning and Analytic Hierarchy Process for Cost Estimation. J. Civ. Eng. Manag. 2013, 19, 86–96. [Google Scholar] [CrossRef]
  22. Adel, K.; Elyamany, A.; Belal, A.M.; Kotb, A.S. Developing Parametric Model for Conceptual Cost Estimate of Highway Projects. Int. J. Eng. Sci. Comp. 2016, 6, 1728–1734. [Google Scholar]
  23. Mahalakshmi, G.; Rajasekaran, C. Early Cost Estimation of Highway Projects in India Using Artificial Neural Network. Lect. Notes Civ. Eng. 2018, 25, 659–672. [Google Scholar]
  24. Karaca, I.; Gransberg, D.; Jeong, D. Improving the Accuracy of Early Cost Estimates on Transportation Infrastructure Projects. J. Manag. Eng. 2020, 36, 04020063-1–04020063-11. [Google Scholar] [CrossRef]
  25. Hatamleh, M.T.; Hiyassat, M.; Sweis, G.J.; Sweis, R.J. Factors Affecting the Accuray of Cost Estimate: Case of Jordan. Eng. Constr. Archit. Manag. 2017, 25, 113–131. [Google Scholar] [CrossRef]
  26. Al-Zwainy, F.M.S. A State-of-the-Art Survey to Estimate Construction Costs in Highway and Bridge Projects: Analytical Diagnostic Study. Int. J. Civ. Eng. Technol. 2018, 9, 795–821. [Google Scholar]
  27. Elbeltagi, E.; Hosny, O.; Abdel-Razek, R.; El-Fitory, A. Conceptual Cost Estimate of Libyan Highway Projects Using Artificial Neural Network. Int. J. Eng. Res. Appl. 2014, 4, 56–66. [Google Scholar]
  28. Meharie, M.G.; Gariy, Z.C.A.; Ngumbau, R.; Mutuku, N.; Mengesha, W.J. An Effective Approach to Input Variable Selection for Preliminary Cost Estimation of Construction Projects. Adv. Civ. Eng. 2019, 2019, 4092549. [Google Scholar] [CrossRef]
  29. Xie, W.; Deng, B.; Yin, Y.; Lv, X.; Deng, Z. Critical Factors Influencing Cost Overrun in Construction Projects: A Fuzzy Synthetic Evaluation. Buildings 2022, 12, 2028. [Google Scholar] [CrossRef]
  30. Memon, A.H.; Abdul Rahman, I.; Abdul Aziz, A.A. The Cause Factors of Large Project’s Cost Overrun: A Survey in the Southern Part of Peninsular Malaysia. Int. J. Real Estate Stud. 2012, 7, 1–15. [Google Scholar]
  31. Doloi, H.K. Understanding Stakeholders’ Perspective of Cost Estimation in Project Management. Int. J. Proj. Manag. 2011, 29, 622–636. [Google Scholar] [CrossRef]
  32. Peško, I.; Mučenski, V.; Šešlija, M.; Radović, N.; Vujkov, A.; Bibić, D.; Krklješ, M. Estimation of Costs and Durations of Construction of Urban Roads Using ANN and SVM. Complexity 2017, 2017, 2450370. [Google Scholar] [CrossRef] [Green Version]
  33. Sodikov, J. Road Cost Models for Prefeasibility Studies. J. Infrastruct. Syst. 2009, 15, 278–289. [Google Scholar] [CrossRef]
  34. Zhang, Y.; Minchin, R.E.; Agdas, D. Forecasting Completed Cost of Highway Construction Projects Using LASSO Regularized Regression. J. Constr. Eng. Manag. 2017, 143, 04017071-1–04017071-12. [Google Scholar] [CrossRef] [Green Version]
  35. Wilmot, C.G.; Cheng, G. Estimating Future Highway Construction Costs. J. Constr. Eng. Manag. 2003, 129, 272–279. [Google Scholar] [CrossRef]
  36. Mahamid, I. Early Cost Estimating for Road Construction Projects Using Multiple Regression Techniques. Aust. J. Constr. Econ. Build. 2011, 11, 87–101. [Google Scholar] [CrossRef] [Green Version]
  37. Hegazy, T.; Ayed, A. Neural Network Model for Parametric Cost Estimation of Highway Projects. J. Constr. Eng. Manag. 1998, 124, 210–218. [Google Scholar] [CrossRef]
  38. Wilmot, C.G.; Mei, B. Neural Network Modeling of Highway Construction Costs. J. Constr. Eng. Manag. 2005, 131, 765–771. [Google Scholar] [CrossRef]
  39. Gardner, B.J.; Gransberg, D.D.; Rueda, J.A. Stochastic Conceptual Cost Estimating of Highway Projects to Communicate Uncertainty Using Bootstrap Sampling. J. Constr. Eng. Manag. 2017, 3, 05016002. [Google Scholar] [CrossRef]
  40. Tijanić, K.; Car-Pušić, D.; Šperac, M. Cost estimation in road construction using artificial neural network. Neural Comput. Appl. 2020, 0123456789, 9343–9355. [Google Scholar] [CrossRef]
  41. Shehadeh, A.; Alshboul, O.; Al Mamlook, R.E.; Hamedat, O. Machine Learning Models for Predicting the Residual Value of Heavy Construction Equipment: An Evaluation of Modified Decision Tree, LightGBM, and XGBoost Regression. Autom. Constr. 2021, 129, 103827. [Google Scholar] [CrossRef]
  42. Bai, S.; Li, M.; Kong, R.; Han, S.; Li, H.; Qin, L. Data Mining Approach to Construction Productivity Prediction for Cutter Suction Dredgers. Autom. Constr. 2019, 105, 102833. [Google Scholar] [CrossRef]
  43. Friedman, J. Greedy Function Approximation: A Gradient Boosting machine. Ann. Stat. 2001, 29, 1189–1232. [Google Scholar] [CrossRef]
  44. Dong, W.; Huang, Y.; Lehane, B.; Ma, G. XGBoost Algorithm-Based Prediction of Concrete Electrical Resistivity for Structural Health Monitoring. Autom. Constr. 2020, 114, 103155. [Google Scholar] [CrossRef]
  45. Koc, K.; Ekmekcioğlu, Ö.; Gurgun, A.P. Integrating Feature Engineering, Genetic Algorithm and Tree-Based Machine Learning Methods to Predict the Post-Accident Disability Status of Construction Workers. Autom. Constr. 2021, 131, 103896. [Google Scholar] [CrossRef]
  46. Alshboul, O.; Shehadeh, A.; Almasabha, G.; Almuflih, A.S. Extreme Gradient Boosting-Based Machine Learning Approach for Green Building Cost Prediction. Sustainability 2022, 14, 6651. [Google Scholar] [CrossRef]
  47. Al-Zwainy, F.M.S.; Aidan, I.A. Forecasting the Cost of Structure of Infrastructure Projects Utilizing Artificial Neural Network Model (Highway Projects as Case Study). Indian J. Sci. Technol. 2017, 10, 1–12. [Google Scholar] [CrossRef]
  48. Kim, D.Y.; Kim, B.; Han, S.H. Two-Staged Early Cost Estimation for Highway Construction Projects. In Proceedings of the 25th International Symposium on Automation and Robotics in Construction, Vilnius, Lithuania, 26–29 June 2008. [Google Scholar]
  49. Sodikov, J. Cost Estimation of Highway Projects in Developing Countries: Artificial Neural Network Approach. J. East. Asia Soc. Transp. Stud. 2005, 6, 1036–1047. [Google Scholar]
  50. Pewdum, W.; Rujirayanyong, T.; Sooksatra, V. Forecasting Final Budget and Duration of Highway Construction Projects. Eng. Constr. Archit. Manag. 2009, 16, 544–557. [Google Scholar] [CrossRef]
  51. El-Sawalhi, N.I. Support Vector Machine Cost Estimation Model for Road Projects. J. Civ. Eng. Archit. 2015, 9, 1115–1125. [Google Scholar]
  52. Kovačević, M.; Ivaniševic, N.; Petronijević, P.; Despotović, V. Construction Cost Estimation of Reinforced and Prestressed Concrete Bridges Using Machine Learning. Građevinar 2021, 73, 1–13. [Google Scholar]
  53. Beljkaš, Ž.; Knežević, M. Procjena troškova za integralne mostove primjenom umjetne inteligencije. Građevinar 2021, 73, 265–273. [Google Scholar]
  54. Kovačević, M.; Ivanišević, N.; Stević, D.; Marković, L.M.; Bulajić, B.; Marković, L.; Gvozdović, N. Decision-Support System for Estimating Resource Consumption in Bridge Construction Based on Machine Learning. Axioms 2023, 12, 19. [Google Scholar] [CrossRef]
  55. Petroutsatou, K.; Maravas, A.; Saramourtsis, A. A Life Cycle Model for Estimating Road Tunnel Cost. Tunn. Undergr. Sp. Technol. 2021, 111, 103858. [Google Scholar] [CrossRef]
  56. Petroutsatou, K.; Georgopoulos, E.; Lambropoulos, S.; Pantouvakis, J.P. Early Cost Estimating of Road Tunnel Construction Using Neural Networks. J. Constr. Eng. Manag. 2012, 138, 679–687. [Google Scholar] [CrossRef]
  57. Membah, J.; Asa, E. Estimating Cost for Transportation Tunnel Projects: A Systematic Literature Review. Int. J. Constr. Manag. 2015, 15, 196–218. [Google Scholar] [CrossRef]
  58. Rostami, J.; Sepehrmanesh, M.; Gharahbagh, E.A.; Mojtabai, N. Planning Level Tunnel Cost Estimation Based on Statistical Analysis of Historical Data. Tunn. Undergr. Sp. Technol. 2013, 33, 22–33. [Google Scholar] [CrossRef]
  59. Ahmed, C. Early Cost Estimation Models Based on Multiple Regression Analysis for Road and Railway Tunnel Projects. Arab. J. Geosci. 2021, 14, 972. [Google Scholar] [CrossRef]
  60. Sayed, M.; Abdel-Hamid, M.; El-Dash, K. Improving Cost Estimation in Construction Projects. Int. J. Constr. Manag. 2020, 23, 135–143. [Google Scholar] [CrossRef]
  61. Shehab, T.; Farooq, M.; Sandhu, S.; Nguyen, T.; Nasr, E. Cost Estimating Models for Utility Rehabilitation Projects: Neural Networks Versus Regression. J. Pipeline Syst. Eng. Pract. 2010, 1, 104–110. [Google Scholar] [CrossRef]
  62. Beljkaš, Ž.; Knežević, M.; Rutešić, S.; Ivanišević, N. Application of Artificial Intelligence for the Estimation of Concrete and Reinforcement Consumption in the Construction of Integral Bridges. Adv. Civ. Eng. 2020, 2020, 8645031. [Google Scholar] [CrossRef]
  63. Luo, W.; Sandanayake, M.; Zhang, G.; Tan, Y. Construction Cost and Carbon Emission Assessment of a Highway Construction-A Case towards Sustainable Transportation. Sustainability 2021, 13, 7854. [Google Scholar] [CrossRef]
  64. Creswell, J. Research Design-Qualitative, Quantitative, and Mixed Methods Approaches, 3rd ed.; SAGE Publications Inc.: Thousand Oaks, CA, USA, 2009. [Google Scholar]
  65. Goh, K.C.; Yang, J. Importance of Sustainability-Related Cost Components in Highway Infrastructure: Perspective of Stakeholders in Australia. J. Infrastruct. Syst. 2014, 20, 1–9. [Google Scholar] [CrossRef] [Green Version]
  66. Larsen, J.K.; Shen, G.Q.; Lindhard, S.M.; Brunoe, T.D. Factors Affecting Schedule Delay, Cost Overrun, and Quality Level in Public Construction Projects. J. Manag. Eng. 2016, 32, 04015032. [Google Scholar] [CrossRef] [Green Version]
  67. Lind, H.; Brunes, F. Explaining Cost Overruns in Infrastructure Projects: A New Framework with Applications to Sweden. Constr. Manag. Econ. 2015, 33, 554–568. [Google Scholar] [CrossRef]
  68. Doloi, H.; Sawhney, A.; Iyer, K.C.; Rentala, S. Analysing Factors Affecting Delays in Indian Construction Projects. Int. J. Proj. Manag. 2012, 30, 479–489. [Google Scholar] [CrossRef]
  69. Cronbach, L.J.; Shavelson, R.J. My Current Thoughts on Coefficient Alpha and Successor Procedures. Educ. Psychol. Meas. 2004, 64, 391–418. [Google Scholar] [CrossRef] [Green Version]
  70. Nikolić, A.; Roumboutsos, A.; Stanković, J.Ć.; Mladenović, G. Has the Latest Global Financial Crisis Changed the Way Road Public-Private Partnerships Are Funded? A Comparison of Europe and Latin America. Util Policy 2020, 64, 101044. [Google Scholar] [CrossRef]
  71. Assaf, S.A.; Al-Hejji, S. Causes of Delay in Large Construction Projects. Int. J. Proj. Manag. 2006, 24, 349–357. [Google Scholar] [CrossRef]
  72. Gunduz, M.; Maki, O.L. Assessing the Risk Perception of Cost Overrun through Importance Rating. Technol. Econ. Dev. Econ. 2018, 24, 1829–1844. [Google Scholar] [CrossRef]
  73. Fallahnejad, M.H. Delay Causes in Iran Gas Pipeline Projects. Int. J. Proj. Manag. 2013, 31, 136–146. [Google Scholar] [CrossRef]
  74. Anderson, S.; Molenaar, K.; Schexnayder, C. Guidance for Cost Estimation and Management for Highway Projects during Planning, Programming, and Preconstruction; Transportation Research Board: Washington, DC, USA, 2007. [Google Scholar]
  75. AACE International Recommended Practice No. 18R-97. Cost Estimate Classification System-As Applied in Engineering, Procurement, and Construction for the Process Industries. Available online: https://web.aacei.org/docs/default-source/toc/toc_18r-97.pdf?sfvrsn=4 (accessed on 5 March 2023).
  76. AASHTO. Practical Guide to Cost Estimating; American Association of State Highway and Transportation Officials: Washington, DC, USA, 2013. [Google Scholar]
Figure 1. The research process organized into three stages: STAGE 1—preliminary identification of CDs; STAGE 2—questionnaire survey; STAGE 3—cost-estimation modeling.
Sustainability 15 05584 g001
Figure 2. Likert scale used in the second and third sections.
Sustainability 15 05584 g002
Figure 3. The results of the questionnaire survey: (a) owners’ average perception; (b) contractors’ average perception; (c) general average perception.
Sustainability 15 05584 g003
Figure 4. The model results (MAPE and cumulative effort): (a) owners’ perspective; (b) contractors’ perspective; (c) general perspective.
Sustainability 15 05584 g004
Table 1. List of relevant CDs identified through the literature review.
Cost DriverReferenceFrequency (%)
Road length[21,22,23,24,27,34,36,37,39,40,47,48]63.64
Road width/number of lanes[21,22,23,24,27,34,36,37,39,40,47,48,49]63.64
Number of bridges[24,28,39]13.64
Number of interchanges[47]4.55
Length of bridges[47,48]9.09
Length of tunnels[48]4.55
Project duration *[21,22,23,24,27,28,33,34,35,37,39,40,48,49]72.73
Terrain type[21,23,28,33,39,50]36.36
Design speed[39]4.55
Climate conditions[9,33,50]13.64
Gross domestic product (GDP)[9,33]9.09
Corruption level[9]4.55
Diesel fuel price[9]4.55
Construction year[22,27,37,39,47]22.73
Inflation rate[9,28]9.09
Contract type[48,51]9.09
Resource price indexes[35]4.55
Consumer price index (CPI)[34]4.55
* In some cases, “project duration” implies the expected duration of work or the expected pace of work per road length or surface area.
Table 2. Number of analyzed projects and structures.
No. of Analyzed ProjectsNo. of Structures
BridgesTunnelsInterchanges
684083059
Table 3. General information regarding projects from the database.
Project InformationUnitMinimumMaximumMean Value
PriceMillion EUR4.04203.9852.14
DurationDays4801440841
Length of sectionm125936,60910,081
No. of bridges/019/
No. of tunnels/03/
No. of interchanges/03/
Length of bridgesm01959.41148.98
Length of tunnelsm03659360.49
Table 4. Respondents’ profile.
Stakeholder TypeProfessional Experience (Years)Total% by Stakeholder Type
<1010–20>20
Contractor1820135153.13
Owner816214546.88
Total26363496
% by professional experience273835
Table 5. Cost-driver ranking according to Euclidean distance from the ideal cost driver.
Cat.CodeCost DriverRanking
GENOWNCON
Highway alignmentHA.1The participation of certain terrain type in the total length of the section113
HA.2The presence of extreme structures within the route325
HA.3Number of interchanges282032
HA.4Length of bridges within the interchanges342434
HA.5Design speed241927
HA.6The participation of the highway alignment in the total length of the section181819
HA.7The participation of bridges in the total length of the section151020
HA.8The participation of tunnels in the total length of the section5132
BridgeB.1The longest bridge length131715
B.2The great pier height of extreme bridges292529
B.3The large span of extreme bridges333331
TunnelT.1Number of tunnel tubes23533
T.2The longest tunnel length161418
T.3Tunneling-excavation method323230
ContractC.1Planned duration7117
C.2Contract type466
C.3Procurement method6411
C.4The existence of contract-price adjustments231
C.5Project funding by the national government or through loans and grants262326
C.6Project funding by more international financial institutions (IFI)272722
EconomicEC.1Inflation (consumer price index)9810
EC.2Indices of producers’ prices of diesel fuel (liquid fuels and lubricants)19724
EC.3Average gross wages per employee in the construction industry8124
EC.4Indices of producers’ prices of elements and materials for incorporating into construction142113
EC.5Indices of value of new contracts172216
EC.6Indices of total issued building permits 12268
EC.7GDP growth rate313028
SocialS.1Control of corruption index10912
S.3Government-effectiveness index253421
S.4Political stability and absence of violence/terrorism221623
S.5Unemployment rate11159
EnvironmentalEN.1Traffic-noise-protection measures212917
EN.2Surface- and underground-water-protection measures203114
EN.3Flora- and fauna-protection measures302825
GEN—general perception; OWN—owners’ perception; CON—contractors’ perception.
Disclaimer/Publisher’s Note: The statements, opinions and data contained in all publications are solely those of the individual author(s) and contributor(s) and not of MDPI and/or the editor(s). MDPI and/or the editor(s) disclaim responsibility for any injury to people or property resulting from any ideas, methods, instructions or products referred to in the content.

