Article

A Comprehensive Evaluation of Walkability in Historical Cities: The Case of Xi’an and Kyoto

1
Graduate School of Engineering, Osaka University, Osaka 565-0871, Japan
2
Cybermedia Center, Osaka University, Osaka 567-0047, Japan
3
ILS Research gGmbH, D-44135 Dortmund, Germany
*
Author to whom correspondence should be addressed.
Sustainability 2023, 15(6), 5525; https://doi.org/10.3390/su15065525
Submission received: 4 March 2023 / Revised: 17 March 2023 / Accepted: 19 March 2023 / Published: 21 March 2023

Abstract

:
Walkability is an important indicator of sustainable urban development, especially in fragmented historical blocks affected by modern development efforts. Xi’an, China, and Kyoto, Japan, which are among the oldest cities in Asia, have similar historical backgrounds and a grid-based street network that differs from European historical cities. They also have their own distinctive development characteristics. This study uses a novel quantitative approach to identify areas for improvement in the historical built environment of the two cities that, as part of an overall effort to create a pedestrian-friendly urban center, will promote and facilitate walking activities. The proposed method combines macro- and micro-aspects to identify factors that can either improve or hinder the walking environment. It was found that to ensure a walkable environment in its historical blocks, Xi’an will need to consider the potential negative impact on walkability as it pursues increased modernization. The built environment and the infrastructure of its streets need to be improved, and its historical streetscape and vegetation characteristics need to be maintained. As for Kyoto, to ensure a favorable walking environment, the focus should be on improving the vitality of its streets.

1. Introduction

1.1. Walking in Historical Cities

The negative environmental effects of the fossil-fueled mobility associated with the modern era have become increasingly apparent. Among the more active transport modes, walking remains the cheapest way to travel and is accessible to almost everyone. Walking has a number of benefits, both personal and societal. It has widely been recognized that walking has a positive influence on improving the physical and mental health and well-being of urban residents [1,2]. Walking also has the potential to relieve urban traffic congestion, enhance the ecological environment and air quality, and promote urban safety [3,4]. The system of streets and alleys forms a basic urban structure and plays an important role in maintaining the historical and cultural forms of the region in the modern built environment. In many instances, the social life of residents has been integrated into the historical and cultural districts of older cities, where the streets and alleys serve as a complex public space expected to accommodate a mix of social activities, leisure pastimes, and entertainment [5]. As Jacobs (1961) stated, creating a good walking space is an important component of urban street planning, and one that has increasingly been recognized as an essential element in the redevelopment of historical cities in response to rapid modernization [6].
Inviting walkable environments stimulate commercial vitality on shopping streets, generating increased pedestrian flows [7] and play an essential role in reviving or preserving the historic and cultural values of traditional central areas in historical cities [8,9]. Historical blocks tend to be pedestrian-friendly, and walking typically serves as the most important mode of transportation. In promoting the survival and redevelopment of historical blocks, the walking system can be considered the physical foundation for maintaining and protecting the spatial form and historic streetscape. Moreover, it provides important support for conserving the vitality of a city’s historical and cultural blocks [10]. Having been established well before the age of automobiles, the historical blocks in a number of cities have kept much of their walkable spatial scale and urban form [11]. However, in adapting to automobile-oriented urban development, the walking environments in many have been significantly affected. Pedestrian networks have become fragmented, resulting in increasingly serious connectivity and accessibility problems for pedestrian traffic [12,13]. Moreover, due to the lack of a well-maintained built environment (e.g., vacant buildings, old pedestrian infrastructure, and untidy streets)—which makes walking unpleasant not only for the elderly and people with disabilities but also for the resident population in general as well as for tourists—pedestrian movement in historical districts has been restricted [14].
Among the oldest cities in Asia, Xi’an, China, and Kyoto, Japan have central urban areas developed around a grid, with a chess-board-like network of roads. Both are ancient cultural centers that include not only pedestrian-friendly historical urban blocks, but also automobile-oriented modern urban areas [15]. Unlike many historical cities in Europe, Xi’an and Kyoto have faced extensive challenges in preserving their historic urban structure due to urbanization and motorization, as their streetscapes have not been well preserved; thus, modern and historical blocks are combined within the central historical districts [16]. In addition, their grid-based street networks have made it easier for cars to enter the historical centers [17], and the co-existence of automobiles and pedestrians has become problematic. Few prior studies have compared two Asian historical cities that have similar urban structures as well as distinctive development characteristics associated with their modernization [18,19,20].

1.2. Problem Statement

The main purpose of this study is to identify the inherited problem of historical cities regarding walkability using a comprehensive set of evaluative factors that tend to either improve or hinder the walking environment in the historical central districts of such cities. Given the similarities in their history and the urban form of their historical central areas, the cities of Xi’an and Kyoto were selected as appropriate case studies.
Various measures to assess the walkability of an area have been used in previous research. A walkability index typically reflects the ability to perform errands on foot from a residential location [21]. Broadly speaking, the concept of “walkability” is concerned with the quality of accessibility as a platform for daily life based on pedestrian mobility [22]. In order to solve the increasingly serious connectivity and accessibility problems of pedestrian movement, it is especially important to address the fragmentation of pedestrian networks and the difficulties in mediating the co-existence of automobiles and pedestrians resulting from automobile-oriented urban development.
In this paper, we consider two different spatial scales for walkability assessment: the macro-scale and the micro-scale. Macro-scale quantitative evaluation of walkability is primarily based on geographic information system (GIS) measurements, ranging from a city-wide scale to a neighborhood scale. Indicators related to urban form characteristics (e.g., intersection density, street connectivity, proximity to transit stops and urban amenities, and diversity of land use) are often used for the walkability assessment at the macro-level. From among these indicators, we chose to adopt the physical quantitative indicators measuring the connectivity and accessibility related to street structure using Space Syntax. Space Syntax is a common tool for evaluating the accessibility and connectivity of a space simply from its spatial geometric form (topological angle). Although an axial map can effectively show the connectivity at a city-wide scale as a means to show the street structure as it affects pedestrian movement (macro-scale), detailed characteristics of specific streetscapes should also be examined to show the built environment that tends to influence daily human activities and pedestrian movement. Thus, we judged it important to combine a micro-scale evaluation of such streetscapes (e.g., sidewalk conditions, street traffic) with a macro-scale assessment of street connectivity [23]. In particular, because of their grid-based urban structure, many Asian historical cities have their own special street view styles (e.g., architectural style, townscape, and street layout). Furthermore, in today’s Asian cities, many mixed-use and walkable streets have inherited specific features of the old city [24], and their historical blocks often have unique and attractive cultural and commercial shops [10]. Thus, a specific evaluation of walkability at the street level in historical blocks is needed. In this paper, micro-scale walkability entails the use of indicators that capture detailed characteristics of the built environment at the street level. To conduct our micro-level evaluation, we used a set of selected street view images of Xi’an and Kyoto using Baidu and Google, respectively.
As noted earlier, our ultimate aim is to identify improvement areas in the historical built environment that will promote and facilitate walking activities as part of an overall effort to create a pedestrian-friendly city. This paper begins with a brief review to building our micro-evaluation indicators for historical cities. On the basis of the indicators’ reliability of environmental audits, we establish micro-indicators, including perceived evaluation indicators with the characteristics of historical blocks, and objective indicators integrating depth learning into elements quantitative analysis. Furthermore, we combine the macro-indicators also related to the walkability to comprehensively evaluate the historical blocks. Next, in the conclusion and discussion, we make a specific analysis, comparison, and summary of the two historical cities, as well as a comparison of relevant research methods. Finally, we summarize the special and general suggestions, as well as the future prospects.

2. Literature Review (Building Our Micro-Evaluation Indicators for Historical Cities)

2.1. Existing Indicators for Micro-Scale Walkability

Insofar as our previous publication [25] presented detailed information on the macro-level evaluation of street connectivity using Space Syntax, our focus in this section is on reviewing the previous literature related to indicators for the assessment of walkability on the micro-scale (i.e., at street level).
To develop the indictors for walkability assessment and create the audit checklist that we applied to our case studies, we first reviewed some of the available audit tools. Clifton et al. [26] developed the Pedestrian Environmental Data Scan (PEDS)—a complete audit for evaluating a walking environment that has been used by academics in the field of transportation and physical activity research, as well as by practitioners seeking an assessment tool for prioritizing investments in public spaces. Sallis et al. [27] developed and evaluated a brief audit instrument that quantifies modifiable attributes of environments which can be easily used by practitioners. From the 120-item Microscale Audit of Pedestrian Streetscapes (MAPS) measure of street design, sidewalks, and street crossings, they created a 15-item version (MAPS-Mini) on the basis of associations with physical activity and attribute modifiability. Malecki et al. [28] identified the differences in built environment features across diverse communities and their impact on people’s health. They constructed the Wisconsin Assessment of the Social and Built Environment (WASABE) as an addition to a statewide household-based health examination survey, the Survey of the Health of Wisconsin (SHOW), to objectively measure participant neighborhoods. We found that while these prior studies address the use of comprehensive evaluations covering many aspects related to the built environment of Western or European countries, the specific characteristics of urban areas in Asian countries are not necessarily considered.
With regard to the Asian context [18,19], an objective assessment of the micro-streetscape pedestrian environment has been validated by using streetscape elements such as crowdedness on streets and the presence of man-made obstacles. Cerin et al. [18] developed an audit tool (EAST-HK) to objectively assess aspects of the neighborhood environment that may affect walking in Hong Kong and similar ultra-dense Asian metropolises, including 91 items designed to capture the four main built-environment multidimensional themes of functionality, safety, aesthetics, and destinations. Hanibuchi et al. [19] simplified Cerin’s audit tool and examined the indicators for virtual auditing; their three aspects—physical conditions, safety, and aesthetics—basically corresponded to the themes of EAST-HK [18]. The authors used indicators for measuring objective aspects of the walkability such as sidewalk width, the amount of vegetation, and road traffic.
It has been widely discussed by previous authors that walkability is not only affected by various objective elements, but also by the subjective perception of individuals who walk certain streets or routes [29]. Thus, we reviewed some of the key literature on perceived walkability, with an emphasis on the determinants and effects of perceived walkability and how it relates to objective walkability [30,31,32,33]. The key indicators frequently used in the previous literature include building–environment characteristics such as street furniture and pavement, as well as perceived suitability and ease of walking. Using photographs, Oreskovic et al. [33] concluded that perceived walkability is mainly affected by the building environment and street view; specifically, based on the presence of building windows, focal points, pedestrians, and cars. Van der Vlugt et al. [32] used a structural equation modeling (SEM) approach to investigate the relations among travel attitudes, socio-demographic factors, objective walking accessibility, perceived walking accessibility, and realized walking behavior. Otsuka et al. [31] found that walkability is strongly influenced not only by the built environment structure as it affects walking distance to destinations, but also by micro-scale detailed elements such as the quality of the pavement, the presence and nature of street furniture, and the presence of trees and greenery. It is evident from such previous research that walking (frequency and duration) is not only affected by objective elements, but also by the subjective quality of an area and the perceived suitability and ease of walking.
In addition, articles focused on the characteristics and walkability of specific historical blocks and the traditional aspect have also appeared [34,35]. Li [34] discussed walkability in historic cities/urban spaces and noted that historical cities have assets that possess both cultural and economic value. Yin et al. [35] used the historical city of Xi’an as an example and found that perceived walkability positively affects life satisfaction, both directly and indirectly, through travel satisfaction. Both articles [34,35] recognize the importance and uniqueness of perceived walkability as it relates to the built environment in historical cities.
Based on our review of the literature, we selected a limited number of evaluation items that had been frequently used in prior audits and that could play a significant role in assessing, on a micro-scale, the walkability of historical cities such as Xi’an and Kyoto. The following are the ten items that we selected:
(1)
Well-maintained built environment (no decrepit infrastructure or abandoned buildings)
(2)
Well-designed build environment (beautiful/aesthetic)
(3)
Clean and tidy built environment
(4)
Obstacle-free built environment
(5)
Attractive and lively built environment (presence of commercial and lively stores)
(6)
Traditional streetscapes/preservation of historical buildings
(7)
Sidewalk
(8)
Vegetation
(9)
People
(10)
Vehicular traffic (i.e., four-wheel vehicles only)

2.2. Determination of Evaluation Item for Walkability

We divided the micro-level indicators for walkability into two categories—perceived indicators and objective indicators—and used both the perceived- and objective-evaluation indicators of street views and their descriptions in our case studies. Table 1 lists the indicators and the previous studies in which they were used.

2.2.1. Perceived Walkability Evaluation Indicators

Urban design includes the arrangement and appearance of built and natural features in a community (e.g., landscaping and building architecture); the transportation system encompasses facilities, infrastructure, and services that link locations. All of these dimensions of the built environment have been found to be related to physical activity [18]; it has also been found that people’s perceptions can be influenced by such physical characteristics in urban areas. Perceived walkability is principally affected by the building environment and street view [33]. For our study, we identified six main indictors to assess perceived walkability.
(1)
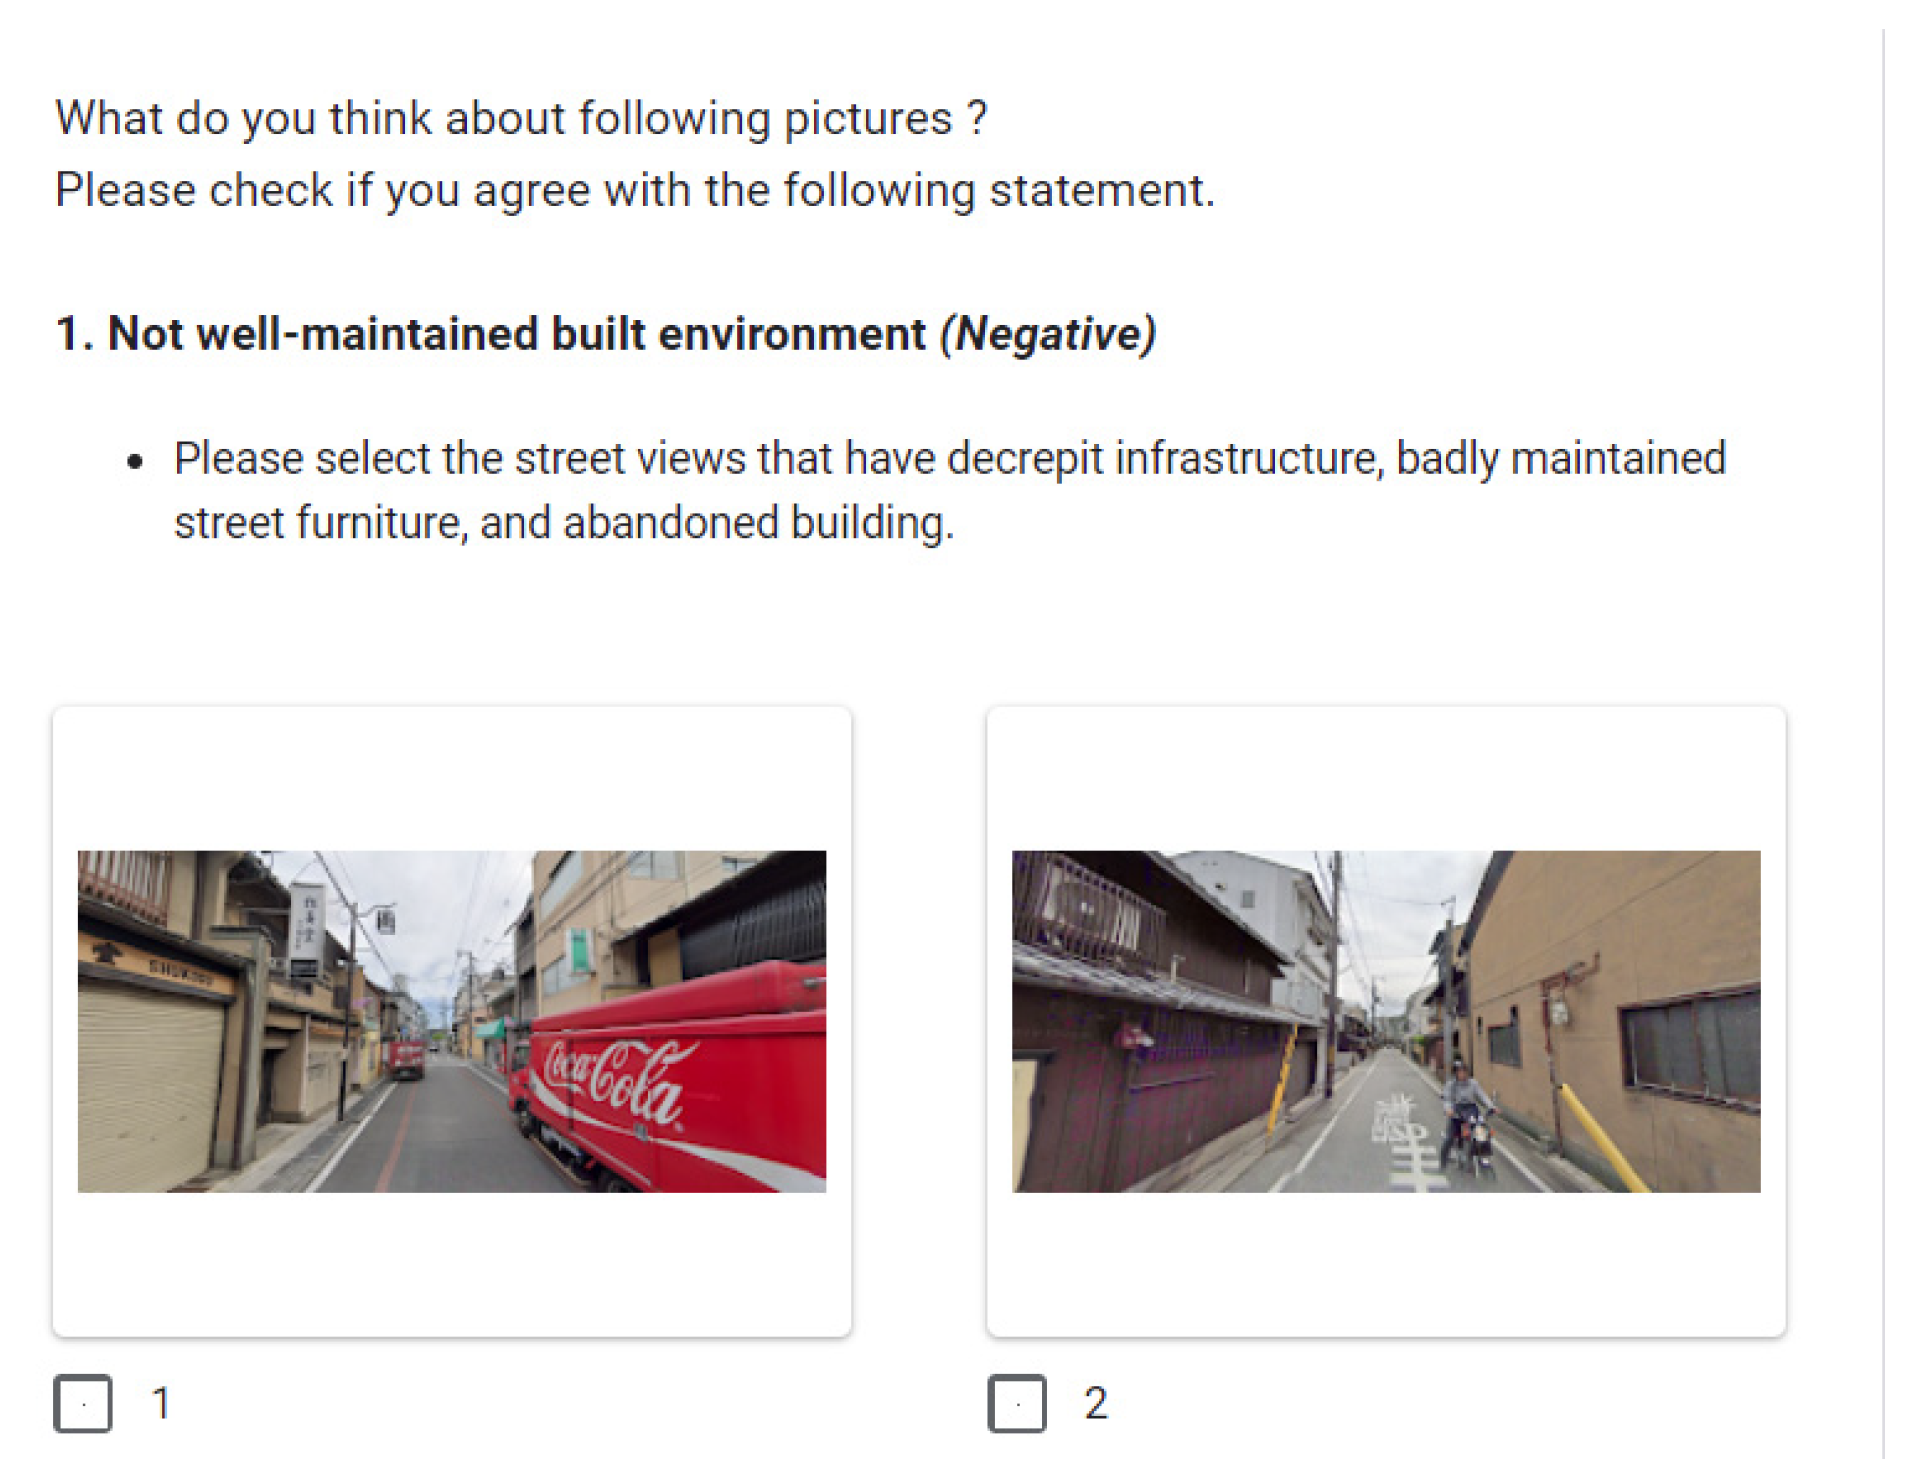
A Well-maintained built environment is a basic condition affecting the way people perceive their walking routes [26,36]. The indicator of well-maintained built environment includes two main aspects: the presence of decrepit infrastructure (seats, garbage cans, snacks, poles, fences, pipes, walls, etc.), and structures such as those that are abandoned or under construction that can be judged by their appearance.
(2)
A Well-designed built environment is the aesthetic aspect [18,27] and is judged by the beauty/ugliness of the street view.
(3)
Cleanliness is notable for multiple aspects of the pedestrian environment [19,26]. The cleanliness of the built environment can be evaluated based on the presence of litter, garbage, broken glass, etc.
(4)
An Obstacle-free street is an important factor affecting walking. Sidewalk obstructions are undesirable since they reduce the amount of walking space available and force pedestrians to take detours [18,19]. Here, obstacles are mainly evaluated based on whether a large number of bicycles (or two-wheeled electric vehicles), uneven pavement, or signboards that affect walking are found along the road.
(5)
An Attractive and lively built environment refers to the aesthetic and commercial aspects of a street [18,27]. The presence of interesting stores is evaluated as a main characteristic of a historical district and can play a significant part in forming an attractive and lively built environment.
(6)
Traditional streetscapes and the preservation of historic buildings are crucial to the evaluation as these factors can have a strong influence on people’s perceptions. The characteristics of an area, such as streetscapes, building appearance, and the identity of the area—especially in a city’s historical blocks—have begun to appear in the discourse on urban planning, environmental psychology, and tourism management, with a focus on the tie between people and place [34,37]. The conservation of old cities can be regarded as part of a region’s cultural heritage, seen within the context of modern urbanization. Historical cities have assets that have both cultural and economic value [15]. Thus, because these factors have a strong influence on people’s perception, the evaluation of traditional streetscapes/preservation of historic buildings is an important piece of the evaluation puzzle.

2.2.2. Objective Walkability Evaluation Indicators

The four objective walkability indicators used in this study include sidewalk/mixed road, vegetation, vehicular traffic/cars, and people flow. Importantly, these factors are not part of the above list of perceived indicators.
(7)
The presence of a Sidewalk has been associated with directness of walking routes and an influence on the levels of physical activity [19,28]. Sidewalks are delineated from road by something other than just marking, such as curbs or poles (which may be minor). They are often higher than the surrounding road and proceed along the sides of the road [38].
(8)
Vegetation as a neighborhood characteristic is a positive aesthetic evaluation element and a micro-scale detailed element affecting walking. Vegetation includes trees, hedges, and all types of vertical vegetation on both sides of a road or beside a building [27,31].
(9)
The presence of People on the street is used as an indicator in the evaluation since it shows effective movement and active transportation across the environment [18,28]. Good people-flow/passage is based on the presence of people.
(10)
Vehicular traffic is used as an indicator as such traffic prevents the safe and effective movement of people through the environment [28,33]. Four-wheeled vehicles are included to assess traffic flow.
Using the six perceived indicators and four objective indicators, we developed a simple checklist to measure micro-scale walkability. Based on street view pictures, an evaluation was made by determining the indicator scores for the selected areas in Xi’an and Kyoto. Taken together, the above ten indicators were the basis for calculating our Walkability Evaluation Scores (WES).

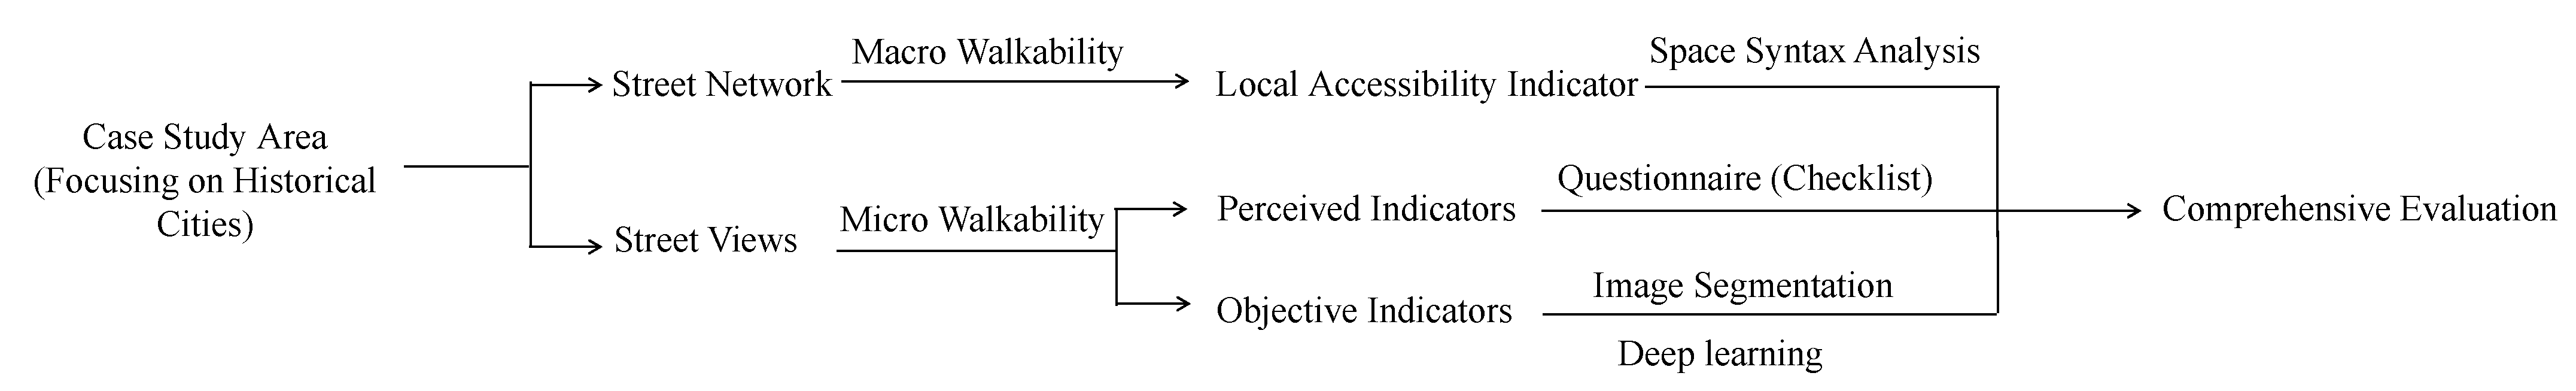
3. Materials and Methods

Assessment procedure includes six steps in turn: determining case study area; selection of site points and street view images; perceived walkability evaluation; objective walkability evaluation; micro-evaluation (combing the perceived and objective indicators); and adding macro-scale evaluation indicators of walkability (Figure 1 as below).

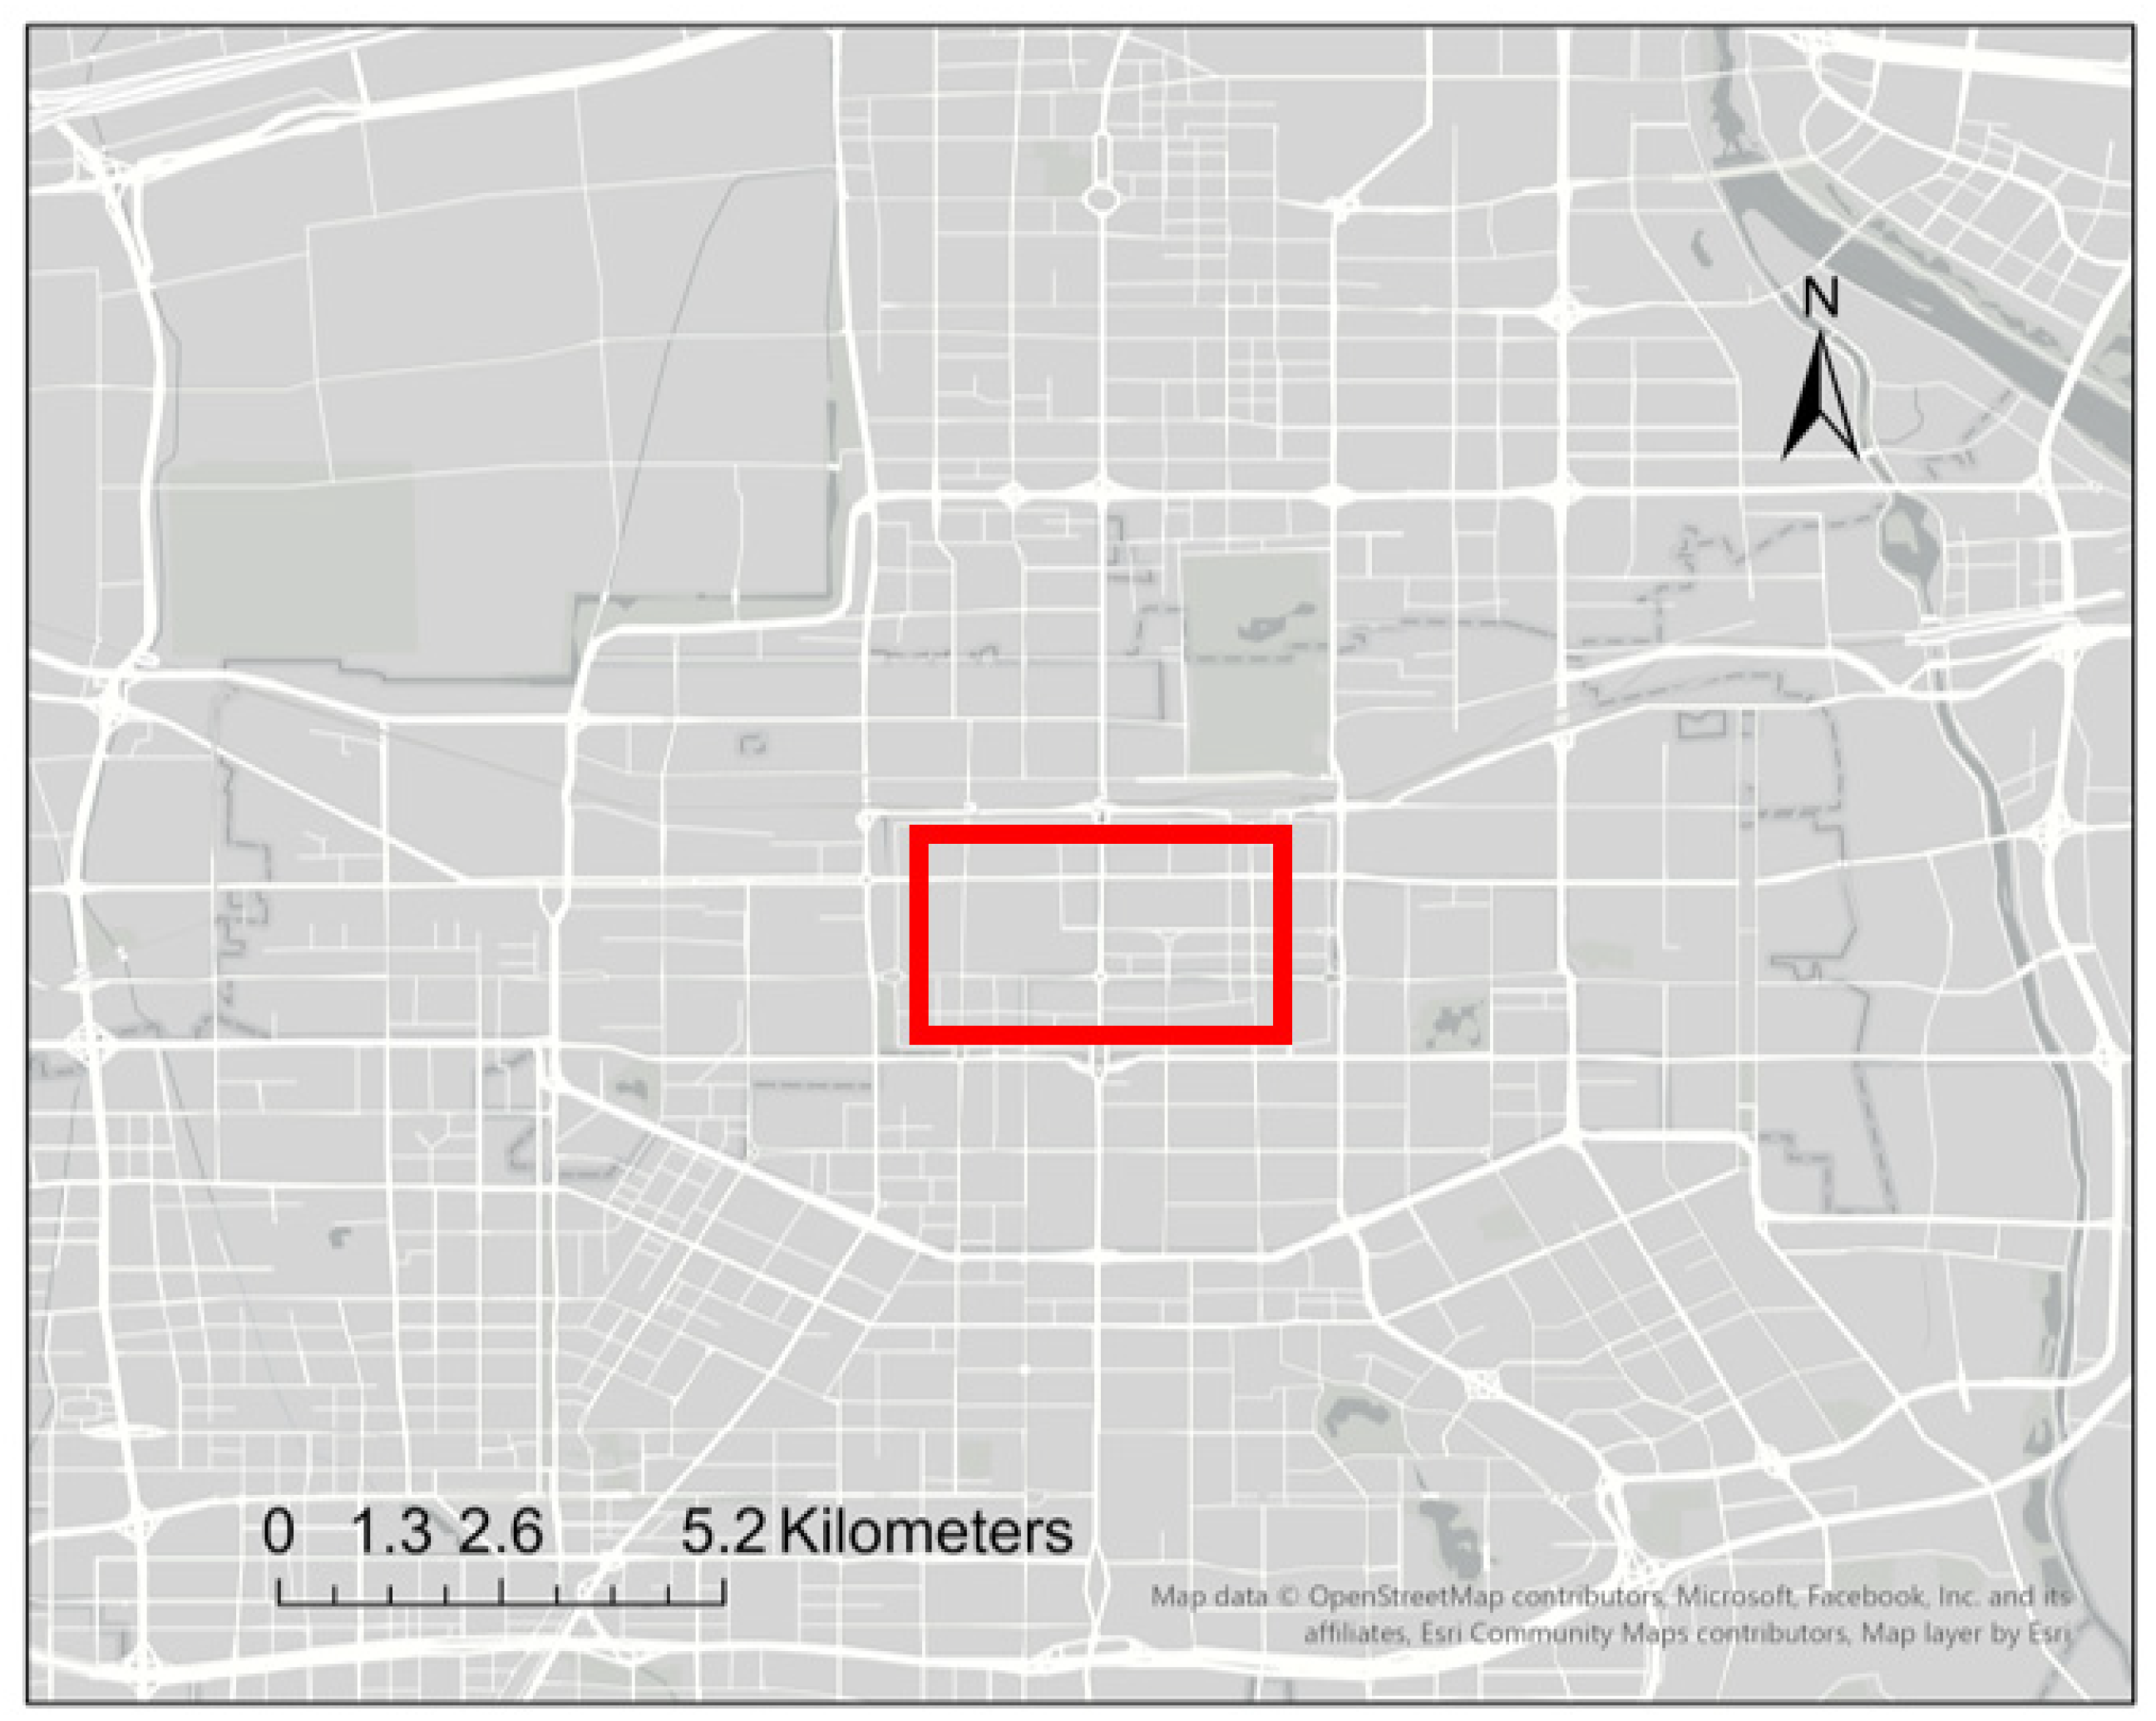
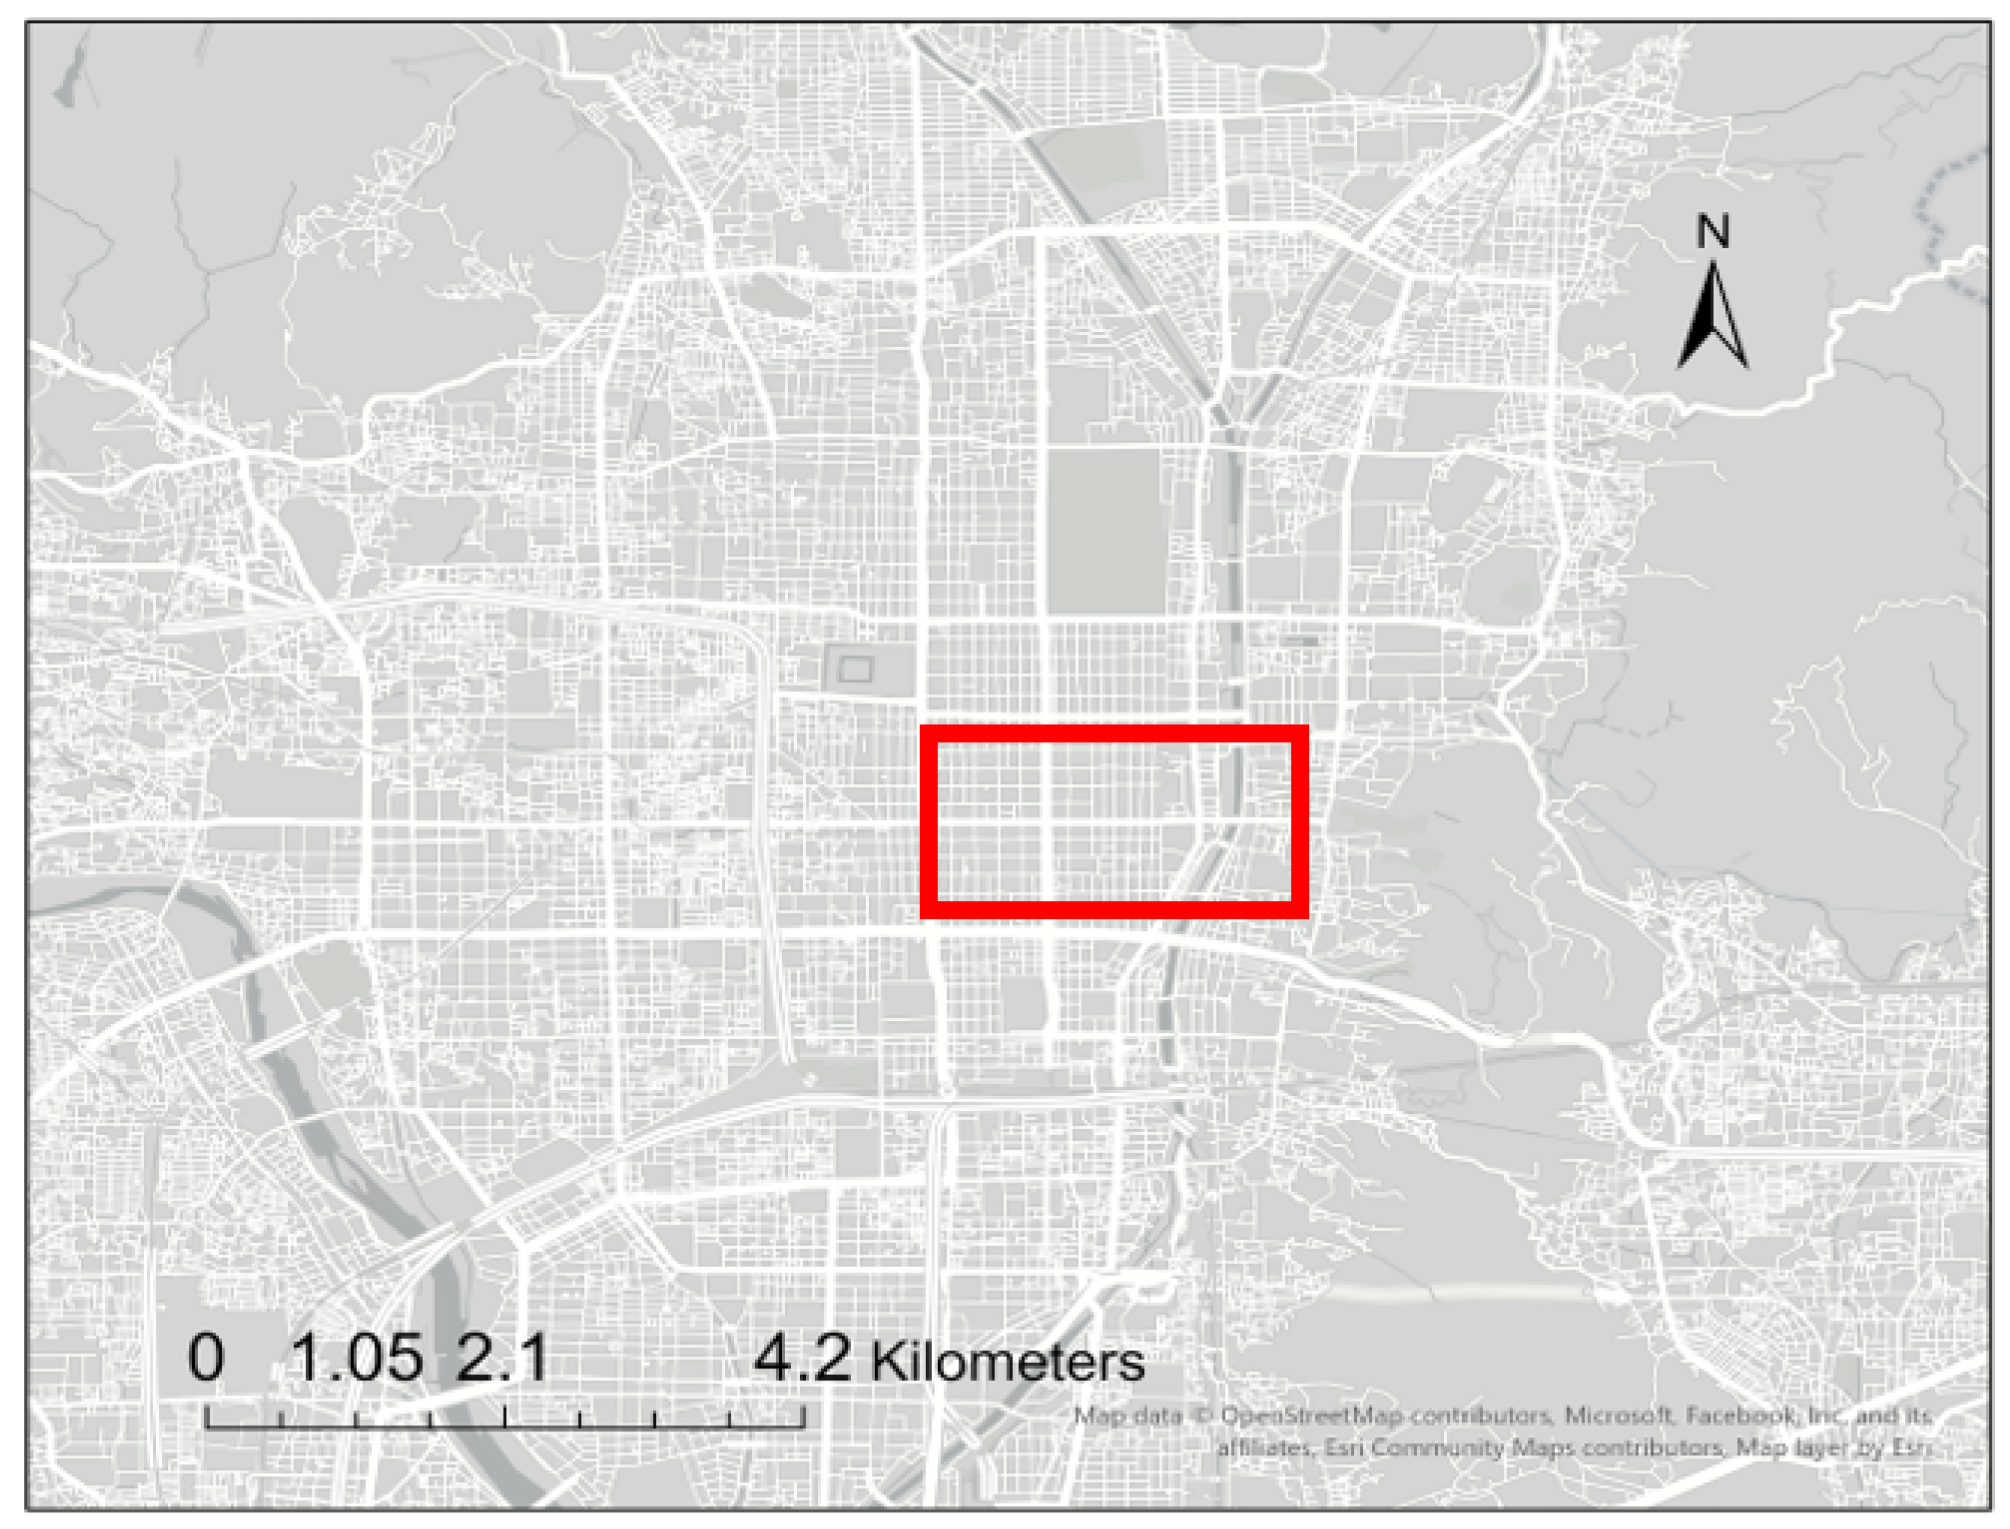
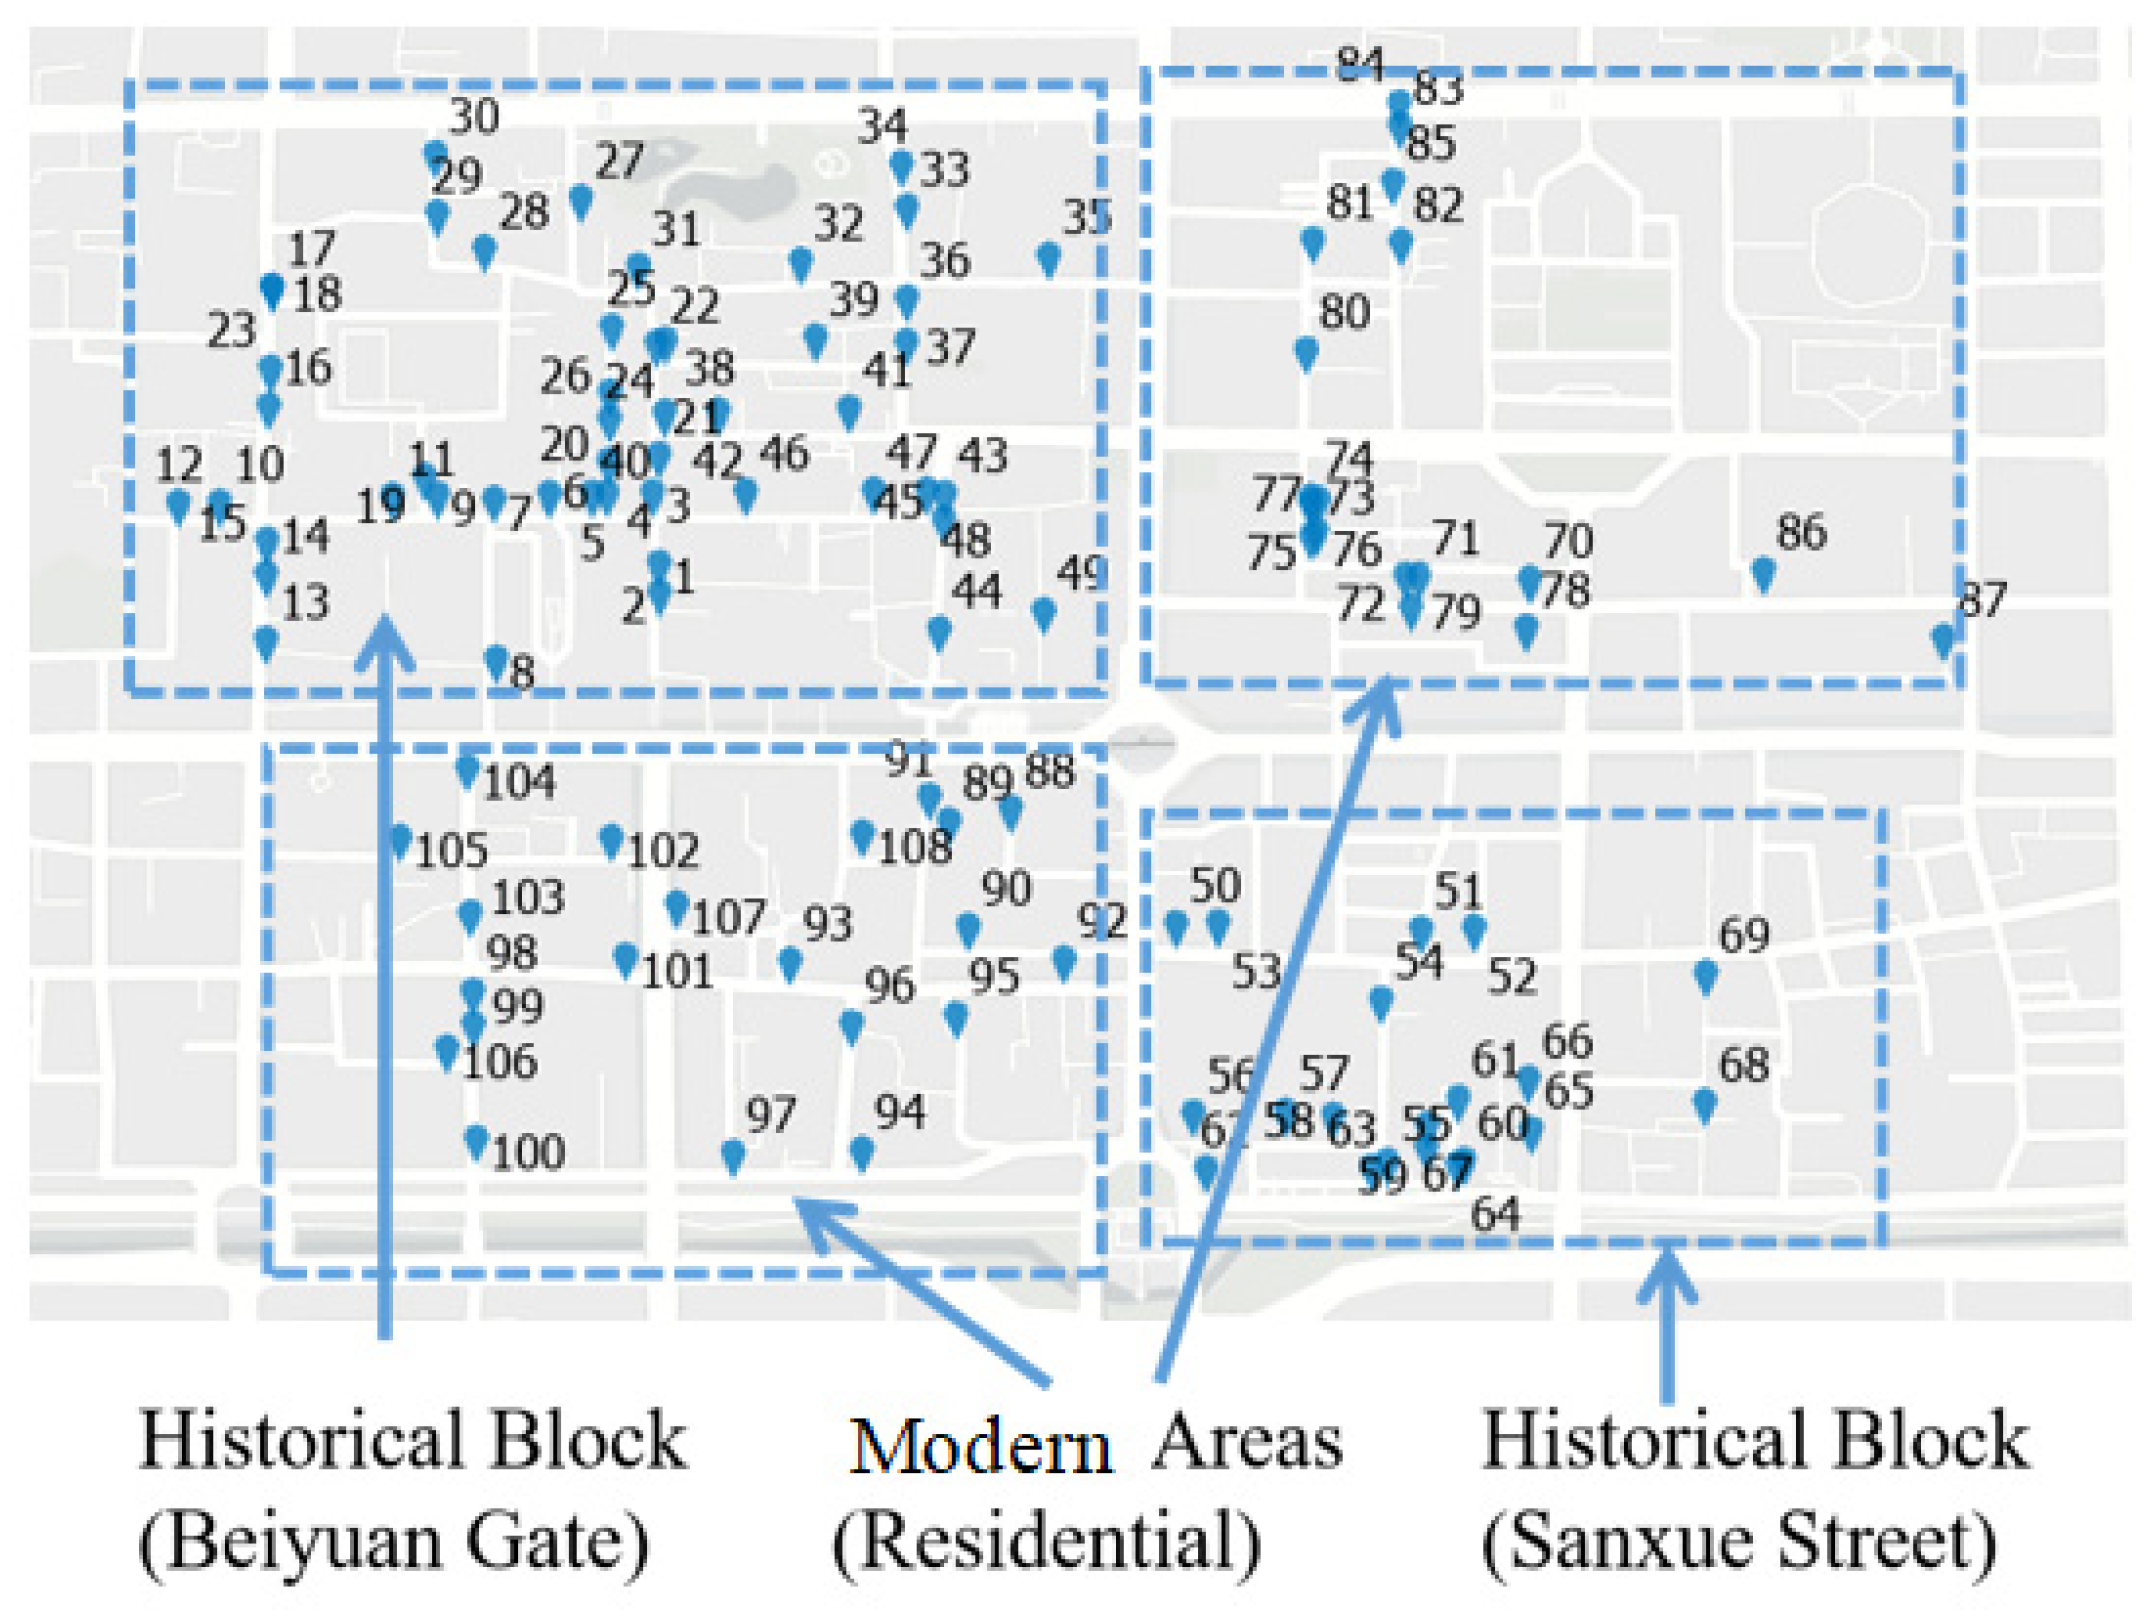
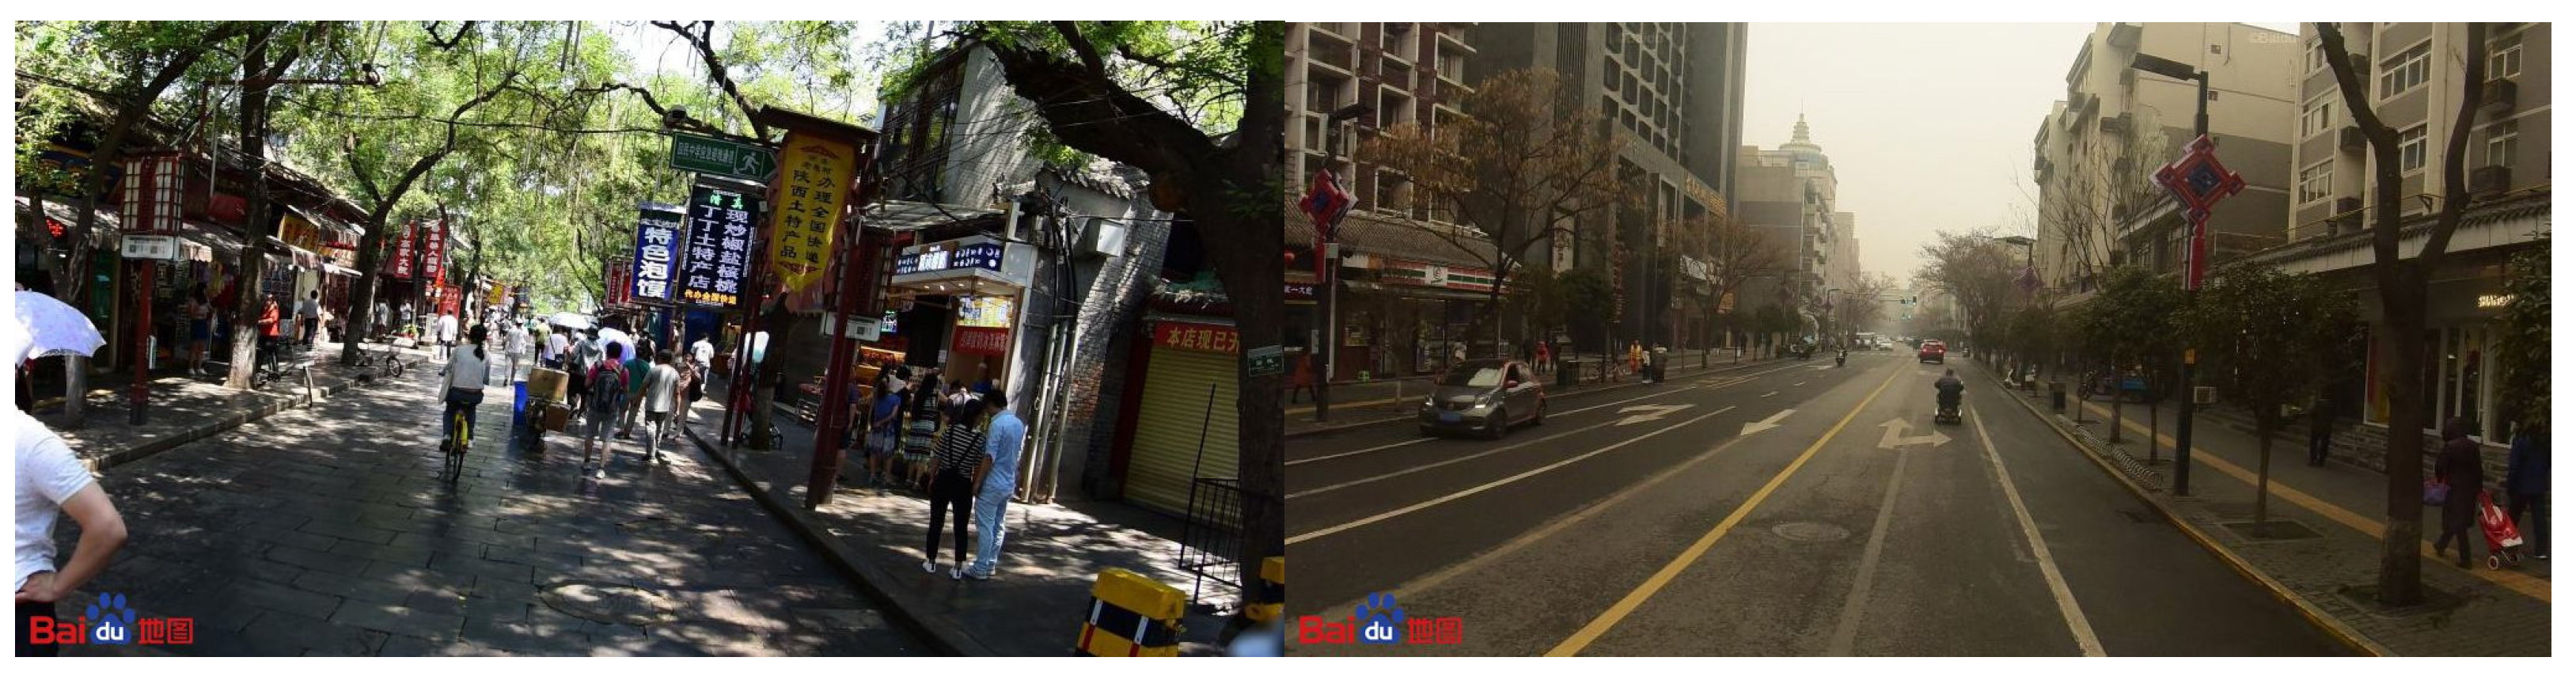
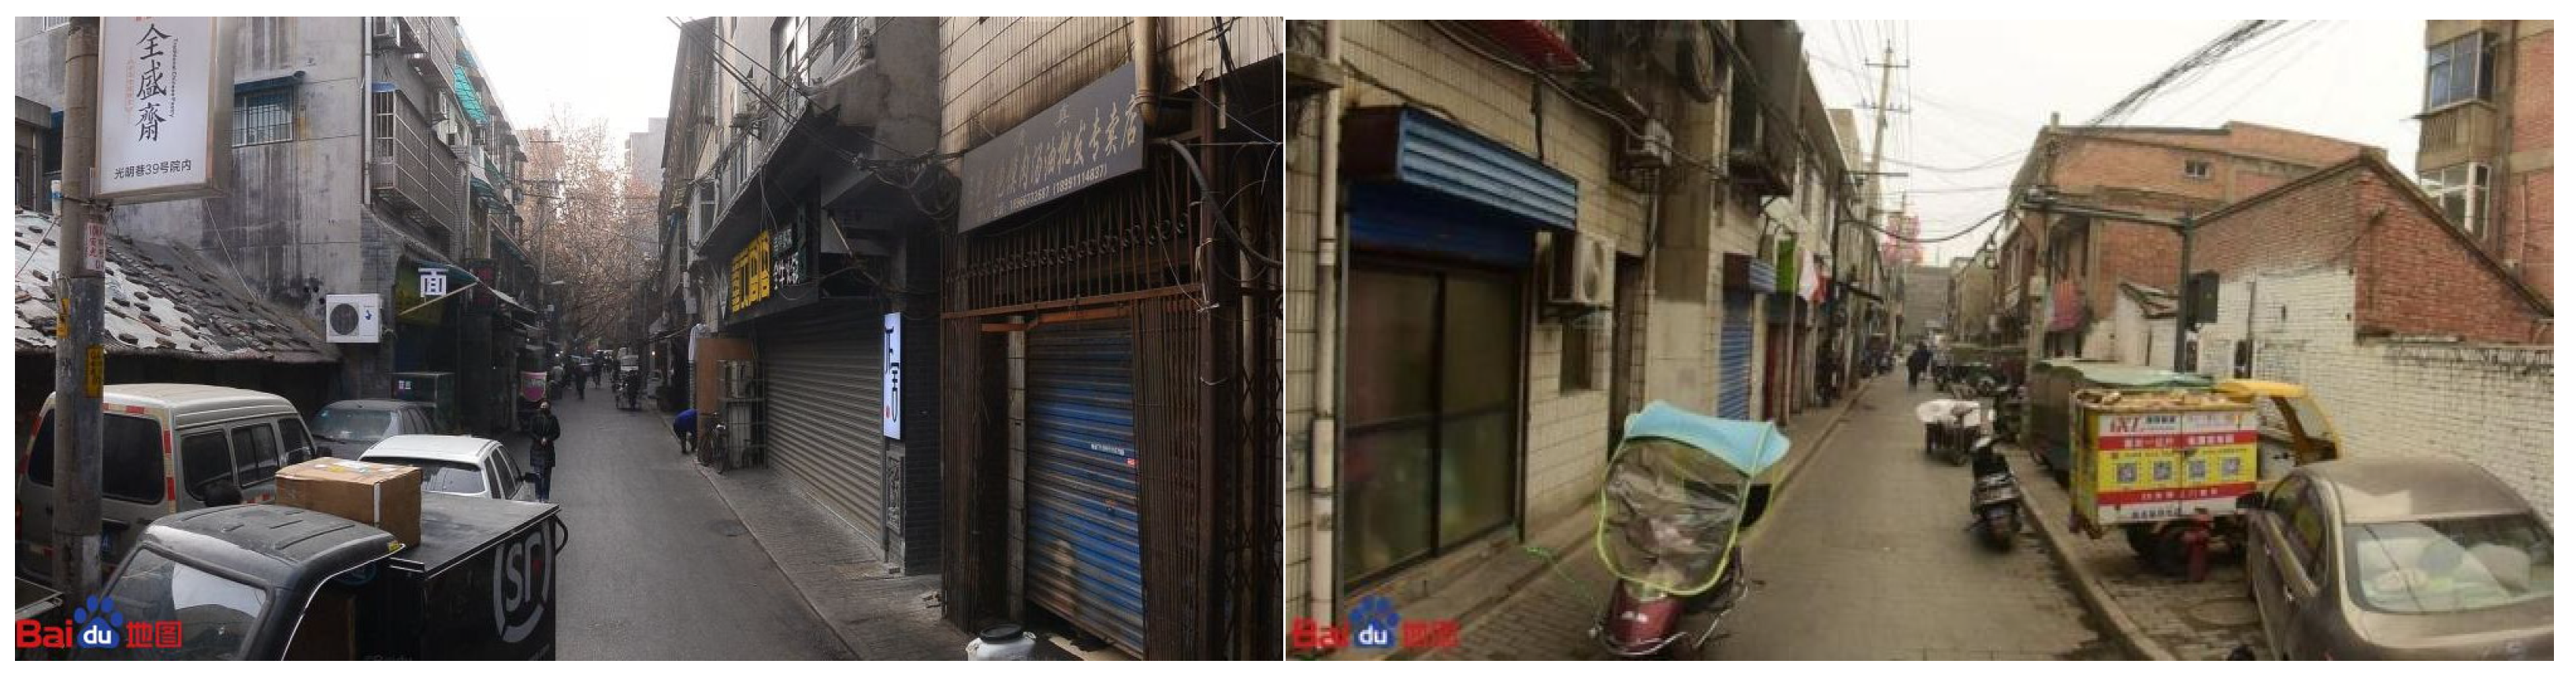
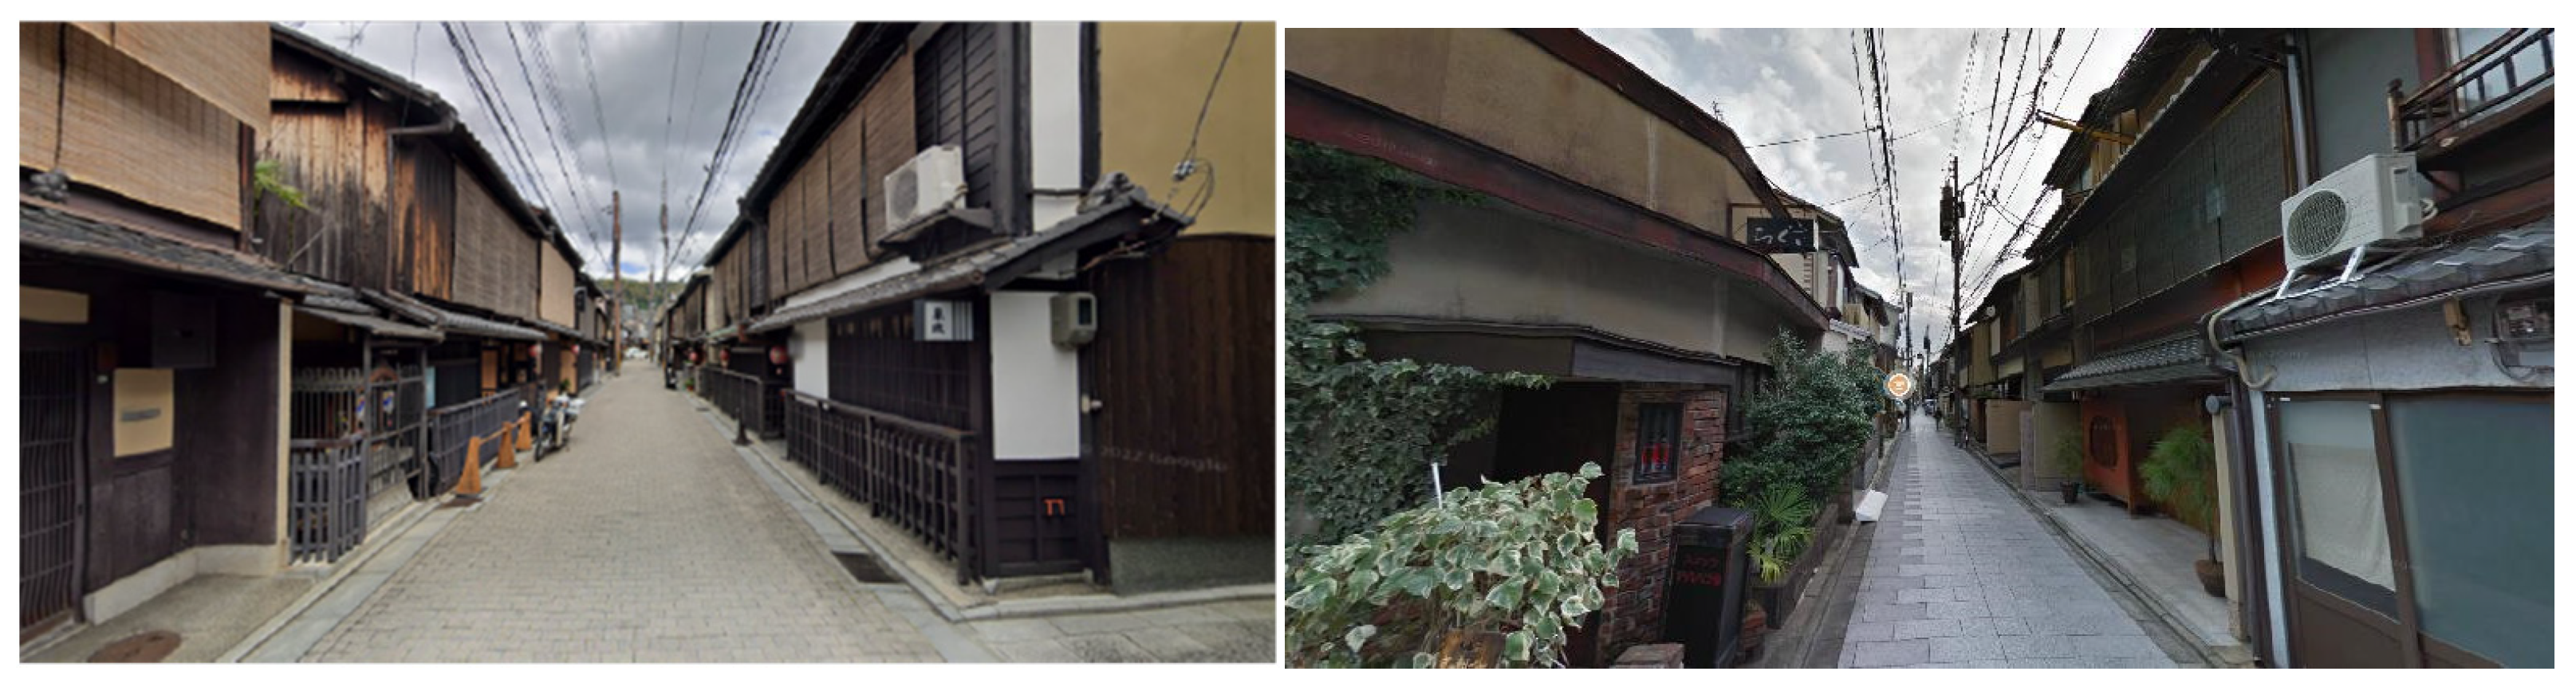
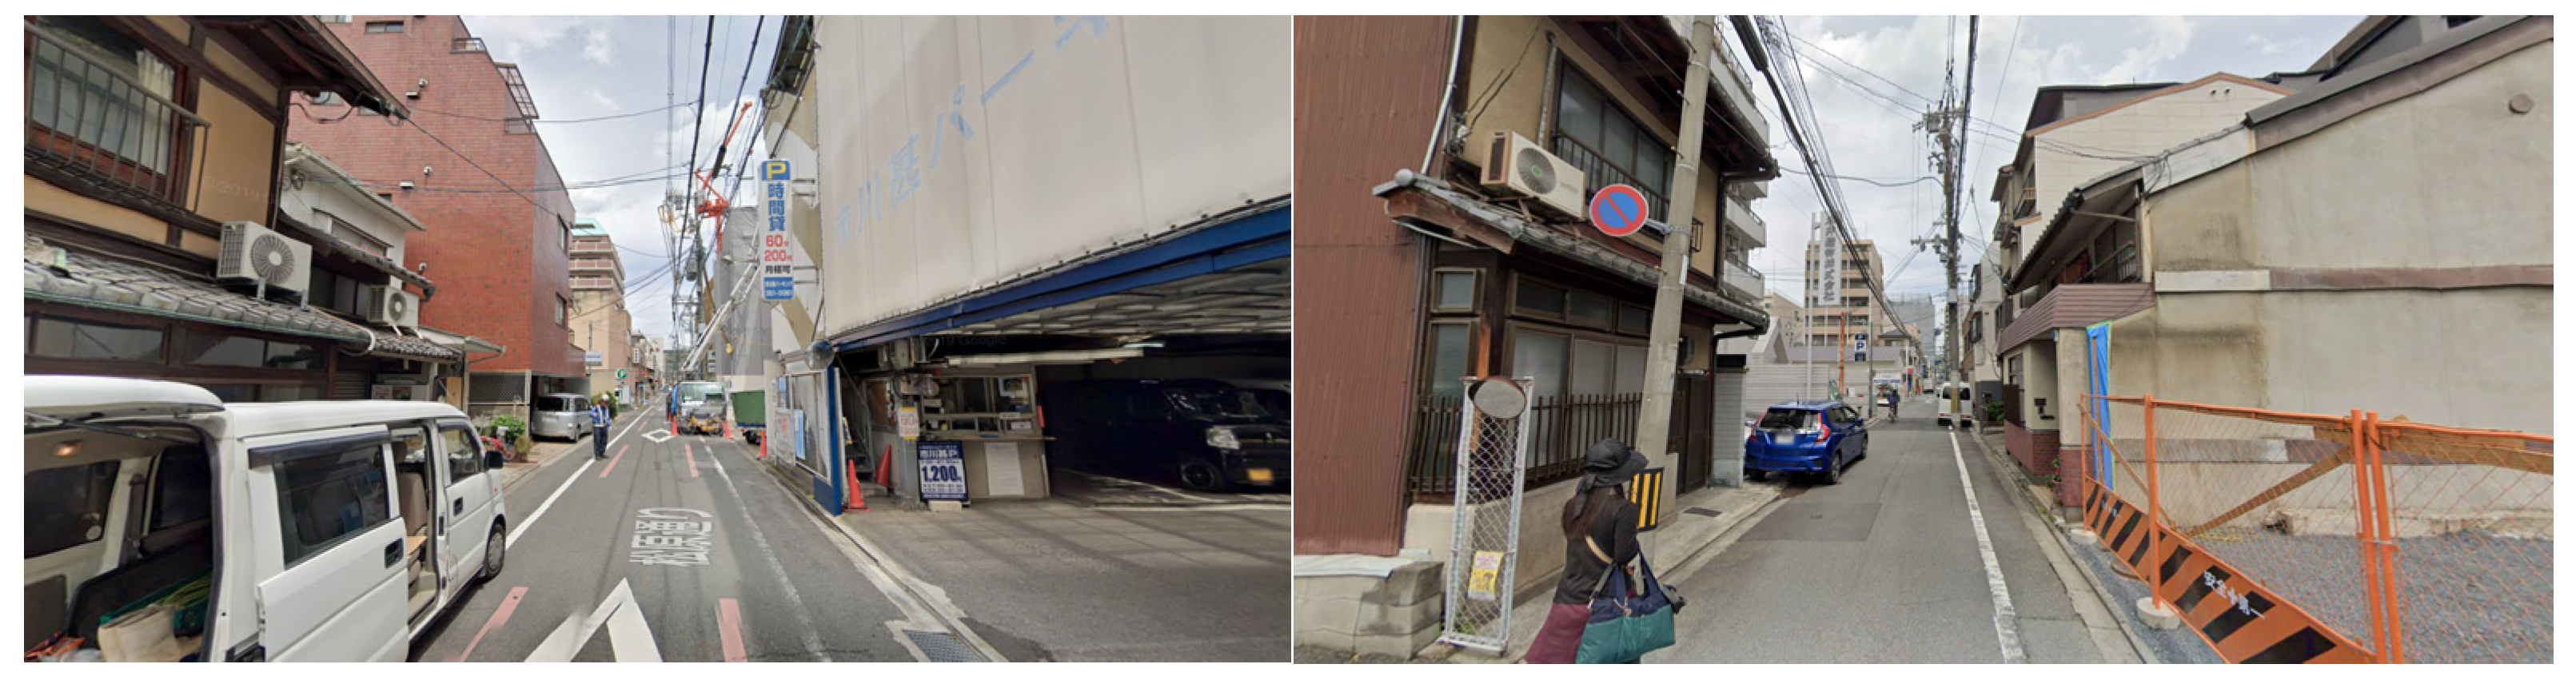
3.1. Case Study Area

The historical core districts in the two selected cities served as our research targets. The main urban area of Xi’an contains the old urban blocks within the city walls. An area of 1.5 × 2.5 square kilometers that includes the Beiyuanmen and Sanxue Street historical block was selected for evaluation (Figure 2). In Kyoto, the city center area (Shimogyo Ward and Nakagyo Ward) was the target. From this area, we selected the “Tanoji area” and the “Gion area,” comprising a total of 1.6 × 2.3 square kilometers (Figure 3).
It should be noted that the selected area in each city includes two distinctive types of areas: pedestrian-friendly historical blocks (hereafter referred to simply as historical blocks), and car-oriented modern areas (i.e., residential areas where few tourists are seen). The historical blocks in Xi’an are located in the northwest and southeast part of the old city area within the city wall; the northeast and southwest areas are the modern sections. The historical block in Kyoto is located on the east side of the selected area; the modern section is on the west side.

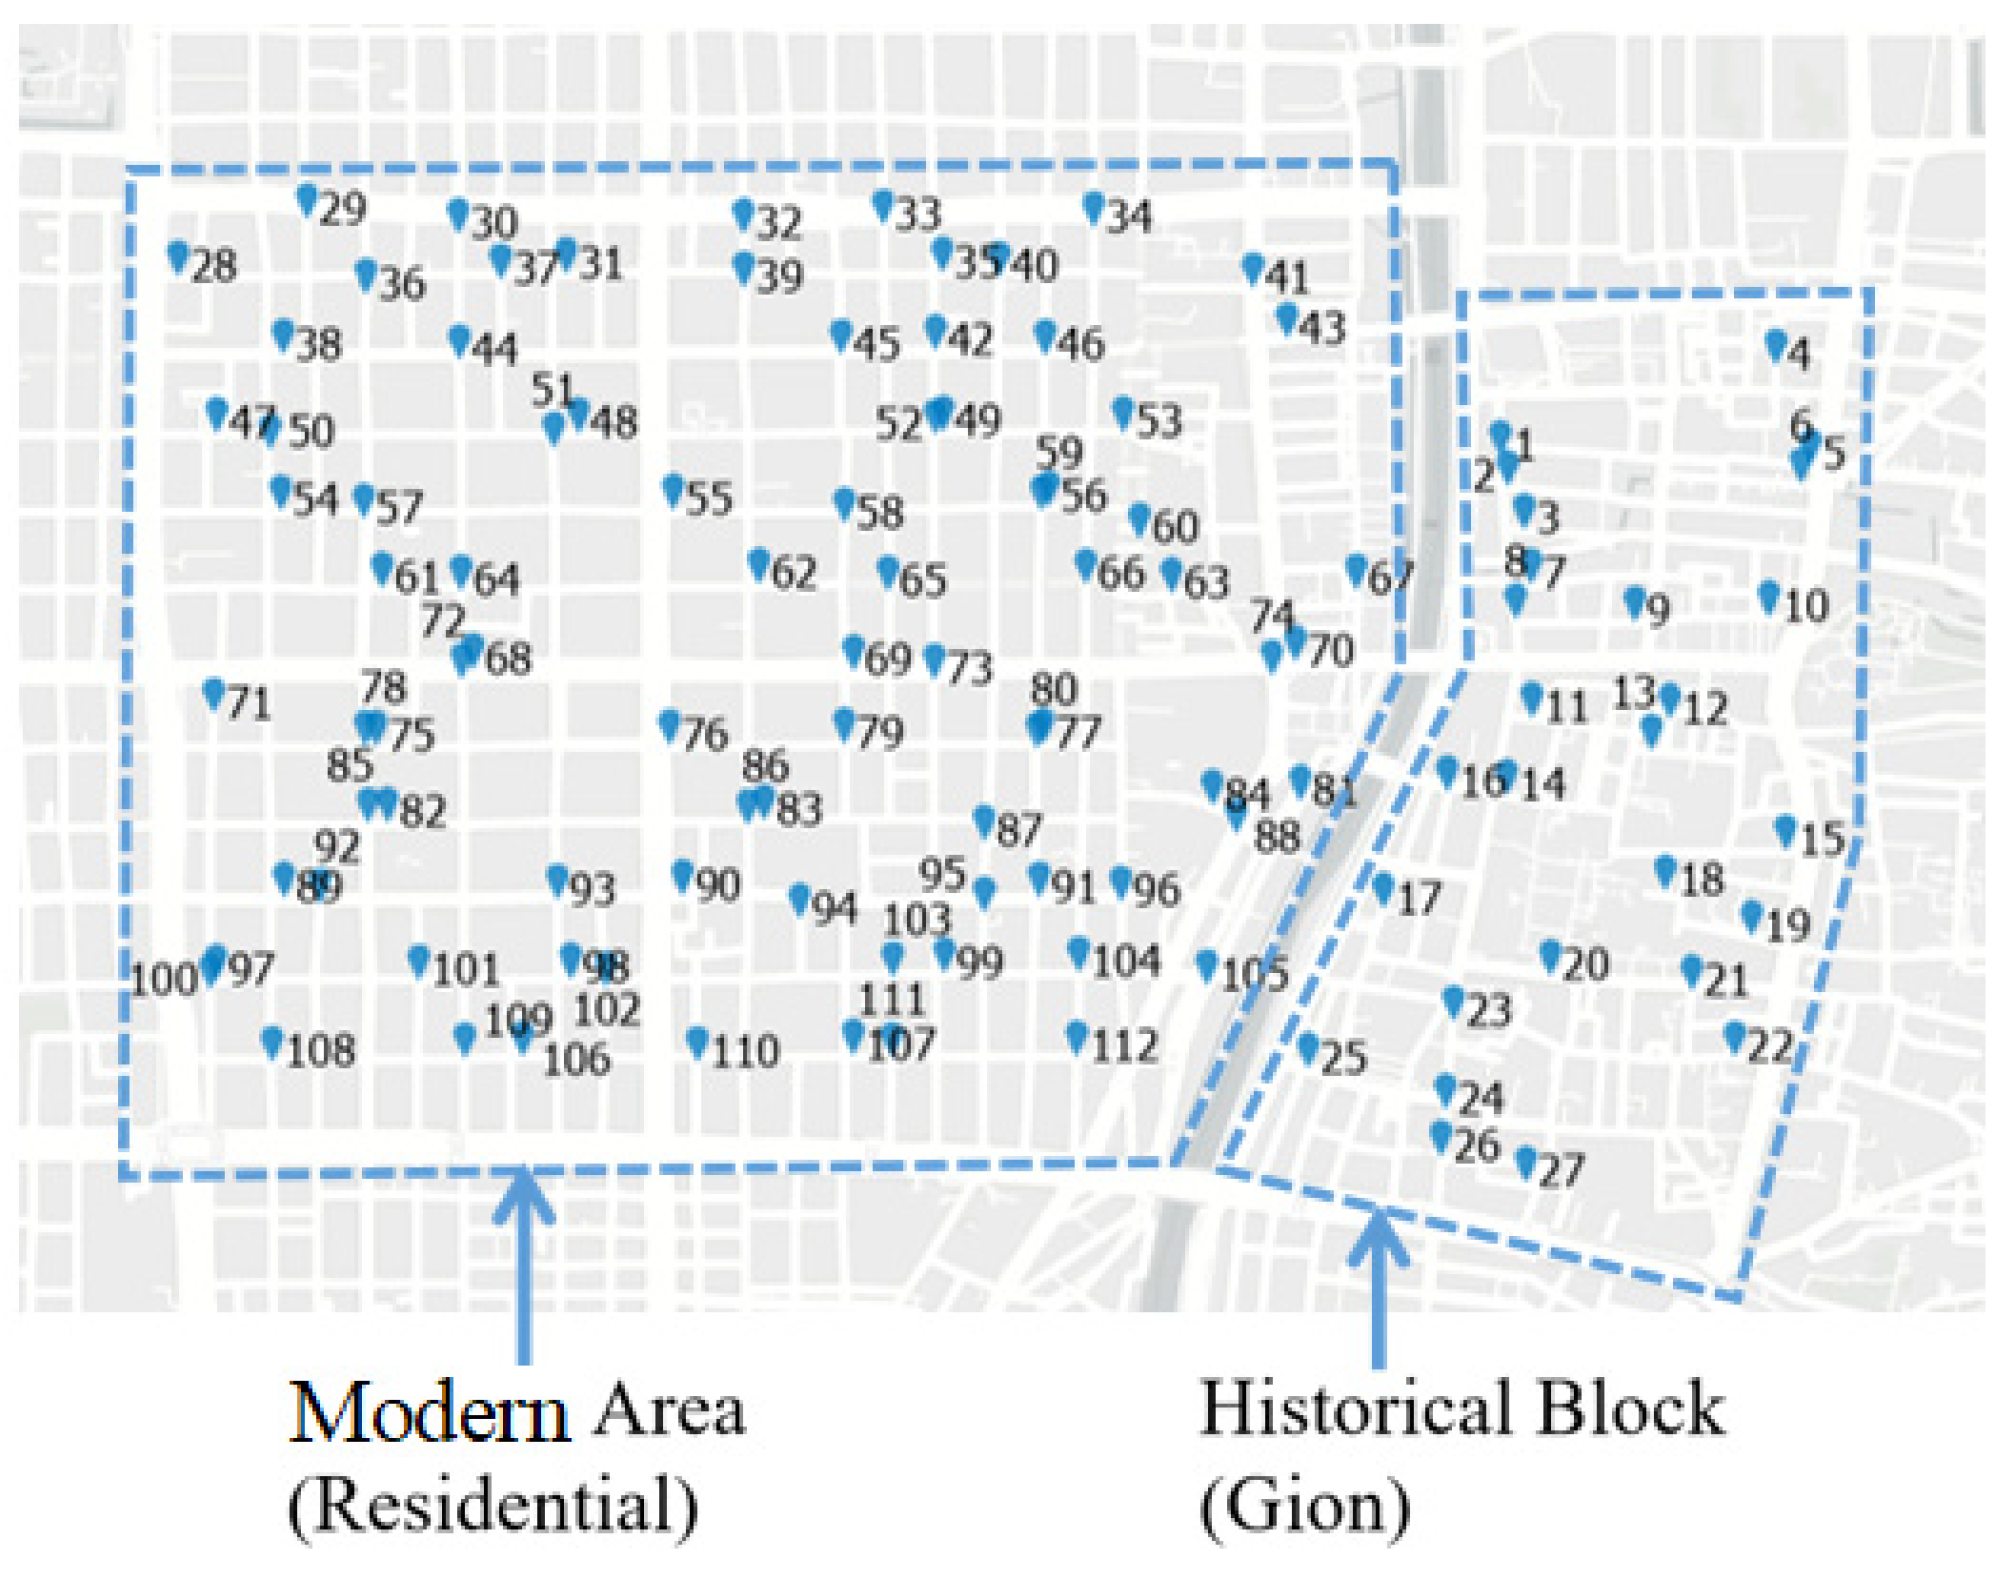
3.2. Selection of Site Points and Street View Images

In order to examine walkability on the micro-scale, we obtained street view images using API (Application Programming Interface) data from Google and Baidu (the photos were taken in the spring of 2019). The longitude and latitude of the intersections (crossroads) in the research areas were first confirmed with ArcGIS, after which the angle of each intersection, in four directions, was calculated, and the street views were downloaded using the API. It should be noted that the photos used from both areas are street views collected by Google and Baidu over a period of time, so it was not possible to identify the specific time information of a specific street view. For example, we could not determine the specific time of image acquisition or whether the image was taken on a weekday or a weekend.
To ensure consistency in the visual street angle of the downloaded images, the horizontal direction of the street was determined by longitude and latitude; the vertical focus used the end (vanishing point) of the road as the midpoint. A quartering method was used to choose 108 viewpoints from a total of 430 Xi’an street views (Figure 4), and 112 view points from a total of 450 Kyoto street views in all directions for each intersection (Figure 5).

3.3. Perceived Walkability: Using Google Forms to Record the Perceived Evaluation Indicators (from Q1 to Q6)

Evaluation of the “perceived assessment” of walkability for the selected street views was carried out by auditors using the six perceived evaluation indicators developed for the study (Table 1, Q1–Q6). The forms used in the evaluations were created on Google Forms (Figure 6). Statements regarding the six items on the walkability checklist were presented to the auditors; for each statement, the auditor was shown street view pictures from Xi’an and Kyoto. From the first to the final picture, the auditors were asked to choose either the positive or negative evaluation option on the Google form according to the six questionnaire prompts, and to complete the procedure for all six indicators for every picture.
The WES assessments for Xi’an were made by 10 evaluation auditors (8 males and 2 females). For Kyoto, the assessments were made by 13 evaluation auditors (10 males and 3 females). The auditors were students at Osaka University in their twenties or thirties, as well as members of the staff at the University. The auditors had a related background in the subject area, as all belonged to the Department of Engineering with a specialization in architecture (Table 2).
During their assessments, the auditors independently conducted audits of all the street view pictures, using Google Form to record their responses. The research team provided the auditors with clear instructions for the scoring of items on the walkability checklist. The image evaluations were performed for all selected points to determine the score for each indicator and each street view. Ultimately, the average values for all the auditors were determined.

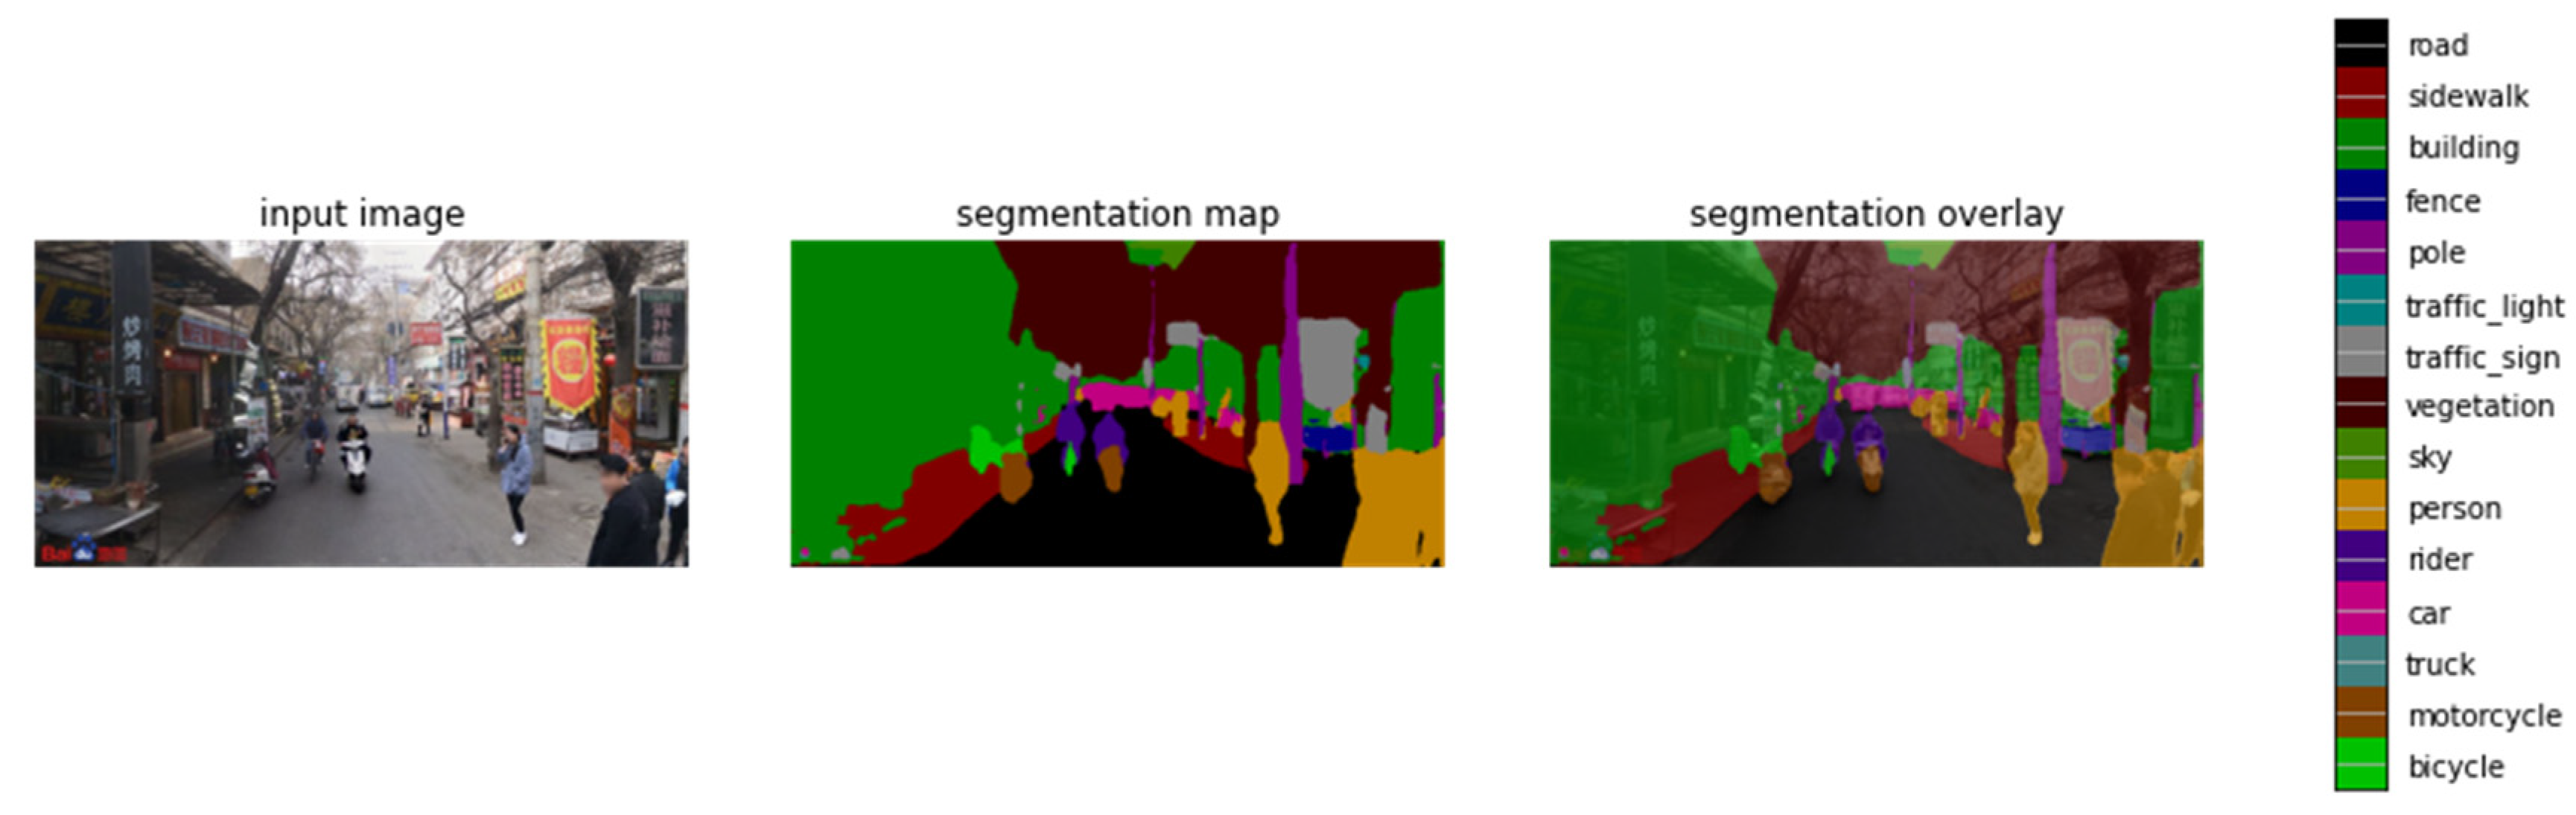
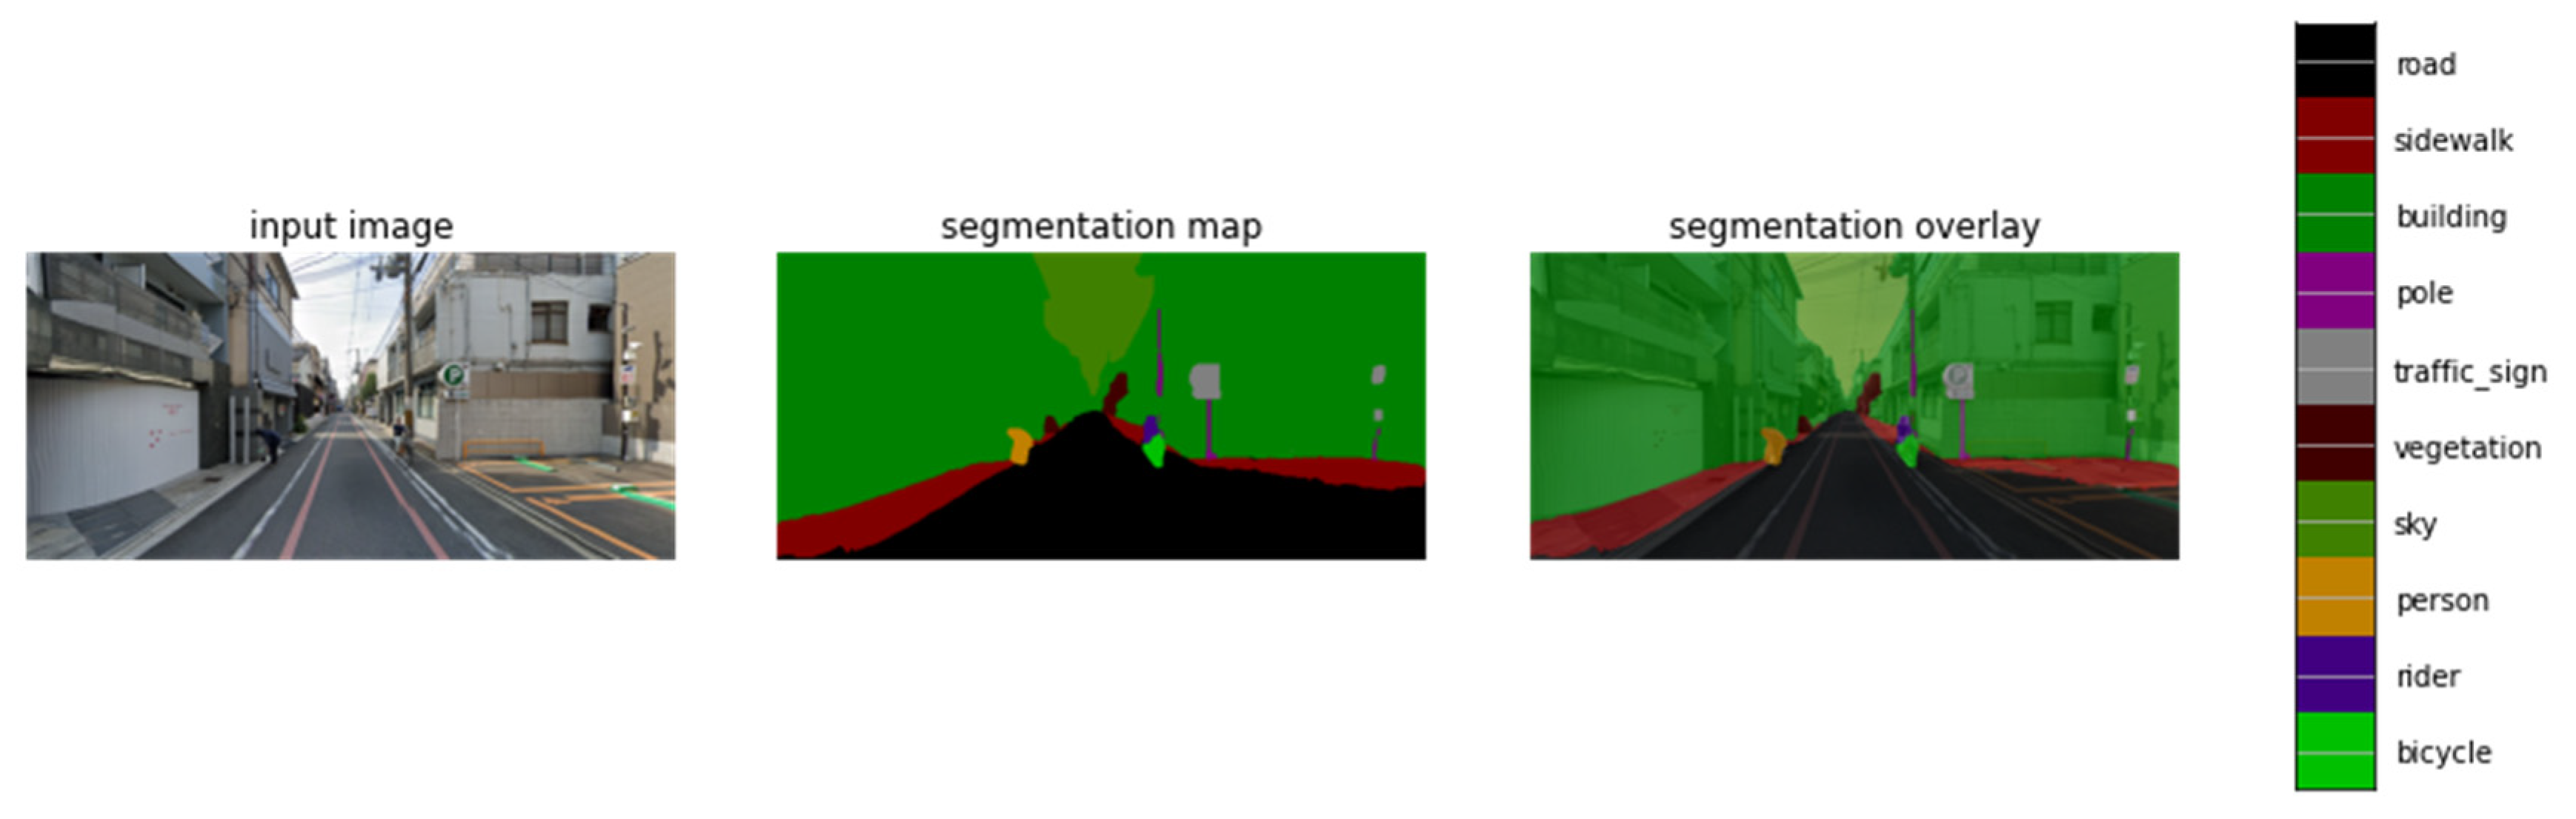
3.4. Objective Walkability: Using the Percentage of Street Components by the Image Segmentation Method for the Objective Evaluation Indicators (Q7 to Q10)

The objective assessment of walkability in WES used the percentage of street components (roads, trees, etc.) (Table 1, Q7–Q10) automatically identified by an image segmentation method based on deep learning (DL). In particular, this study employed the DeepLab V3+ model, which applies an Encoder-Decoder with Atrous Separable Convolution for Semantic Image Segmentation [39]. This is extended for DeepLabv3 to include a simple yet effective decoder module to refine the segmentation results, especially along object boundaries.
We used the top-performing DeepLab V3+ model trained on the Cityscapes dataset [38] named xception71_dpc_cityscapes_trainval, with a Cityscapes mIOU (Model evaluation index: Mean Intersection over Union) of 82.66%.
The Cityscapes dataset is an image dataset with an annotation of streetscape segments. The annotation is defined for 30 classes based on seven groups of streetscape components (ground, human, vehicle, building, infrastructure, nature, and sky), which were modified from the Cityscapes class definitions. The dataset provides 19 classes for training (road, sidewalk, building, wall, fence, pole, traffic light, traffic sign, vegetation, terrain, sky, person, rider, car, truck, bus, train, motorcycle, and bicycle); the other 11 classes, such as bridge and pole ground, were excluded from the dataset due to the rarity of their appearance in the streetscapes [38]. Every pixel in all the street view images was classified into one of 19 segments by DeepLab V3+.
It should be noted that there is an error associated with recognition by the model itself (DL), which requires training and optimization of model elements. In this study, the extraction percentage of segmented elements involved an error due to the difficulty of effectively extracting the color edges of the different elements. The average overall extraction percentage was 91.6% and 87.4% in Xi’an and Kyoto, respectively. For the extraction of a single image with large deviations, we developed a method for correcting the errors. First, the percentage of segments (hereafter, PSG) for each point in the selected street view images was converted automatically by a system developed by the authors using Python code. If there is an obvious error in a particular element, the obtained segmentation image is subjected to analysis in Adobe Photoshop, where the percentage of the entire picture (i.e., the area of all color pixels) occupied by the element (i.e., the area of its color pixels) was determined. A comparison with the original street view was then made and the percentage of the incorrect element was adjusted to the correct classification.
Based on the above steps, we completed image segmentation of all the street views with the same angle for the 108 selected points in Xi’an and the 112 selected points in Kyoto. Figure 7 and Figure 8 show examples of the segmentation mapping by adding different colors corresponding to each class, such as yellow for a person or green for a bicycle.
The image was further visualized, and a segmentation overlay in the appropriate colors was added onto the various regions. We used the percentage of the four objective indicators (sidewalk, vegetation, car, and people) for the evaluation, as defined in the previous section.
In order to provide a comparable value for a perceived indicator, we set 2 as the maximum PSG value for each objective indicator. For all the street views, the percentage of the street view element relative to the maximum value of the element was calculated and then converted to a score ranging from 1 to 2.

3.5. Micro-Evaluation Combing the Perceived (1–6) and Objective (7–10) Indicators

The final walkability evaluation score (WES) is based on the above walkability checklist and includes both perceived- and objective-evaluation scores.
For the perceived indicator evaluations, if an auditor feels that a street view image corresponds well to the indicator in question, the image is assigned a score of 2 for that indicator; if the auditor feels that the image does not correspond well to the indicator, the image is assigned a score of 1 for the indicator. To produce the final score, the average value of each perceived indicator is calculated for all auditors and for all street views.
For the objective evaluations, the indicator (element of the street view) with the smallest proportion on the positive side is given a score of 1 for the image; the maximum proportion is given a score of 2. The average value for each indicator in each image is ultimately calculated. The final walkability evaluation scores ranged from 10 to 20.

3.6. Macro-Scale Walkability

For the macro-quantitative evaluation of walkability, we selected the local integration value (hereafter Int-R3) as our macro-indicator, based on an axial analysis from Space Syntax. Axial analysis is a way of analyzing spatial layouts represented by an axial map. In order to analyze the configuration layout of each city, we translated the actual spatial structure into an axial map, which consists of the minimum set of the longest lines drawn tangent to vertices that are visible to one another. For our topological analysis, the axial map was projected onto a justified graph in which the axial lines are represented as nodes, and the intersecting lines are the connections between the nodes [40].
Int-R3 essentially describes the “local accessibility” of an element in the study area network. The higher the value of Int-R3, the better in terms of accessibility. More specifically, the Int-R3 can be defined as the local integration values of the axial lines at radius 3 (root plus two topological steps from the root) that can be used to represent a localized picture of integration, which has been related to walkability in previous studies [41,42].

4. Results

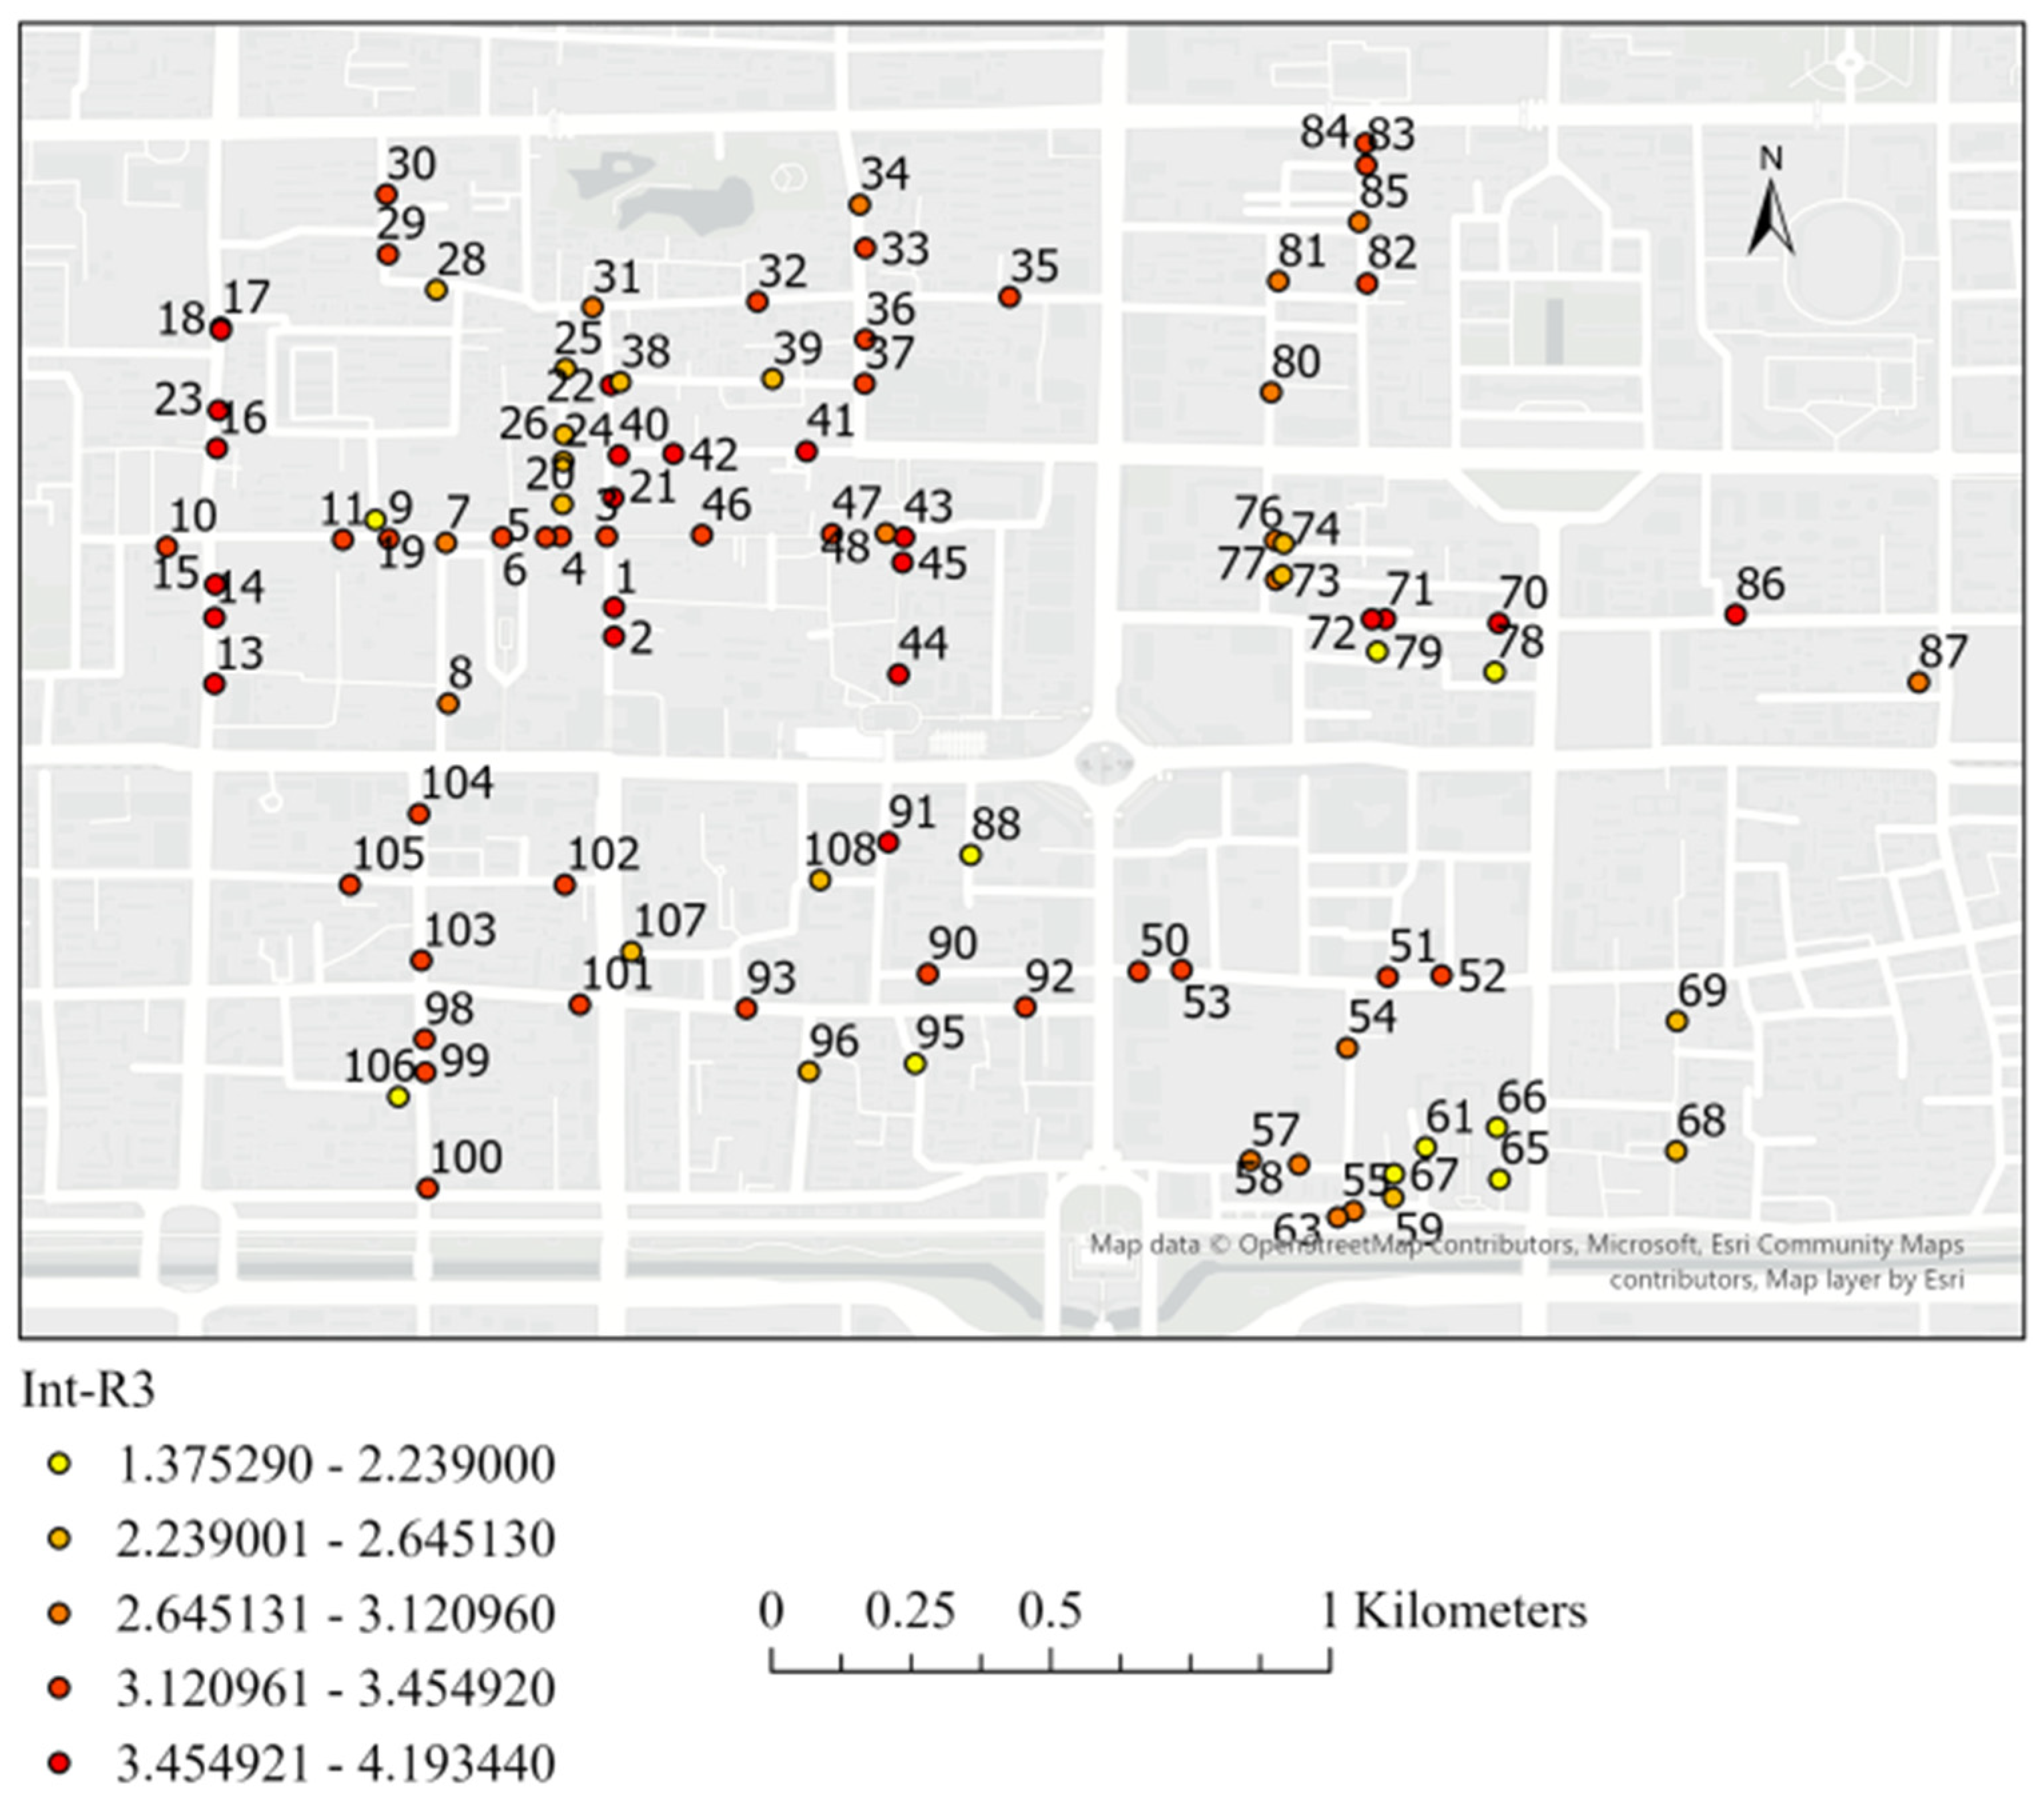
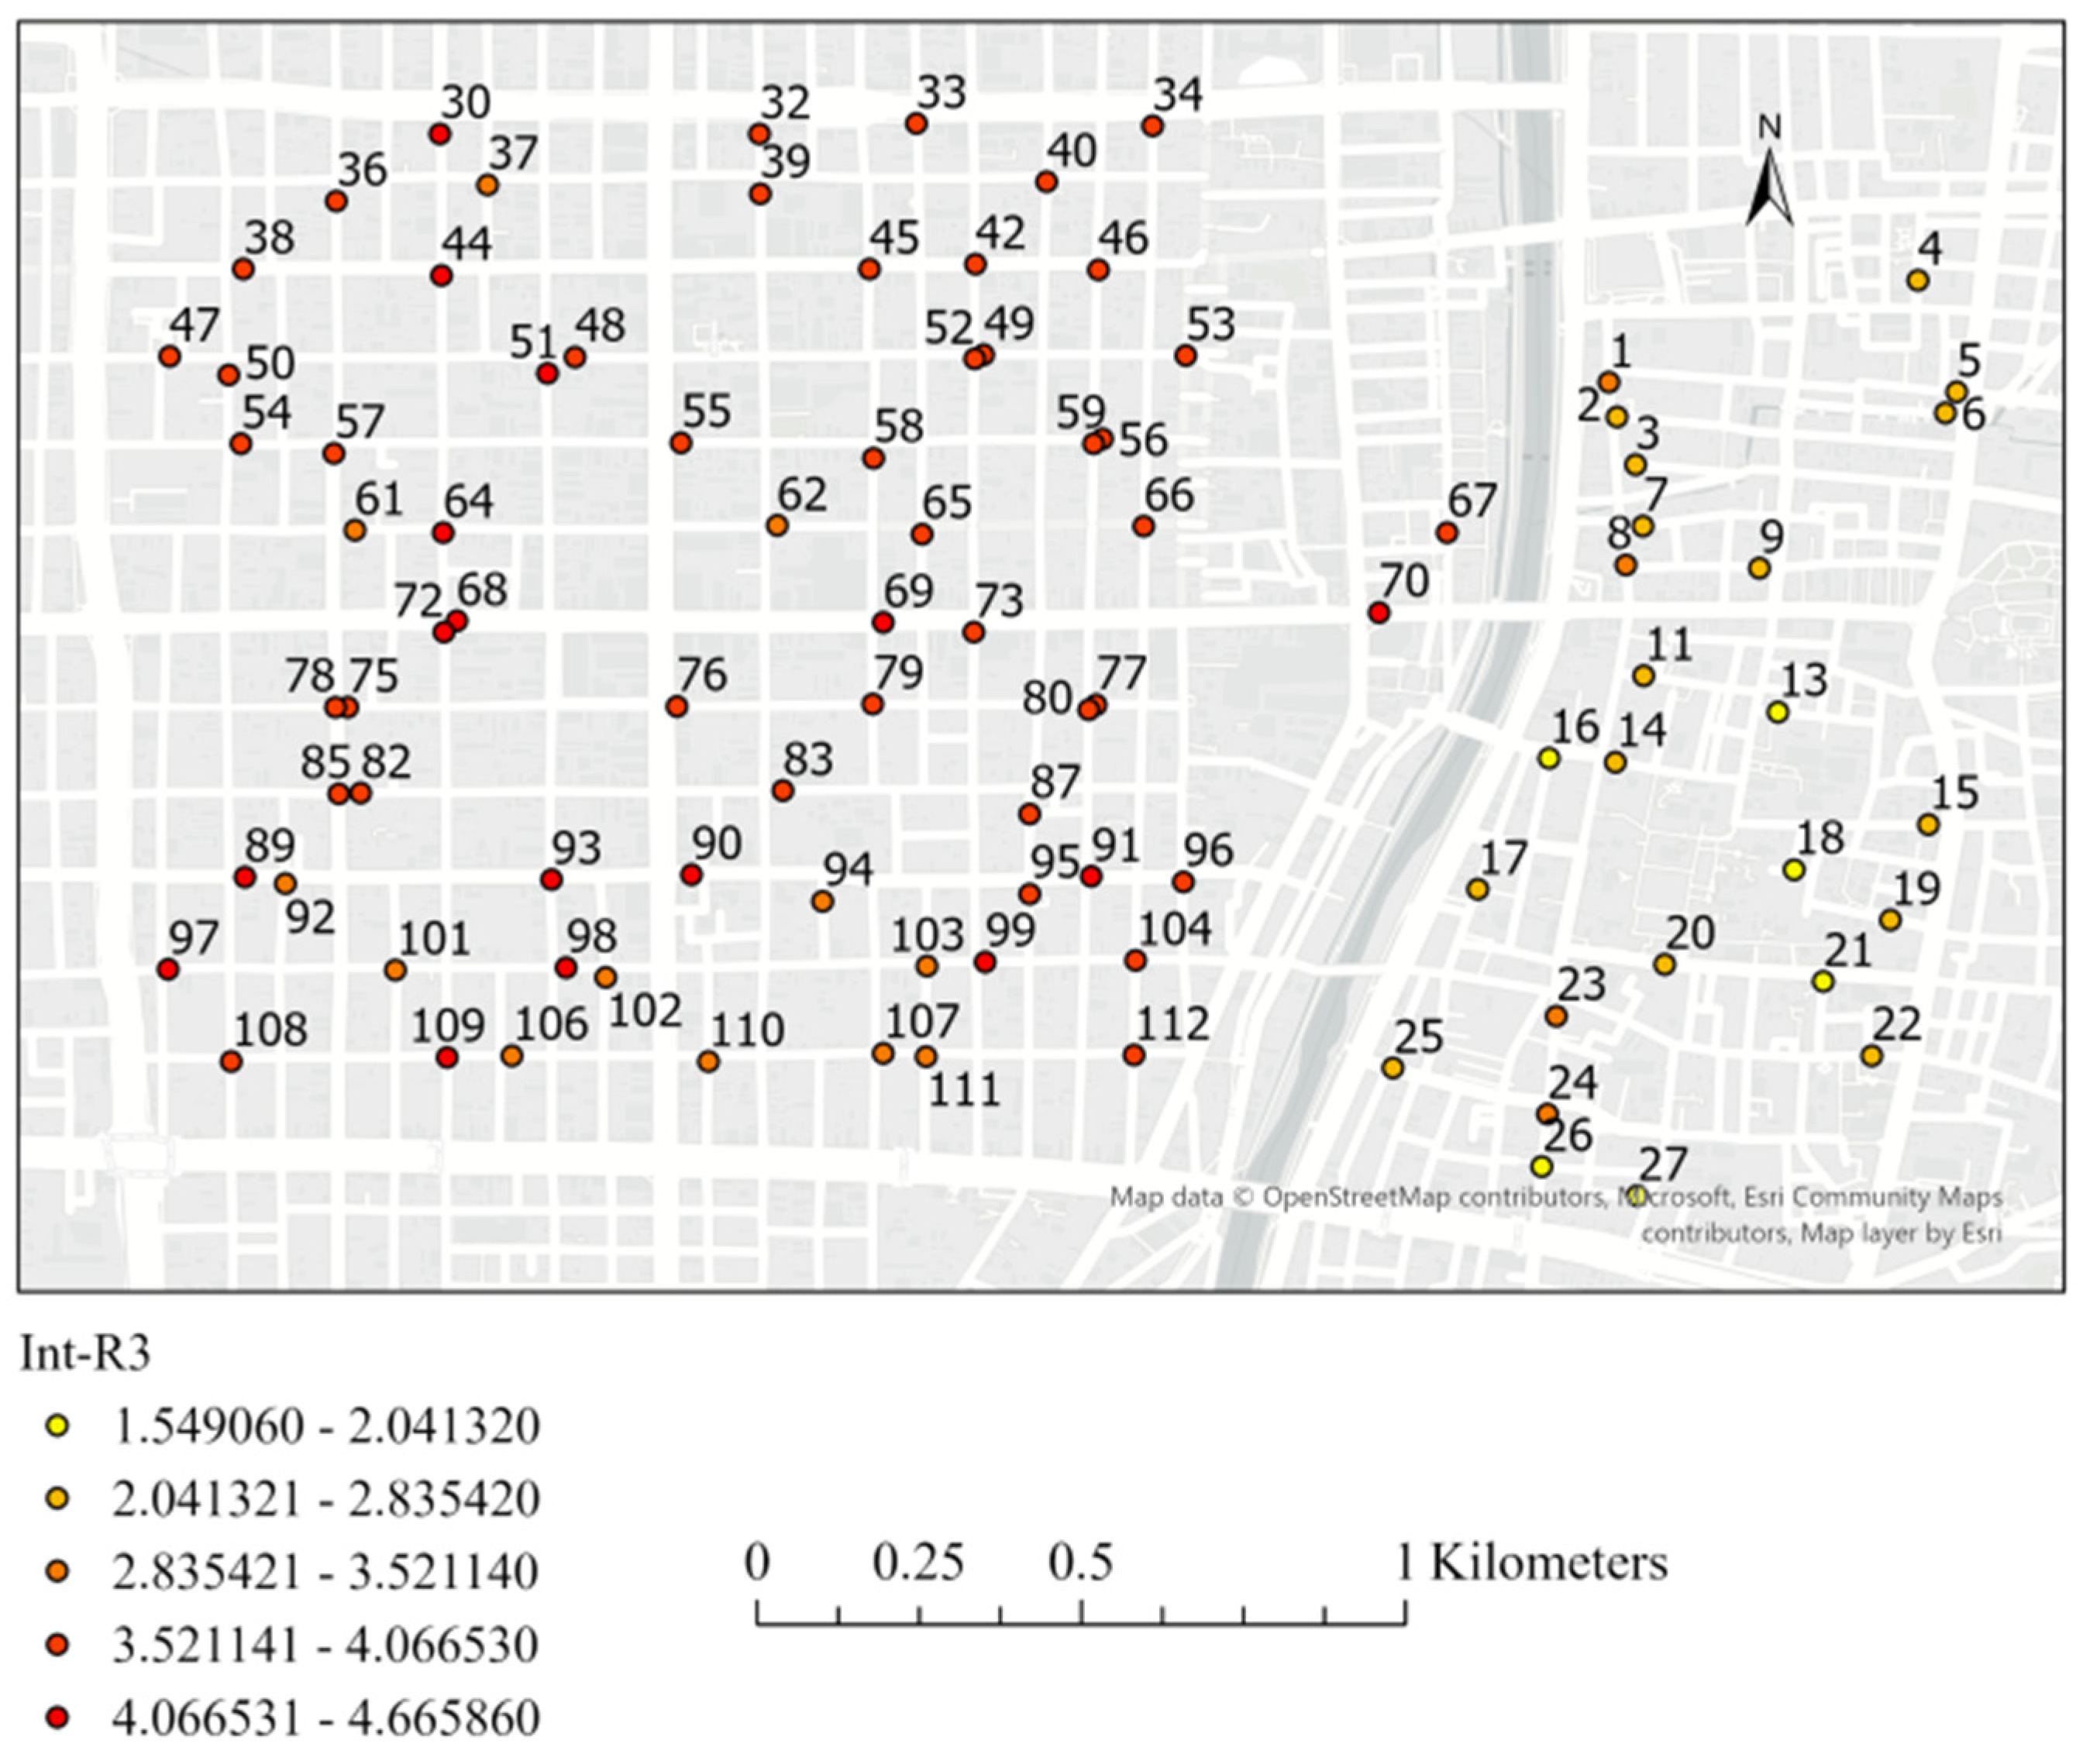
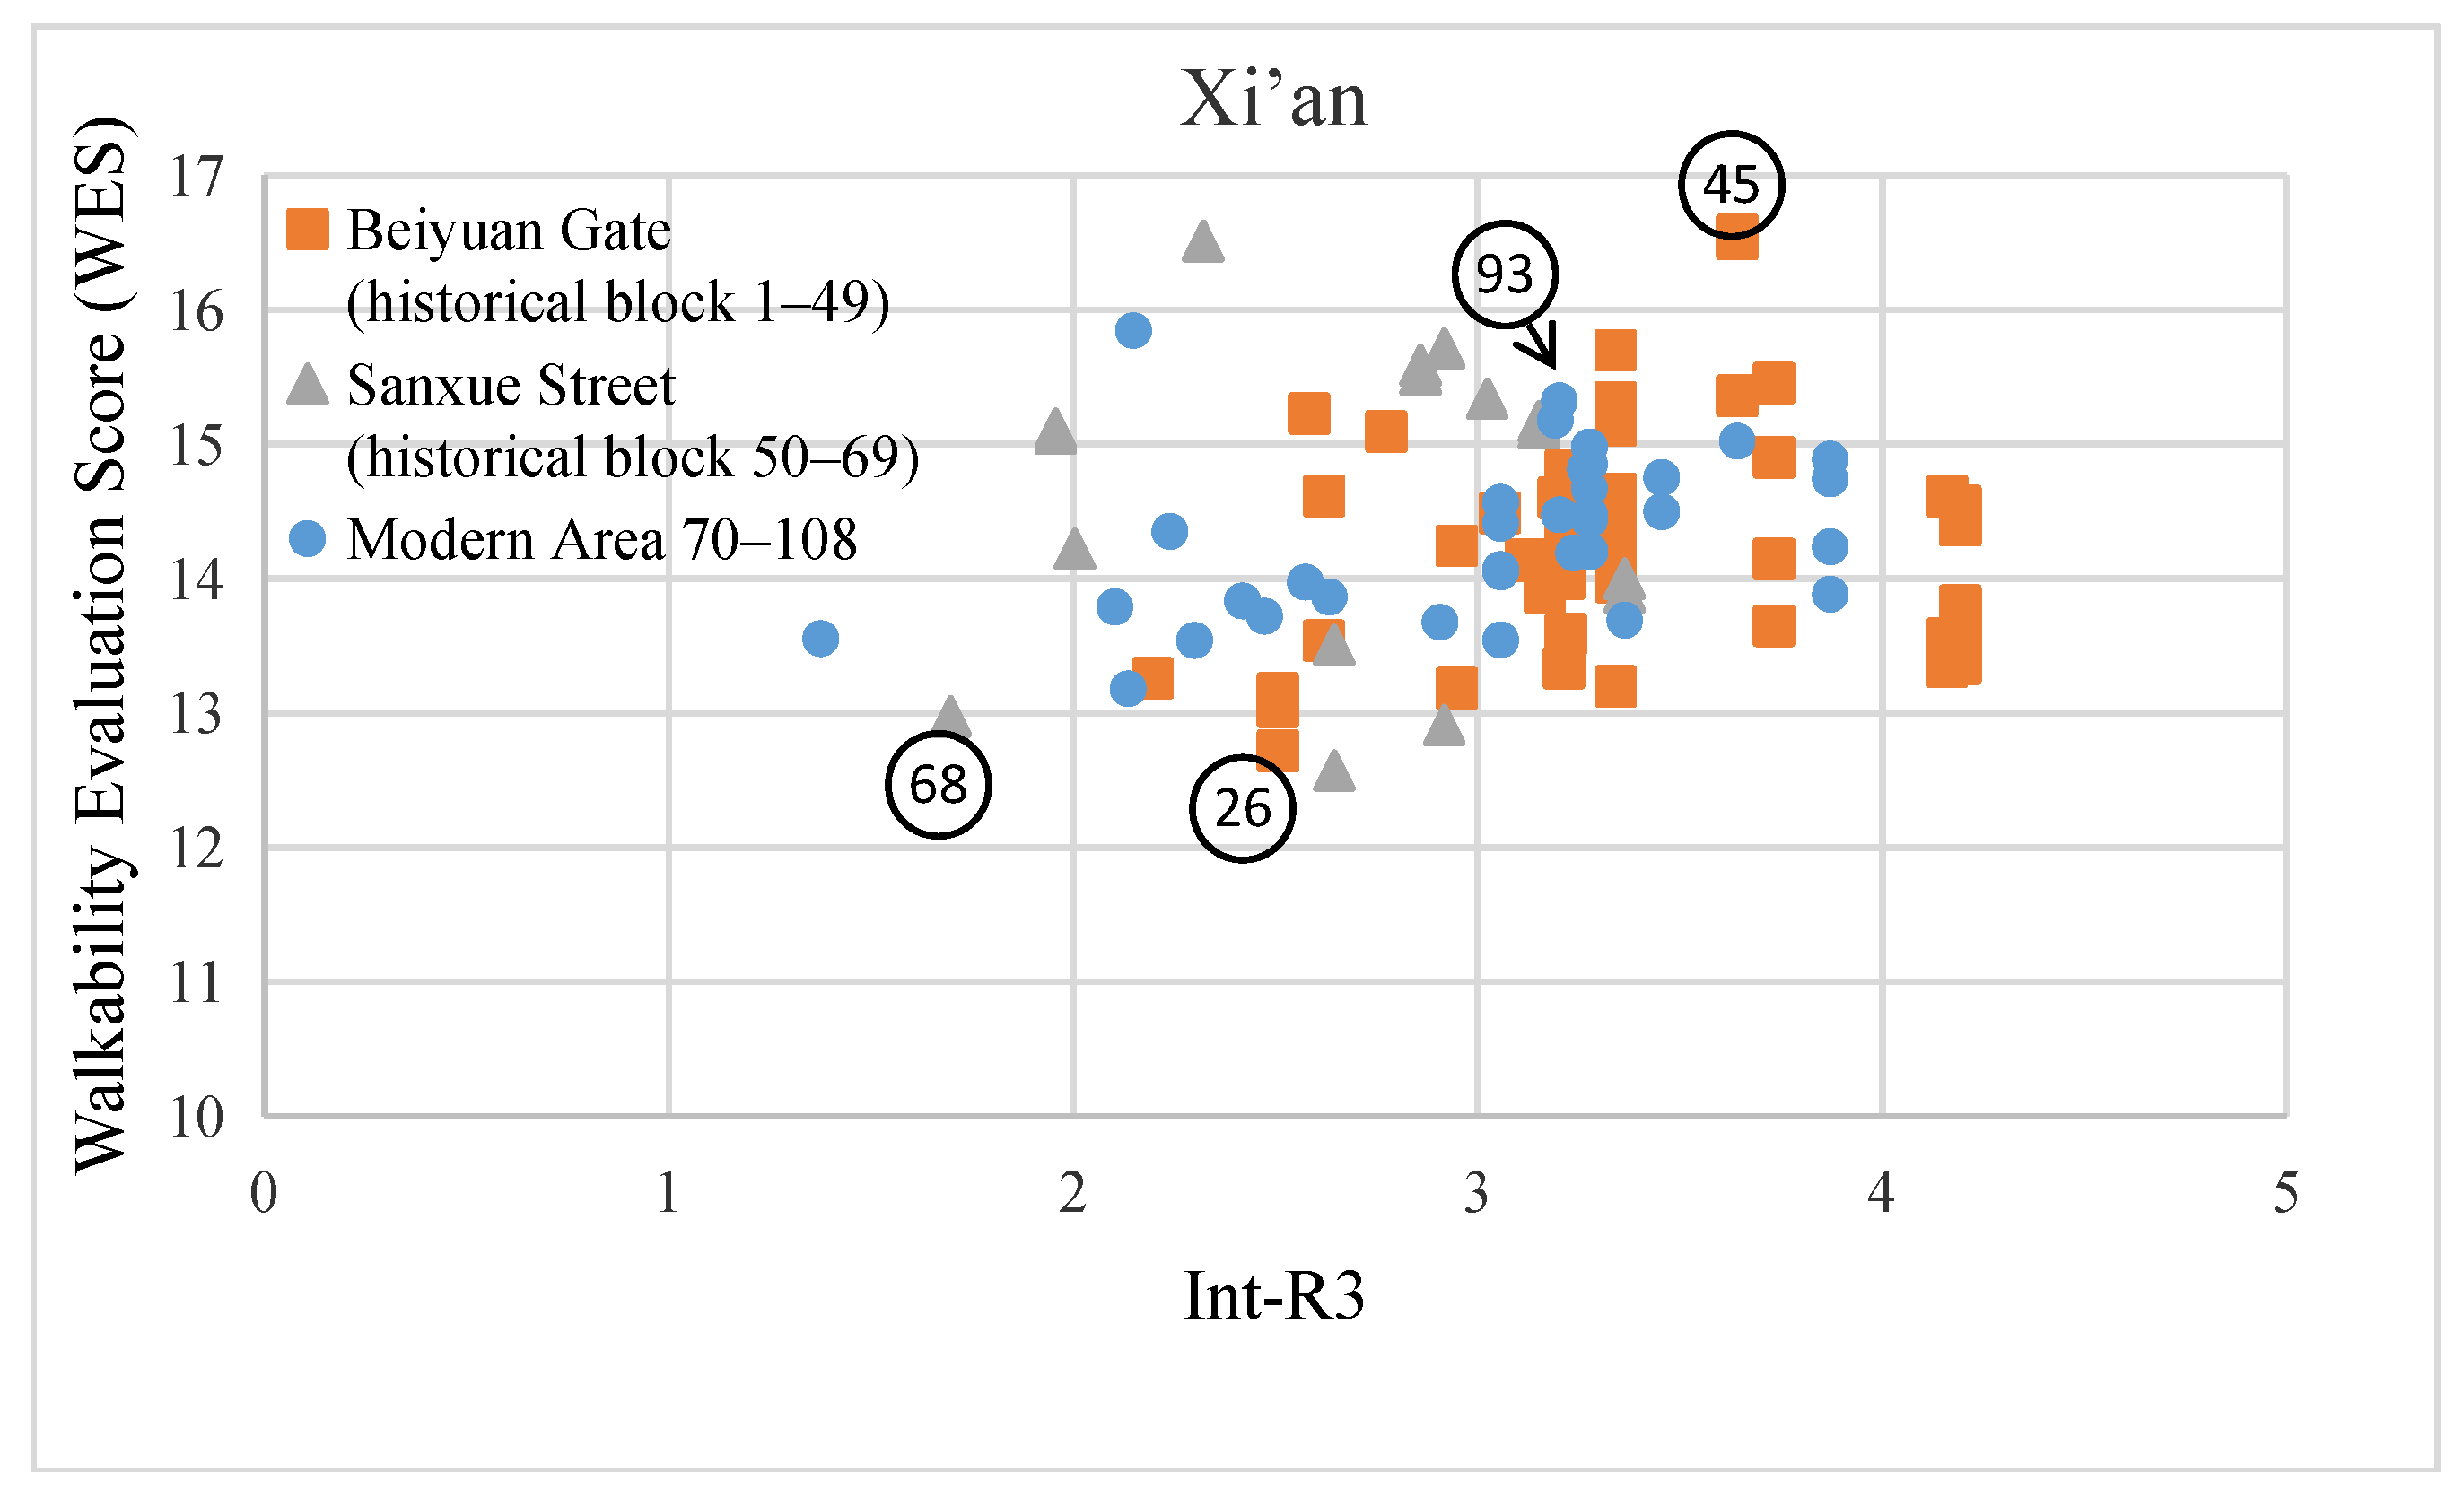
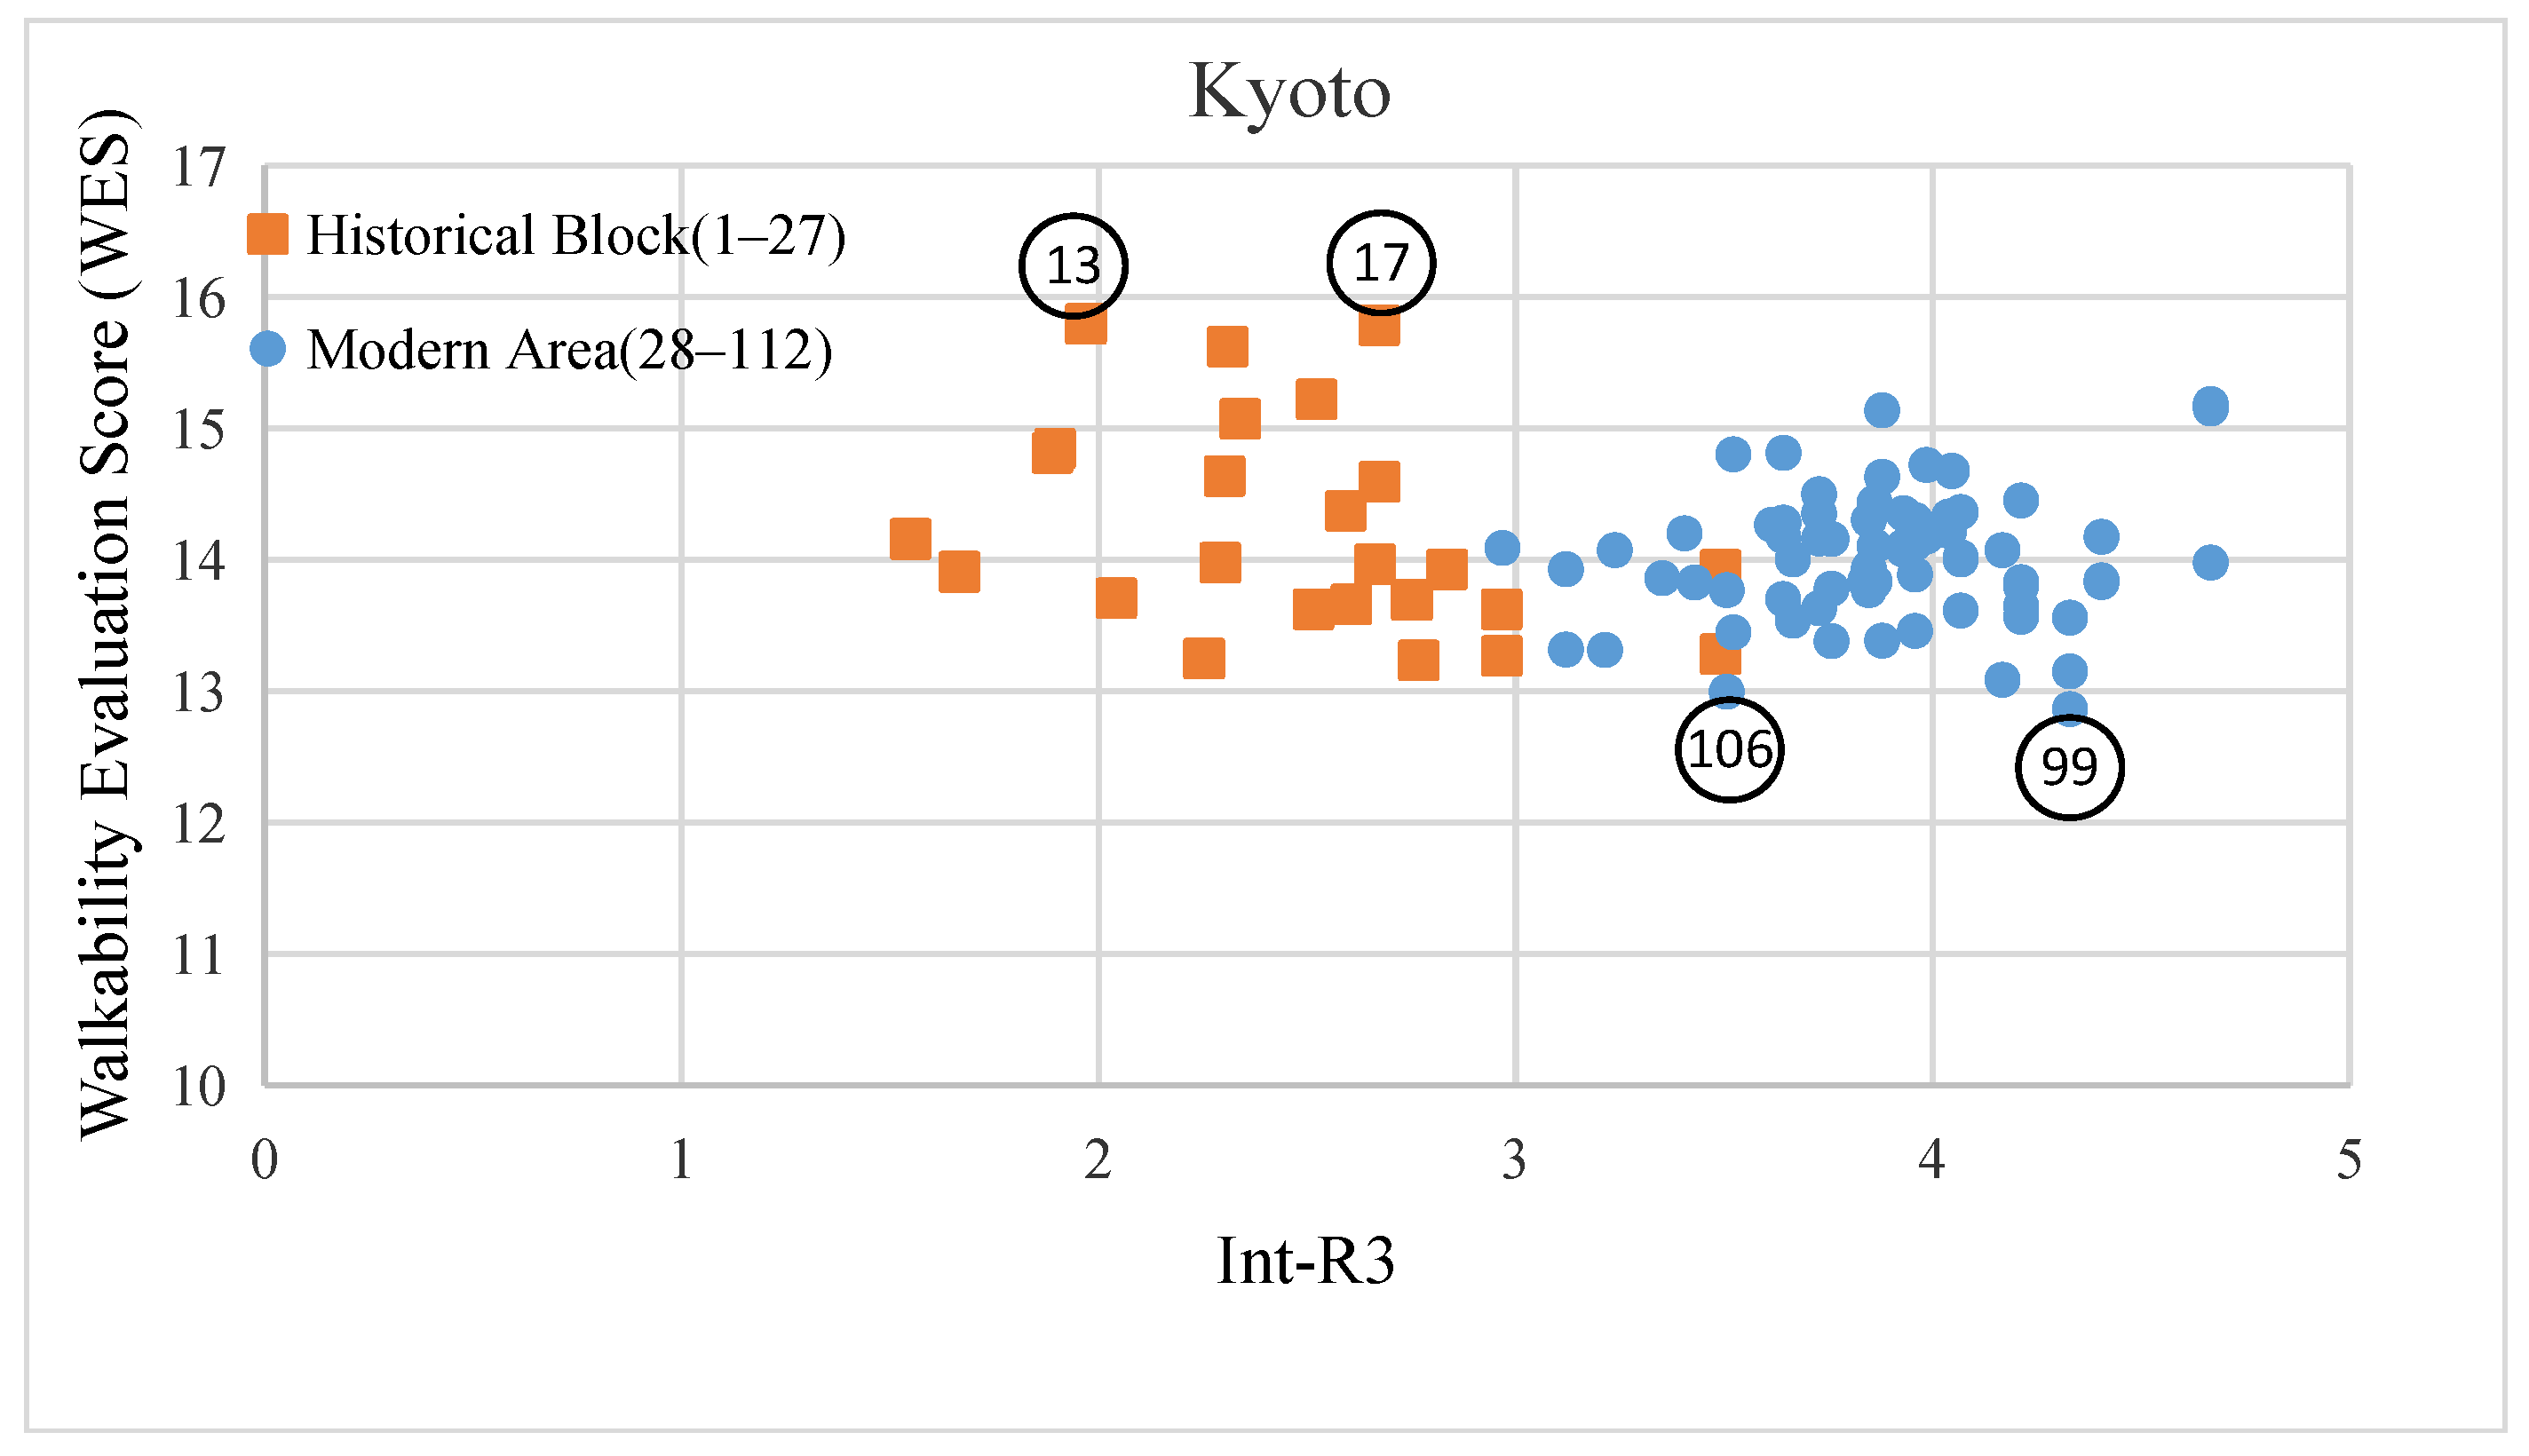
4.1. Macro: Local Integration (Int-R3) by Space Syntax

Figure 9 shows the value of Int-R3 for the street viewpoints based on the axial map of Xi’an. As can be seen here, the points in the Beiyuan Gate historical block in the northwest corner have a relatively high Int-R3 (3.37) average; however, the average Int-R3 (2.66) in the historical block of Sanxue Street in the southeast corner is lower than that in the modern (residential) areas (3.02). Thus, it can be said that the distribution of Int-R3 within the old city shows no unified tendency.
Figure 10 shows the value of Int-R3 for the street viewpoints based on the axial map of Kyoto. As indicated, the average value of Int-R3 (3.85) for the area in the west is rather high. Moreover, the average value for the modern areas in the west is higher than that for the historical blocks in the east (2.48).
Overall, in Xi’an, the average Int-R3 in the modern areas and in its historical blocks is not very different. In contrast, Kyoto’s average Int-R3 in the modern areas is higher than in its historical blocks. The general consistency of Kyoto’s streets is stronger, with a clearer distinction between historical blocks and modern areas, than is the case in Xi’an. Xi’an’s Int-R3 does not suggest a unified tendency inside the old fortification. The mixed results indicate that accessibility within the historical blocks varies depending on the street viewpoints.

4.2. Micro: Walkability Evaluation Score

Table 3 shows the average walkability evaluation score (WES) for each index. As indicated by the values in the right-hand column of the table, the average of the perceived- and objective-evaluation scores is slightly higher for Xi’an (14.270 to 14.121).
As the table shows, the walkability evaluation scores for the two cities have their own distinctive characteristics. Specifically, in the perceived evaluation for Xi’an, only the scores for attractive and lively built environments and for traditional streetscapes are higher for the historical blocks than for the modern areas (Q5: 1.265 to 1.028, and Q6: 1.184 to 1.015). On the other hand, the basic built environment, infrastructure and traffic condition indicators, such as a well-maintained built environment, a well-designed built environment, a clean and tidy built environment, and an obstacle-free built environment all have lower scores in the historical block than in the modern areas (Q1: 1.793 to 1.890, Q2: 1.858 to 1.969, Q3: 1.568 to 1.741 and Q4: 1.090 to 1.097). In the objective evaluations, the historical block is superior to the modern area in having good people-flow and light vehicular traffic. However, basic elements such as sidewalk area and amount of vegetation are lower in the historical block than in the modern areas, and the total WES of the historical block is slightly lower than the total WES in the modern areas (Total Q1–Q10: 14.250 to 14.307).
In the perceived evaluation for Kyoto, the historical blocks show similar characteristics to Xi’an, with high scores for traditional streetscapes and obstacle-free built environment (Q6: 1.293 to 1.066 and Q4: 1.197 to 1.081). In addition to similar results for attractive and lively built environment and cleanness of the built environment (Q5: 1.077 to 1.082 and Q3: 1.849 to 1.841), the scores for the historical blocks are also lower than in the modern areas for well-maintained and well-designed built environments (Q1: 1.806 to 1.913 and Q2: 1.915 to 1.969). In the objective evaluation, the scores for good people-flow and light vehicular traffic in the historical and modern blocks for Kyoto are comparable (Q9: 1.008 to 1.010 and Q10: 1.975 to 1.940). The historical blocks have relatively higher vegetation (Q8: 1.091 to 1.070), but the pedestrian sidewalk area is less than in the modern areas (Q7: 1.079 to 1.096). Overall, the walkability in Kyoto’s historical blocks is higher than in the modern areas (Total Q1–Q10: 14.291 to 14.067).
Generally speaking, the perceived evaluation scores in Kyoto are higher than those in Xi’an, especially with respect to cleanliness and well-designed built environment. On the other hand, Xi’an is clearly superior to Kyoto in terms of having an attractive and lively built environment. As for the objective indicators, the WES values for Xi’an are generally higher than those for Kyoto, with more vegetation and better people-flow as obvious advantages.

4.3. Comparative Analysis of Macro- and Micro-Influencing Factors in Xi’an and Kyoto

The macro-factors mainly come from the integration of Space Syntax, an indicator of street connectivity. As explained in the previous section, Int-R3 essentially shows the “accessibility” of an element in the study area network. In contrast, the micro-factor is derived from the synthesis of the six perceived and four objective street view evaluation indicators, which we have called WES.
On the basis of these two special aspects concerning walkability, we can compare and analyze the difference between the macro- and micro-indicators in the walkability evaluation and identify the differences in results for Xi’an and Kyoto.
The distribution of the macro- and micro-index values for all the selected points used in WES, together with the significant explanatory variables, is discussed below.
Our analysis of the macro- and micro-factors also shows some differences for walkability, which is explained by the differences between Xi’an and Kyoto.
Figure 11 and Figure 12 are distribution diagrams for WES and Int-R3 for all the street viewpoints in Xi’an and Kyoto, respectively. Figure 11 shows clearly that the points in the historical blocks and the modern area in Xi’an present a mixed distribution and that the WES and Int-R3 values for the points have a relatively consistent positive trend. Whereas the points in the historical blocks in Kyoto are concentrated on the left side of the graph with low Int-R3, the points in the modern blocks are distributed on the right side, with high Int-R3 (Figure 12). From the distribution map of Kyoto, although road accessibility in the historical blocks is worse than in the modern areas, the specific street features are more conducive to walking, so that even in historical blocks with low Int-R3, there are points with high WES.
The Int-R3 (macro) and WES (micro) values in Xi’an and Kyoto are not at all correlated (0.058) (Table 4 and Table 5). The results show that Int-R3 (macro) and WES (micro) are independent indicators, strongly suggesting that the introduction of a micro-indicator for walkability assessment (WES) has a significant meaning. Thus, it is evident that considering the micro- and macro-indicators together is necessary.
Table 6 shows the WES scores (Q1 to Q10) for some representative points (No. 45, 93, 26, and 68 in Xi’an, and No. 13, 17, 99, and 106 in Kyoto) for the points plotted in the scatter graphs in Figure 11 and Figure 12. Points No. 45 and 93 in Xi’an are positive example points, with high Int-R3 (macro) and high WES (micro), while No. 26 and 68 are negative example points, with low Int-R3 (macro) and low WES (micro). For Kyoto, No. 13 and 17 are positive example points, with low Int-R3 (macro) but high WES (micro), while No. 99 and 106 are negative example points, with high Int-R3 (macro) but low WES (micro). As described below, we cross-checked our results using street view images of these selected street viewpoints.
Figure 13 shows street view images of Xi’an for the selected points (No. 45, 93) plotted in the upper right corner of the scatter graph in Figure 11. As noted above, the Int-R3 and WES scores are both high for the two points. Both of these positive examples have good accessibility but show different characteristics when their street view images are compared. No. 93 is located in the modern area, whereas No. 45 is located in the historical block. According to the micro-indicator values in Table 6, the sidewalks for both are relatively spacious (WES-Q7: 1.42 and 1.41, respectively, for Xi’an street views No. 45 and No. 93), there is light vehicular traffic (WES-Q10: 2.0 and 1.96), and, for No. 45, there are many special cultural and food shops that attract tourists, and, thus, the score for attractive built environment is high (WES-Q5: 1.8). On the other hand, for No. 93, the score for attractive built environment is very low (WES-Q5: 1.0); however, the score for clean and tidy built environment is very high (WES-Q3: 2.0). In addition, the score for street vegetation for both street views are relatively high, especially for No. 45 (WES-Q8: 1.62) in the historical block, as trees provide ample sunshade and can protect people from the rain, meaning that people can stroll the area in their leisure time, as shown in Figure 13.
In summary, for places where both the macro- and micro-indicators are high, the common features are relatively good accessibility, spacious sidewalks, more vegetation, and a well-maintained built environment. Moreover, it appeared that there are two types of such places: one has many attractive shops and traditional cultural street landscapes; the other is obstacle-free and has a clean and tidy built environment.
Figure 14 shows street view images of Xi’an for the selected points (No. 26/left and No.68/right) plotted in the lower left corner of the scatter graph in Figure 11. The Int-R3 and WES scores are both low (WES-Total: 12.7/No. 26 and 12.6/No. 68). No. 26 and 68 are located in the historic block. As shown in Figure 14, there is too much street parking or other obstacles on the road, resulting in a minimum score for obstacle-free environment (WES-Q4: 1.0/No. 26 and 1.0/No. 68). Moreover, sidewalk space and amount of vegetation along the street scored very low (WES-Q7: 1.13/No. 26 and 1.18/No. 68, WES-Q8: 1.0/No. 26 and 1.02/No. 68). The built environment is also assessed by the auditors as not well-maintained (WES-Q1: 1.5/No. 26 and 1.5/No. 68). These are the main reasons for the poor walkability in both No. 26 and No. 68.
Figure 15 shows street view images in Kyoto for the selected points (No. 13/left and No. 17/right) plotted in the upper left section of the scatter graph in Figure 12. In both cases, Int-R3 is low, but WES is high. Both points are in the historical blocks. Specifically, for the historical street (No. 13 and No. 17) on the left in Figure 12, the macro-indicators are lower than in the modern area, and the micro-indicators are, in total, high (WES-total: 15.80/No. 13 and 15.79/No. 17). The traditional features of these points can be seen in the street views, which explains why the scores for traditional streetscapes were high (WES-Q6: 1.92/No. 13 and 1.69/No. 17). A high standard of cleanness and an obstacle-free built environment are also evident in the street views and are the reasons for the high micro-evaluation scores (WES-Q3:1.92/No. 13 and 2.00/No. 17, WES-Q4: 1.85/No. 13 and 1.69/No. 17).
In summary, for cases in which the macro-indicator score is high but the micro-indicator scores are low, we found that very good accessibility and a well-maintained built environment were common features. On the other hand, lacking spacious sidewalks and having many obstacles, less vegetation, and lacking a lively built environment were problems.
Figure 16 shows street view images at selected points (No. 99/left and No. 106/right) plotted in the lower right of the scatter graph in Figure 12. Both points are in the modern area, with a high Int-R3 and a low WES. The total WES values are very low for both images (WES-total: 12.87/No. 99 and 13.00/No. 106). As can be seen, the sidewalks are relatively narrow (WES-Q7: 1.02/No. 99 and 1.04/No. 106), and the scores for traffic flow (WES-Q10: 1.53/No. 99 and 1.97/No. 106) and obstacles (WES-Q4: 1.0/No. 99 and 1.0/No. 106) are low. The scores for well-maintained built environment (WES-Q1: especially 1.38/No. 106) and amount of vegetation (WES-Q8: 1.0/No. 99 and 1.0/No. 106) are also low.
To summarize, in cases where the micro-indicator scores are high but the macro-indicator scores are low, it was found that traditional cultural street landscapes and a clean and tidy built environment were common features. On the other hand, poor accessibility in a fragmented street network with many obstacles, no spacious sidewalks, and less vegetation were problems.
The main distinction between Kyoto and Xi’an is that the macro-indicator (Int-R3) and micro-indicator (WES) scores differ substantially in the two cities (Figure 11 and Figure 12). Kyoto is more modernized along many of its streets (Yuan 2022), which is evidenced by its Int-R3 result. The streets of Kyoto tend to have a high Int-R3 in the modern areas; the average Int-R3 in Xi’an is not as high, meaning that overall accessibility is lower than in Kyoto. However, in walkability as evaluated by WES, Xi’an scores higher than Kyoto due to specific walking environment micro-indicators. In Xi’an’s historical block, where the Int-R3 is high, cars are prohibited from entering the pedestrian streets, making the environment conducive to walking. In addition, local traditional streetscapes attract tourists, as does the presence of many shops, which also creates a good atmosphere for walking.
In Kyoto, in this era of rapid modernization and a car-centered life, many of the streets have been widened, rendering Kyoto’s walkable areas more fragmented, with clear differences between the historical blocks and the modern areas.
In Xi’an, there has been less fragmentation caused by modernization and, according to our WES results, the city appears to be more walkable than Kyoto. Such factors as the attraction of local characteristics and shops, and the vitality and lively atmosphere of the block lead to a large number of people being on the streets. However, Xi’an also faces severe problems with the quality of its built environment, such as lack of maintenance and conflict between the people- and vehicle-traffic-flow.

5. Discussion

As part of our exploration of pedestrian-friendly city planning, we first reviewed existing research to find suitable indicators for evaluating the walkability of historical Asian cities. Our ultimate aim was to identify specific improvements that would promote walking activities in historical building environments. We then used a checklist based on the selected indicators to evaluate walkability in Xi’an and Kyoto and identified key factors that improve or hinder the walking environment in the historic central districts of the two cities. The following are the key findings of the study:
To produce an appropriate tool for assessing walkability in such historical cities, we found that combining macro-scale indicators that measure accessibility in the street structure with micro-scale indicators for the built environment pertaining to daily human activities and pedestrian movement at the street-level is highly important. These two types of indicators were found to be independent of one another, with no obvious correlation.
Based on an analysis of street attribute values from Space Syntax, the overall consistency of Kyoto’s streets was found to be stronger than in the case for Xi’an, with clear distinctive tendencies separating the historical blocks and modern areas. Xi’an’s Int-R3 values reveal no unified tendency inside of Xi’an’s old fortification, with mixed results overall. In Kyoto, the average value of Int-R3 in the modern areas was found to be higher than in its historical blocks. In contrast, Xi’an’s average Int-R3 in its modern areas was similar to the average Int-R3 in its historical block. Based on these differences in street accessibility, we examined the objective- and perceived-walkability factors from a micro, street-level perspective.
Comparing the walkability evaluation scores (WES) for the two cities, we found that the average overall perceived and objective scores for walkability in Xi’an were slightly higher than in Kyoto. While Kyoto had a higher perceived evaluation in cleanliness, maintenance level, and design of the built environment, Xi’an was clearly superior to Kyoto in terms of attractive and lively built environment. Xi’an scored higher in the objective evaluation, with sidewalk, vegetation, and people-flow as obvious advantages. The only exception was the large number of vehicles on Xi’an’s streets, which hinders traffic flow and adversely affects walking.
Although both historical cities are based on a similar urban structure, many of the streets in Kyoto are more modernized than those in Xi’an. The wider streets of Kyoto tend to produce high Int-R3 in the city’s modern areas due to their recent, car-oriented development. Walkability in Xi’an was found to be better than in Kyoto based on higher scores for specific walking environment factors as assessed by the micro-indicators of perceived walkability.
Xi’an’s development process produced less fragmentation between districts and a more walkable environment, owing to the attraction of its local character and shops and the vitality of its urban block, which have led to the creation of a lively walking environment for a large number of people. However, Xi’an is not without areas for improvement, with factors such as a less well-maintained- and untidy-built environment being judged as major drawbacks. Furthermore, there is an urgent need in Xi’an to establish a system for coping with the conflict between people-flow and vehicle traffic.
In cases where both the macro- and micro-indicator scores are comparatively high, places with good walkability in the two historical cities have several factors in common, including good accessibility, spacious sidewalks and more vegetation, and a well-maintained built environment. It also appears that there are two types of walkable areas: one that has numerous attractive shops and traditional cultural street landscapes, while the other is obstacle-free and has a clean and tidy built environment.
In cases where the macro-indicators are high but the micro-indicators are low, it was found that the common factors include very good accessibility in the modern area and a well-maintained built environment. On the negative side, such places lack spacious sidewalks and have many obstacles, less vegetation, and a less-than-lively built environment. In cases where the macro-indicators are low but the micro-indicators are high, it was found that such places have traditional–cultural street landscapes and a clean and tidy built environment in common. They also share the same problems, including poor accessibility in a fragmented street network and many obstacles, no spacious sidewalks, and less vegetation.
Our results indicate that combining factors at the macro- and micro-spatial levels is the key to improving the walkability of historic cities. The Institute for Transportation and Development Policy [43], Al-Hagla [44], and Rebecchi et al. [45] also attempted to develop different indicators for assessing macro- and micro-aspects of walkability. They used these two types of indicators separately for the purpose of comparing the walkability of a number of cities and neighborhoods [43], or different areas in the same state of development in a particular city [45]. However, they were different from us, as their goal was not to assess walkability in a holistic way by combining the two different spatial levels. Additionally, their quantitative evaluations mainly focused on macro-indicators based on GIS attributes such as land use and usage density, and micro-evaluations based mainly on objective aspects of walking environments such as walking distance and safety (e.g., pedestrian causality numbers), or perceived evaluations of the built environment characteristics by audits. Unlike these previous approaches to evaluating micro-indicators, our research adds extra evaluation indicators of the characteristics of historical blocks and introduces image segmentation using deep learning to quantitatively evaluate specific streetscape elements. We selected the most relevant macro- and micro-indicators in order to conduct a comparative evaluation using street view images, so as to evaluate historical areas more comprehensively and accurately.
Although we have the same number level of professional auditors (10–20) in similar macro- and micro-applied evaluation articles after creating brief evaluation indicators for some specific object [20,45], the auditors are lower than the research articles mainly based on subjective investigation or indicators verification [18,43]; and the number of indicators is also lower than that of articles specially building index evaluation system [18,19,27,28]. These two points can be further improved in the future since our focus was on the construction of comprehensive methods of applied articles for the specific study of historical cities in this paper.
In terms of research results, we have consistent results compared with similar research articles on Japanese and Chinese cities. Nagata’s research [46] on Japan highlighted the impact of built environments on walkability in the micro-environment, in addition to enhancing accessibility to destinations on the macro-scale, which is basically consistent with our results in Kyoto. Zeng’s research [20] on a historical city in China shows that the change of built environment and the increase of shops brought by the renewal plan have improved the walkability. This result is also consistent with Xi’an’s high walkability due to the vitality of the streets. In addition to these, our results can also better reflect the impact of the traditional streetscape of historical blocks on the improvement of walkability.

6. Conclusions

Several recommendations emerge from our study results. For example, Xi’an needs to consider the potential negative impact on walkability in parallel with pursuing increased modernization, as has been done in Kyoto. To improve walking accessibility, Xi’an’s built environment and the infrastructure of its streets need to be improved by reducing obstacles, such as parked motorcycles, to provide more space for pedestrians. The city also needs to maintain its historical street view and the current amount of vegetation. In Kyoto, while still maintaining its good walking environment, the focus should also be on improving the vitality of its streets—a critical part of creating a pedestrian-friendly city. For any historical city, it is important to maintain the infrastructure while preserving the unique characteristics of its historical street view and promoting the vitality of its streets.
To the specific stakeholders, especially for Xi’an, which is in the process of its rapid development, the reconstruction of historical blocks will face more conflicting problems of development and protection. For the municipal planning department, while transforming the dilapidated historical blocks and optimizing the business model, it is more important to dredge the internal broken streets according to the historical context and space, maintain the outdated infrastructure of the historical blocks, and improve people’s living- and walking-environment. Additionally, for Kyoto, since it is in the era of rapid modern development of car-centered life, such urban charm has been damaged as many developments have occurred along wider streets, and Kyoto’s walkable areas are now fragmented. The Kyoto government should take measures to improve the charm and vitality of the streets while encouraging the walking mode suitable for people in Kyoto.
As two cities at different stages of development, Xi’an and Kyoto can provide some valuable suggestions for the walkability of other similar historical cities, which can be used as a breakthrough point for in-depth study of the rule of walkability development and change in combination with more other historical cities in the future. Finally, generally speaking, to increase general walkability for other historical cities, we believe that negative elements for walkability firstly should be removed. This can be achieved by reducing obstacles or parked motors and providing better safety measures for streets. In contrast, the commercial- and historical-features elements increasing the vitality of streets should be more taken into account under the current circumstances.
The scope of this study is specifically limited to the historical Asian cities of Xi’an and Kyoto. Moreover, the study relies on images of selected street views taken at particular times and on particular days in 2019, prior to the COVID-19 pandemic. Future research is being considered to overcome these limitations. A longitudinal study using the same methodology for post-pandemic periods is contemplated; one that includes more than a single season in order to account for seasonal differences in traffic flow, etc. Additionally, a comparison study that includes several regions in different countries could produce more generalizable results.

Author Contributions

Conceptualization, K.Y. (Kun Yuan); Methodology, K.Y. (Kun Yuan); Formal analysis, K.Y. (Kun Yuan); Data curation, K.Y. (Kun Yuan); Writing—original draft, K.Y. (Kun Yuan); Writing—review & editing, H.A. and N.O.; Visualization, K.Y. (Kensuke Yasufuku) and A.T.; Supervision, H.A. All authors have read and agreed to the published version of the manuscript.

Funding

This research received no external funding.

Informed Consent Statement

Informed consent was obtained from all subjects involved in the study.

Conflicts of Interest

The authors declare no conflict of interest.

References

  1. Frank, L.D.; Sallis, J.; Conway, T.L.; Chapman, J.E.; Saelens, B.E.; Bachman, W. Many pathways from land use to health. J. Am. Plan. Assoc. 2006, 72, 75–87. [Google Scholar] [CrossRef]
  2. Vanden, B.; Sharmeen, F.; Weijs-Perrée, M. On the subjective quality of social interactions: Influence of neighborhood walkability, social cohesion and mobility choices. Transp. Res. Part A Policy Pract. 2017, 106, 309–319. [Google Scholar] [CrossRef]
  3. D’Orso, G.; Migliore, M. A gis-based method for evaluating the walkability of a pedestrian environment and prioritised investments. J. Transp. Geogr. 2020, 82, 102555. [Google Scholar] [CrossRef]
  4. Yencha, C. Valuing walkability: New evidence from computer vision methods. Transp. Res. Part A Policy Pract. 2019, 130, 689–709. [Google Scholar] [CrossRef]
  5. Chen, Y.Y.; Wong, G.H.; Lum, T.Y.; Lou, V.W.; Ho, A.H.; Luo, H.; Tong, T.L. Neighborhood support network, perceived proximity to community facilities and depressive symptoms among low socioeconomic status Chinese elders. Aging Ment. Health 2016, 20, 423–431. [Google Scholar] [CrossRef]
  6. Jacobs, J. The Death and Life of Great American Cities; Random House: New York, NY, USA, 1961. [Google Scholar]
  7. Tinessa, F.; Pagliara, F.; Biggiero, L.; Veneri, G.D. Walkability, accessibility to metro stations and retail location choice: Some evidence from the case study of naples. Res. Transp. Bus. Manag. 2020, 40, 100549. [Google Scholar] [CrossRef]
  8. Masoumzadeh, S.; Pendar, H. Walking as a medium of comprehending contextual assets of historical urban fabrics. Urban Res. Pract. 2021, 14, 50–72. [Google Scholar] [CrossRef]
  9. Jamei, E.; Ahmadi, K.; Chau, H.W.; Seyedmahmoudian, M.; Stojcevski, A. Urban design and walkability: Lessons learnt from iranian traditional cities. Sustainability 2021, 13, 5731. [Google Scholar] [CrossRef]
  10. Cui, Y.; Guo, X.C.; Deng, Y.L. A Method to Evaluate the Walkability of Historic Conservation Area. J. Transp. Eng. Inf. 2015, 1, 51–57. [Google Scholar]
  11. Bass, B.J.; Livingston, M. Automotive retrofits in historic city centres and their potential effects on their walkability: A comparison of San Luis Obispo, CA, USA and Bath, England, UK. J. Urban Des. 2019, 24, 290–304. [Google Scholar] [CrossRef]
  12. Fan, J.; Zheng, B.; Tang, Q.; Zhang, B.; Liu, N. The Changsha Historic Urban Area: A Study on the Changing Accessibility of the Road Network. Appl. Sci. 2022, 12, 2796. [Google Scholar] [CrossRef]
  13. Ren, Y.; Zhao, C.; Fu, J. The Effect of Traffic Facilities Accessibility on Residents’ Travel under Block Scale. Soc. Sci. 2020, 8, 98–110. [Google Scholar] [CrossRef]
  14. Rosa, M.P.; Tavares, I.L.; Loureiro, N.S. Cultural accessible pedestrian ways. The case of Faro historic centre. J. Tour. Herit. Res. 2020, 3, 75–95. [Google Scholar]
  15. The League of Historical Cities. Available online: https://www.lhc-s.org/member_cities (accessed on 1 January 2022).
  16. Ma, Q.Y. The Research on Walkability Analysis Method of the Historic Urban Area. Doctoral Dissertation, Southeast University, Nanjing, China, 2014. [Google Scholar]
  17. Campisi, T.; Basbas, S.; Tesoriere, G.; Trouva, M.; Papas, T.; Mrak, I. How to Create Walking Friendly Cities. A Multi-Criteria Analysis of the Central Open Market Area of Rijeka. Sustainability 2020, 12, 9470. [Google Scholar] [CrossRef]
  18. Cerin, E.; Chan, K.W.; Macfarlane, D.J.; Lee, K.Y.; Lai, P.C. Objective assessment of walking environments in ultra-dense cities:Development and reliability of the environment in asia scan tool-hong kong version (east-hk). Health Place 2011, 17, 937–945. [Google Scholar] [CrossRef] [PubMed]
  19. Hanibuchi, T.; Nakaya, T.; Inoue, S. Virtual audits of streetscapes by crowdworkers. Health Place 2019, 59, 102203. [Google Scholar] [CrossRef] [PubMed]
  20. Zeng, F.; Shen, Z. Study on the Impact of Historic District Built Environment and Its Influence on Residents’ Walking Trips: A Case Study of Zhangzhou Ancient City’s Historic District. Int. J. Environ. Res. Public Health 2020, 17, 4367. [Google Scholar] [CrossRef]
  21. Walk Score Methodology. 2011. Available online: https://www.walkscore.com/methodology.shtml (accessed on 3 January 2022).
  22. Campisi, T.; Canale, A.; Tesoriere, G. The development of walkability in the historic centre of Enna: The case of the Saint Tommaso neighbourhood. Eur. Transp. 2019, 73, e4. [Google Scholar]
  23. Ewing, R.; Handy, S. Measuring the Unmeasurable: Urban Design Qualities Related to Walkability. J. Urban Des. 2009, 14, 65–84. [Google Scholar] [CrossRef]
  24. Kato, H.; Kanki, K. Development of Walkability Indicator for Smart Shrinking: Case Study of Sprawl Areas in Northern Osaka Metropolitan. Int. Rev. Spat. Plan. Sustain. Dev. 2020, 8, 39–58. [Google Scholar] [CrossRef] [Green Version]
  25. Yuan, K.; Abe, H.; Otsuka, N.; Yasufuku, K.; Takahashi, A. Impact of the COVID-19 Pandemic on Walkability in the Main Urban Area of Xi’an. Urban Sci. 2022, 6, 44. [Google Scholar] [CrossRef]
  26. Clifton, K.J.; Livi Smith, A.D.; Rodriguez, D. The development and testing of an audit for the pedestrian environment-sciencedirect. Landsc. Urban Plan. 2007, 80, 95–110. [Google Scholar] [CrossRef]
  27. Sallis, J.F.; Cain, K.L.; Conway, T.L.; Gavand, K.A.; Millstein, R.A.; Geremia, C.M.; Frank, L.D.; Saelens, B.E.; Glanz, K.; King, A.C. Is your neighborhood designed to support physical activity? A brief streetscape audit tool. Prev. Chronic Dis. 2015, 12, E141. [Google Scholar] [CrossRef] [Green Version]
  28. Malecki, K.C.; Engelman, C.D.; Peppard, P.E.; Nieto, F.J.; Grabow, M.L.; Bernardinello, M.; Bailey, E.; Bersch, A.J.; Walsh, M.C.; Lo, J.Y.; et al. The wisconsin assessment of the social and built environment (wasabe): A multi-dimensional objective audit instrument for examining neighborhood effects on health. BMC Public Health 2014, 14, 1165. [Google Scholar] [CrossRef] [Green Version]
  29. De Vos, J.; Lättman, K.; van der Vlugt, A.-L.; Welsch, J.; Otsuka, N. Determinants and effects of perceived walkability: A literature review, conceptual model and research agenda. Transp. Rev. 2022, 43, 303–324. [Google Scholar] [CrossRef]
  30. Van Dyck, D.; De Meester, F.; Cardon, G.; Deforche, B.; De Bourdeaudhuij, I. Physical environmental attributes and active transportation in Belgium: What about adults and adolescents living in the same neighborhoods? Am. J. Health Promot. 2013, 27, 330–338. [Google Scholar] [CrossRef]
  31. Otsuka, N.; Wittowsky, D.; Damerau, M.; Gerten, C. Walkability assessment for urban areas around railway stations along the Rhine-Alpine Corridor. J. Transp. Geogr. 2021, 93, 103081. [Google Scholar] [CrossRef]
  32. Van der Vlugt, A.-L.; Curl, A.; Scheiner, J. The influence of travel attitudes on perceived walking accessibility and walking behaviour. Travel Behav. Soc. 2022, 27, 47–56. [Google Scholar] [CrossRef]
  33. Oreskovic, N.M.; Charles, P.R.; Shepherd, D.T.; Nelson, K.P.; Bar, M. Attributes of Form in the Built Environment that Influence Perceived Walkability. Archit. Plan. Res. 2014, 31, 218–232. [Google Scholar]
  34. Li, X.; Jia, T.; Lusk, A.; Larkham, P. Rethinking place-making: Aligning placeness factors with perceived urban design qualities (PUDQs) to improve the built environment in historical districts. Urban Des. Int. 2020, 25, 338–356. [Google Scholar] [CrossRef]
  35. Yin, J.; Cao, X.J.; Huang, X. Association between subway and life satisfaction: Evidence from Xi’an, China. Transp. Res. Part D 2021, 96, 102869. [Google Scholar] [CrossRef]
  36. Pikora, T.J.; Giles-Corti, B.; Knuiman, M.W.; Bull, F.C.; Jamrozik, K.; Donovan, R.J. Neighborhood environmental factors correlated with walking near home: Using SPACES. Med. Sci. Sports Exerc. 2006, 38, 708–714. [Google Scholar] [CrossRef]
  37. Proshansky, H.M. The city and self-identity. Environ. Behav. 1978, 10, 147–169. [Google Scholar] [CrossRef]
  38. Cordts, M.; Omran, M.; Ramos, S.; Rehfeld, T.; Schiele, B. The Cityscapes Dataset for Semantic Urban Scene Understanding. In Proceedings of the 2016 IEEE Conference on Computer Vision and Pattern Recognition (CVPR), Las Vegas, NV, USA, 27–30 June 2016; IEEE: Las Vegas, NV, USA, 2016. [Google Scholar]
  39. Chen, L.C.; Zhu, Y.; Papandreou, G.; Schroff, F.; Adam, H. Encoder-Decoder with Atrous Separable Convolution for Semantic Image Segmentation; Springer: Cham, Switzerland, 2018. [Google Scholar]
  40. Hillier, B.; Hanson, J. The Social Logic of Space; Cambridge University Press: Cambridge, UK, 1984. [Google Scholar]
  41. Hillier, B.; Penn, A. Natural movement: Or, configuration and attraction in urban pedestrian movement. Environ. Plan. B Plan. Des. 1993, 20, 29–66. [Google Scholar] [CrossRef] [Green Version]
  42. Kigawa, T.; Furuyama, M. Study on a Vector in Kyoto’s Modernization by means of Space Syntax. J. City Plan. Inst. Jpn. 2005, 40, 139–144. [Google Scholar] [CrossRef]
  43. ITDP (Institute for Transportation and Development Policy). Pedestrians First, Tool for Walkability, 1st ed.; ITDP: New York, NY, USA, 2018. [Google Scholar]
  44. Al-Hagla, K.S. Evaluating new urbanism’s walkability performance: A comprehensive approach to assessment in Saifi Village, Beirut, Lebanon. Urban Des. Int. 2009, 14, 139–151. [Google Scholar] [CrossRef]
  45. Rebecchi, A.; Buffoli, M.; Dettori, M.; Appolloni, L.; Azara, A.; Castiglia, P.; Capolongo, S. Walkable environments and healthy urban moves: Urban context features assessment framework experienced in Milan. Sustainability 2019, 11, 2778. [Google Scholar] [CrossRef] [Green Version]
  46. Nagata, S.; Nakaya, T.; Hanibuchi, T.; Amagasa, S.; Kikuchi, H.; Inoue, S. Objective scoring of streetscape walkability related to leisure walking: Statistical modeling approach with semantic segmentation of Google Street View images. Health Place 2020, 66, 102428. [Google Scholar] [CrossRef]
Figure 1. Data Flow.
Sustainability 15 05525 g001
Figure 2. Research area in Xi’an (ArcGIS map).
Sustainability 15 05525 g002
Figure 3. Research area in Kyoto (ArcGIS map).
Sustainability 15 05525 g003
Figure 4. Selecting street viewpoints in Xi’an (108 points including 69 historical block points) (ArcGIS map).
Sustainability 15 05525 g004
Figure 5. Selecting street viewpoints in Kyoto (112 points including 27 historical block points) (ArcGIS map).
Sustainability 15 05525 g005
Figure 6. Example of the questionnaire using Google Forms.
Sustainability 15 05525 g006
Figure 7. Sample of Segmentation map in Kyoto (No. 40).
Sustainability 15 05525 g007
Figure 8. Sample of Segmentation map in Xi’an (No. 11).
Sustainability 15 05525 g008
Figure 9. Local Integration (Int-R3) of street viewpoints based on axial map in Xi’an.
Sustainability 15 05525 g009
Figure 10. Local Integration (Int-R3) of street viewpoints based on two axial maps in Kyoto.
Sustainability 15 05525 g010
Figure 11. Comparison of macro- and micro-indicators in Xi’an. (Numbers in circle show street viewpoints).
Sustainability 15 05525 g011
Figure 12. Comparison of macro- and micro-indicators in Kyoto. (Numbers in circle show street viewpoints).
Sustainability 15 05525 g012
Figure 13. Xi’an’s street view images (No. 45/(left), 93/(right)) plotted in Figure 11.
Sustainability 15 05525 g013
Figure 14. Xi’an’s street view images (No. 26/(left), 68/(right)) plotted in Figure 11.
Sustainability 15 05525 g014
Figure 15. Kyoto’s street view images (No. 13/(left), No. 17/(right)) plotted in Figure 12.
Sustainability 15 05525 g015
Figure 16. Kyoto’s street view images (No. 99/(left), No.106/(right)) plotted in Figure 12.
Sustainability 15 05525 g016
Table 1. Review of specific perceived- and objective-evaluation indicators of street scenes.
123456789101112
Perceived evaluation indicatorsHanibuchi et al., 2019 [19]Clifton et al., 2007 [26]Cerin et al., 2011 [18]Oreskovic et al., 2014 [33]Li et al., 2020 [34]Van Dyck et al., 2013 [30]Sallis et al., 2015 [27]Malecki et al., 2014 [28]Yin et al., 2021 [35]Van der Vlugt et al., 2022 [32]Noriko Otsuka et al., 2021 [31]De Vos et al., 2022 [29]
1Well-maintained built environment (no presence of decrepit infrastructure abandoned buildings)
2Well-designed build environment (beautiful/ aesthetic)
3Clean and tidy built environment
4Obstacle-free built environment
5Attractive and lively built environment (presence of commercial and attractive shops)
6Traditional streetscapes/preservation of historic buildings
Objective evaluation indicators
7Sidewalk
8Vegetation
9People
10Vehicular traffic
Table 2. List of Auditors.
CityDate of AssessmentNameAgeGenderNationality
Xi’an14-December-2022A20sMaleChina
15-December-2022B20sFemaleChina
15-December-2022C60sMaleJapan
16-December-2022D20sMaleJapan
20-December-2022E20sMaleJapan
20-December-2022F20sMaleJapan
20-December-2022G40sFemaleJapan
21-December-2022H30sMaleJapan
21-December-2022I20sMaleJapan
21-December-2022J20sMaleJapan
Kyoto14-December-2022A20sMaleChina
15-December-2022K20sFemaleFrench
15-December-2022B20sFemaleChina
16-December-2022D20sMaleJapan
16-December-2022C60sMaleJapan
19-December-2022L20sMaleJapan
20-December-2022E20sMaleJapan
20-December-2022G40sFemaleJapan
20-December-2022F20sMaleJapan
20-December-2022M20sMaleJapan
21-December-2022H30sMaleJapan
21-December-2022I20sMaleJapan
21-December-2022J20sMaleJapan
Table 3. Average value of walkability evaluation scores (WES) for Xi’an and Kyoto.
Q1–Q10Perceived evaluation index (build environment and traditional streetscapes), Q1–Q6Objective evaluation index, Q7–Q10Total score
City/
Block
Q1: Well-maintained built environmentQ2: Well-designed built environmentQ3: Clean and tidy built environmentQ4: Obstacle-free built environmentQ5: Attractive and lively built environmentQ6: Traditional streetscapesQ7: SidewalkQ8: VegetationQ9: People (Good flow/passage)Q10: Vehicular traffic (Light traffic flow)
Xi’an (2019)1.828 1.898 1.631 1.093 1.180 1.123 1.214 1.367 1.106 1.833 14.270
Historical block (2019)1.793 1.858 1.568 1.090 1.265 1.184 1.149 1.260 1.146 1.936 14.250
Modern area (2019)1.890 1.969 1.741 1.097 1.028 1.015 1.328 1.555 1.033 1.650 14.307
Kyoto(2019)1.887 1.956 1.843 1.109 1.081 1.121 1.092 1.075 1.009 1.948 14.121
Historical block (2019)1.806 1.915 1.849 1.197 1.077 1.293 1.079 1.091 1.008 1.975 14.291
Modern area (2019)1.913 1.969 1.841 1.081 1.082 1.066 1.096 1.070 1.010 1.940 14.067
Table 4. Correlation between Int-R3 and WES in Xi’an.
Correlations
Int-R3WES
Int_R3Pearson Correlation10.195
Sig. (2-tailed) 0.058
N9795
WESPearson Correlation0.1951
Sig. (2-tailed)0.058
N95107
Correlation is significant at the 0.05 level (2-tailed).
Table 5. Correlation between Int-R3 and WES in Kyoto.
Correlations
Int-R3WES
Int_R3Pearson Correlation1−0.168
Sig. (2-tailed) 0.107
N9493
WESPearson Correlation−0.1681
Sig. (2-tailed)0.107
N93111
Table 6. WES for specific street viewpoints.
CityStreet view point numberPerceived evaluation index (built environment and traditional streetscapes), Q1–Q6Objective evaluation index, Q7–Q10Total score
Q1: Well-maintained built environmentQ2: Well-designed built environmentQ3: Clean and tidy built environmentQ4: Obstacle-free built environmentQ5: Attractive and lively built environmentQ6: Traditional streetscapesQ7: SidewalkQ8: VegetationQ9: People (Good flow/passage)Q10: Vehicular traffic(Light traffic flow)
Xi’an451.90 2.00 1.80 1.20 1.80 1.40 1.42 1.62 1.38 2.00 16.53
931.90 2.00 2.00 1.30 1.00 1.00 1.41 1.54 1.08 1.96 15.18
261.50 1.80 1.40 1.00 1.10 1.00 1.13 1.06 1.00 1.72 12.72
681.50 1.70 1.30 1.00 1.00 1.10 1.18 1.00 1.03 1.77 12.57
Kyoto132.00 1.85 1.92 1.85 1.23 1.92 1.00 1.02 1.00 2.00 15.80
171.85 2.00 2.00 1.69 1.15 1.69 1.00 1.40 1.00 2.00 15.79
991.92 2.00 1.38 1.00 1.00 1.00 1.02 1.00 1.00 1.53 12.87
1061.38 1.85 1.69 1.00 1.00 1.00 1.04 1.00 1.06 1.97 13.00
Disclaimer/Publisher’s Note: The statements, opinions and data contained in all publications are solely those of the individual author(s) and contributor(s) and not of MDPI and/or the editor(s). MDPI and/or the editor(s) disclaim responsibility for any injury to people or property resulting from any ideas, methods, instructions or products referred to in the content.

