
Preliminary Approach for the Development of Sustainable University Campuses: A Case Study Based on the Mitigation of Greenhouse Gas Emissions


Abstract
:1. Introduction
2. A Brief Literature Review
3. Materials and Methods
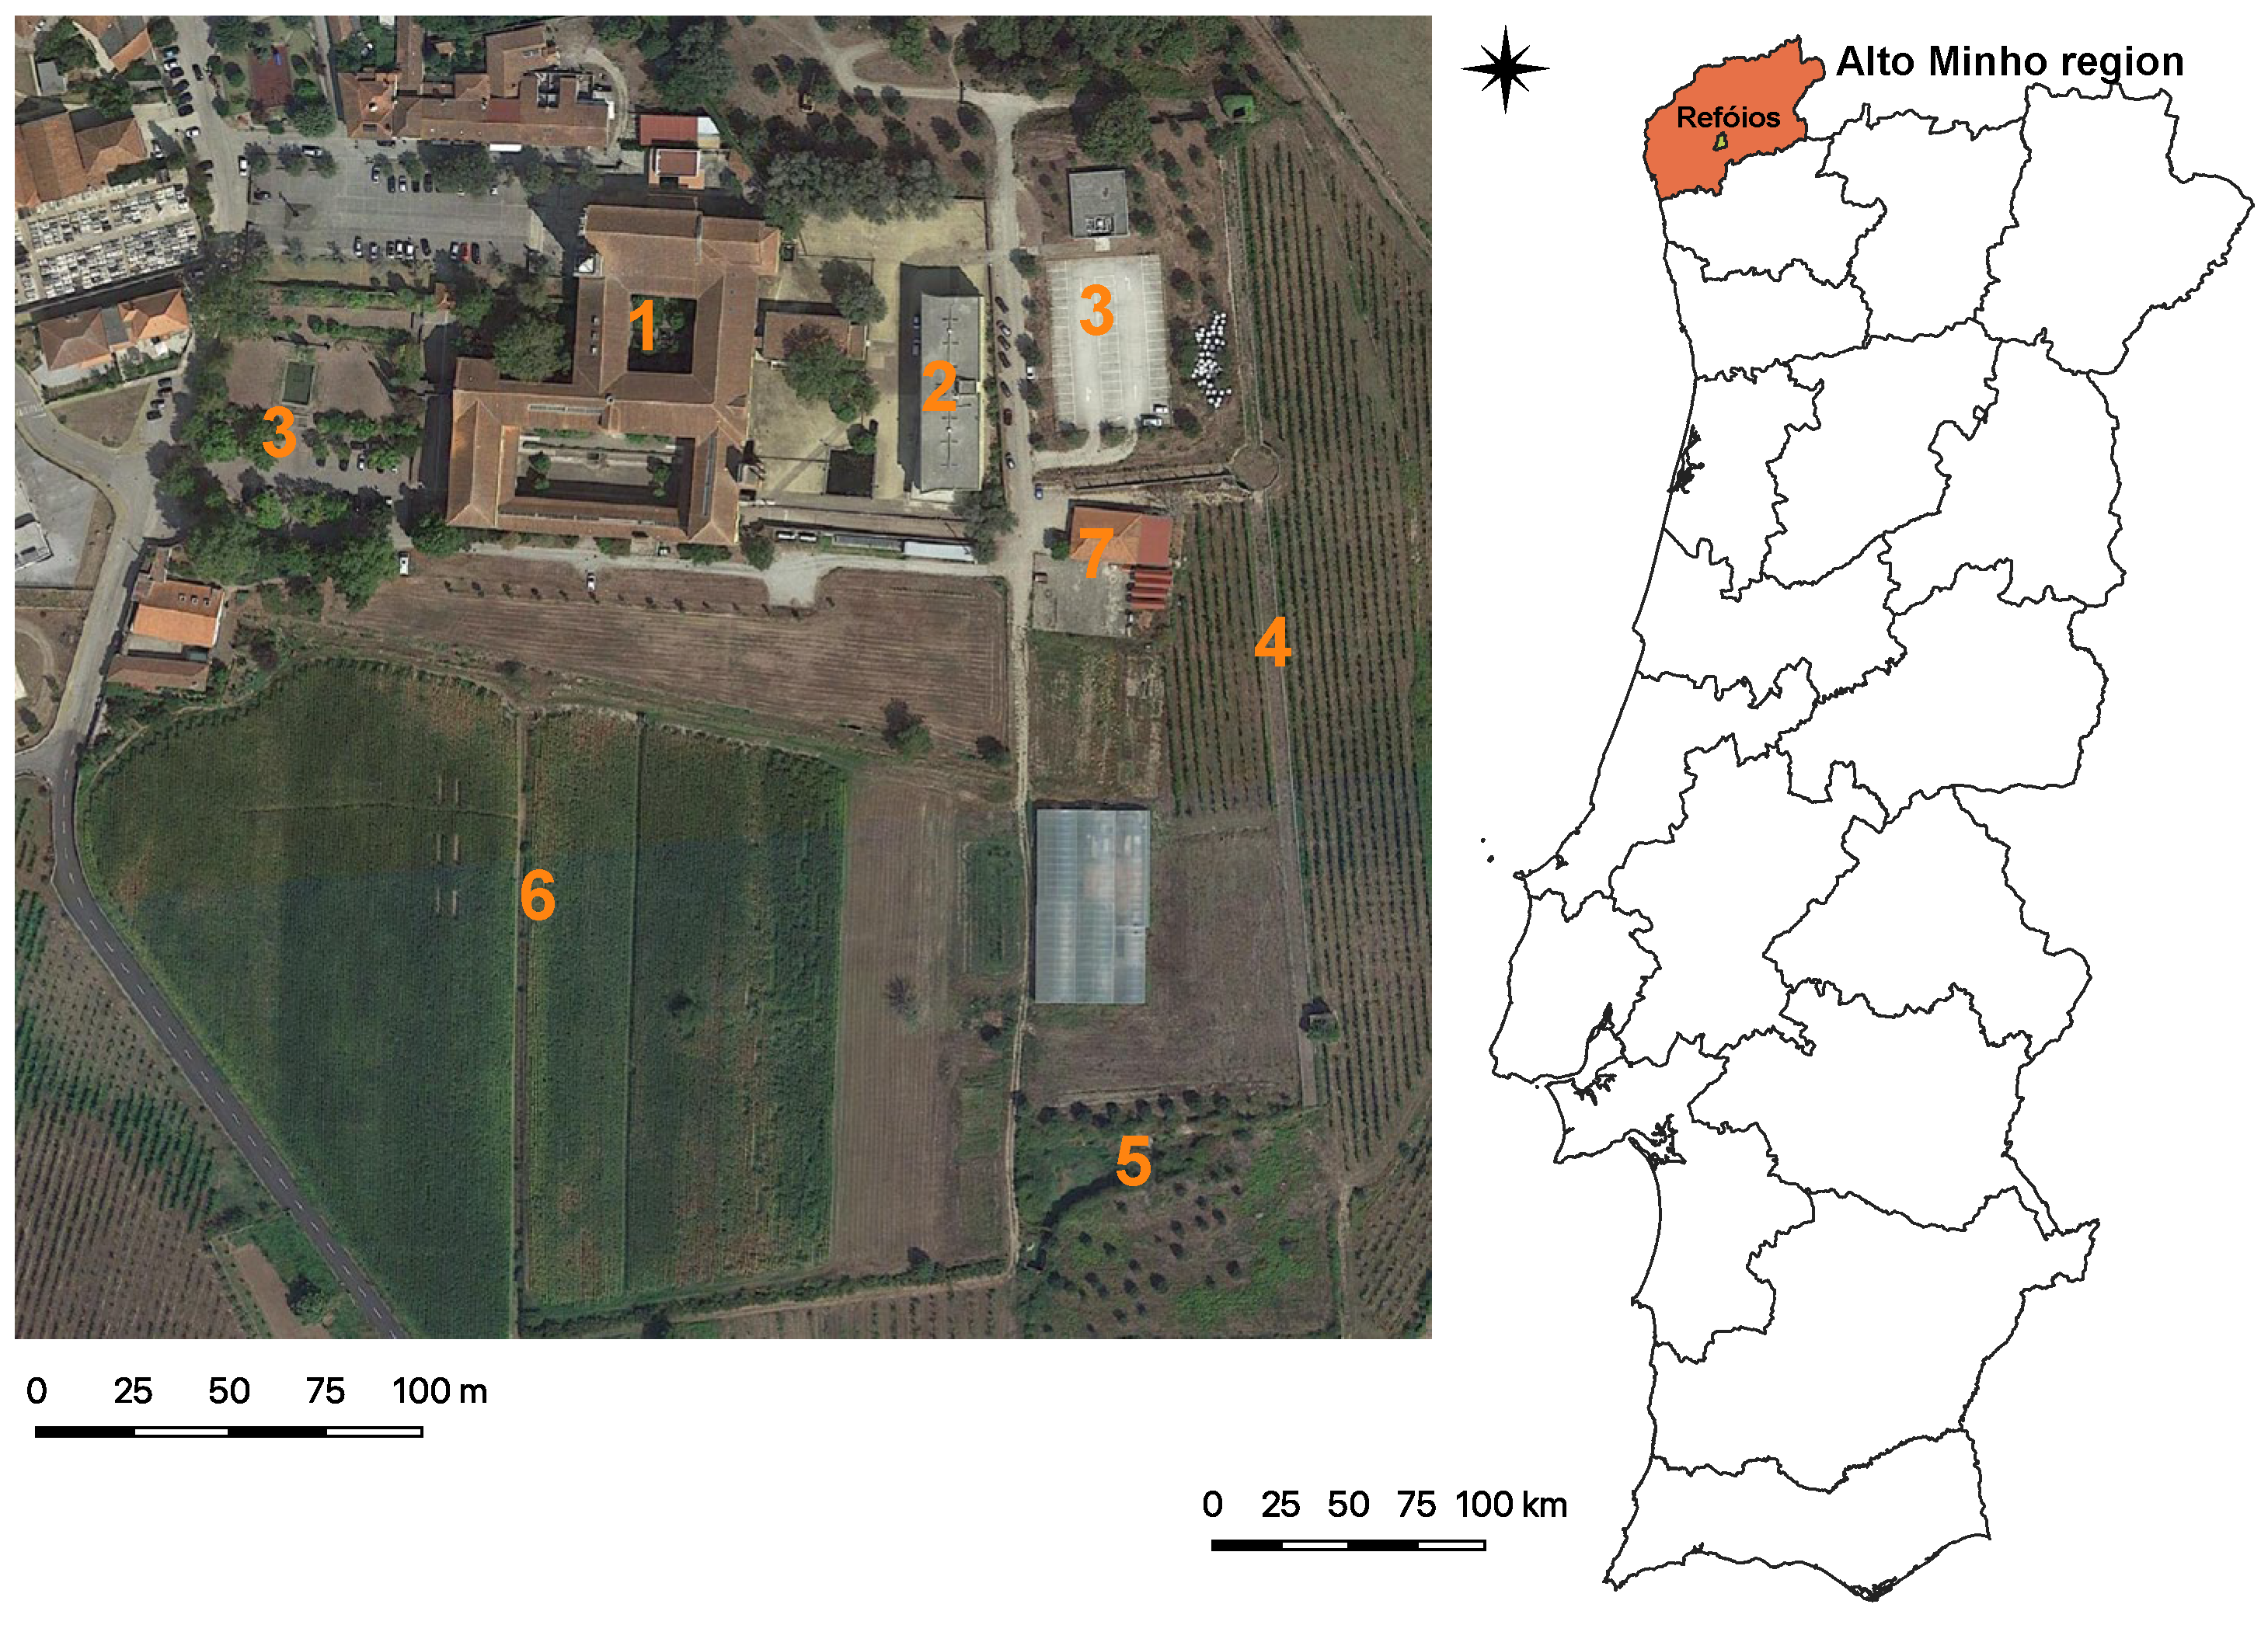
3.1. Location of the Case Study Area
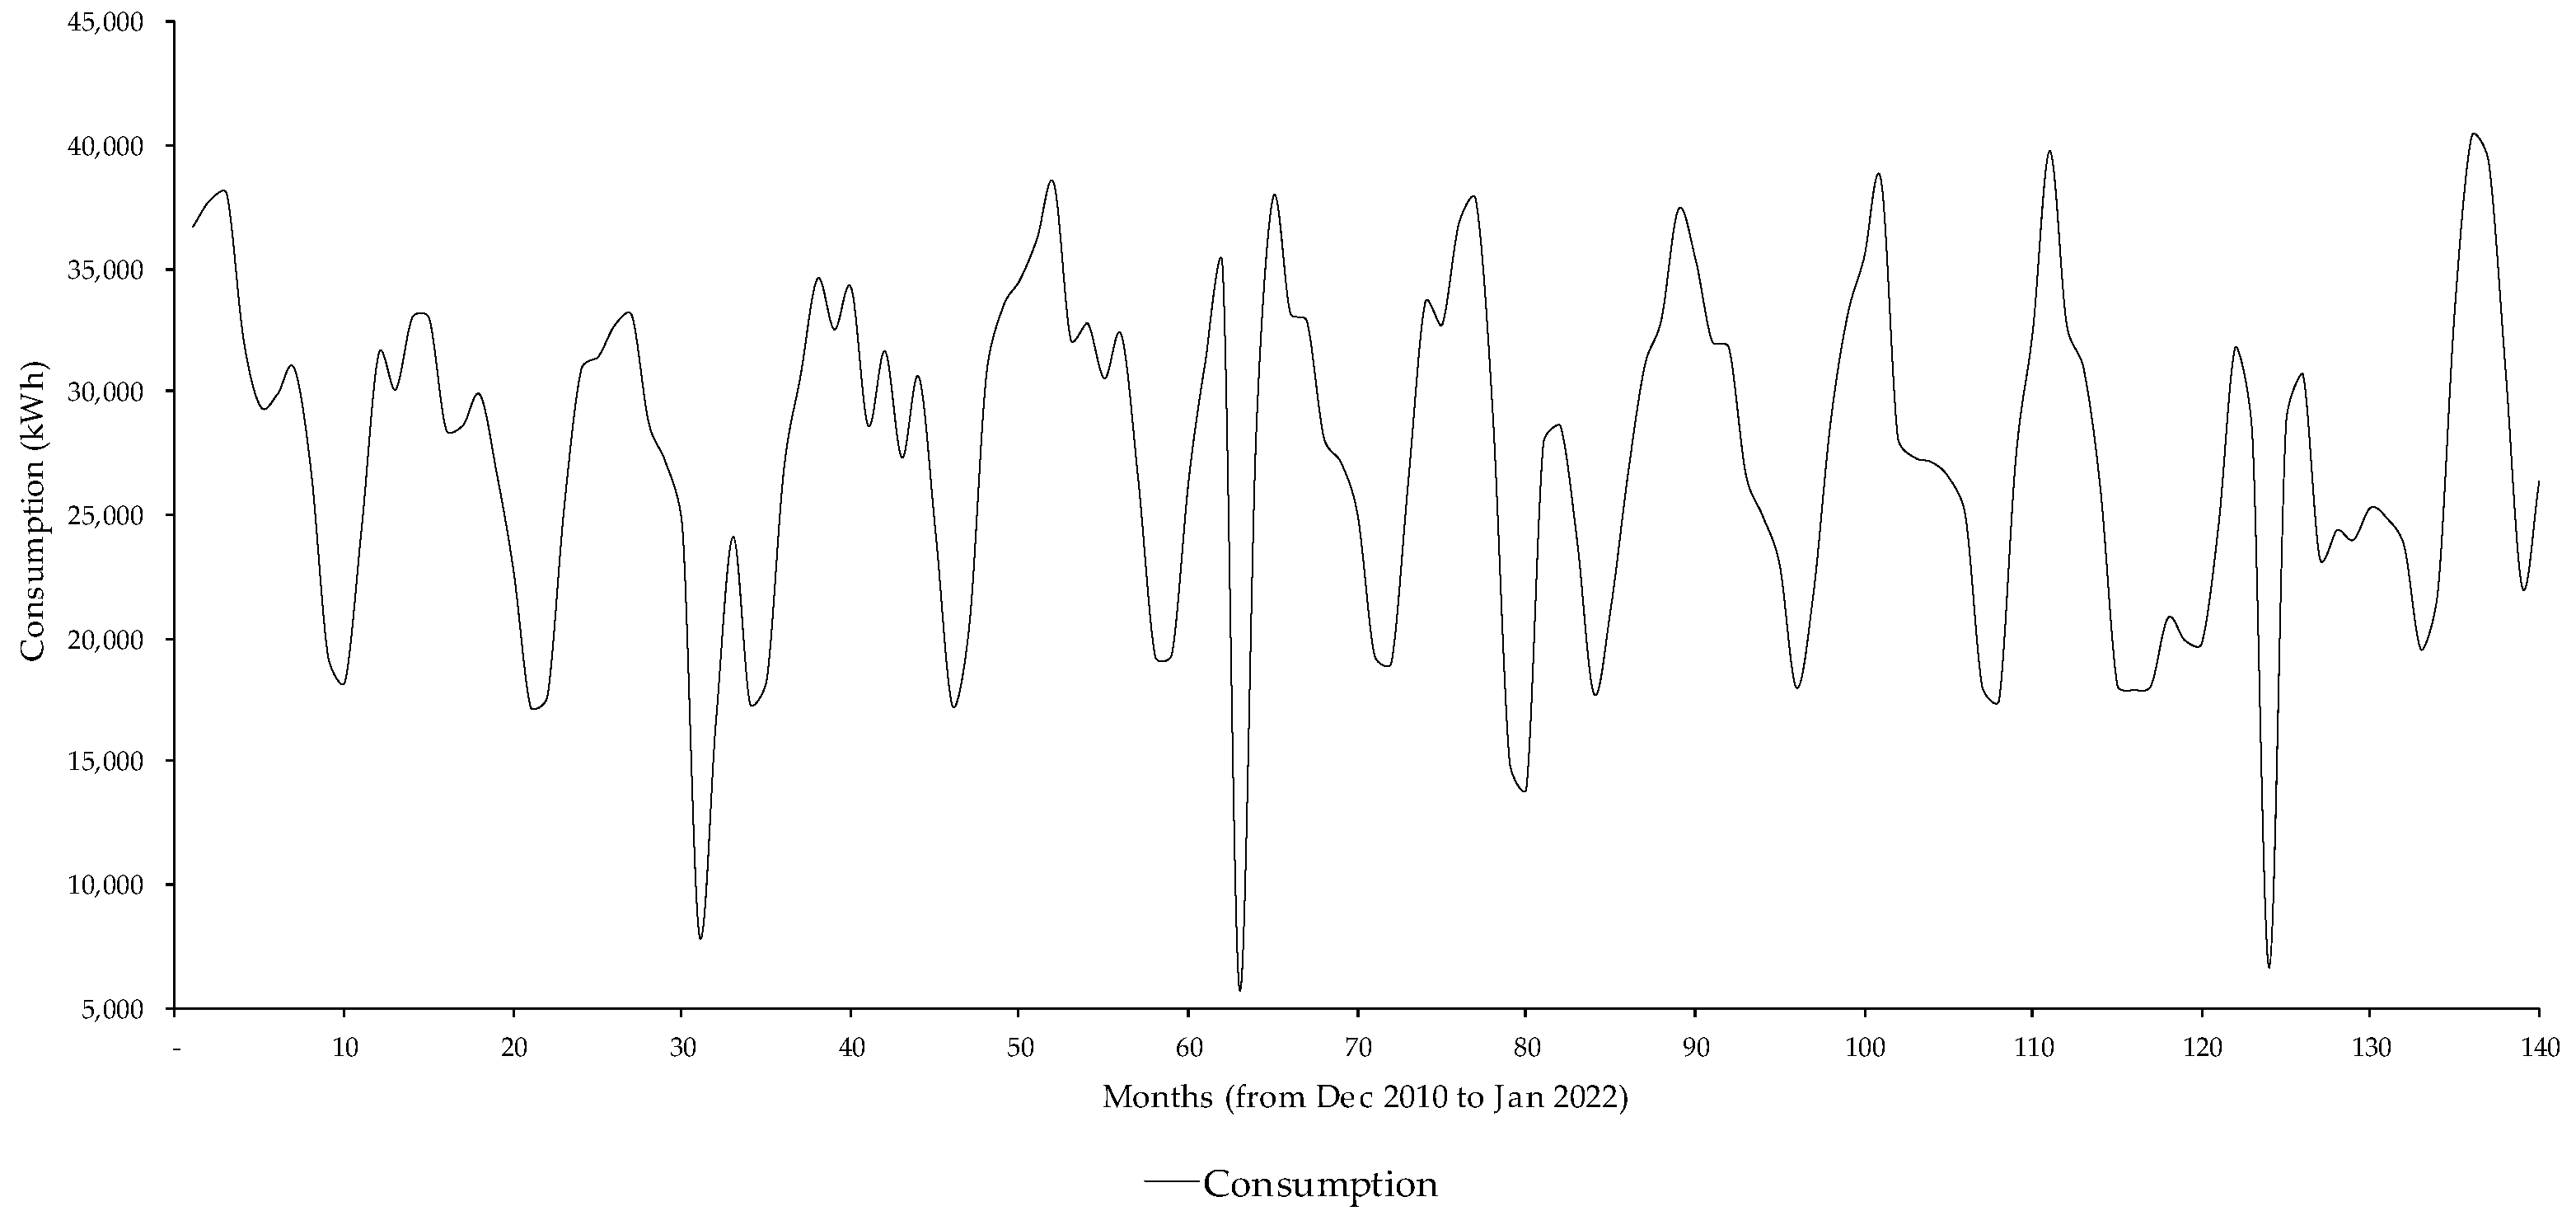
3.2. Power Consumption of ESA IPVC Campus
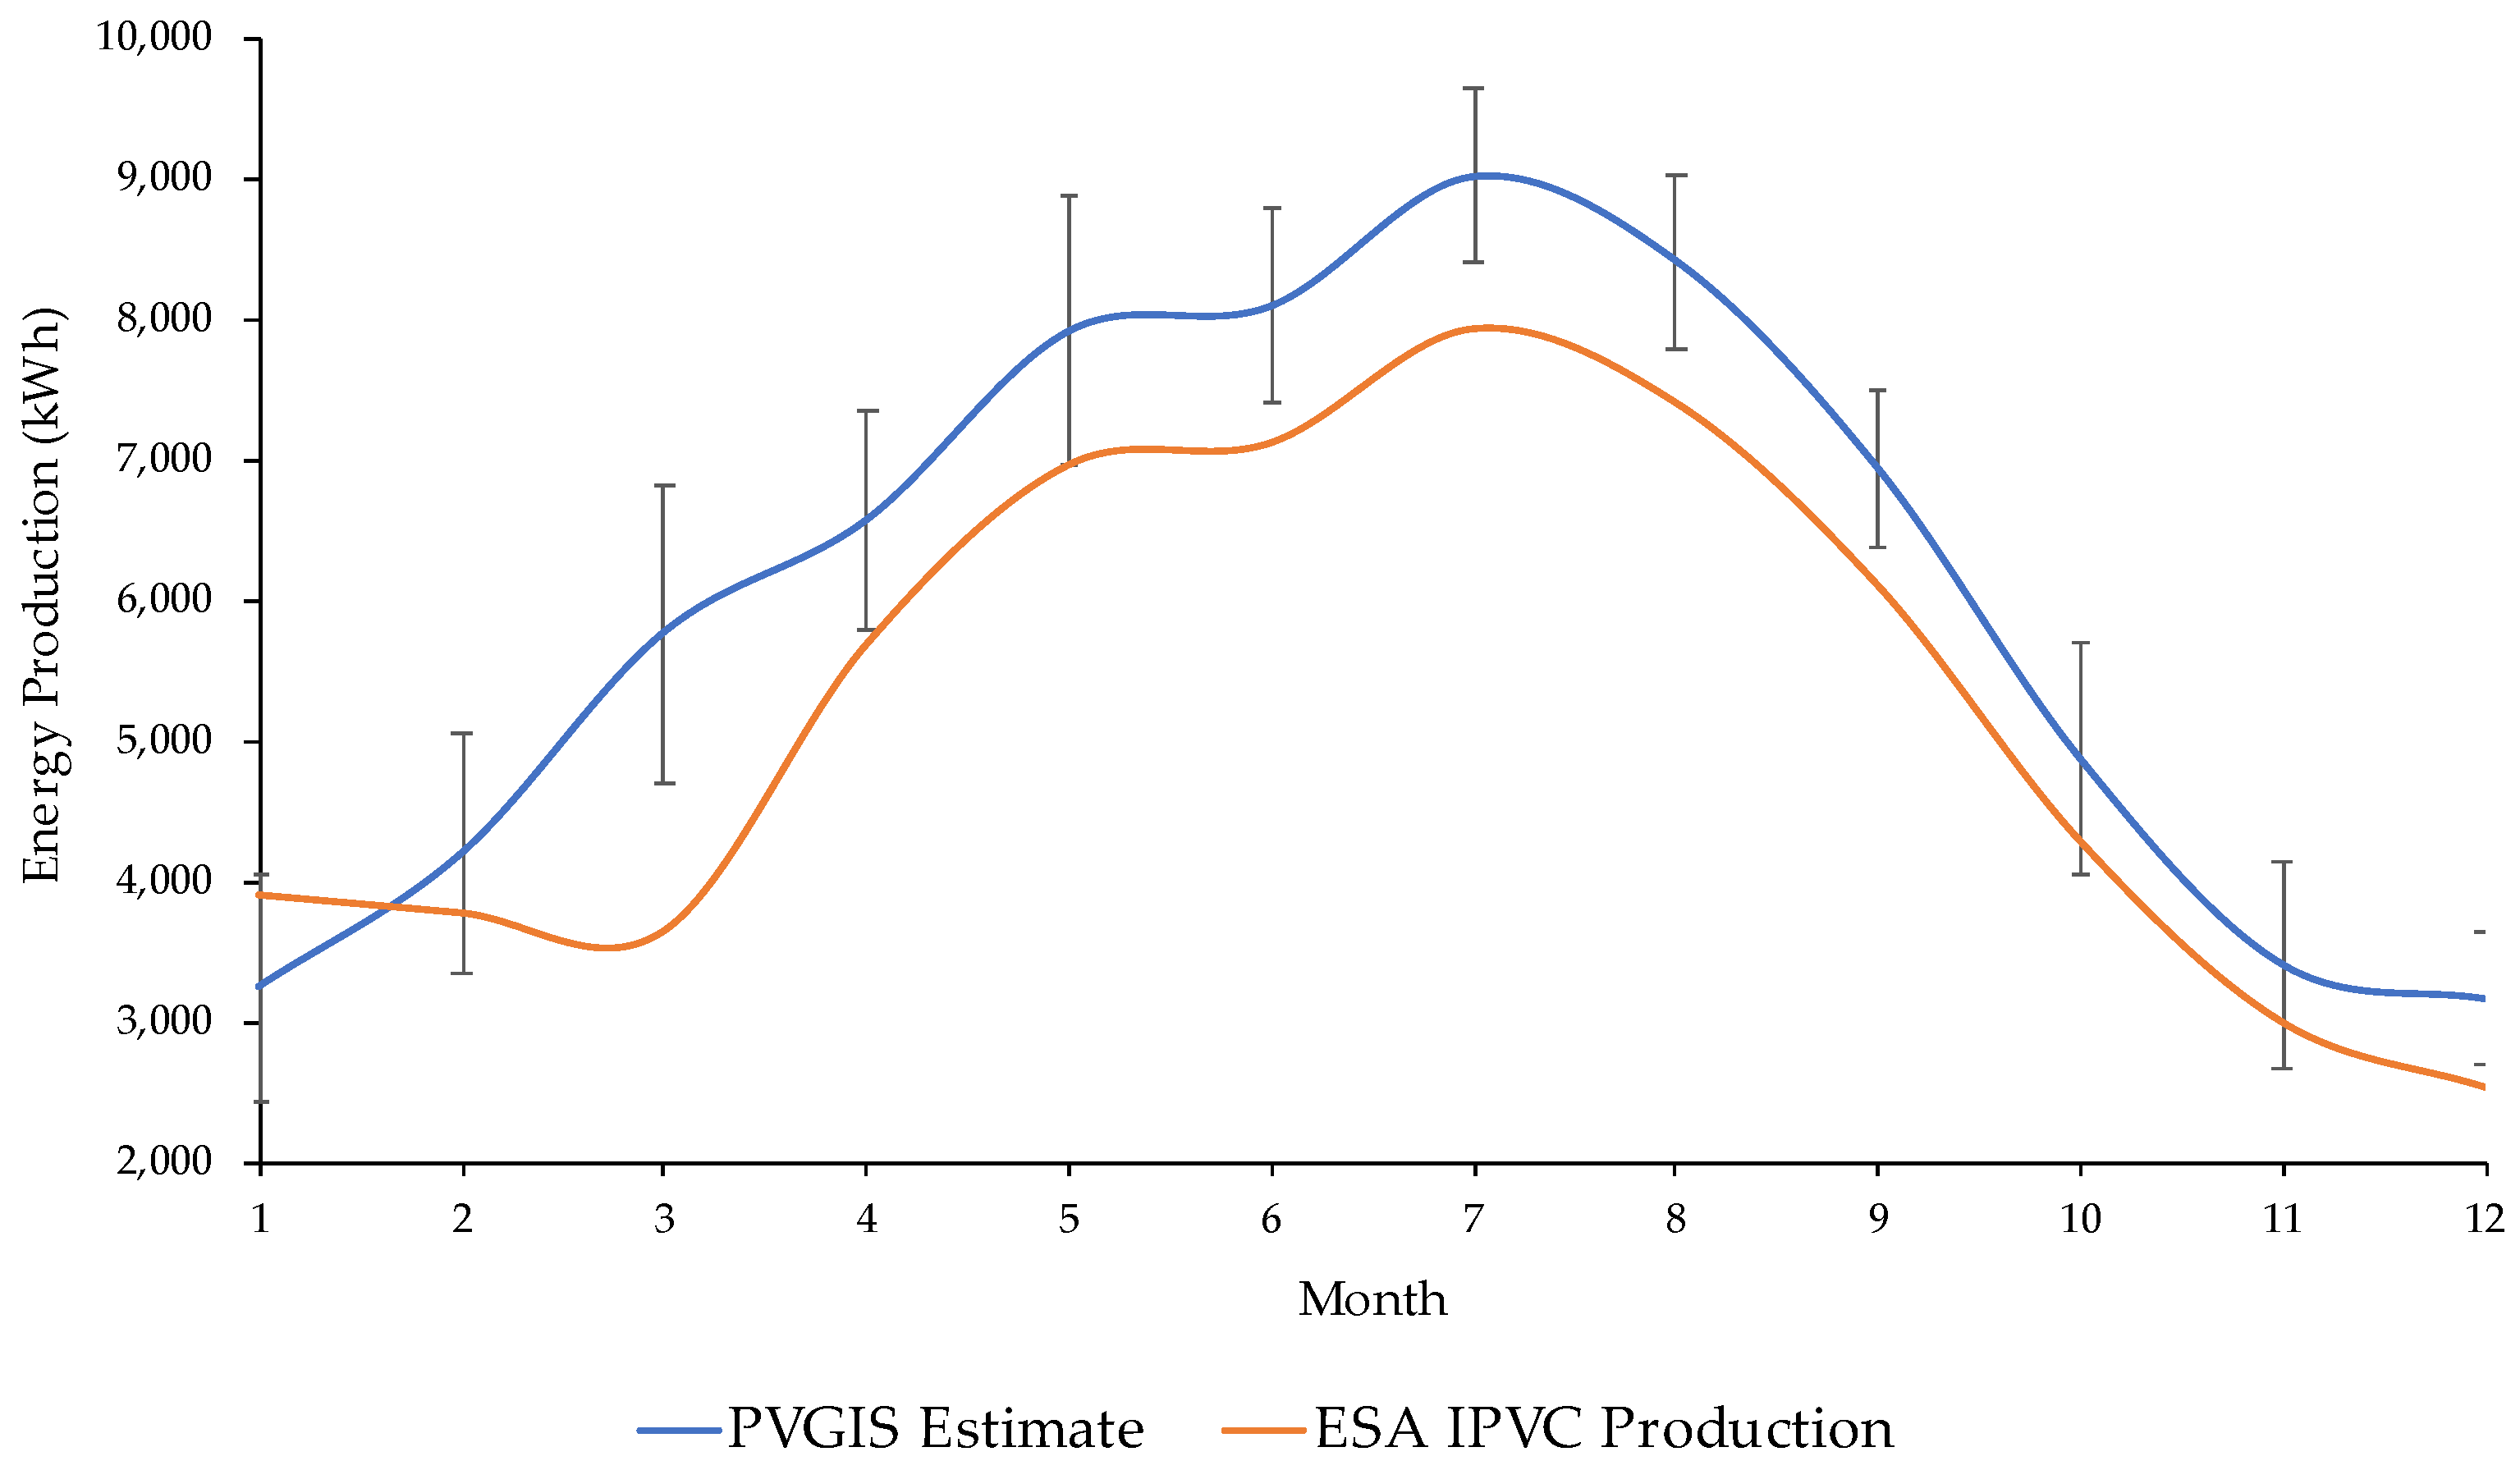
3.3. Calculation of PV Production System Installed on the ESA IPVC Campus
3.4. Calculation of the Carbon Footprint for the ESA IPVC Campus
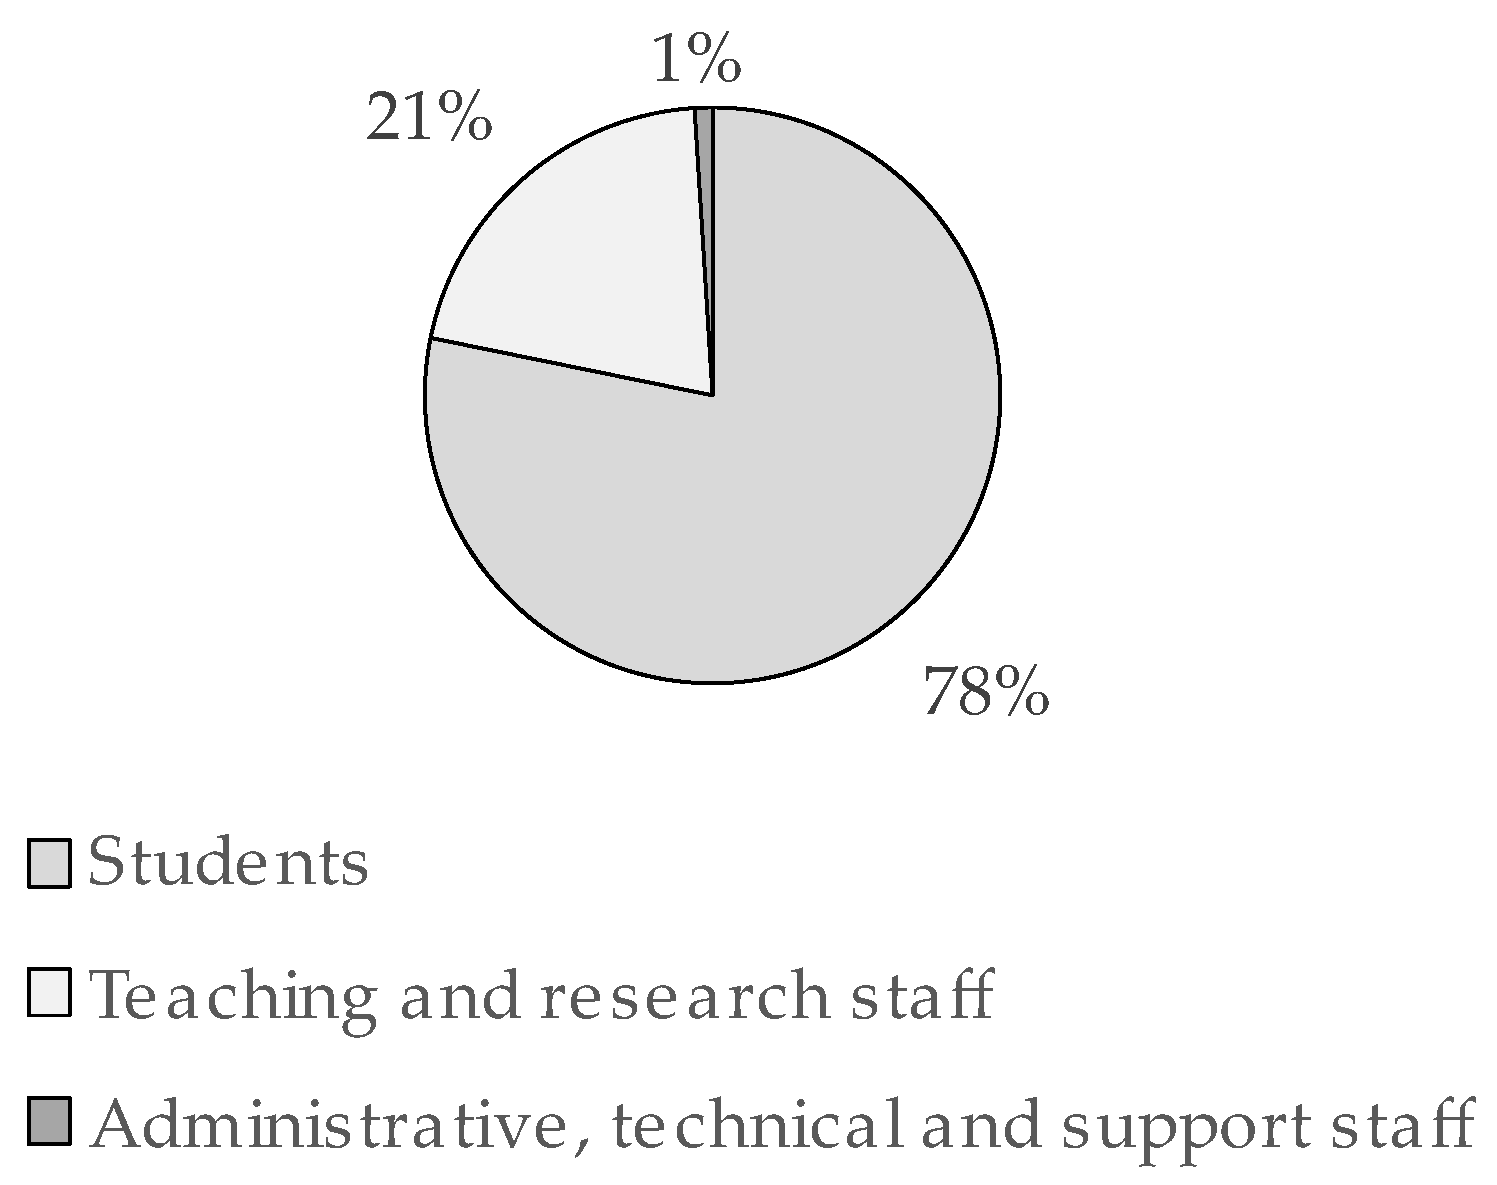
3.5. Assessment of the Current State of Awareness and Commitment of the ESA IPVC Community with Issues Related to Energy Savings and Efficiency
4. Results
4.1. Estimation Power Consumption at ESA IPVC
4.2. Calculation of the ESA IPVC Carbon Footprint
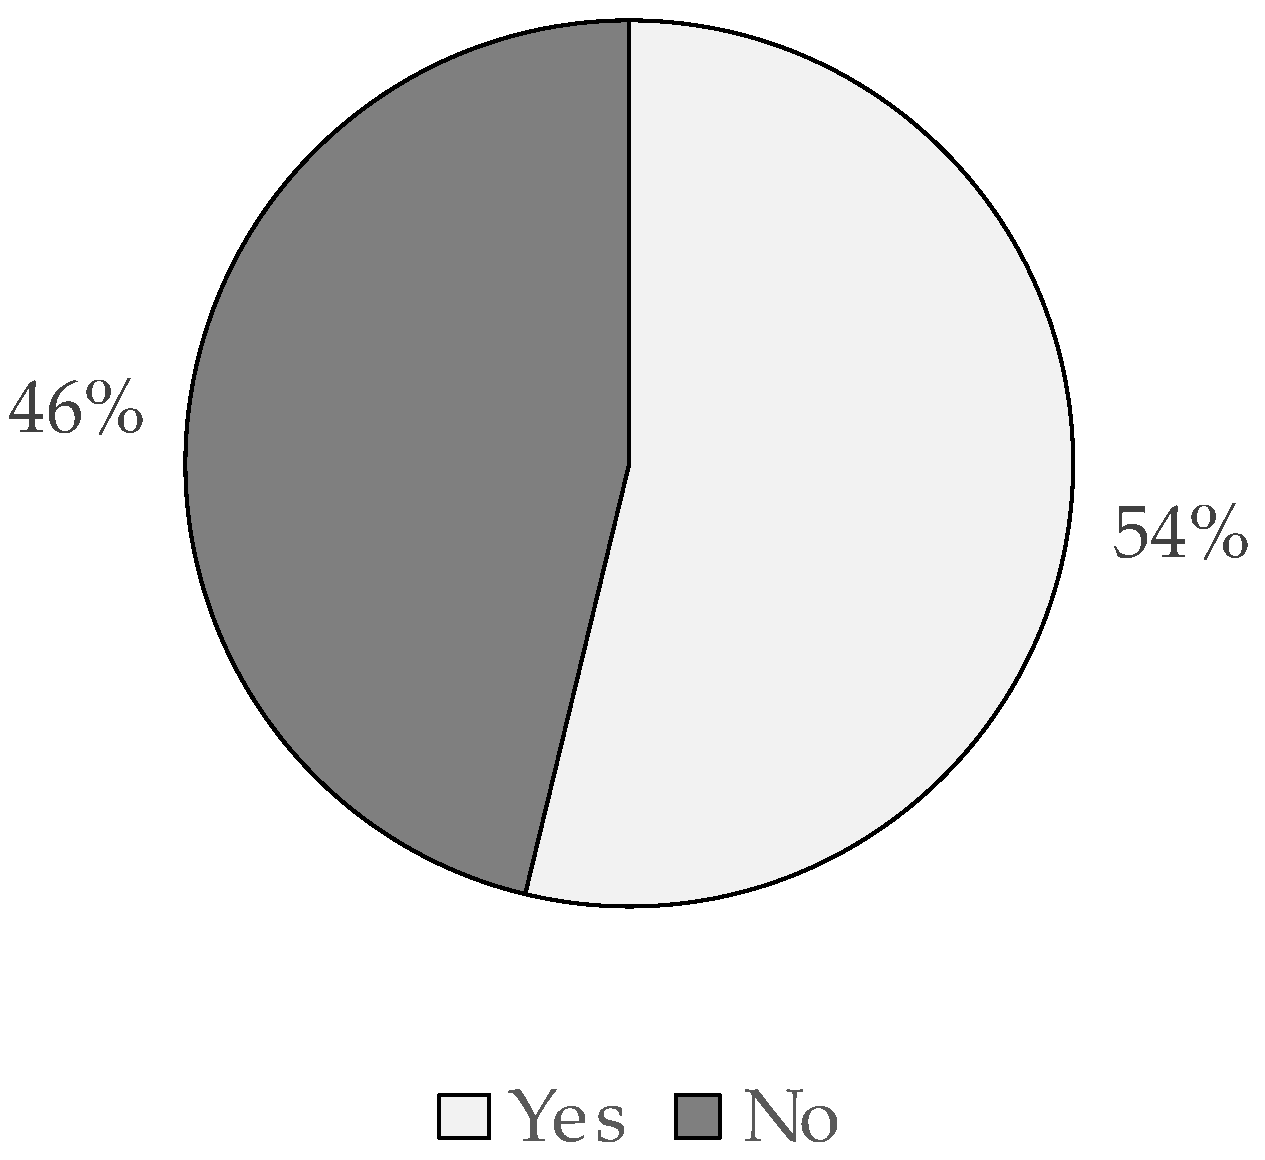
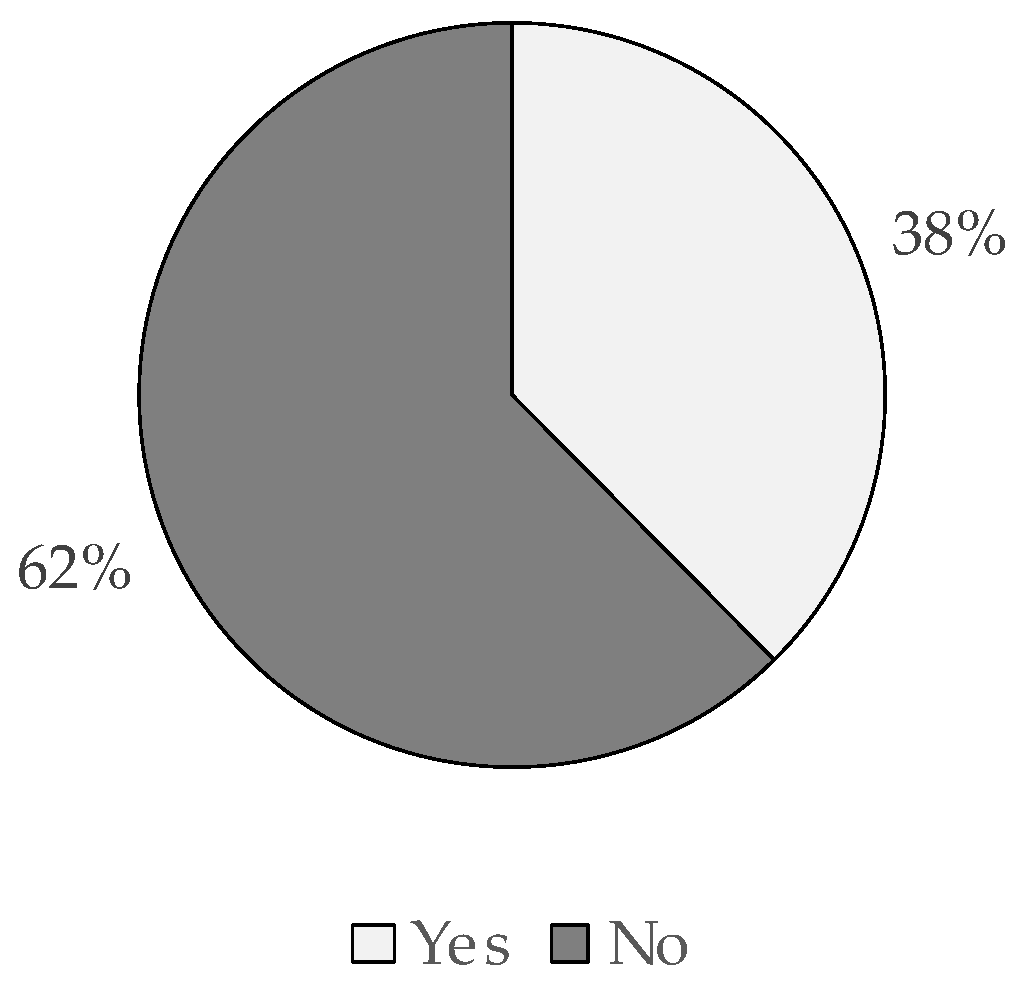
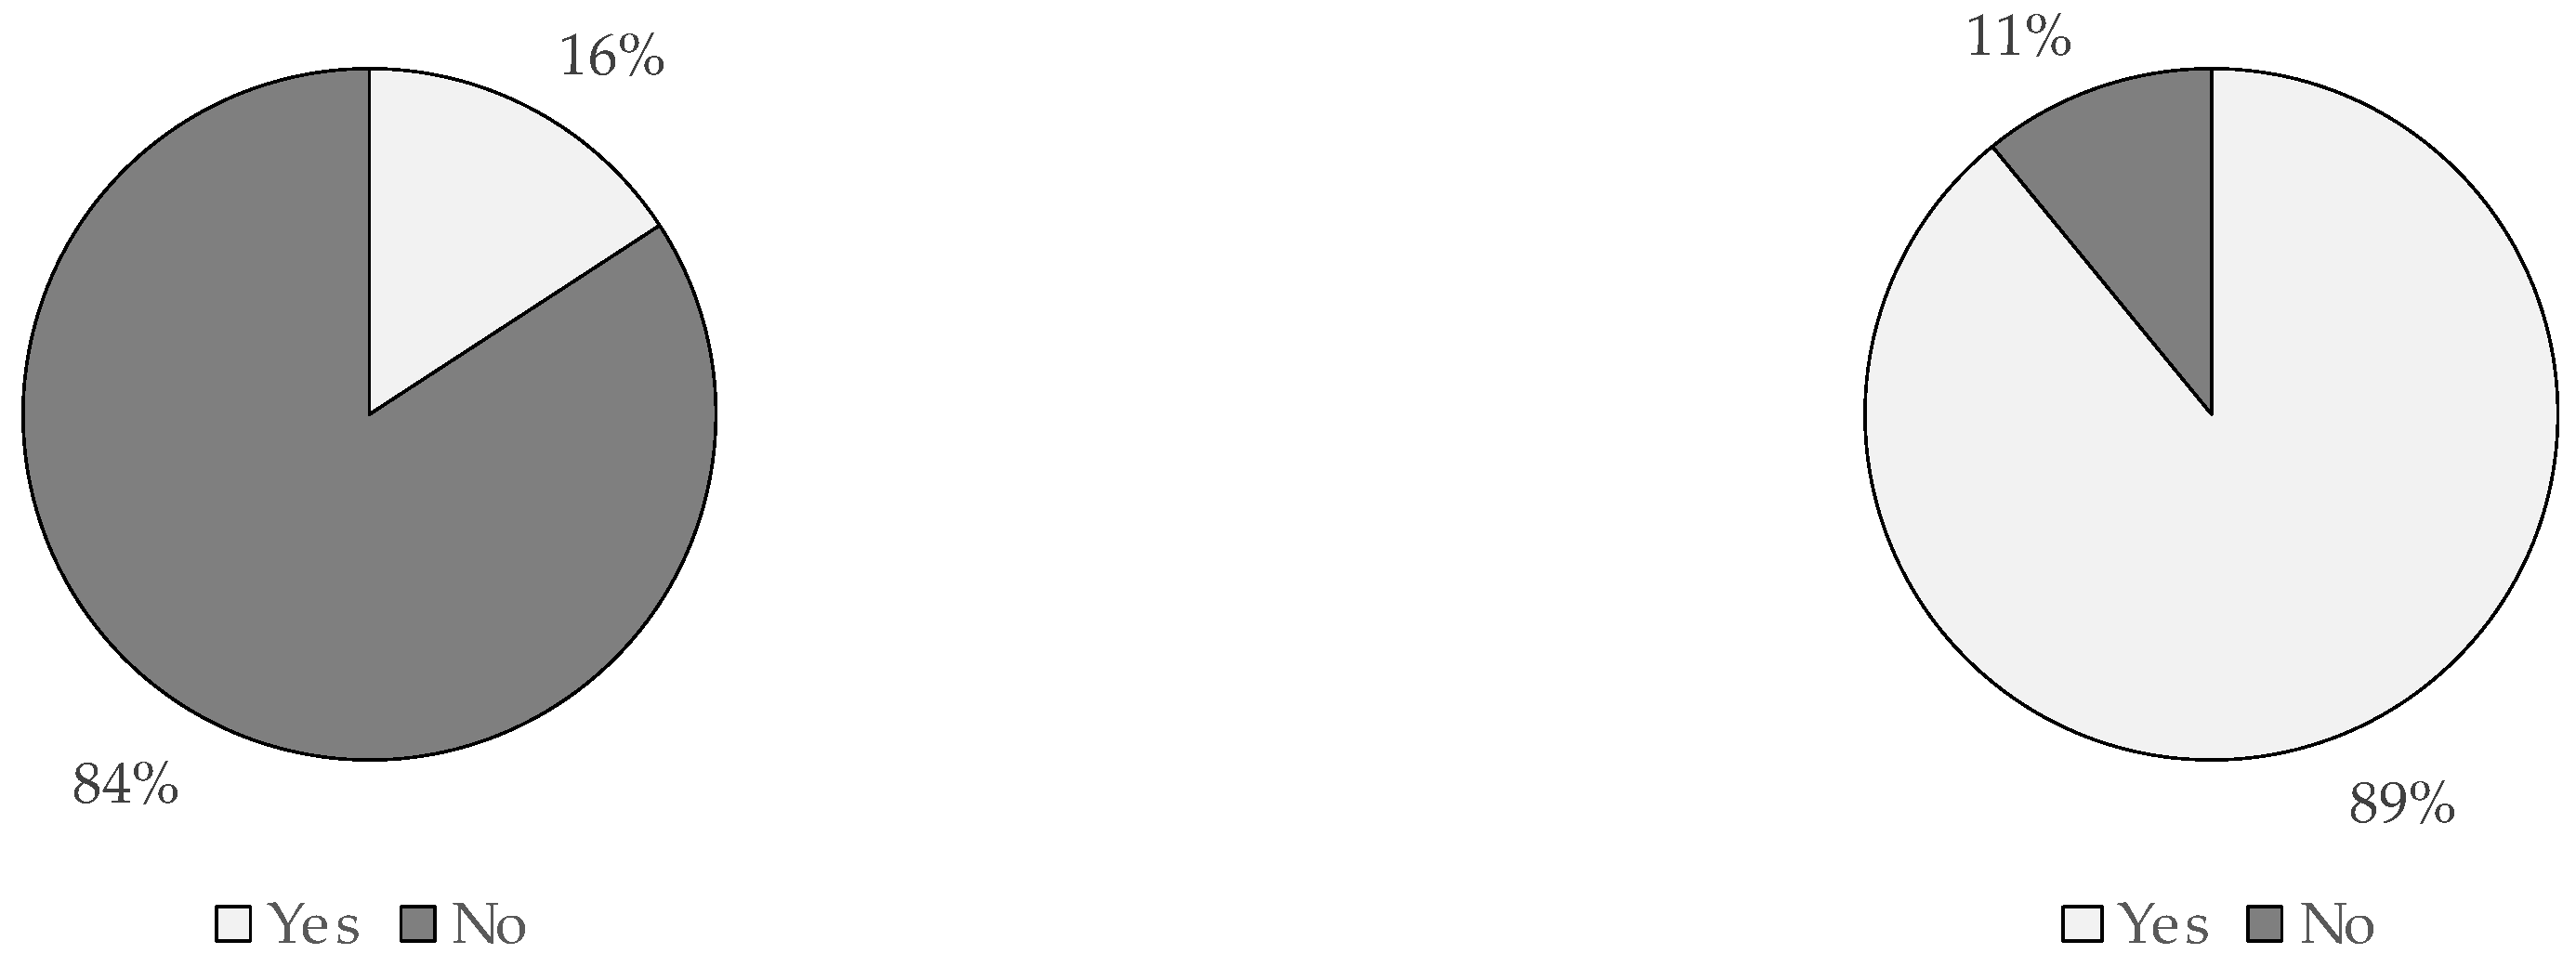
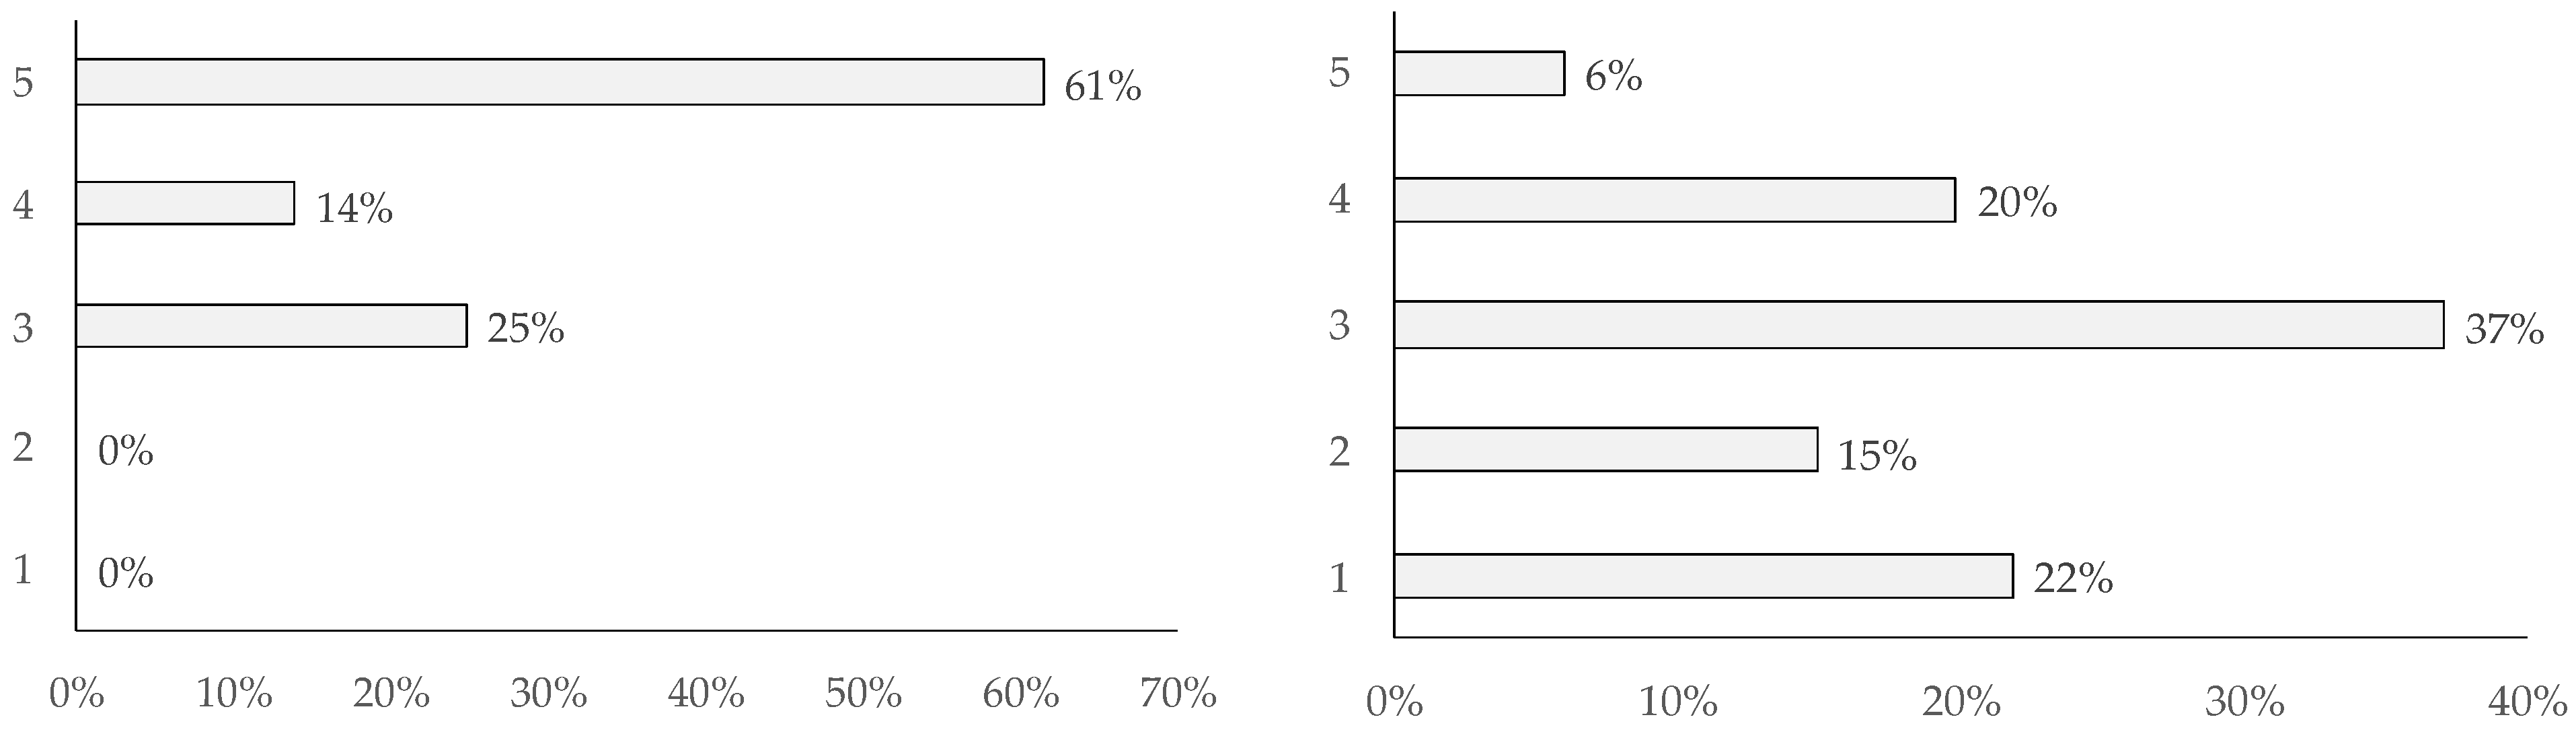
4.3. Analysis of the Results Obtained in the Survey
5. Discussion
6. Conclusions
Author Contributions
Funding
Institutional Review Board Statement
Informed Consent Statement
Data Availability Statement
Conflicts of Interest
References
- Yusoff, S.; Abu Bakar, A.; Rahmat Fakri, M.F.; Ahmad, A.Z. Sustainability Initiative for a Malaysian University Campus: Living Laboratories and the Reduction of Greenhouse Gas Emissions. Environ. Dev. Sustain. 2021, 23, 14046–14067. [Google Scholar] [CrossRef]
- Lozano, R. Incorporation and Institutionalization of SD into Universities: Breaking through Barriers to Change. J. Clean Prod. 2006, 14, 787–796. [Google Scholar] [CrossRef]
- Alshuwaikhat, H.M.; Abubakar, I. An Integrated Approach to Achieving Campus Sustainability: Assessment of the Current Campus Environmental Management Practices. J. Clean Prod. 2008, 16, 1777–1785. [Google Scholar] [CrossRef] [Green Version]
- Lozano, R.; Lukman, R.; Lozano, F.J.; Huisingh, D.; Lambrechts, W. Declarations for Sustainability in Higher Education: Becoming Better Leaders, through Addressing the University System. J. Clean. Prod. 2013, 48, 10–19. [Google Scholar] [CrossRef]
- Dagiliūtė, R.; Liobikienė, G.; Minelgaitė, A. Sustainability at Universities: Students’ Perceptions from Green and Non-Green Universities. J. Clean Prod. 2018, 181, 473–482. [Google Scholar] [CrossRef]
- Guan, J.; Nord, N.; Chen, S. Energy Planning of University Campus Building Complex: Energy Usage and Coincidental Analysis of Individual Buildings with a Case Study. Energy Build 2016, 124, 99–111. [Google Scholar] [CrossRef] [Green Version]
- Busaeri, N.; Giriantari, I.A.D.; Ariastina, W.G.; Swamardika, I.B.A. Energy Management Strategy in Campus towards a Green Campus through Promoting Carbon Footprint and Energy Efficiency Index Improving. Int. J. Energy Econ. Policy 2021, 11, 374–382. [Google Scholar] [CrossRef]
- Mohammadalizadehkorde, M.; Weaver, R. Quantifying Potential Savings from Sustainable Energy Projects at a Large Public University: An Energy Efficiency Assessment for Texas State University. Sustain. Energy Technol. Assess. 2020, 37, 100570. [Google Scholar] [CrossRef]
- Hamad, K.; Htun, P.T.T.; Obaid, L. Characterization of Travel Behavior at a University Campus: A Case Study of Sharjah University City, UAE. Transp. Res. Interdiscip. Perspect. 2021, 12, 100488. [Google Scholar] [CrossRef]
- Gurbuz, O.; Cheu, R.L. Survey to Explore Behavior, Intelligent Transportation Systems Needs, and Level of Service Expectations for Student Parking at a University Campus. Transp. Res. Rec. 2020, 2674, 168–177. [Google Scholar] [CrossRef]
- Allen, J.; Farber, S. How Time-Use and Transportation Barriers Limit on-Campus Participation of University Students. Travel Behav. Soc. 2018, 13, 174–182. [Google Scholar] [CrossRef]
- Abubakar, I.R.; Al-Shihri, F.S.; Ahmed, S.M. Students’ Assessment of Campus Sustainability at the University of Dammam, Saudi Arabia. Sustainbility 2016, 8, 59. [Google Scholar] [CrossRef] [Green Version]
- Psarrou Kalakoni, A.M.; Christoforou, Z.; Farhi, N. A Novel Methodology for Micromobility System Assessment Using Multi-Criteria Analysis. Case Stud. Transp. Policy 2022, 10, 976–992. [Google Scholar] [CrossRef]
- Seecharan, T.S. Encouraging Fuel-Efficient Commuting in Young Drivers in Duluth, MN. In Proceedings of the 14th WCEAM, Singapore, 28–31 July 2019; Lecture Notes in Mechanical Engineering. Crespo Márquez, A., Komljenovic, D., Amadi-Echendu, J., Eds.; Springer: Cham, Switzerland, 2021. [Google Scholar] [CrossRef]
- Ramos, T.B.; Caeiro, S.; Van Hoof, B.; Lozano, R.; Huisingh, D.; Ceulemans, K. Experiences from the implementation of sustainable development in higher education institutions: Environmental Management for Sustainable Universities. J. Clean. Prod. 2015, 106, 3–10. [Google Scholar] [CrossRef]
- Leon, I.; Oregi, X.; Marieta, C. Contribution of University to Environmental Energy Sustainability in the City. Sustainbility 2020, 12, 774. [Google Scholar] [CrossRef] [Green Version]
- Lozano, R.; Lozano, F.J.; Mulder, K.; Huisingh, D.; Waas, T. Advancing Higher Education for Sustainable Development: International Insights and Critical Reflections. J. Clean. Prod. 2013, 48, 3–9. [Google Scholar] [CrossRef]
- Daradkeh, Y.I.; Testov, V.A.; Golubev, O.B. Educational network projects as form of E-Learning. Int. J. Adv. Corp. Learn. 2019, 12, 29. [Google Scholar] [CrossRef]
- Li, Y.; Gu, Y.; Liu, C. Prioritising Performance Indicators for Sustainable Construction and Development of University Campuses Using an Integrated Assessment Approach. J. Clean Prod. 2018, 202, 959–968. [Google Scholar] [CrossRef]
- Putri, N.T.; Amrina, E.; Nurnaeni, S. Students’ Perceptions of the Implementation of Sustainable Campus Development Based on Landscape Concepts at Andalas University. Procedia Manuf. 2020, 43, 255–262. [Google Scholar] [CrossRef]
- Pereira Ribeiro, J.M.; Hoeckesfeld, L.; Dal Magro, C.B.; Favretto, J.; Barichello, R.; Lenzi, F.C.; Secchi, L.; Montenegro de Lima, C.R.; Salgueirinho Osório de Andrade Guerra, J.B. Green Campus Initiatives as Sustainable Development Dissemination at Higher Education Institutions: Students’ Perceptions. J. Clean Prod. 2021, 312, 127671. [Google Scholar] [CrossRef]
- Barros, M.V.; Puglieri, F.N.; Tesser, D.P.; Kuczynski, O.; Piekarski, C.M. Sustainability at a Brazilian University: Developing Environmentally Sustainable Practices and a Life Cycle Assessment Case Study. Int. J. Sustain. High. Educ. 2020, 21, 841–859. [Google Scholar] [CrossRef]
- Sadik-Zada, E.R.; Ferrari, M. Environmental Policy Stringency, Technical Progress and Pollution Haven Hypothesis. Sustainbility 2020, 12, 3880. [Google Scholar] [CrossRef]
- Ali, M.; Kim, Y. Can a University Campus Work as a Public Space in the Metropolis of a Developing Country? The Case of Ain-Shams University, Cairo, Egypt. Sustainbility 2020, 12, 7229. [Google Scholar] [CrossRef]
- Agusdinata, D.B. The Role of Universities in SDGs Solution Co-Creation and Implementation: A Human-Centered Design and Shared-Action Learning Process. Sustain. Sci. 2022, 17, 1589–1604. [Google Scholar] [CrossRef]
- Amaral, A.R.; Rodrigues, E.; Gaspar, A.R.; Gomes, Á. A Review of Empirical Data of Sustainability Initiatives in University Campus Operations. J. Clean Prod. 2020, 250, 117728. [Google Scholar] [CrossRef]
- Medrano, M.; Martí, J.M.; Rincón, L.; Mor, G.; Cipriano, J.; Farid, M. Assessing the Nearly Zero-Energy Building Gap in University Campuses with a Feature Extraction Methodology Applied to a Case Study in Spain. Int. J. Energy Environ. Eng. 2018, 9, 227–247. [Google Scholar] [CrossRef] [Green Version]
- Ferreira, J.G.; de Matos, M.; Silva, H.; Franca, A.; Duarte, P. Sustainable Campus: The Experience of the University of Lisbon at Ist. Sustainbility 2021, 13, 8050. [Google Scholar] [CrossRef]
- Mac-Lean, C.; Cabezas, R.; Muñoz, M.; Vargas, L. Applications of Low Enthalpy Geothermal Energy: The Case of the Faculty of Physical and Mathematical Sciences at the University of Chile. Int. J. Energy Prod. Manag. 2018, 3, 69–78. [Google Scholar] [CrossRef]
- Okundamiya, M.S. Integration of Photovoltaic and Hydrogen Fuel Cell System for Sustainable Energy Harvesting of a University ICT Infrastructure with an Irregular Electric Grid. Energy Convers. Manag. 2021, 250, 114928. [Google Scholar] [CrossRef]
- Thiab, R.; Amudy, M.; Rizal, T.A. Study on Implementation of Rooftop Photovoltaic Power Plant as an Effort to Attain a Sustainable Campus. Eur. J. Eng. Res. Sci. 2019, 4, 21–25. [Google Scholar] [CrossRef]
- Mansouri Kouhestani, F.; Byrne, J.; Spencer, L.; Hazendonk, P.; Brown, B.; Johnson, D. A Comprehensive Assessment of Solar and Wind Energy Potential at the University of Lethbridge Campus, a Medium-Sized Western Canadian University. Int. J. Green Energy 2019, 16, 1246–1263. [Google Scholar] [CrossRef]
- Castrillón-Mendoza, R.; Manrique-Castillo, P.A.; Rey-Hernández, J.M.; Rey-Martínez, F.J.; González-Palomino, G. PV Energy Performance in a Sustainable Campus. Electronics 2020, 9, 1874. [Google Scholar] [CrossRef]
- Lee, J.; Chang, B.; Aktas, C.; Gorthala, R. Economic Feasibility of Campus-Wide Photovoltaic Systems in New England. Renew. Energy 2016, 99, 452–464. [Google Scholar] [CrossRef] [Green Version]
- Akwa, J.V.; Konrad, O.; Kaufmann, G.V.; MacHado, C.A. Evaluation of the Photovoltaic Generation Potential and Real-Time Analysis of the Photovoltaic Panel Operation on a Building Facade in Southern Brazil. Energy Build. 2014, 69, 426–433. [Google Scholar] [CrossRef]
- Reyasudin Basir Khan, M.; Pasupuleti, J.; Al-Fattah, J.; Tahmasebi, M. Optimal Grid-Connected PV System for a Campus Microgrid. Indones. J. Electr. Eng. Comput. Sci. 2018, 12, 899–906. [Google Scholar] [CrossRef]
- Herrando, M.; Pantaleo, A.M.; Wang, K.; Markides, C.N. Solar Combined Cooling, Heating and Power Systems Based on Hybrid PVT, PV or Solar-Thermal Collectors for Building Applications. Renew. Energy 2019, 143, 637–647. [Google Scholar] [CrossRef]
- Alghamdi, A.S.; Bahaj, A.B.S.; Wu, Y. Assessment of Large Scale Photovoltaic Power Generation from Carport Canopies. Energies 2017, 10, 686. [Google Scholar] [CrossRef] [Green Version]
- Grisales-Noreña, L.F.; Ramos-Paja, C.A.; Gonzalez-Montoya, D.; Alcalá, G.; Hernandez-Escobedo, Q. Energy Management in PV Based Microgrids Designed for the Universidad Nacional de Colombia. Sustainability 2020, 12, 1219. [Google Scholar] [CrossRef] [Green Version]
- Enano, N.J.; Barroca, R.; Montecastro, D. Avoided Emissions Resulting from Grid-Tied Solar Photovoltaic Generation in the Philippines: An Energy-Based Analysis. IOP Conf. Ser. Mater. Sci. Eng. 2021, 1088, 012053. [Google Scholar] [CrossRef]
- Tarigan, E. Simulation and Feasibility Studies of Rooftop PV System for University Campus Buildings in Surabaya, Indonesia. Int. J. Renew. Energy Res. 2018, 8, 895–908. [Google Scholar] [CrossRef]
- Tebbouche, H.; Bouchair, A.; Grimes, S. Towards an Environmental Approach for the Sustainability of Buildings in Algeria. Energy Procedia 2017, 119, 98–110. [Google Scholar] [CrossRef]
- Kaoula, D.; Bouchair, A. The Pinpointing of the Most Prominent Parameters on the Energy Performance for Optimal Passive Strategies in Ecological Buildings Based on Bioclimatic, Sensitivity and Uncertainty Analyses. Int. J. Ambient Energy 2022, 43, 685–712. [Google Scholar] [CrossRef]
- Lim, M.; Hayder, G. Performance and Reduction of Carbon Footprint for a Sustainable Campus. Int. J. Eng. Adv. Technol. 2019, 9, 3489–3493. [Google Scholar] [CrossRef]
- Robinson, Z.P.; Laycock Pedersen, R. How to Repurpose the University: A Resilience Lens on Sustainability Governance. Front. Sustain. 2021, 2, 674210. [Google Scholar] [CrossRef]
- Jiao, Z.; Fu, B. Research on the Niche Strategy of Campus Planning. Energy Procedia 2019, 157, 782–792. [Google Scholar] [CrossRef]
- Dyer, G.; Dyer, M. Strategic Leadership for Sustainability by Higher Education: The American College & University Presidents’ Climate Commitment. J. Clean Prod. 2017, 140, 111–116. [Google Scholar] [CrossRef]
- Popescu, M.F.; Chiripuci, B.C.; Orîndaru, A.; Constantin, M.; Scrieciu, A. Fostering Sustainable Development through Shifting toward Rural Areas and Digitalization-the Case of Romanian Universities. Sustainability 2020, 12, 4020. [Google Scholar] [CrossRef]
- Xiong, W.; Mok, K.H. Sustainability Practices of Higher Education Institutions in Hong Kong: A Case Study of a Sustainable Campus Consortium. Sustainability 2020, 12, 452. [Google Scholar] [CrossRef] [Green Version]
- Zheng, N.; Li, S.; Wang, Y.; Huang, Y.; Bartoccid, P.; Fantozzid, F.; Huang, J.; Xing, L.; Yang, H.; Chen, H.; et al. Research on Low-Carbon Campus Based on Ecological Footprint Evaluation and Machine Learning: A Case Study in China. J. Clean Prod. 2021, 323, 129181. [Google Scholar] [CrossRef]
- Aarnoudse, E.; Closas, A.; Lefore, N. Water User Associations: A Review of Approaches and Alternative Management Options for Sub-Saharan Africa. IWMI Work. Pap. 2018, 180, 77. [Google Scholar] [CrossRef] [Green Version]
- Sadik-Zada, E.R.; Gatto, A. Civic Engagement and Energy Transition in the Nordic-Baltic Sea Region: Parametric and Nonparametric Inquiries. Socio-Econ. Plann. Sci. 2022, 101347. [Google Scholar] [CrossRef]
- Chowdhury, M.M.I.; Rahman, S.M.; Abubakar, I.R.; Aina, Y.A.; Hasan, M.A.; Khondaker, A.N. A Review of Policies and Initiatives for Climate Change Mitigation and Environmental Sustainability in Bangladesh. Environ. Dev. Sustain. 2021, 23, 1133–1161. [Google Scholar] [CrossRef]
- Nurunnabi, M.; Esquer, J.; Munguia, N.; Zepeda, D.; Perez, R.; Velazquez, L. Reaching the Sustainable Development Goals 2030: Energy Efficiency as an Approach to Corporate Social Responsibility (CSR). GeoJournal 2020, 85, 363–374. [Google Scholar] [CrossRef]
- Liu, Y. Investigating Users’ Willingness of Acceptance for Background Music Service in Intelligent Library. Libr. Hi Tech 2022, 40, 33–44. [Google Scholar] [CrossRef]
- Namgung, M.; Jun, H.J. The Influence of Attitudes on University Bicycle Commuting: Considering Bicycling Experience Levels. Int. J. Sustain. Transp. 2019, 13, 363–377. [Google Scholar] [CrossRef]
- Chauhan, V.; Galwankar, S.; Stawicki, S.P.; Agrawal, N.; Krishnan, S.V.; Bhoi, S.; Sinha, T.P.; Aggarwal, P. The “case-Based Learning Conference” Model at EMINDIA2017: A Novel Implementation of Problem-Based Educational Paradigm. J. Emergencies Trauma Shock. 2018, 11, 61–64. [Google Scholar] [CrossRef]
- Kudo, S.; Omi, K.; Florentin, K.; Allasiw, D.I. Key Experiences for the Transdisciplinary Approach: Fieldwork-Based Training in Sustainability Science Education. Int. J. Sustain. High. Educ. 2021, 22, 615–634. [Google Scholar] [CrossRef]
- Mewes, D.; Monsalve, P.; Gustafsson, I.; Hasan, B.; Palén, J.; Nakakido, R.; Capobianchi, E.; Österlund, B. Evaluation Methods for Photovoltaic Installations on Existing Buildings at the KTH Campus in Stockholm, Sweden. Energy Procedia 2017, 115, 409–422. [Google Scholar] [CrossRef]
- Mason, I.G.; Brooking, A.K.; Oberender, A.; Harford, J.M.; Horsley, P.G. Implementation of a Zero Waste Program at a University Campus. Resour. Conserv. Recycl. 2003, 38, 257–269. [Google Scholar] [CrossRef]
- Moreira, A.M.M.; Günther, W.M.R.; Ribeiro, H. School of Public Health, University of Sao Paulo—Marching Towards Socioeconomic and Environmental Sustainability. In Towards Green Campus Operations: Energy, Climate and Sustainable Development Initiatives at Universities; Springer: Berlin/Heidelberg, Germany, 2018; pp. 701–713. [Google Scholar]
- Luo, Y.; Au, C.H.; Fung, W.S.L. Simulation of Hong Kong green deck with virtual reality for sustainability education. EDULEARN19 Proc. 2019, 1, 5751–5759. [Google Scholar]
- Carlson, S. Colleges Get Greener in Operations, but Teaching Sustainability Declines. Chron. High. Educ. 2008, 55, 1. [Google Scholar]
- Mancini, F.; Clemente, C.; Carbonara, E.; Fraioli, S. Energy and Environmental Retrofitting of the University Building of Orthopaedic and Traumatological Clinic within Sapienza Città Universitaria. Energy Procedia 2017, 126, 195–202. [Google Scholar] [CrossRef]
- Soares, N.; Pereira, L.D.; Ferreira, J.; Conceição, P.; da Silva, P.P. Energy Efficiency of Higher Education Buildings: A Case Study. Int. J. Sustain. High. Educ. 2015, 16, 669–691. [Google Scholar] [CrossRef] [Green Version]
- Abidin, N.I.A.; Zakaria, R.; Pauzi, N.N.M.; Alqaifi, G.N.; Sahamir, S.R.; Shamsudin, S.M. Energy Efficiency Initiatives in a Campus Building. Chem. Eng. Trans. 2017, 56, 1–6. [Google Scholar] [CrossRef]
- Moganadas, S.R.; Nun, S.H.; Subramaniam, S.; Bahaman, A.S. Perspectives of Academic Staff Concerning the Sustainable Development Dimensions of a Malaysian Higher Education Institution. Env. Dev. Sustain. 2022, 24, 13817–13840. [Google Scholar] [CrossRef]
- Alawneh, R.; Jannoud, I.; Rabayah, H.; Ali, H. Developing a Novel Index for Assessing and Managing the Contribution of Sustainable Campuses to Achieve Un Sdgs. Sustainability 2021, 13, 11770. [Google Scholar] [CrossRef]
- Moullin, J.C.; Dickson, K.S.; Stadnick, N.A.; Albers, B.; Nilsen, P.; Broder-Fingert, S.; Mukasa, B.; Aarons, G.A. Ten Recommendations for Using Implementation Frameworks in Research and Practice. Implement. Sci. Commun. 2020, 1, 1–12. [Google Scholar] [CrossRef]
- Firdaus, R.M.; Rasidi, M.H.; Said, I. Components of River Sustainability through Community’s Experiences in Riverside Neighbourhood. Plan. Malays. 2021, 19, 42–51. [Google Scholar] [CrossRef]
- Amini, M.; Bienstock, C.C. Corporate sustainability: An integrative definition and framework to evaluate corporate practice and guide academic research. J. Clean. Prod. 2021, 76, 12–19. [Google Scholar] [CrossRef]
- Leal Filho, W.; Salvia, A.L.; do Paço, A.; Anholon, R.; Gonçalves Quelhas, O.L.; Rampasso, I.S.; Ng, A.; Balogun, A.L.; Kondev, B.; Brandli, L.L. A Comparative Study of Approaches towards Energy Efficiency and Renewable Energy Use at Higher Education Institutions. J. Clean Prod. 2019, 237, 117728. [Google Scholar] [CrossRef]
- Faghihi, V.; Hessami, A.R.; Ford, D.N. Sustainable Campus Improvement Program Design Using Energy Efficiency and Conservation. J. Clean Prod. 2015, 107, 400–409. [Google Scholar] [CrossRef]
- Zhao, H.; Xu, Y.; Hong, W.C.; Liang, Y.; Zou, D. Smart Evaluation of Green Campus Sustainability Considering Energy Utilization. Sustainability 2021, 13, 7653. [Google Scholar] [CrossRef]
- Dade, A. Campus Sustainability Involvement and Opinions: A Survey of Operational Decision Makers and Faculty in the USA. Int. J. Innov. Sustain. Dev. 2013, 7, 400. [Google Scholar] [CrossRef]
- Adenle, Y.A.; Chan, E.H.W.; Sun, Y.; Chau, C.K. Assessing the Relative Importance of Sustainability Indicators for Smart Campuses: A Case of Higher Education Institutions in Nigeria. Environ. Sustain. Indic. 2021, 9, 100092. [Google Scholar] [CrossRef]
- Lee, H.H.Y. Sustainable Campus Development in the Context of a Private Higher Education Institution in Hong Kong, a Case Study at the Hang Seng University of Hong Kong. IOP Conf. Series Earth Environ. Sci. 2019, 290, 012124. [Google Scholar] [CrossRef]
- Al-Ghussain, L.; Darwish Ahmad, A.; Abubaker, A.M.; Mohamed, M.A. An Integrated Photovoltaic/Wind/Biomass and Hybrid Energy Storage Systems towards 100% Renewable Energy Microgrids in University Campuses. Sustain. Energy Technol. Assess. 2021, 46, 101273. [Google Scholar] [CrossRef]
- Muqeet, H.A.; Munir, H.M.; Javed, H.; Shahzad, M.; Jamil, M.; Guerrero, J.M. An Energy Management System of Campus Microgrids: State-of-the-Art and Future Challenges. Energies 2021, 14, 6525. [Google Scholar] [CrossRef]
- Muqeet, H.A.; Javed, H.; Akhter, M.N.; Shahzad, M.; Munir, H.M.; Nadeem, M.U.; Bukhari, S.S.H.; Huba, M. Sustainable Solutions for Advanced Energy Management System of Campus Microgrids: Model Opportunities and Future Challenges. Sensors 2022, 22, 2345. [Google Scholar] [CrossRef]
- Dvorak, V.; Zavrel, V.; Torrens Galdiz, J.I.; Hensen, J.L.M. Simulation-Based Assessment of Data Center Waste Heat Utilization Using Aquifer Thermal Energy Storage of a University Campus. Build. Simul. 2020, 13, 823–836. [Google Scholar] [CrossRef] [Green Version]
- Pansota, M.S.; Javed, H.; Muqeet, H.A.; Khan, H.A.; Ahmed, N.; Nadeem, M.U.; Ahmed, S.U.F.; Sarfraz, A. An Optimal Scheduling and Planning of Campus Microgrid Based on Demand Response and Battery Lifetime. Pak. J. Eng. Technol. 2021, 4, 8–17. [Google Scholar] [CrossRef]
- Khalid, A.; Stevenson, A.; Sarwat, A.I. Overview of Technical Specifications for Grid-Connected Microgrid Battery Energy Storage Systems. IEEE Access 2021, 9, 163554–163593. [Google Scholar] [CrossRef]
- Hapsari, M.A.; Subiyanto, S. Fuzzy AHP Based Optimal Design Building-Attached Photovoltaic System for Academic Campus. Int. J. Photoenergy 2020, 2020, 163554–163593. [Google Scholar] [CrossRef] [Green Version]
- Schreiber, T.; Netsch, C.; Eschweiler, S.; Wang, T.; Storek, T.; Baranski, M.; Müller, D. Application of Data-Driven Methods for Energy System Modelling Demonstrated on an Adaptive Cooling Supply System. Energy 2021, 230, 120894. [Google Scholar] [CrossRef]


| Section 1 | |
|---|---|
| Tell which ESA IPVC community group you belong to: | |
| Students | |
| Teaching and research staff | |
| Administrative, technical and support staff | |
| Section 2 | |
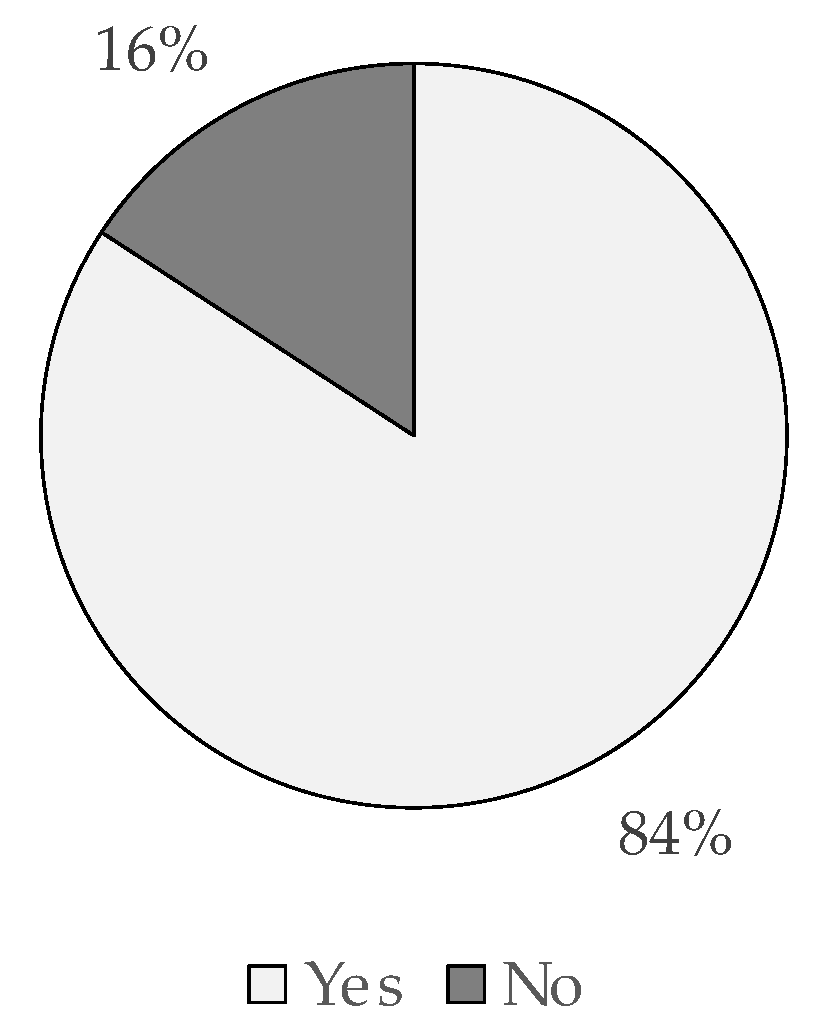
| 1. Are you aware of the efforts undertaken by the IPVC to improve energy efficiency in thedifferent schools? | |
| Yes | |
| No | |
| 2. Do you know that photovoltaic solar panels were installed on the roof of the ESA IPVC residence? | |
| Yes | |
| No | |
| 3. Reducing energy consumption in ESA’s daily activities also depends on changing individual habits. Can you give an example of small practices that can contribute to the reduction of electrical consumption at ESA IPVC? | |
| 4. Within your possibilities, do you have an idea of the importance of your role in reducing ESA IPVC’s electrical consumption? In other words, do you consciously think that you are already doing everything in your power to save energy? | |
| Yes | |
| No | |
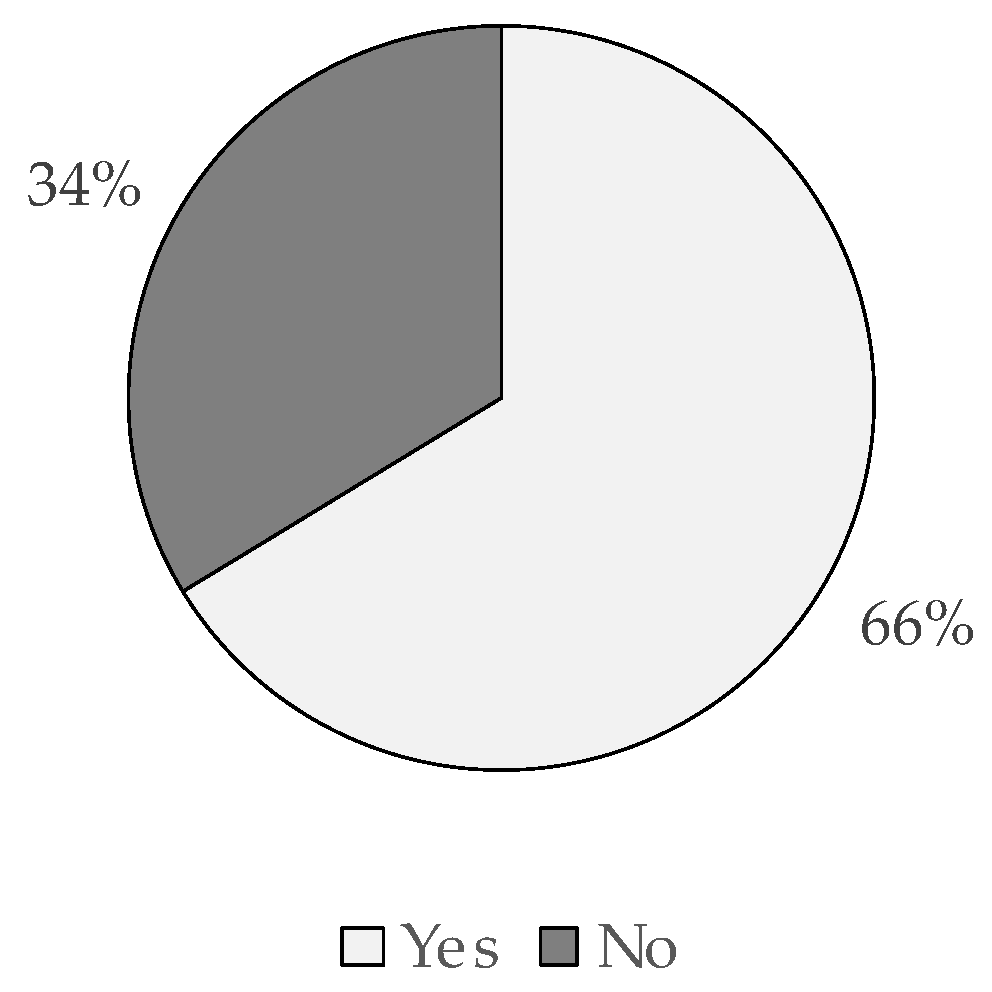
| 5. Do you think that an effort is being made to reduce electricity consumption on the ESA IPVC campus? | |
| Yes | |
| No | |
| 6. Can you give an example of measures that are being implemented at ESA IPVC, to reduce electricity consumption? | |
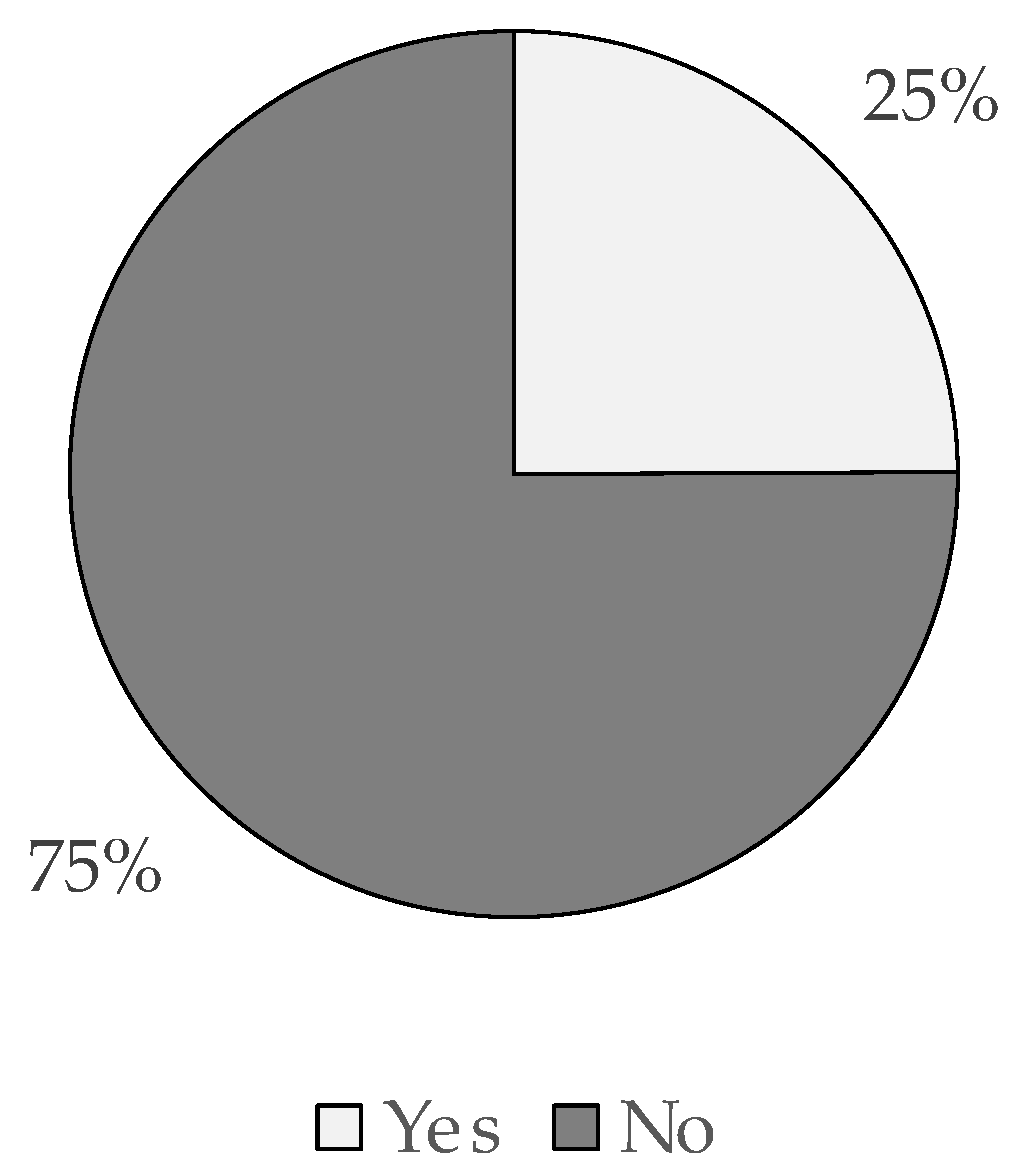
| 7. Do you feel that the set of measures to reduce electricity consumption that is being implemented at ESA IPVC is communicated in the best way? | |
| Yes | |
| No | |
| 8. Do you think it is important that information about energy efficiency measures being implemented at ESA IPVC be communicated to the entire community? | |
| Yes | |
| No | |
| 9. On a scale of 1 to 5 (where 1—Not at all Important and 5—Very Important), how do you rate the need to implement measures to improve energy efficiency at ESA IPVC? | |
| 10. On a scale of 1 to 5 (where 1—Not at all Important and 5—Very Important), how would you rate the quality of the measures that are being implemented to improve energy efficiency at ESA IPVC? | |
| 11. Can you provide an example of an additional measure that you would like to see implemented at ESA IPVC to improve energy efficiency on campus? | |
| 12. Are you willing to play an active role in changing behavioral habits to reduce energy consumption at ESA IPVC? | |
| Yes | |
| No | |
| 13. Would you be willing to give up of some comfort in order to achieve more ambitious carbon footprint reduction goals? | |
| Yes | |
| No | |
| 14. Can you give an example of one of these personal sacrifices for the environment? | |
| 15. Would you be available to integrate an “Awareness Brigade” for issues related to the reduction of energy consumption and energy efficiency? | |
| Yes | |
| No | |
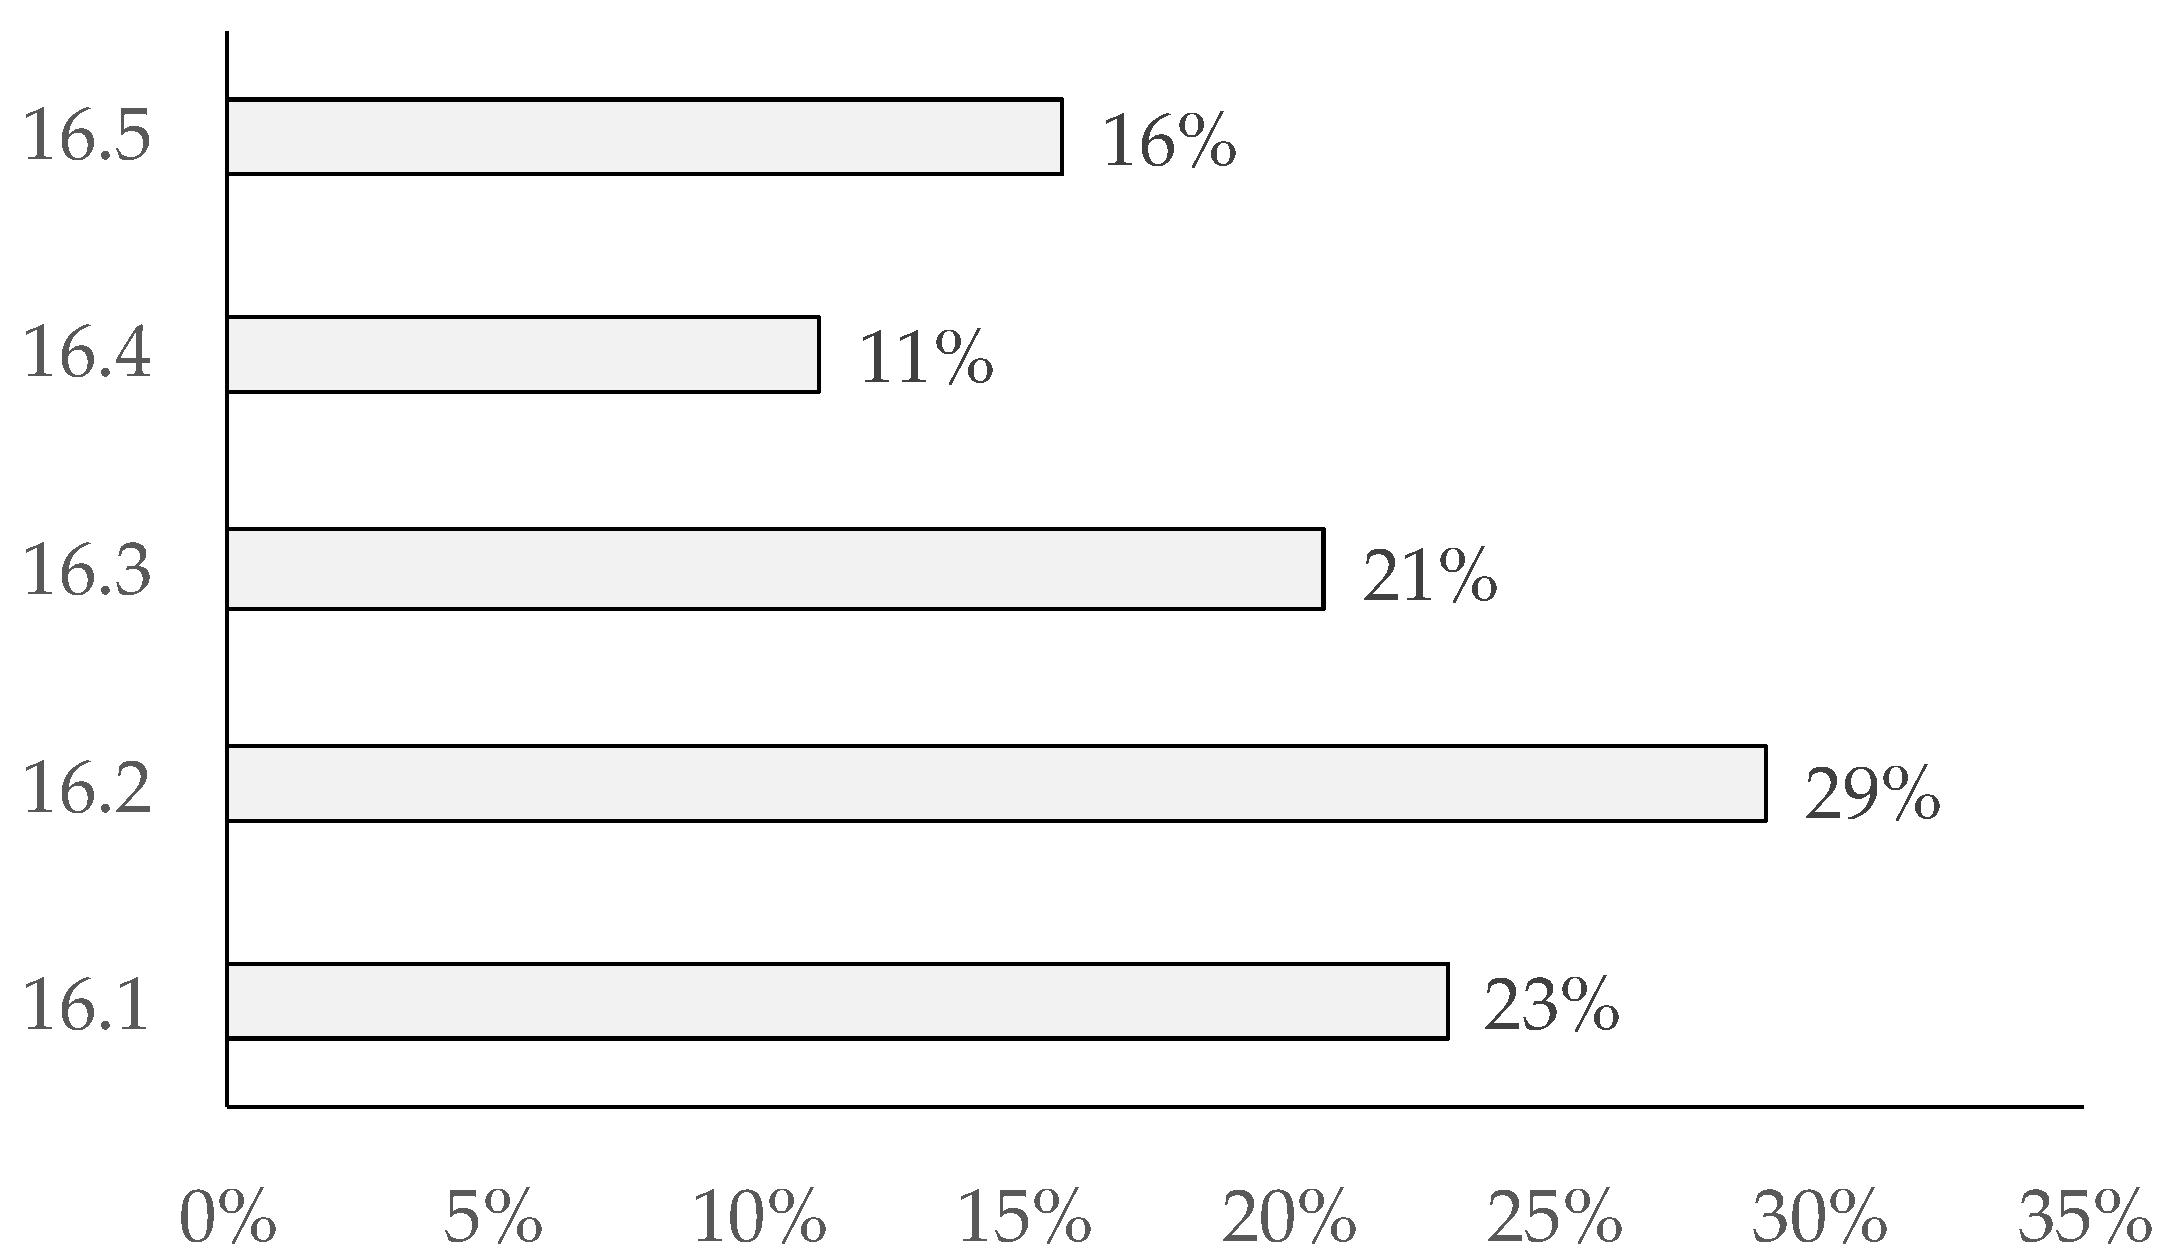
| 16. From the following measures, select the 3 that you most agree with to be additionally implemented at ESA IPVC: | |
| 16.1. Conducting awareness-raising actions for all members of the ESA IPVCcommunity. | |
| 16.2. Installation of motion sensors in passage areas and bathrooms, to turn on the lights only when necessary. | |
| 16.3. Limit the use of elevators only to people with reduced mobility or in situations where volumes are being transported. | |
| 16.4. Limit the use of non-essential electrical equipment on the ESA IPVC campus, such as radios, televisions, heaters, and fan heaters, among others, in the residence rooms, faculty cabinets, and other similar places. | |
| 16.5. Adjust school schedules to make the most of the hours of natural light and to avoid the use of artificial light (whenever the situation allows). | |
| Month | Production (kWh) | Standard Deviation |
|---|---|---|
| Jan | 3247.1 | 806 |
| Feb | 4196.5 | 853.1 |
| Mar | 5773.2 | 1063.2 |
| Apr | 6573.8 | 781.5 |
| May | 7921.3 | 955.9 |
| Jun | 8101.7 | 697.3 |
| Jul | 9025.5 | 614.8 |
| Aug | 8428.7 | 617.9 |
| Sep | 6945.8 | 567.9 |
| Oct | 4873.7 | 833.7 |
| Nov | 3404.3 | 749.4 |
| Dec | 3158.5 | 469.8 |
| Month | Average | Standard Deviation | Model Adjustment | Observation |
|---|---|---|---|---|
| Jan | 3900.3 | 49.2 | 120.1% | Observed Value |
| Feb | 3772.5 | 61.8 | 89.9% | Observed Value |
| Mar | 3642.2 | 71.1 | 63.1% | Observed Value |
| Apr | 5680.3 | 58.6 | 86.4% | Observed Value |
| May | 6962.8 | 87.9% | Estimated Value | |
| Jun | 7121.4 | 87.9% | Estimated Value | |
| Jul | 7933.4 | 87.9% | Estimated Value | |
| Aug | 7408.8 | 87.9% | Estimated Value | |
| Sep | 6105.4 | 87.9% | Estimated Value | |
| Oct | 4284.0 | 87.9% | Estimated Value | |
| Nov | 2992.4 | 87.9% | Estimated Value | |
| Dec | 2530.0 | 48.0 | 80.1% | Observed Value |
| Energy Sources | Energy Sources (%) | Consumption (kWh) | CO2 Emissions (gCO2·kWh−1) |
|---|---|---|---|
| Coal | 35.54% | 111,716.24 | 53,650,605 |
| Fossil CHP | 8.09% | 25,414.55 | 12,205,081 |
| Renewable CHP | 3.97% | 12,482.76 | 5,994,722 |
| Natural Gas | 21.81% | 68,550.42 | 32,920,656 |
| Eolian | 6.93% | 21,792.45 | |
| Other Renewable | 1.45% | 4550.07 | 2,185,126 |
| Hydropower | 16.76% | 52,685.04 | |
| Nuclear | 5.16% | 16,224.60 | |
| MSW | 0.29% | 898.04 | 431,275 |
Disclaimer/Publisher’s Note: The statements, opinions and data contained in all publications are solely those of the individual author(s) and contributor(s) and not of MDPI and/or the editor(s). MDPI and/or the editor(s) disclaim responsibility for any injury to people or property resulting from any ideas, methods, instructions or products referred to in the content. |
© 2023 by the authors. Licensee MDPI, Basel, Switzerland. This article is an open access article distributed under the terms and conditions of the Creative Commons Attribution (CC BY) license (https://creativecommons.org/licenses/by/4.0/).
Share and Cite
Araújo, I.; Nunes, L.J.R.; Curado, A. Preliminary Approach for the Development of Sustainable University Campuses: A Case Study Based on the Mitigation of Greenhouse Gas Emissions. Sustainability 2023, 15, 5518. https://doi.org/10.3390/su15065518
Araújo I, Nunes LJR, Curado A. Preliminary Approach for the Development of Sustainable University Campuses: A Case Study Based on the Mitigation of Greenhouse Gas Emissions. Sustainability. 2023; 15(6):5518. https://doi.org/10.3390/su15065518
Chicago/Turabian StyleAraújo, Ivo, Leonel J. R. Nunes, and António Curado. 2023. "Preliminary Approach for the Development of Sustainable University Campuses: A Case Study Based on the Mitigation of Greenhouse Gas Emissions" Sustainability 15, no. 6: 5518. https://doi.org/10.3390/su15065518