Article

Sustainability of Agriculture: A Study of Digital Groundwater Supervision

1
Institute of Market and Price Research, Academy of Macroeconomic Research, Beijing 100038, China
2
Agricultural Information Institute, Chinese Academy of Agricultural Sciences, Beijing 100081, China
*
Author to whom correspondence should be addressed.
Sustainability 2023, 15(6), 5310; https://doi.org/10.3390/su15065310
Submission received: 1 February 2023 / Revised: 13 March 2023 / Accepted: 14 March 2023 / Published: 16 March 2023
(This article belongs to the Special Issue Industry 4.0, Digitization and Opportunities for Sustainability)

Abstract

:
Groundwater depletion caused by agricultural irrigation is a worldwide problem. Digital technology has the potential to mitigate the groundwater over-exploitation problem by precisely restricting agriculture groundwater withdrawal and borewell construction. This study estimates how farmers respond to a pilot on digital groundwater supervision, which was implemented by the county government to limit the number and clarify property rights of irrigation borewells. By utilizing this recent pilot in rural China, we assess the causal impact of the digital groundwater supervision pilot on farmers’ water-saving irrigation (WSI) behaviors and investigate the heterogeneity effects and mechanisms related to the policy contents. A difference-in-differences (DID) strategy is applied to address the treatment effect of the digital groundwater supervision pilot. The results, which were based on a unique plot-crop-level panel dataset, indicate that farmers reduced water use after the pilot implementation, with most of the responses created through introducing water-saving technology and reducing water use intensity rather than through reducing irrigated acreage. In addition, village supervision, information, and cooperative incentives positively encourage farmers to adopt WSI technologies.

1. Introduction

Irrigation is crucial to farmers’ adaptations to climate change. However, depleted aquifers, due to irrigation extraction, are major concerns globally [1,2,3,4], leading to serious environmental concerns and impacts [5]. For example, long-term groundwater overexploitation for agricultural irrigation has led to a rapid groundwater-table decline in the North China Plain (NCP), which has the largest groundwater drawdown area in the world [6]. Groundwater is a scarce commodity, and it must be used in agriculture judiciously and efficiently to obtain better economic returns without jeopardizing future sustainability [7].
The institutional approach to managing groundwater by arresting the over-exploitation of groundwater and by mitigating environmental consequences is through the implementation of a systematic groundwater monitoring program [8]. However, due to the high cost of supervision, groundwater exploitation has not been effectively monitored. Recently, the supervision of groundwater overdraft was improved, through the development of digital agriculture and the implementation of digital technologies [9]. Digital technology can calculate the water intake by exploring the groundwater level change, and it clearly defines the property rights of the borewells.
Digital innovation has brought stronger government regulatory capacity and reduced regulatory costs of water resource management [10], bringing more possibilities for the improvement of government regulatory efficiency and governance level. In the process of monitoring the total amount of groundwater, digital technology can accurately identify the main body and cause of damage, and it can help the regulatory authority determine the responsible body [11], so that farmers who overexploit groundwater can be expelled from the group, which would also create peer pressure, thus effectively improving environmental management [12].
However, it should be noted that the administrative regulation of the irrigation system may lead to resource mismatch. Even under the most optimal solution, the allocation system may also lead to improper allocation of rights and water resources [13]. Moreover, the relevant research is mainly based on digital groundwater management applications [14] and on the agricultural water rights environment of developed countries [15] such as Europe and the United States [16]. The research on the digital groundwater monitor in developing countries remains insufficient.
The existing literature shows that the effect of policy intervention is usually lower than the expectation because of information friction [17,18]. To this end, some effective behavioral nudges to encourage farmers to save water include education [19], creating a social norm of water-saving in the village [20], and improving farmers’ water-saving awareness [21]. Some scholars have also detected the effect of other external objective conditions [22], social networks [23], social learning [24,25], and farmers’ perceptions [26] on groundwater management. However, few people have studied the relationship between social network and digitalization in the agriculture sector.
In this paper, we present the empirical evidence on the role of digital technology in inducing farmers to save water in the agricultural sector in China by estimating the causal effects of the digital groundwater supervision pilot on farmers’ water-saving behavior in irrigation. Our empirical results show that digital groundwater supervision can effectively improve both the water-saving irrigation (WSI) technology adoption of farmers and their irrigation efficiency. Additionally, social-norm enforcement [27], cooperation, and information [28] are potential factors to affect the implementation of digital technology.
Our analysis makes two contributions to the literature. First, this paper builds and extends the literature on the WSI effects of digital technology in the agricultural sector. We present the first empirical evidence on the impact of digital technology on WSI technology adoption and irrigation arrangements in China. Second, our paper also contributes to the recent literature on the effect of non-financial incentive factors [29] on environmental technology adoption by including a series of variables related to information [30], cooperative incentives, and peer effects within the village.
The present study proceeds in this way: the second section introduces the institutional background of the digital groundwater supervision pilot in rural China. In Section 3, we present the identification strategy and the empirical methodology. Section 4 spells out the data and the variables that we used to testify assumptions underlying causal identification. Estimate results of benchmark, sources of variation, placebo tests, robustness checks, and mechanisms are reported in Section 5. The last two sections include our discussion and conclusions.

2. Institutional Background

Groundwater overexploitation exists in 21 out of 32 provinces in China, covering a total area of nearly 300 thousand square kilometers. In June 2013, the Government of China launched the borewells ban pilot. It requires each province to clarify the property rights of borewells by issuing ownership certificates to borewell owners. However, the rural practice has proved that the groundwater gross control of the borewells ban pilot is not ideal due to the high cost of groundwater supervision. To improve the efficiency of government supervision in groundwater overdraft, since 2015, many provinces of China have introduced digital technology for groundwater supervision. The technologies include digital monitoring devices for borewells, property right confirmation QR codes for borewells, and information systems for borewells management.
At the end of 2014, the Inner Mongolia Autonomous Region put forward the Provincial Implementation Plan of digital groundwater supervision, noting that 14 out of 102 counties were selected as the first batch of pilot counties. In 2015, 33 new counties were added as pilot counties in Inner Mongolia. In 2016, the number of pilot counties in Inner Mongolia reached 62, more than half of its total number of counties. In Hebei Province, 13 out of 172 counties were selected as the digital groundwater supervision pilot counties in 2014. In 2015, another 77 counties started digital supervision. By the end of 2015, there were 90 out of the 172 pilot counties in Hebei Province. In 2016, the number of pilot counties was over 100. The changing process of the digital groundwater supervision pilot of these two provinces is shown in Table 1.
Although the digital groundwater supervision pilot is determined at the county level, the process of pilot promotion varies from one village to another, even in the same county. Specifically, of the five sample counties that we surveyed, three of them are in Inner Mongolia and the remaining two are in Hebei Province. According to our last survey in 2017, all the sample counties were digital groundwater supervision pilot counties, except for Siziwangqi (See Table 2). For those digital groundwater supervision pilot villages, the start year of the pilot is 2015 or 2016. No villages with the pilot year of 2017 are observed in our sample.

3. Methodology

The difference-in-differences (DID) model is a commonly used approach for evaluating policy effect. We use a DID strategy to address the causal relationship between the digital groundwater supervision pilot and farmers’ water-saving behavior. By comparing the evolution of farmers’ WSI technology adoption outcomes of digital groundwater supervision in pilot villages to those in non-pilot villages, we can obtain the treatment effect of the digital groundwater supervision pilot on agricultural water saving. We define the villages that introduce both the borewell ban policy and digital technology as pilot villages of digital supervision. Villages that have implemented the borewell ban policy without introducing digital technology or villages that have not yet implemented the borewell ban policy are considered as non-pilot villages. The baseline equation characterizing the effect of the pilot is as follows:
y i v t = β 0 + β 1 D i g i t a l v + β 2 P o s t t + β 3 D i g i t a l v P o s t t + β 4 X i v t + β 5 X h v t + β 6 X v t + γ t + γ h + ε i v t
where y i v t stands for WSI outcomes of plot i in village v during year t , such as the WSI technology adopted by the household or the irrigation efficiency in this plot. The digital groundwater supervision pilot indicator D i g i t a l v denotes whether village v is the pilot of digital supervision. D i g i t a l v takes the value of 1 for villages that have implemented borewell ban policy assisted by digital technology and 0 otherwise; P o s t t denotes whether year t is before or after digital supervision. Because the pilot starting time is between 2013 and 2016, P o s t t takes the value of 0 in 2007 or 2012 and 1 in 2017; D i g i t a l v P o s t t is the interaction term of D i g i t a l v and P o s t t . This term measures the average treatment effect of the digital groundwater supervision pilot. The estimated coefficient of the average treatment effect, β 3 , is expected to be positive.
Other control variables include: plot attributes X i v t , such as plot topography, soil type, fertility, acreage, average production cost, and average irrigation cost for plot i in village v during the calendar year t [31]; household-level factors X h v t , such as household demographics; village-level factors X v t , such as the village infrastructure and the training of WSI for farmers; the year fixed effect γ t , the household fixed effects γ h , and the error term ε i v t . We assume that the selection of digital groundwater supervision pilot was quasi-random when controlling household fixed effects and year fixed effects.
Motivated by theoretical models of technology adoption [32], we particularly investigate two mechanisms that might underlie the impact of digital groundwater supervision on farmers’ water-saving behavior. We include these factors in M i v t —the number of newly built borewells, and the property structure of borewells. We use the following equation for mechanisms:
y i v t = θ + θ 1 D i g i t a l + θ 2 P o s t t + θ 3 D i g i t a l v P o s t t + θ 4 M i v t + θ 5 M i v t D i g i t a l v P o s t t + θ 6 X i v t + θ 7 X h v t + θ 8 X v t + γ t + γ h + ε i v t
We will examine the two mechanisms separately in the empirical analysis. The interaction terms between P o l i c y v P o s t t D i g i t a l v and M i v t capture the mechanisms of the impact of digital groundwater supervision pilot on WSI, while θ 5 remains inconclusive in the existing literature. The definition of other terms is the same as that in Equation (1). Since the time of implementing the digital groundwater supervision pilot was determined at the village level, we cluster the standard errors at the village level in all regressions. Given the potential for within-group correlation of residuals, we adjust all standard errors for potential clustering.

4. Data

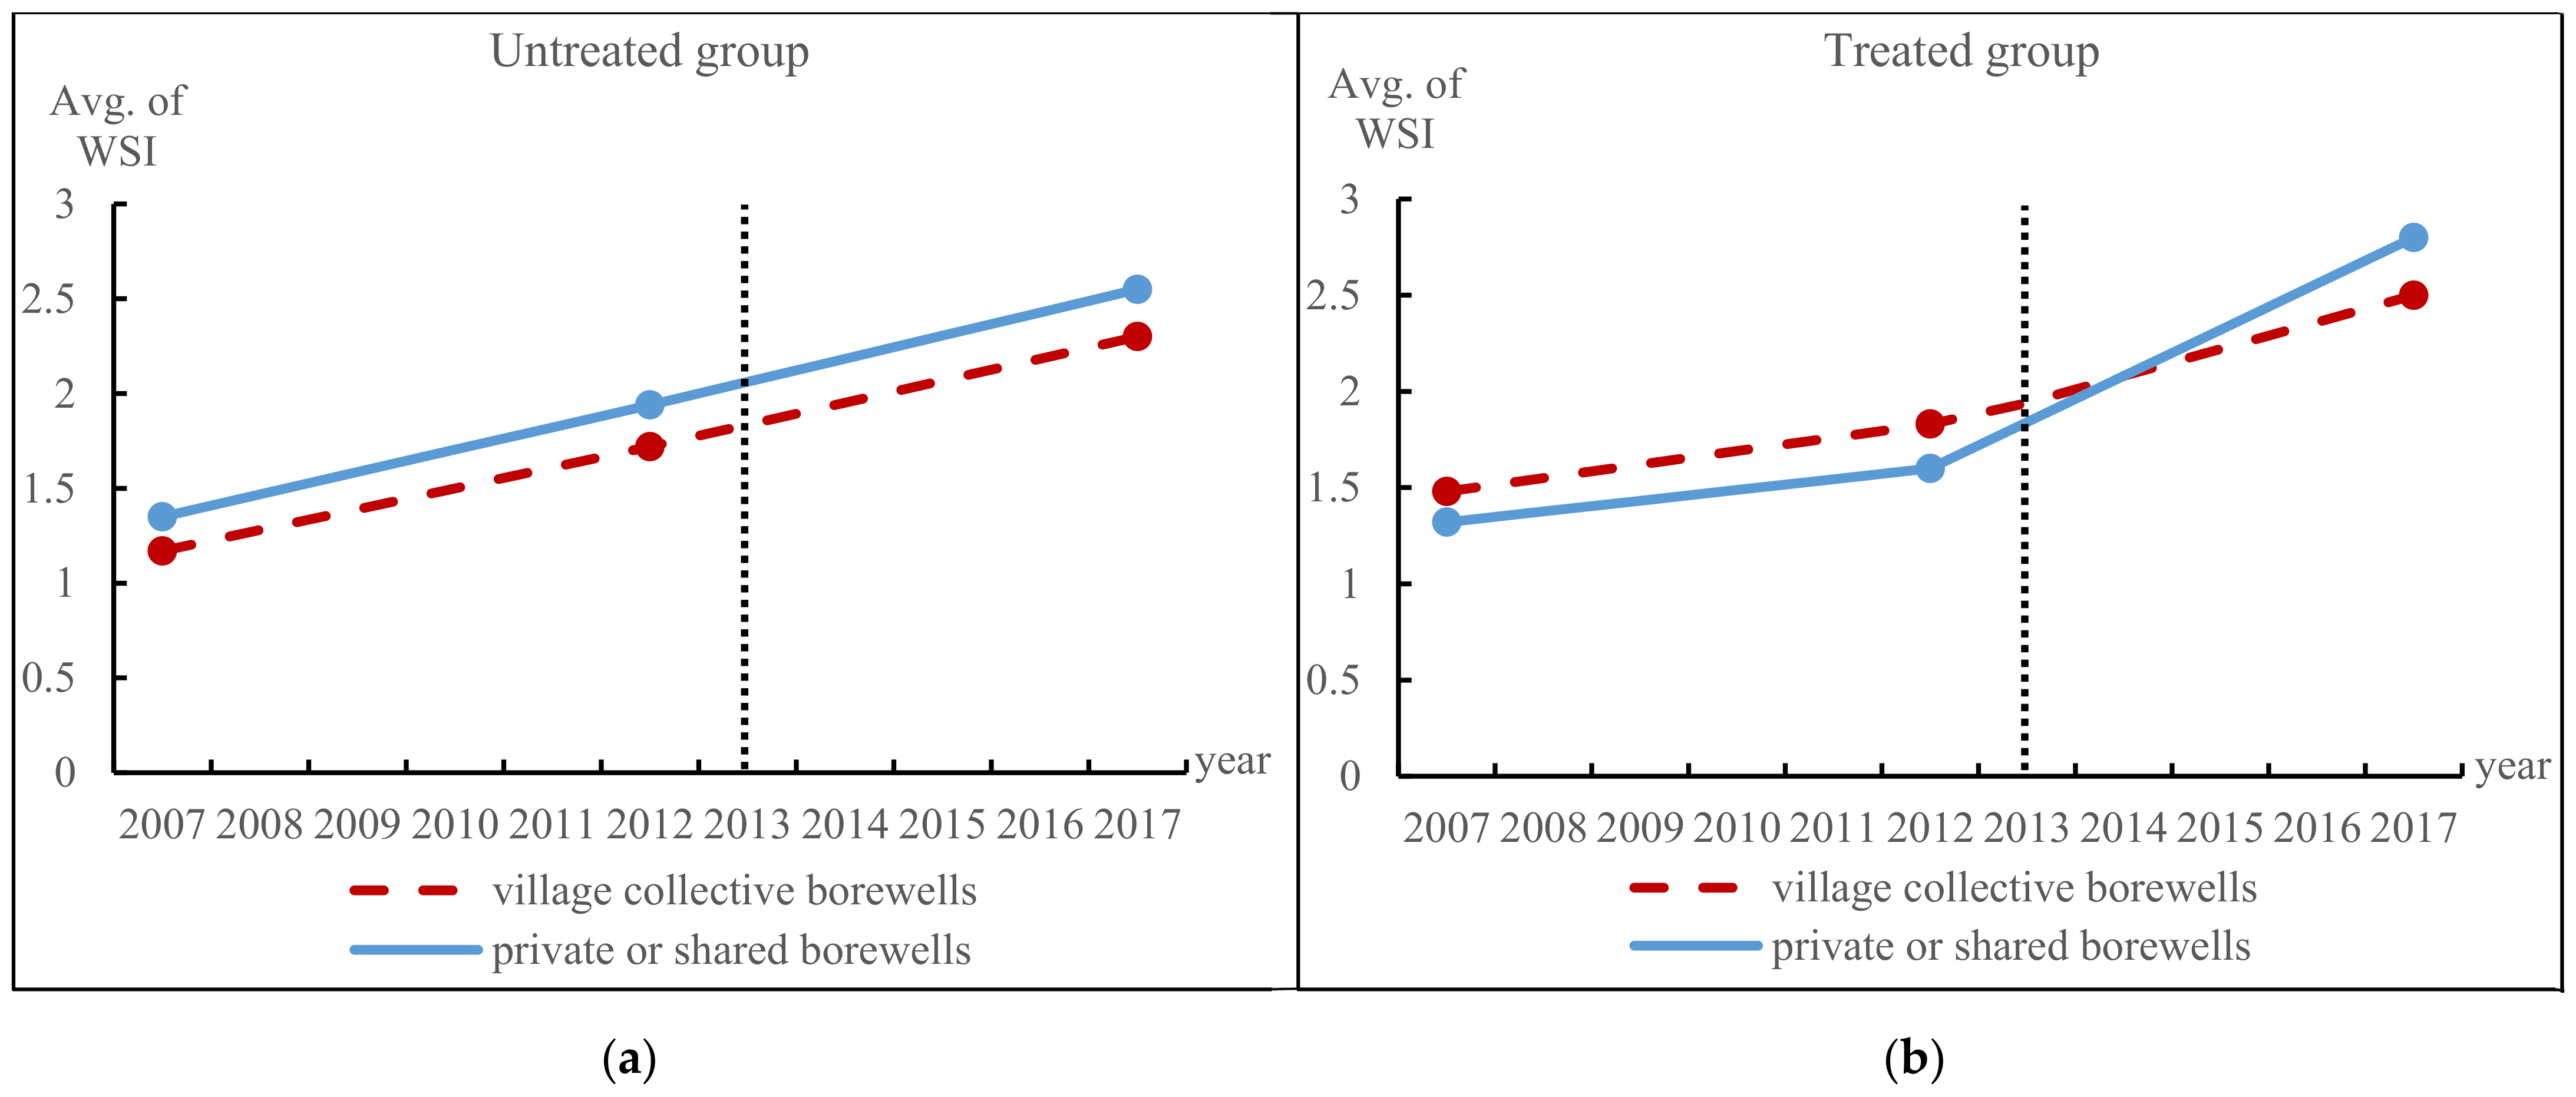
4.1. Data Source and Descriptive Statistics

Using the three-round micro survey data collected in 2007, 2012, and 2017, we analyze the way in which the digital groundwater supervision pilot improved farmers’ adoption of WSI technology decisions in China. The sample areas in this study are located in the potato production areas, and they are good representatives of the major potato-growing areas in northern China. Unlike the dryland crops that are commonly planted in north China, the potato needs a large amount of irrigation water during its growing period. It is one of the most water-consuming crops suitable for growing in north China; thus, the large-scale planting of potatoes significantly aggravates the problem of groundwater overdraft of the NCP. The samples in this paper not only represent the production and the irrigation behavior of farmers in groundwater overdraft areas, but the samples are also of great significance in studying the effect of digital supervision on farmers’ WSI. We selected three cities with large potato economies in the sample provinces, and then we randomly selected five counties with a large potato planting scale. Next, we randomly choose 10 villages from each county. Finally, we randomly selected 10 to 15 households from each village. The questionnaire includes basic information about the farmers, cultivated land resources, potato production, irrigation behavior, village social norms, and government supports (such as agricultural training).
A total of 311 potato growers from 50 different villages were studied. For each household, we investigated the production information of its two largest plots in the last planting season of the data collection year. To do this, we built a balanced plot-level panel data with the three phases of 311 households to measure the irrigating behavior of farmers before and after digital supervision was implemented. We obtained a panel in 2007, 2012, and 2017, including 622 plots. Second, we studied the water-saving effect of digital supervision. If farmers had always been cultivated on drought plots or had transferred irrigation to drought plot cultivation after digital supervision, we assumed that their water input became zero and that they no longer needed to uptake WSI technology. Therefore, compared with them, we paid more attention to the WSI of irrigated plots or of transferred-to-irrigated plots. The summary statistics of the irrigated plots sample are in Table 3.

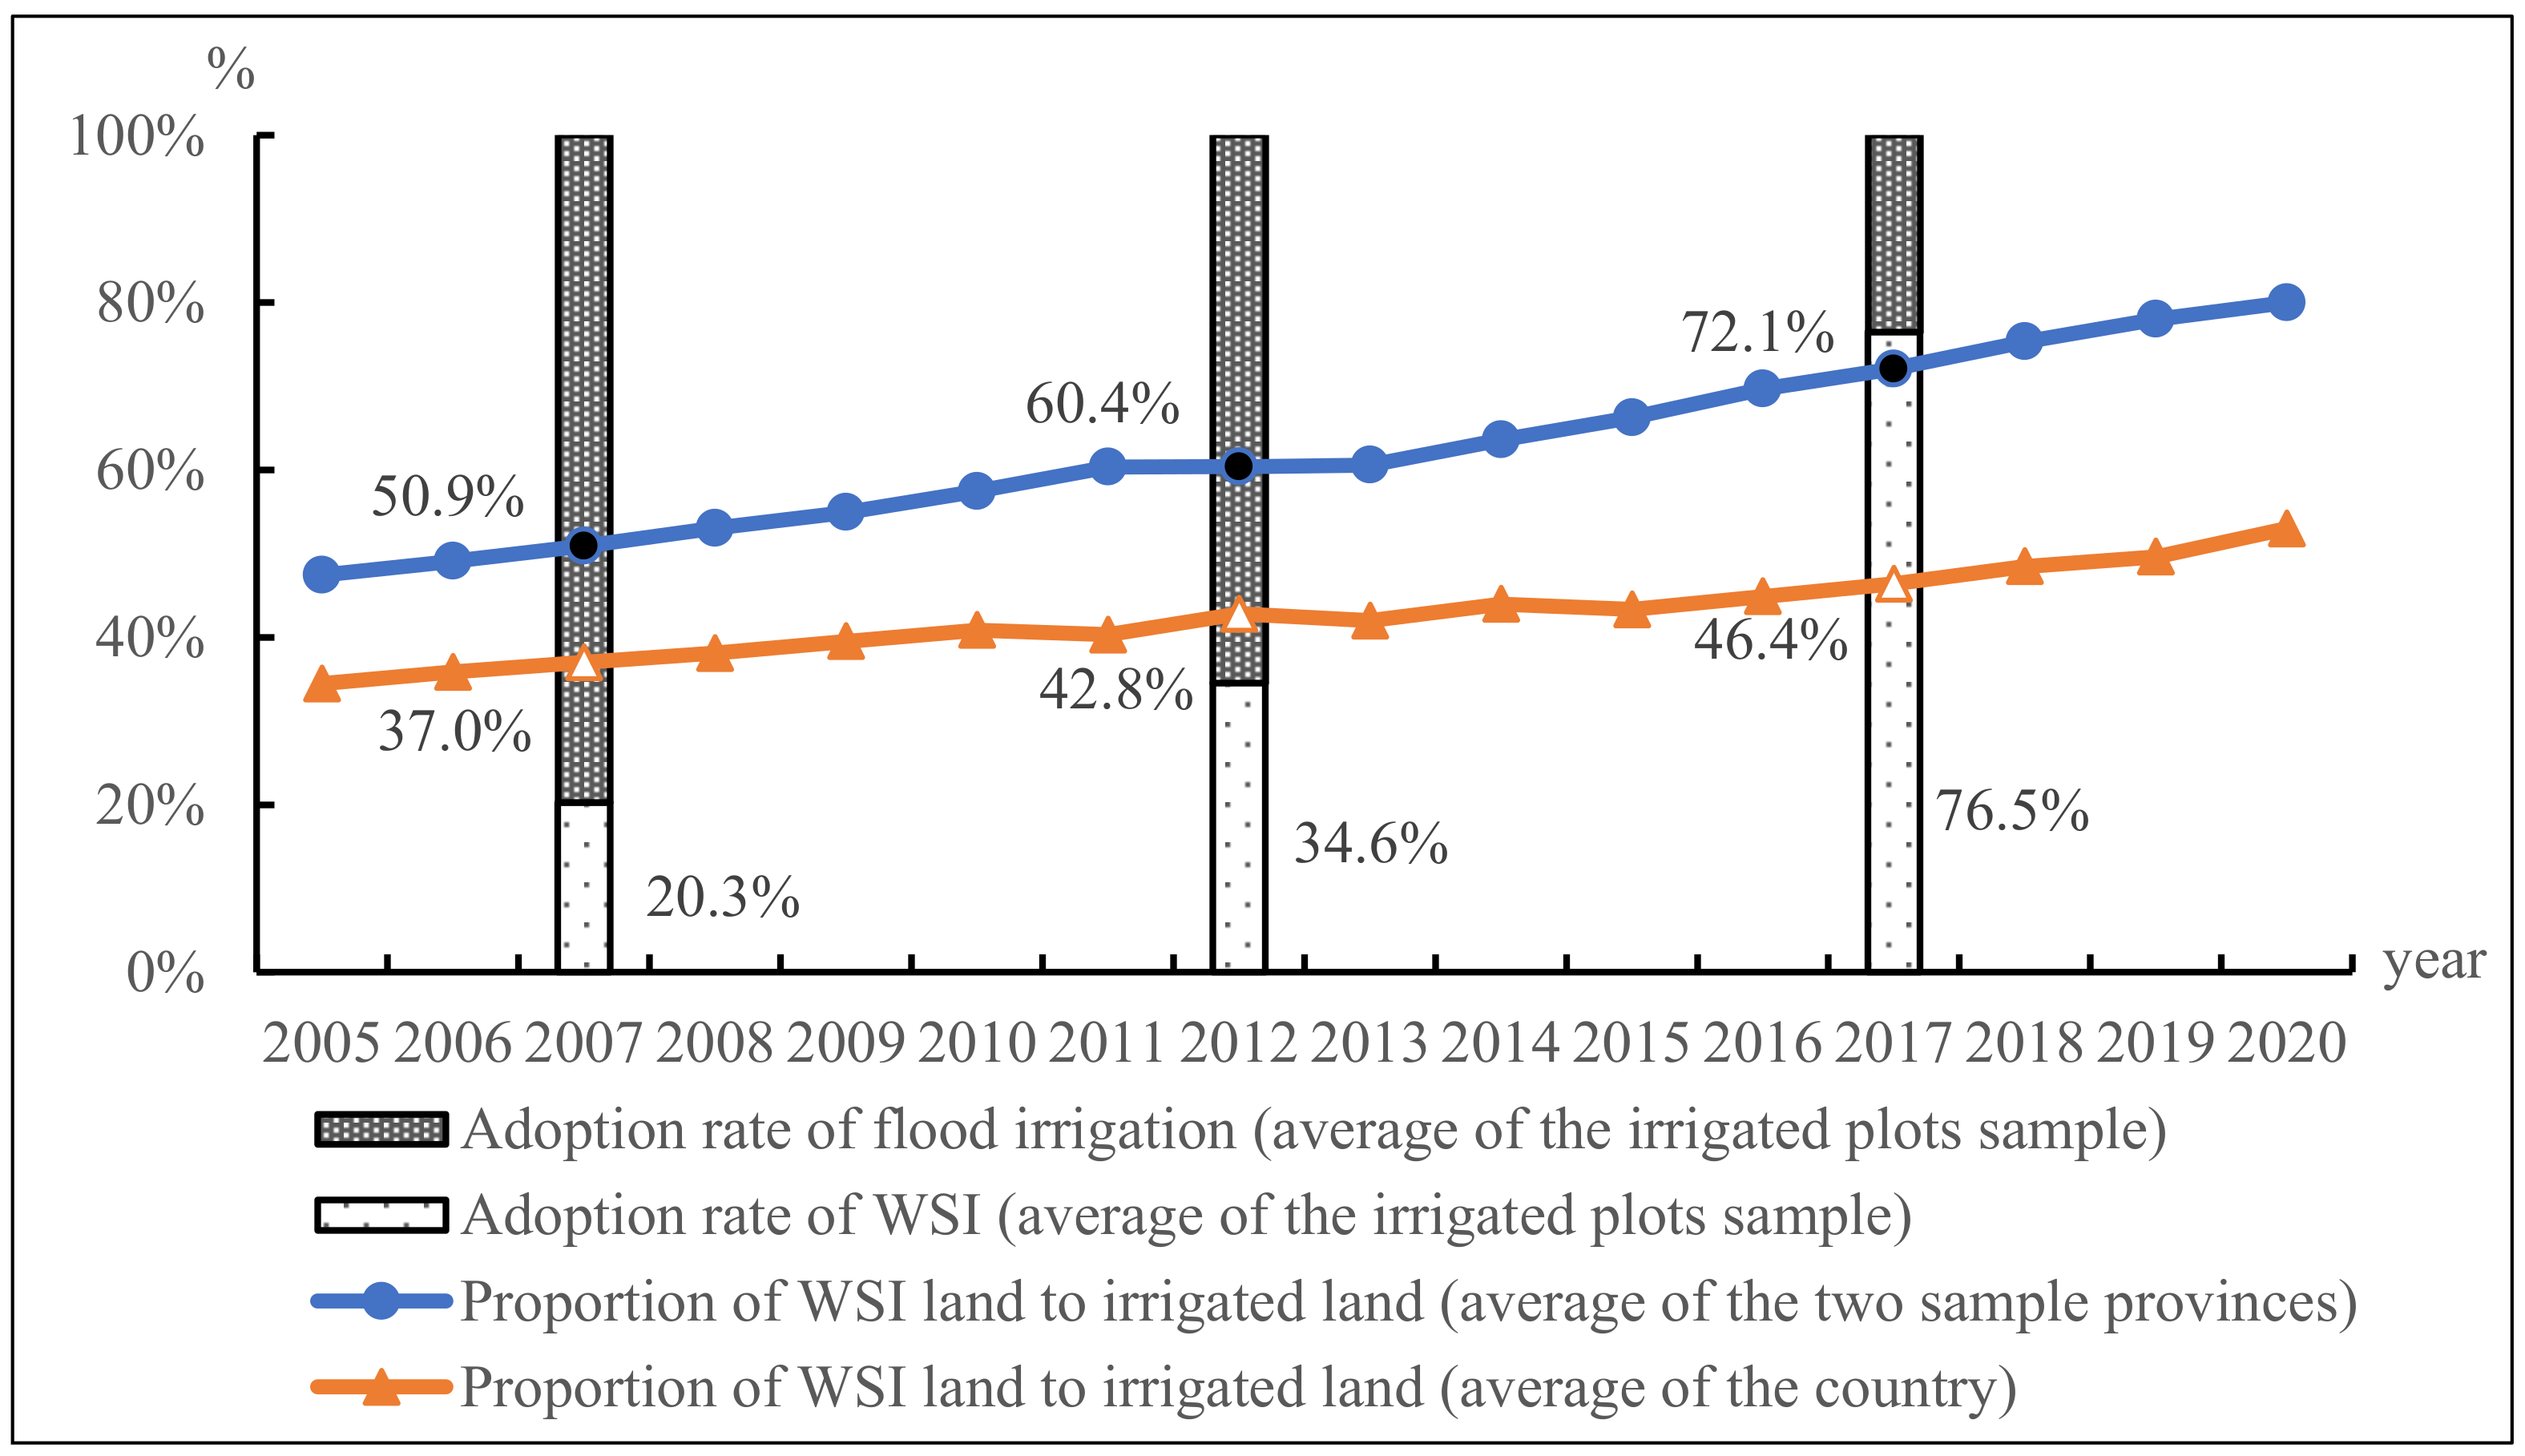
4.2. Trends in the Adoption of WSI Technologies

Due to the digital groundwater supervision pilot implementation, as well as the green agricultural technology development, the proportion of the WSI area has gradually increased. The two trend lines in Figure 1 show the increase in WSI land proportion from 2005 to 2020. The orange line shows the national level average, and the blue one is the average of the two sample provinces. The average proportion of WSI technology adoption of our sample plots is shown in the histograms. In the sample of our micro survey data, from 2007 to 2017, the percentage of plots with WSI among all the plots increased from 20.3% to 76.5%. The rising trend of the WSI adoption rate in our sample data is similar to the macro data. Both the macro data and the micro survey data show that the proportion of WSI is increasing steadily.
The DID empirical strategy requires that unobserved shocks be uniform across the treated and untreated groups, and the two groups diverge from a common trend only because of the intervention. Figure 2a,b report the parallel trends of WSI in untreated and treated villages, respectively. The dotted vertical lines in the figures mark the year 2013 when digital supervision was first proposed. The sample years are divided into the pre-pilot period (2007 and 2012) and the pilot period (2017). We observe a common trend in Figure 2a between the subgroups of borewell owners (farmers with private or shared borewells) and non-borewell owners (farmers who use village collective borewells) in the untreated villages; that is, their WSI changes before and after the pilot are similar. Figure 2b shows the result of the treated villages. Both borewell owners and non-borewell owners had an increasing tendency of adopting WSI technology after the digital supervision pilot started.

5. Results

5.1. Benchmark

In this section, we study the effects of digital technology on the WSI behavior of farmers by presenting an identification strategy of difference-in-differences. We introduce the quasi-randomly assigned digital groundwater supervision treatment to identify how digital technology would affect different groups of farmers who face the heterogeneity intensity of borewells’ ban from the government.
Table 4 demonstrates that digital technology significantly improves the WSI behavior of farmers from the pilot areas of the borewells’ ban. Specifically, digital technology does not encourage farmers to transfer drought plots to irrigated plots (Column 1). It has a significant positive effect on farmers’ adoption of advanced WSI technology, such as micro spray irrigation or drip irrigation (Columns 3 and 4). Benchmark results indicate that digital technology plays an important role in sustainable agriculture as it improves farmers’ WSI behavior.

5.2. Placebo Tests

To illustrate that the results of this paper are not accidental, we performed two kinds of placebo tests. First, we tested the authenticity of the common trend assumption that there are no significant difference in the growth trend of the WSI technology adoption rate between the treated group and the untreated groups before the treatment starts. To exclude the possible effects of confounders, we assumed that digital technology was introduced between 2007 and 2012. We constructed a fake pilot starting dummy, F a k e P o s t t , that equaled 1 if the sample year was 2017, and 0 if otherwise. Then, we repeated the DID estimation. Table 5 reports the DID estimation results under the fictitious digital groundwater supervision pilot starting time. Columns (1)–(5) show no significant coefficient of the average treatment effect. The results prove that before the digital groundwater supervision pilot started, there were no significant differences in the WSI technology adoption rate between the treated group and the untreated group.
Second, to test whether the benchmark results are driven by accidental factors, we introduce a Monte Carlo simulation to conduct a placebo test by randomly generating 20 treatment villages, and we re-estimated Columns 1–4 in Table 5 by using the randomly generated treated and untreated villages. We repeated the above steps 1000 times, and we calculated the t value each time [33]. Figure 3 shows the kernel density distribution of the t values of the average treatment effects interaction outcomes. It shows that the probability of t = 0 is high when the treated villages of digital supervision are randomly selected.

5.3. Robustness Checks

To further increase our confidence in the estimation, we conducted robustness checks based on the benchmark DID model. We introduced two alternative measurements of WSI, water consumption and irrigation efficiency to check whether digital supervision finally leads to water consumption reduction or to water efficiency improvement.
‘Quantity’ denotes the average water consumption in plot i in the year t . It is the quotient of irrigation water consumption (m3) in the last production season and the acreage (mu) of plot i . Less irrigation water consumption indicates a better effect of WSI. ‘Efficiency’ is a variable that denotes water intensity (per acre) with the same potato yield. Specifically, it is the quotient of potato yields (kg) in the last production season and of water consumption (m3) of plot i . A higher value of this variable indicates that irrigation efficiency is also higher because less water is used to produce the same number of potatoes.
Table 6 reports the estimates based on these two alternative measurements. As can be seen in Column 1, farmers are affected by digital supervision and make great contributions to the reduction in irrigation water consumption. Then, we discuss the effect of digital supervision on irrigation efficiency improvement in Column 2. The result shows that farmers in digital groundwater supervision pilot areas have a strong tendency to increase their irrigation efficiency.

5.4. Heterogeneous Analysis

Under the same digital supervision pilot implementation background, the WSI effects of different individual groups may be heterogeneous. We conduct sub-sample regressions to test the heterogeneous effects of the treatment. First, we divided the individuals into two groups according to the level of village enforcement. We introduced ‘Punishment’, a self-reported variable to reflect whether the village would impose punishment on farmers if they did not participate in collective activities related to irrigation. The range of the punishment level in the sample is 1 to 5. Here, 5 represents ‘surely will’, 4 ‘probably will’, 3 ‘neutral’, 4 ‘probably not’, and 1 ‘definitely not.’ Panel A of Table 7 reports the estimation results within different punishment level groups. According to the results, the pilot has a significant negative effect on the water consumption of both the high punishment group (‘Punishment’ = 4 or 5) and the low punishment group (‘Punishment’ = 1, 2 or 3). Referring to the WSI technology adoption effect, the high punishment group is more affected by digital technology, as compared to the low punishment group. The results in Panel A indicate that public supervision or punishment is a source of variation of digital supervision on improving WSI.
Second, we divided the individuals into two groups according to the level of village cooperation. We introduced ‘Cooperation’, a self-reported variable to reflect whether the villagers would help each other in irrigation and water conservancy construction. The range of the cooperation level in the sample is 1 to 5. Here, 5 represents ‘surely will’, 4 ‘probably will’, 3 ‘neutral’, 4 ‘probably not’, and 1 ‘definitely not’. The heterogeneous analysis results of the cooperation are reported in Panel B of Table 7. For the high cooperation group (‘Cooperation’ = 4 or 5), the digital groundwater supervision pilot significantly improves farmers’ WSI behavior. However, the digital groundwater supervision pilot has little impact on the WSI technology adoption behavior of the low cooperation group (‘Cooperation’ = 1, 2 or 3).
Third, we divided the individuals into two groups according to farmers’ access to information. We introduced ‘Information’, a self-reported variable to reflect whether the farmers would obtain information related to irrigation in a timely manner. The range of the information unblocked level in the sample is 1 to 5. Here, 5 represents ‘surely will’, 4 ‘probably will’, 3 ‘neutral’, 4 ‘probably not’, and 1 ‘definitely not’. The heterogeneous analysis results of information acquisition are reported in Panel C of Table 7. For the group with sufficient irrigation information (‘Information’ = 4 or 5), the digital groundwater supervision pilot significantly improves farmers’ WSI behavior. However, the digital groundwater supervision pilot has little impact on the WSI technology adoption behavior of the insufficient information group (‘Information’ = 1, 2 or 3). The results of the heterogeneity analysis show that the WSI effect of the digital groundwater supervision pilot is more significant in areas with strong collective punishment, high cooperation, and sufficient information.

5.5. Mechanisms

So far, our analysis is still unable to establish the exact causal mechanisms underlying farmers’ WSI behavior changes. In this section, we examine several mechanisms through which digital supervision may affect farmers’ adoption of WSI. We examine whether digital supervision has a significant impact on the two core contents of the borewell ban policy, namely, prohibiting the construction of borewells and clarifying the property right of borewells. We separately test the mechanisms with potential variables related to borewells regulation, such as the number of new irrigation borewells at the village level and the clarification of borewells property right at the village level.
The results of the mechanisms are reported in Table 8. First, Columns 1 and 2 reveal the borewells’ restriction effect of the digital groundwater supervision pilot of the village. ‘Newwell’ is a variable to reflect whether the number of borewells at the village level has been restricted. ‘Newwell’ equals 1 if there were no newly constructed borewells in the village after the pilot, and 0 if otherwise. As can be seen in Columns 1 and 2, it acts as a significant mechanism of the benchmark, and the restriction of borewell construction would improve farmers’ WSI behavior. In other words, the digital groundwater supervision pilot encouraged farmers to adopt WSI technology and to reduce water consumption by limiting the growth of the number of irrigation borewells.
Second, Columns 3 and 4 present the mechanisms of borewell property right clarification in the water-saving effects of digital supervision. ‘Property’ is a variable to reflect the property right of borewells. Here, 3 represents ‘private borewell’, 2 ‘shared borewell’, and 1 ‘collective borewell.’ The estimation results in Column 3 show that the clarification of the borewell property right acts as a mechanism for the positive effect of digital supervision on farmers’ adoption of WSI technology. In Column 4, the coefficient of the interaction of property right and ATE is negatively significant, indicating that the clarification of borewell property rights is the mechanism of digital supervision affecting farmers’ water consumption reduction.

6. Discussion

There is a major impetus for digital agriculture development around the world. Much is expected from the development of sophisticated digital technology to improve the economic efficiency of water usage or allocation. While there are ongoing academic debates on the role of strengthening regulation in promoting agricultural water conservation, seldom has previous research systematically studied the impact of introducing a groundwater regulation policy with digital supervision technology.
It has been the purpose of this paper to introduce the difference-in-differences approach for the policy evaluation of digital supervision technology in groundwater regulation, as well as the water-saving behavior of farmers. We focus on the outcomes of digital supervision in North China by analyzing the farmers’ adoption of WSI technology. We find that the digital groundwater supervision pilot can lead to farmers’ water-saving behavior, and that the outcomes are heterogeneous in different groups with different social norms or social cultures. Sources of variation tests show that the benchmark results in this paper are mainly driven by farmers in villages with strong collective punishment, high collective cooperation, and sufficient information. Thus, digital supervision policies designed to encourage WSI technology adoption should also pay attention to those norm-based interventions. The government can play an important role in providing message incentives for farmers in areas where information friction exists.
Moreover, the implementation of the digital groundwater supervision pilot leads to the reduction in water consumption and to the improvement of irrigation efficiency. While many important aspects of the problem (such as alternative variables, uncertainty, and political factors) have been ignored, the analysis results seem to be quite robust. We also show that the impact of digital groundwater supervision is mostly caused through factors that come from the contents of the borewell ban policy, such as restrictions on the growth of the number of borewells and clarification of the borewells property right. This result is consistent with the discussion on the effect of water rights [34] or property rights [35] on irrigation resource conservation in the existing literature.
There have been many studies on the factors that determine farmers’ water-saving behaviors in irrigation, such as external climatic conditions [36], perceptions of potential benefits or risks of adoption [37], and farmers’ attributes, such as education, gender, economic incentives shaped by pricing [38,39,40], and governance [41]. The effect of digital technology on farmers’ water-saving behavior has not been fully discussed, partly because digital technology is still very new in agriculture for resource management [42]. This study provides empirical evidence for the water conservation effect of digital technology used in the groundwater supervision system. While the application in this paper is specific to groundwater depletion, similar theoretical and empirical solutions may also exist to stream depletion [36], water pollution [43], and carbon market [44].
We hope that the heterogeneous analysis of social norms will contribute to the conversation between rational choice theorists and the literature on pro-social behavior theory in behavioral economics, according to which social actors make decisions through automatic processes informed by values and beliefs as much as through rational process [31]. Additionally, in the context of social networks, future studies could examine the effect of reputation incentives rather than collective punishment on farmers’ pro-social behavior.
Although this study has analyzed the causal effect of digital groundwater supervision on farmers’ WSI behavior and detected mechanisms in detail, there are still certain limitations in this study. Due to the constraints of the micro survey data, we are not able to observe the effect of the digital groundwater supervision pilot in the last five years. The three-round survey data also limits us in the investigation of the long-term effect of the pilot by using dynamic models. Future studies are expected to provide more evidence about the impact of digital agriculture in other forms or from other regions.

7. Conclusions

To conclude, we found that digital supervision leads to farmers’ behavior in adopting WSI technology, reducing water consumption, and improving irrigation efficiency, thus achieving its goal to save irrigation water in agriculture. Our estimates are relevant to ongoing water policy discussions. However, many experiences in developing countries have proved that WSI technology promotion does not necessarily lead to irrigation efficiency. Farmers’ education level and whether they can use the advanced facilities correctly also affect irrigation efficiency. The adoption of techniques to improve water productivity will, therefore, require an enabling policy and an institutional environment that aligns the incentives of producers, resource managers, and society, and that provides a mechanism for dealing with trade-offs. Further evaluations of water quantity and water efficiency will lead to a deeper understanding of the problems of water-related policies and digital technology applications in groundwater regulation.

Author Contributions

J.Z. contributed to the conception of the study and drafted the paper; X.Z. processed the data, conducted the analysis and finished the manuscript; J.G. helped review and improve the manuscript with constructive discussions. All authors have read and agreed to the published version of the manuscript.

Funding

This research was funded by the National Natural Science Foundation of China (No. 72073151), National Natural Science Foundation of China Youth Program (No. 71603306), and Beijing Social Science Foundation (No. 21JJA002).

Institutional Review Board Statement

Ethical review and approval were waived for this study because the data are from survey or government statistics and do not involve field experiments.

Informed Consent Statement

Informed consent was obtained from all subjects involved in the study.

Data Availability Statement

The data were collected through micro survey from the Hebei Province and Inner Mongolia Autonomous Region survey and the government statistical data of the rural households in the years 2007, 2012, and 2017.

Acknowledgments

We would like to thank Li Bin for his valuable suggestions for the article. We are also thankful for the insightful comments raised by anonymous reviewers and the academic editor, who helped to improve this paper.

Conflicts of Interest

The authors declare no conflict of interest.

References

  1. Drysdale, K.M.; Hendricks, N.P. Adaptation to an irrigation water restriction imposed through local governance. J. Environ. Econ. Manag. 2018, 91, 150–165. [Google Scholar] [CrossRef]
  2. Famiglietti, J.S. The global groundwater crisis. Nat. Clim. Change 2014, 4, 945–948. [Google Scholar] [CrossRef] [Green Version]
  3. Emami, F.; Koch, M. Agricultural water productivity-based hydro-economic modeling for optimal crop pattern and water resources planning in the Zarrine River Basin, Iran, in the wake of climate change. Sustainability 2018, 10, 3953. [Google Scholar] [CrossRef] [Green Version]
  4. Msangi, S.; Cline, S.A. Improving groundwater management for Indian agriculture: Assessing tradeoffs across policy instruments. Water Econ. Policy 2016, 2, 752–756. [Google Scholar] [CrossRef]
  5. Guo, Y.; Gan, F.; Yan, B.; Bai, J.; Wang, F.; Jiang, R.; Xing, N.; Liu, Q. Evaluation of groundwater storage depletion using grace/grace follow-on data with land surface models and its driving factors in Haihe river basin, China. Sustainability 2022, 14, 1108. [Google Scholar] [CrossRef]
  6. Chen, X.; Wang, P.; Muhammad, T.; Xu, Z.; Li, Y. Subsystem-level groundwater footprint assessment in North China Plain—The world’s largest groundwater depression cone. Ecol. Indic. 2020, 117, 106662. [Google Scholar] [CrossRef]
  7. Asadi, E.; Isazadeh, M.; Samadianfard, S.; Ramli, M.F.; Mosavi, A.; Nabipour, N.; Shamshirband, S.; Hajnal, E.; Chau, K.W. Groundwater quality assessment for sustainable drinking and irrigation. Sustainability 2020, 12, 177. [Google Scholar] [CrossRef] [Green Version]
  8. Aadil, N.; Adrian, G.; Shakeel, A. Optimization of a groundwater monitoring network for a sustainable development of the Maheshwaram Catchment, India. Sustainability 2011, 3, 396–409. [Google Scholar]
  9. Mushi, G.E.; Serugendo, G.D.M.; Burgi, P.Y. Digital technology and services for sustainable agriculture in Tanzania: A literature review. Sustainability 2022, 14, 2415. [Google Scholar] [CrossRef]
  10. Fleming, A.; Jakku, E.; Fielke, S.; Taylor, B.M.; Lacey, J.; Terhorst, A.; Stitzlein, C. Foresighting Australian digital agricultural futures: Applying responsible innovation thinking to anticipate research and development impact under different scenarios. Agric. Syst. 2021, 190, 103120. [Google Scholar] [CrossRef]
  11. Liu, Q.; Yang, L.; Yang, M. Digitalisation for water sustainability: Barriers to implementing circular economy in smart water management. Sustainability 2021, 13, 11868. [Google Scholar] [CrossRef]
  12. Leslie, J.E.; Weersink, A.; Yang, W.; Fox, G. Actual versus environmentally recommended fertilizer application rates: Implications for water quality and policy. Agric. Ecosyst. Environ. 2017, 240, 109–120. [Google Scholar] [CrossRef]
  13. Li, M.; Xu, W.; Zhu, T. Agricultural water allocation under uncertainty: Redistribution of water shortage risk. Am. J. Agric. Econ. 2019, 101, 134–153. [Google Scholar] [CrossRef]
  14. Seo, S.; Segarra, E.; Mitchell, P.D.; Leatham, D.J. Irrigation technology adoption and its implication for water conservation in the texas high plains: A real options approach. Agric. Econ. 2010, 38, 47–55. [Google Scholar] [CrossRef]
  15. Perino, G.; Requate, T. Does more stringent environmental regulation induce or reduce technology adoption? When the rate of technology adoption is inverted U-shaped. J. Environ. Econ. Manag. 2012, 64, 456–467. [Google Scholar] [CrossRef] [Green Version]
  16. Raffensperger, J.F. Matching users’ rights to available groundwater. Ecol. Econ. 2011, 70, 1041–1050. [Google Scholar] [CrossRef]
  17. Emerick, K.; Dar, M.H. Farmer field days and demonstrator selection for increasing technology adoption. Rev. Econ. Stat. 2021, 103, 680–693. [Google Scholar] [CrossRef]
  18. Emerick, K.; de Janvry, S.E.A.; Manzoor, H.D. Technological innovations, downside risk, and the modernization of agriculture. Am. Econ. Rev. 2016, 106, 1537–1561. [Google Scholar] [CrossRef] [Green Version]
  19. Espinosa-Goded, M.; Barreiro-Hurlé, J.; Ruto, E. What do farmers want from agrienvironmental scheme design? A choice experiment approach. J. Agric. Econ. 2010, 61, 259–273. [Google Scholar] [CrossRef]
  20. Farrow, K.; Gilles, G.; Lisette, I. Social norms and pro-environmental behavior: A review of the evidence. Ecol. Econ. 2017, 140, 1–13. [Google Scholar] [CrossRef]
  21. Lal, A.; Israel, E. An overview of microfinance and the environmental sustainability of smallholder agriculture. Int. J. Agric. Resour. Gov. Ecol. 2006, 5, 356–376. [Google Scholar] [CrossRef]
  22. Mukherjee, M.; Schwabe, K. Irrigated agricultural adaptation to water and climate variability: The economic value of a water portfolio. Am. J. Agric. Econ. 2015, 97, 809–832. [Google Scholar] [CrossRef] [Green Version]
  23. Maertens, A.; Barrett, C.B. Measuring social networks’ effects on agricultural technology adoption. Am. J. Agric. Econ. 2013, 95, 353–359. [Google Scholar] [CrossRef] [Green Version]
  24. Adrianzén, M.A. Social capital and improved stoves usage decisions in the northern peruvian andes. World Dev. 2014, 54, 1–17. [Google Scholar] [CrossRef] [Green Version]
  25. Genius, M.; Koundouri, P.; Nauges, C.; Tzouvelekas, V. Information transmission in irrigation technology adoption and diffusion: Social learning, extension services, and spatial effects. Am. J. Agric. Econ. 2014, 96, 328–344. [Google Scholar] [CrossRef] [Green Version]
  26. Mattoussi, W.; Seabright, P. Cooperation against theft: A test of incentives for water management in Tunisia. Am. J. Agric. Econ. 2014, 96, 124–153. [Google Scholar] [CrossRef]
  27. Piskorski, M.J.; Gorbatâi, A. Testing Coleman’s social-norm enforcement mechanism: Evidence from Wikipedia. Am. J. Sociol. 2017, 122, 1183–1222. [Google Scholar] [CrossRef]
  28. Omotilewa, O.J.; Jacob, R.G.; Herbert, A.J.; Ainembabazi, J.; Shively, G. Does improved storage technology promote modern input use and food security? Evidence from a randomized trial in Uganda. J. Dev. Econ. 2018, 135, 176–198. [Google Scholar] [CrossRef]
  29. Jaffe, A.B.; Newell, R.G.; Stavins, R.N. A tale of two market failures: Technology and environmental policy. Ecol. Econ. 2005, 54, 164–174. [Google Scholar] [CrossRef] [Green Version]
  30. Ayalew, H.; Chamberlin, J.; Newman, C. Site-specific agronomic information and technology adoption: A field experiment from Ethiopia. J. Dev. Econ. 2022, 156, 102788. [Google Scholar] [CrossRef] [PubMed]
  31. Olen, B.; Wu, J.; Langpap, C. Irrigation decisions for major west coast crops: Water scarcity and climatic determinants. Am. J. Agric. Econ. 2015, 98, 254–275. [Google Scholar] [CrossRef]
  32. Foster, A.D.; Rosenzweig, M.R. Microeconomics of technology adoption. Annu. Rev. Econ. 2010, 2, 395–424. [Google Scholar] [CrossRef] [Green Version]
  33. La Ferrara, E.; Chong, A.; Duryea, S. Soap operas and fertility: Evidence from Brazil. Am. Econ. J. Appl. Econ. 2012, 4, 1–31. [Google Scholar] [CrossRef] [Green Version]
  34. Ifft, J.; Bigelow, D.P.; Savage, J. The impact of irrigation restrictions on cropland values in Nebraska. J. Agric. Resour. Econ. 2018, 43, 195–225. [Google Scholar]
  35. Lee, G.E.; Rollins, K.; Singletary, L. The relationship between priority and value of irrigation water used with prior appropriation water rights. Land Econ. 2020, 96, 384–398. [Google Scholar] [CrossRef]
  36. Kuwayama, Y.; Brozović, N. The regulation of a spatially heterogeneous externality: Tradable groundwater permits to protect streams. J. Environ. Econ. Manag. 2013, 66, 364–382. [Google Scholar] [CrossRef]
  37. Gebremeskel, G.; Gebremicael, T.G.; Hagos, H.; Gebremedhin, T.; Kifle, M. Farmers’ perception towards the challenges and determinant factors in the adoption of drip irrigation in the semi-arid areas of Tigray, Ethiopia. Sustain. Water Resour. Manag. 2017, 4, 527–537. [Google Scholar] [CrossRef]
  38. Cooper, J.C.; Keim, R.W. Incentive payments to encourage farmer adoption of water quality protection practices. Am. J. Agric. Econ. 1996, 78, 54–64. [Google Scholar] [CrossRef] [Green Version]
  39. Cremades, R.; Wang, J.; Morris, J. Policies, economic incentives and the adoption of modern irrigation technology in China. Earth Syst. Dyn. 2015, 27, 621–629. [Google Scholar] [CrossRef] [Green Version]
  40. Zilberman, D.; Park, T.; Vukina, T.; Sheldon, I. Diffusion of drip irrigation: The case of California. Appl. Econ. Perspect. Policy 2017, 39, 16–40. [Google Scholar]
  41. Blanke, A.; Rozelle, S.; Lohmar, B.; Wang, J.; Huang, J. Water saving technology and saving water in China. Agric. Water Resour. Manag. 2007, 87, 139–150. [Google Scholar] [CrossRef]
  42. Klerkx, L.; Jakku, E.; Labarthe, P. A review of social science on digital agriculture, smart farming and agriculture 4.0: New contributions and a future research agenda. NJAS-Wagening. J. Life Sci. 2019, 90–91, 100315. [Google Scholar] [CrossRef]
  43. Seinfeld, J.H.; Pandis, S.N. Atmospheric Chemistry and Physics: From Air Pollution to Climate Change, 2nd ed.; Wiley: New York, NY, USA, 1998. [Google Scholar]
  44. Calel, R.; Dechezleprêtre, A. Environmental policy and directed technological change: Evidence from the European carbon market. Rev. Econ. Stat. 2016, 98, 551–574. [Google Scholar] [CrossRef] [Green Version]
Figure 1. Trends of the expansion of WSI area proportion in China and in the two sample provinces; WSI technology adoption rate of farmers in the sample. Data Sources: 1. The proportions of WSI area to effective irrigation area (blue line) are from the China Rural Statistical Yearbook (2005–2020); 2. The percentages of WSI technology adoption rate of the plots with irrigation are from the author’s calculations based on our three-round sample data (2007, 2012, and 2017).
Sustainability 15 05310 g001
Figure 2. (a) Average adoption rate of WSI of farmers in the untreated group; (b) Average adoption rate of WSI of farmers in the treated group.
Sustainability 15 05310 g002
Figure 3. The kernel density distribution of t value of the DID interaction term.
Sustainability 15 05310 g003
Table 1. Digital groundwater supervision pilot process in the two sample provinces.
YearInner MongoliaHebei Province
2014A total of 14 out of 102 counties were selected as the pilot counties of digital supervision (13.7%).A total of 13 out of 172 counties were first selected as the pilot counties of digital supervision (7.6%).
2015A total of 33 new counties became digital groundwater supervision pilot counties. The number of digital groundwater supervision pilot counties increased to 47 (46.1%).A total of 77 new counties became digital groundwater supervision pilot counties. The number of digital groundwater supervision pilot counties increased to 90 (52.3%).
2016The number of digital groundwater supervision pilot counties reached 62 (65.7%).The pilot areas expanded to 115 counties (66.9%).
Table 2. Digital groundwater supervision pilot process in the five sample counties.
ProvinceCounty20152016
Inner MongoliaWuchuanDigital groundwater supervision pilot started and was carried out in most villages.-
Chahar Youyizhongqi-Digital groundwater supervision pilot started and was carried out in some villages.
Siziwangqi--
Hebei ProvinceKangbao-Digital groundwater supervision pilot started and was carried out in most villages.
ZhuoluDigital groundwater supervision pilot started. Two towns are selected as the pilot areas.-
Table 3. Descriptive statistics.
VariableDefinition200720122017
MeanS.D.MeanS.D.MeanS.D.
WSI0 = plots without irrigation, 1 = flood irrigation,
2 = large sprinkler irrigation,
3 = micro spray irrigation,
4 = drip irrigation
0.520.641.000.971.931.51
WSI0Within all WSI: 0 = plots without irrigation, 1 = any other WSI0.460.500.690.460.740.44
WSI1Within all WSI: 0 = plots without irrigation or flood irrigation, 1 = any other WSI0.040.200.190.390.570.49
WSI2Within all WSI: 0 = plots without irrigation, flood irrigation or large sprinkler irrigation, 1 = micro spray or drip irrigation0.020.130.080.280.380.49
WSI3Within all WSI: 1 = drip irrigation, 0 = any other WIS 0.0020.040.040.180.230.42
QuantityPotato yield of plot i /water consumption of plot i (kg/m3)79.802.5094.894.9953.7332.77
EfficiencyWater consumption of plot i /acreage of plot i (m3/mu)11.671.3420.711.5842.665.82
NewwellWhether the number of newly constructed borewells has been limited, 1 = yes, 0 = no0.410.810.390.770.400.89
PropertyProperty of the borewell of plot i 0.680.871.000.901.551.23
DigitalWhether village i has introduced the digital groundwater supervision0.380.490.380.490.380.49
TreatedBorewells ban treatment
0 = untreated, 1 = treated
0.650.480.650.480.650.48
CostAverage production cost of potatoes (yuan/mu)276.80234.71295.79230.90334.98305.60
WatercostAverage water price (yuan/mu)0.220.410.560.680.910.86
Topography1 = “Plain”, 2 = “Hilly land”, 3 = “Mountain”1.340.601.400.641.530.76
Fertility1 = “Barren land”, 2 = “General land”, 3 = “Fertile land”1.990.631.970.641.920.65
AcreageAcreage of plot i (mu)5.434.315.964.815.875.69
TenureThe contracted year of plot i 9.54.4513.344.7818.154.93
AgeAge of the householder of household h 49.888.9254.888.9257.379.02
EducationYears of education of the householder of household h 6.343.256.343.256.413.32
Training1 = County Government has held WSI training in village v , 0 = others0.290.460.310.460.410.49
WellnumNumber of borewells owned by the village collective15.8721.9815.7422.131623.06
Descriptive statistics are based on 622 plots of 311 households in the sample.
Table 4. The impact of the digital groundwater supervision pilot on farmers’ WSI behavior.
VariablesWSI0WSIWSI1WSI2WSI3
(1)(2)(3)(4)(5)
Digital*Post−0.00810.51560.13800.2200 **0.1658
(0.1585)(0.3138)(0.1074)(0.1015)(0.1107)
Digital−0.5537 ***−1.0898 ***−0.2814 ***−0.2677 ***0.0129
(0.0912)(0.2013)(0.0776)(0.0630)(0.0455)
Post0.06740.8889 ***0.3644 ***0.2568 ***0.2003 **
(0.0800)(0.2068)(0.0660)(0.0741)(0.0807)
Age0.00190.0103 *0.0045 *0.00170.0023
(0.0021)(0.0060)(0.0025)(0.0024)(0.0016)
Education0.0009−0.01070.0008−0.0068−0.0055
(0.0058)(0.0176)(0.0068)(0.0073)(0.0051)
Training0.03330.4883 ***0.1686 ***0.1753 ***0.1111 **
(0.0362)(0.1107)(0.0399)(0.0461)(0.0475)
Cost0.0002 ***0.0006 ***0.0002 ***0.0001 **0.0001 ***
(0.0001)(0.0001)(0.0001)(0.0000)(0.0000)
Watercost0.2651 ***0.7139 ***0.2181 ***0.1384 ***0.0923 ***
(0.0374)(0.0717)(0.0218)(0.0223)(0.0217)
Wellnum−0.00080.00050.00040.00040.0005
(0.0010)(0.0028)(0.0005)(0.0007)(0.0009)
Topography0.0553 **0.2230 ***0.1021 ***0.0548 **0.0109
(0.0212)(0.0595)(0.0225)(0.0215)(0.0178)
Fertility−0.0968 ***−0.01810.0340 *0.01870.0261
(0.0233)(0.0483)(0.0176)(0.0220)(0.0173)
Acreage0.0103 ***0.0036−0.0029−0.0014−0.0024
(0.0035)(0.0082)(0.0024)(0.0032)(0.0016)
Tenure−0.00010.0127*0.00350.0059 *0.0035
(0.0026)(0.0069)(0.0028)(0.0030)(0.0026)
Constant0.2979 **−1.7097 ***−0.8099 ***−0.8312 ***−0.3664 ***
(0.1294)(0.4695)(0.1753)(0.1646)(0.1263)
Year fixed effectsYesYesYesYesYes
Household fixed effectsYesYesYesYesYes
Obs.18661866186618661866
R20.70090.71650.68410.55400.4803
Robust standard errors in parentheses are adjusted for 50 clusters in villages. *, **, and *** denote significance at the 10%, 5%, and 1% levels.
Table 5. Placebo test under the fictitious digital technology starting time.
VariablesWSI0WSIWSI1WSI2WSI3
(1)(2)(3)(4)(5)
Digital*FakePost0.01400.33180.13430.08260.0976
(0.1919)(0.2771)(0.0807)(0.0693)(0.0579)
Digital−0.5688 ***−1.1352 ***−0.3258 ***−0.2462 ***0.0092
(0.1500)(0.2630)(0.1007)(0.0761)(0.0480)
FakePost0.08620.8226 ***0.3766 ***0.2021 ***0.1578 **
(0.0972)(0.2058)(0.0652)(0.0622)(0.0587)
Other control variablesYesYesYesYesYes
Year fixed effectsYesYesYesYesYes
Household fixed effectsYesYesYesYesYes
Constant0.2616 *−1.7346 ***−0.8352 ***−0.8097 ***−0.3537 ***
(0.1347)(0.4759)(0.1719)(0.1618)(0.1262)
Obs.18661866186618661866
R20.69840.71380.68490.54490.4705
Robust standard errors in parentheses are adjusted for 50 clusters in villages. *, **, and *** denote significance at the 10%, 5% and 1% levels. The control variables are the same as in Table 4.
Table 6. The impact of the digital groundwater supervision pilot on water consumption and irrigation efficiency.
VariablesQuantityEfficiency
(1)(2)
Digital*Post−19.2956 **3.9552 **
(7.6696)(1.5936)
Digital−21.9230 ***2.7538 ***
(3.2542)(0.6849)
Post0.515125.2854 ***
(5.6980)(1.1808)
Other control variablesYesYes
Year fixed effectsYesYes
Household fixed effectsYesYes
Constant81.6283 ***12.6298 ***
(8.5239)(1.7127)
Observations18661866
R20.89940.9772
Robust standard errors in parentheses are adjusted for 50 clusters in villages. **, and *** denote significance at the 5%, and 1% levels. The control variables are the same as in Table 4.
Table 7. Heterogeneous analysis of the WSI impact of the digital groundwater supervision pilot.
VariablesWSI3QuantityWSI3Quantity
Panel AHigh Punishment GroupLow Punishment Group
(1)(2)(3)(4)
Digital*Post0.2228 **−21.2325 ***0.1081−18.8319 **
(0.1044)(7.6674)(0.1281)(7.9114)
Digital−0.1353−34.9382 ***0.0825−22.3886 ***
(0.1210)(7.5675)(0.0983)(3.8565)
Post0.1616 **2.59150.2043 *−3.2520
(0.0642)(4.6788)(0.1025)(7.1493)
Other control variablesYesYesYesYes
Year fixed effectsYesYesYesYes
Household fixed effectsYesYesYesYes
Constant−0.4817 **79.7056 ***−0.249382.4708 ***
(0.1766)(11.3954)(0.1559)(10.0658)
Obs.10661066800800
R20.45720.91610.53200.8872
Panel BHigh Cooperation GroupLow Cooperation Group
(5)(6)(7)(8)
Digital*Post0.2078 *−20.9208 *0.1150−17.6754 **
(0.1061)(10.6556)(0.1460)(8.1555)
Digital−0.0210−22.1850 ***0.1548−25.4157 ***
(0.0721)(5.7670)(0.0930)(3.6708)
Post0.1724 **−0.66110.2292 *2.3854
(0.0768)(9.9322)(0.1244)(6.4508)
Other control variablesYesYesYesYes
Year fixed effectsYesYesYesYes
Household fixed effectsYesYesYesYes
Constant−0.3096 ***90.3341 ***−0.281771.6653 ***
(0.1078)(9.8376)(0.2126)(11.5495)
Obs.958958908908
R20.46660.88660.51320.9197
Panel CSufficient Information GroupInsufficient Information Group
(9)(10)(11)(12)
Digital*Post0.3663 **−22.1561 *0.0663−18.2599 **
(0.1519)(12.5197)(0.1047)(6.7795)
Digital−0.3071**−19.0856 ***0.0069−24.1735 ***
(0.1276)(6.4251)(0.0546)(3.1940)
Post0.2968 ***−6.54180.1924 **3.1614
(0.0915)(12.2476)(0.0768)(4.6324)
Other control variablesYesYesYesYes
Year fixed effectsYesYesYesYes
Household fixed effectsYesYesYesYes
Constant−0.6693 **70.1884 ***−0.2684 **82.2472 ***
(0.2555)(15.4699)(0.1314)(8.2730)
Obs.51351313531353
R20.58940.90380.49500.9055
Robust standard errors in parentheses are adjusted for 50 clusters in villages. *, **, and *** denote significance at the 10%, 5%, and 1% levels. The control variables are the same as in Table 4.
Table 8. Mechanism tests of the WSI impact of the digital groundwater supervision pilot.
VariablesWSI3QuantityWSI3Quantity
(1)(2)(3)(4)
Newwell*Digital*Post0.1984 ***−1.4943 **
(0.0212)(0.6021)
Newwell−0.00351.1657 **
(0.0103)(0.4823)
Property*Digital*Post 0.0717 *−0.8502 *
(0.0353)(0.5006)
Property −0.00610.6649
(0.0163)(0.7093)
Digital*Post0.1016−19.1596 **0.0981−18.8687 **
(0.1076)(7.5492)(0.1066)(7.5401)
Digital0.0201−21.6044 ***−0.0021−21.6325 ***
(0.0457)(3.2807)(0.0450)(3.3684)
Post0.2121 **0.44390.2233 **0.3440
(0.0804)(5.6466)(0.0828)(5.7310)
Other control variablesYesYesYesYes
Year fixed effectsYesYesYesYes
Household fixed effectsYesYesYesYes
Constant−0.3536 **81.7931 ***−0.3142 **80.5133 ***
(0.1321)(8.5056)(0.1305)(8.7654)
Obs.1866186618661866
R20.51210.90020.48760.8995
Robust standard errors in parentheses are clustered at the village level. *, **, and *** denote significance at the 10%, 5%, and 1% levels. The control variables are the same as in Table 4.
Disclaimer/Publisher’s Note: The statements, opinions and data contained in all publications are solely those of the individual author(s) and contributor(s) and not of MDPI and/or the editor(s). MDPI and/or the editor(s) disclaim responsibility for any injury to people or property resulting from any ideas, methods, instructions or products referred to in the content.

