Article

User-Centered Software Design: User Interface Redesign for Blockly–Electron, Artificial Intelligence Educational Software for Primary and Secondary Schools

1
School of Fine Arts, South China Normal University, Guangzhou 510631, China
2
College of Communication & Media Sciences, Zayed University, Abu Dhabi 144534, United Arab Emirates
3
He Xiangning College of Art and Design, Zhongkai University of Agriculture and Engineering, Guangzhou 510225, China
*
Authors to whom correspondence should be addressed.
These authors contributed equally to this work.
Sustainability 2023, 15(6), 5232; https://doi.org/10.3390/su15065232
Submission received: 11 January 2023 / Revised: 21 February 2023 / Accepted: 10 March 2023 / Published: 15 March 2023
(This article belongs to the Special Issue Sustainable Education and Technology Development)

Abstract

:
According to the 2021 and 2022 Horizon Report, AI is emerging in all areas of education, in various forms of educational aids with various applications, and is carving out a similarly ubiquitous presence across campuses and classrooms. This study explores a user-centered approach used in the design of the AI educational software by taking the redesign of the user interface of AI educational software Blockly–Electron as an example. Moreover, by analyzing the relationship between the four variables of software usability, the abstract usability is further certified so as to provide ideas for future improvements to the usability of AI educational software. User-centered design methods and attribution analysis are the main research methods used in this study. The user-centered approach was structured around four phases. Overall, seventy-three middle school students and five teachers participated in the study. The USE scale will be used to measure the usability of Blockly–Electron. Five design deliverables and an attribution model were created and discovered in the linear relationship between Ease of Learning, Ease of Use, Usefulness and Satisfaction, and Ease of use as a mediator variable, which is significantly different from the results of previous regression analysis for the USE scale. This study provides a structural user-centered design methodology with quantitative research. The deliverables and the attribution model can be used in the AI educational software design. Furthermore, this study found that usefulness and ease of learning significantly affect the ease of use, and ease of use significantly affects satisfaction. Based on this, the usability will be further concretized to facilitate the production of software with greater usability.

1. Introduction

In 1950, a two-month seminar at Dartmouth College in the United States organized by John McCarthy was the prologue to the birth of artificial intelligence (AI). McCarthy first used the term artificial intelligence in a proposal for a symposium in 1956 [1]. Since the concept of AI was born in 1956, with the accumulation of big data, the innovation of theoretical algorithms, and the improvement of computing power, AI has made breakthroughs in many application fields and is profoundly changing how people learn and live and has also changed production methods, injecting new impetus into social development and bringing about important opportunities and challenges to reform. AI was prominently featured as one of those key technologies and practices in education in the 2021 Horizon Report Teaching and Learning Edition [2]. According to the report’s discussion of AI and education, AI is emerging in all areas of education as various types of educational aids with various applications; at the same time, AI can be used to solve long-standing or current challenges in teaching, learning and learner success. To little surprise, AI is still the key technology and practice in the 2022 horizon report [3], and there are some small differences that further refine the application of AI technology in education into two important types: AI for Learning Analytics and AI for Learning Tools. As stated in the AI for Learning Tools section, AI will help shape, entertain, connect and drive our behavior and thoughts. It is little wonder, then, that AI is carving out a similarly ubiquitous presence across campuses and classrooms. When experts in academia and industry are imagining and verifying the future development of artificial intelligence, countries around the world clearly know that the cultivation of relevant talents will undoubtedly be the focus of future education for the iterative development of artificial intelligence technology. Throughout the world, government education departments in many countries and regions have issued corresponding policies to promote the development of artificial intelligence education [4]. The application of AI in education (AIEd) has been the subject of research for about 30 years. The International AIEd Society (IAIED) was launched in 1997 and publishes the International Journal of AI in Education (IJAIED), with the 20th annual AIEd conference being organized in 2019. However, on a broader scale, educators have just started to explore the potential pedagogical opportunities that AI applications afford for supporting learners during the student life cycle [5].
Artificial intelligence is an interdisciplinary and comprehensive field, including interdisciplinary computer science, mathematics, biology, neuroscience, cognitive disciplines, brain science, psychology, sociology, philosophy, and so on [1]. The strong interdisciplinary nature makes it difficult to define accurately, but as Max Tegmark’s research stated [6], the rise of artificial intelligence will definitely change our future fundamentally, and we need to make this trend as controllable as possible by studying it, discussing it, and applying it. As a tool and means of communicating with computers, the cultivation of programming abilities is one of the focuses of AI education. According to Bian et al., in education relating to the development needs of AI, the cultivation of knowledge and skills such as programming ability, applied mathematical ability, data structure, algorithms, and so on is very important [7]. Namely, one of the most basic aspects of promoting the literacy of AI is to promote the development of students’ programming skills and thinking. Programmatic thinking can also be called computational thinking (CT)—the ability to reformulate and solve problems in ways that can be undertaken by computers—has been heralded as a foundational capability in the 21st century [8]. Compared with learning programming languages mechanically, computational thinking is the more important aspect for the improvement of overall programming abilities, especially for children in primary and secondary schools [9]. In 2020, Antonio Rodriguez-Martinez et al., analyzed the results of educating sixth graders about the use of scratch and found that graphical programming software scratch seems to be able to be used to develop both students’ mathematical ideas and CT [10]. The core of programming thinking is how to decompose problems, discover rules from them, build problem-solving models, map them to appropriate data structures and algorithms and then perform corresponding operations according to the algorithm. Therefore, the training of abstract thinking logic is the emphasis, rather than the memorization of programming languages.
For beginners of all ages, especially children, the learning of programming is a rather challenging process [11]. In 2017, Bau et al., found that for a novice, it is easier to learn computer science using block-based languages relative to text-based languages because they rely on recognition instead of recall (blocks are selected from a pallet), reduce cognitive load by chunking code into smaller numbers of meaningful elements and allow users to avoid basic errors by providing constrained direct manipulation of structure [12]. The most common form of graphical programming, which is block-based, has become increasingly popular, with less technical detail, higher efficacy, and more core literacy training, meaning that it can significantly reduce learning costs, especially for children who are young beginners [13]. Graphical programming integrates many obscure text code commands into blocks, and students only need to learn the functions of each block, and then they can make simple programs, which further reduces the technical threshold, and puts more emphasis on the programming thinking training. In 2020, Saez-Lopez et al., demonstrated some of the positive effects of the Visual Block Programming (scratch) on the training of future teachers through qualitative and quantitative methods, and pointed out the advantages of visual and graphical programming languages in the field of programming education [14]. In 2022, Su et al., have shown that the graphical programming tool Scratch has been widely used in the programming teaching of primary school students, and the learning in the course is also liked by children and promotes creative thinking. [15]. Blockly–Electron is also a graphical programming tool developed by the School of Information Optoelectronics of South China Normal University based on Blockly, a web-based visual programming tool open-sourced by Google. Its goal is to provide a set of suitable teaching models and corresponding content for artificial intelligence education in primary and secondary schools. Students can write programs through the software to learn and practice artificial intelligence.
Different user interfaces in the software will lead to significant differences in task performance [16]. Users utilize software to exchange information through the software interface. The user interface is the most direct and important entrance for the user to interact with the software. The quality of the interface determines the user’s first impression of the software. Regarding the evaluation of good or bad user interfaces, the two attributes that are commonly discussed in academia and industry are usability and user experience (UX) [17]. UX contains usability and some other more subjective attributes, and other highly subjective factors (such as emotional state, context, accessibility, among others), which means that due to strong subjectivity, the evaluation of these factors cannot be a universal measurement, such as with usability, but needs to be combined with specific scenarios in order to design evaluation methods [17]. Therefore, when researchers or designers try to make or optimize user interfaces, they will always mention the ultimate goal of a good user experience, but the first ones to undertake are basic usability assessments (that is, in a general sense, whether the product is available to users, of course, high usability does not represent a good user experience), especially for software that has not yet been put into established and large-scale user use, usability evaluation is the basic, first and most executable choice. According to ISO 9241-11:2018, officially, usability was defined as the extent to which a system, product, or service can be used by specified users to achieve specified goals with effectiveness, efficiency, and satisfaction in a specified context of use [18]. In this study, the USE scale will be used to measure the usability of Blockly–Electron. A well-designed user interface can guide the user to complete the corresponding operation, play the role of a guide, and has the direct advantage of attracting the user. Usability is an important part of user experience, and to some extent, usability is positively correlated with user experience [17].
User-centered design (UCD) is a Design Methodology that includes user research (UR) to solve “who is the target user of the software?” and user experience (UX) of “how users interact with the software” [19]. The term “user-centered design” originated in Donald Norman’s research laboratory at the University of California San Diego (UCSD) in the 1980s and became widely used after the publication of a co-authored book entitled: User-Centered System Design: New Perspectives on Human–computer Interaction [20]. Norman built further on the UCD concept in his seminal book The Psychology of Everyday Things [21]. Since then, many scholars have continued to delve into the application of user-centered design methods based on Norman’s work. One type is the eight golden rules of design proposed by Ben Shniederman in 1987 and the usability engineering carried out by Jakob Nielson in 1993, which led to the famous Nielsen Ten Laws of Usability Design. These studies are horizontal extensions of user-centered concepts, and the other is the application of user-centered design methods to different types of design, such as WSDM: a user-centered design method for websites [22], user-centered design and evaluation of virtual environments [23], user-centered design in games [24], etc. In recent years, there has been much user-centered research. Practically, a deep understanding of the end-user at the time of design is the foundation of UCD; specifically, the user should be placed at the heart of the entire design process and the design direction and goals should be derived from the research conclusions of the specific user, and iterative designs should be informed by user feedback [25]. In 2017, Moquillaza et al., used the UCD methodology to systematically validate and practice ATM interface design and obtain good usability feedback [26]. In 2019, Afrianto et al., stated that UCD is a way of achieving more effective systems and applied this theory to specific projects for empirical testing [27]. In 2021, through a systematic collation and summary of the UCD methodology, Trila et al., stated that the UCD approach would change depending on the specific environment, technological development, and design goals, especially since continuous testing with users is an important part of UCD, and continues to refine and delve into family-centered design on this basis [28]. In addition, there have still been several studies relating to the application of UCD methods to specific software designs, which will be elaborated on in the literature review section below. Overall, for specific types of projects, the methodology needs to specialize; therefore, in this study, we are committed to exploring a user-centered approach for the design and development of AI educational software. From a problem-oriented perspective, the following are the questions we are committed to working on:
(1)
When AI education is gradually popularized in schools, how should the teaching software design meet the user needs of students, especially for primary and secondary school?
(2)
When the user-centered design concept is used in the design of artificial intelligence educational software for primary and secondary schools, how should it be optimized according to the specific scenario and user characteristics?
(3)
Usability is one of the cores of a user-centered approach, but how can abstract usability be scientifically and effectively improved in design practice?
The main content structure of the rest of this article is presented as follows. In Section 2, we conduct a literature review of previous research related to several topics. They are user-centered user interface design, USE scale use and analysis, and artificial intelligence education. In Section 3, we will introduce the specific implementation of the research method and research design used to complete this study. In Section 4, we will describe the results of the entire research process, including qualitative and quantitative studies. In Section 5, we will discuss the overall research ideas, results, shortcomings, and areas for improvement. In Section 6, we will summarize the entire research work and generate relevant conclusions.

2. Literature Review

2.1. User Interface Design and User-Centered Design

User-centered design is a conceptual framework of design work that can theoretically be used for the design of various user-oriented products. This method mainly focuses on the usability goals of the product, user characteristics, usage scenarios, the workflow of product functions, user experience, etc. [29]. Among them, there is much research related to the use of the user-centered methodology for software user interface design. The following are examples of user interface design that have been carried out by some researchers in the past using the user-centered approach.
In 2018, Couture et al., described user-centered design methods relatively systematically in their study, and based on this, they designed and developed a software called “MySafeCare” [30]. The development of the software mainly includes two parts, the design of the user interface and the software function. In order to extract useful information that is used in the re-design of the software, they first conducted usability testing of the software based on the initial version of the software on individuals or groups consisting of patients, patient family members, and an advisory committee of patients and family members under specific test scenarios. In their subsequent work, they divided it into three thematic steps, each of which with many sub-steps that need to be performed. In those processes, the second theme is closely related to the user-centered approach, namely the connection of the Nielsen heuristic principle. According to the principle of UCD, they collected the user requirement from previous tests and then discussed those items to achieve consensus, which matched Nielsen’s top ten usability archetypes. Ultimately, based on the user-centered approach, they designed and developed a software whose user interface and functions satisfy their target users.
In 2019, Nguyen et al., presented their study related to enhancing the effectiveness of “PGx-CDS”, a pharmacogenomic clinical decision support tool for thiopurine drugs used in clinical use, by improving the user interface of that software [31]. They first pointed out that the original interface of “PGx-CDS” may lead to erroneous results, so there is an urgent need for improvement. It was then pointed out that the research is mainly divided into two stages: one is to conduct interviews with relevant users and then obtain the design requirements for “PGx-CDS” through qualitative data analysis methods of induction and deduction; the other is to design and develop a user interface prototype and evaluate its usability. In step two, the team created a list of key features of the “PGx-CDS” display design as design guidance based on previously collected data and human factors principles. Finally, through the usability test of the prototype developed in step 2, it is found that the “PGx-CDS” at that time achieved greater user satisfaction. In addition, the article concludes that this study is the first to use a user-centered approach to design and develop “PGx-CDS”, a TPMT drug physician decision-making tool. It is beneficial for patients to obtain such drugs reasonably for treatment.
In 2020, Jie et al., presented a user interface design for “Stappy”, a sensor feedback software, while also sharing the deliverables and key observations of the process in their research [32]. “Stappy” is mainly used to provide relevant help and support to patients after experiencing a stroke when they are performing gait training alone. In this research, they divided the user-centered approach to user interface design into four stages, namely discovery, definition, development, and delivery. The above four stages constitute the entire design process. After that, they recruited 15 participants to test the design and development of “Stappy” in multiple rounds, each of which consisted of 2–7 individual test parts. Finally, they also summarize seven deliverable conclusions and key observations related to the readability and contrast of visual information, the comprehension, and retention of information as well as physical limitations. The conclusions drawn from this study are very helpful in the design of software user interfaces for the same type of users. At the same time, the user-centered design method they constructed, which they call the double diamond model, systematically and specifically summarizes the implementation steps required for user-centered design, which is a good reference for design practices.
In 2021, Duvaud et al., proposed a user-centered approach for the user interface redesigning of the “Expasy” portal created by the Swiss Institute of Bioinformatics (SIB) [19]. Their goal was to design a user interface that is easy to use, efficient, and targeted at the target community. According to the UCD, they accurately developed a working process consisting of a project strategy definition, a four-phased redesign process, and the final product. Among these, it is most important for the four phases of redesign, including the preliminary phase, elaboration phase, iterative phase, and implementation phase. Compared with previous studies, this study also builds a set of user-centered theoretical models, which can well complete the criteria of attaining insight into users’ real needs and making user-centered products. At the same time, the design practices of specific interface production are explained in detail in the study.
In general, the purpose of the user-centered design concept is to emphasize the user experience as the center of design decisions in the design process, emphasize the user-first design model, and deeply understand the needs of users who use the product in design and development. In recent years, several studies that apply user-centered design methods to software user interface design have been listed, but there are some shortcomings. Firstly, taking insight into user needs as an example, past research has been more inclined to obtain user preferences through qualitative means such as interviews or reviews, but the problem is that this form may ignore the real feelings of most of the remaining users, especially for significant diverse user groups. Second, theoretically, no product can obtain the form that best meets the needs of users in just one round of design practice. Therefore, to design a truly mass user-centered product, it must be polished through iterative design, which is a continuous learning process. In previous studies, more emphasis was placed on the participation of a single design process, and less emphasis was placed on the necessity and feasibility of iterative design in their execution methods. Finally, the design and development of artificial intelligence education products for primary and secondary school students is also relatively rare in previous research, and for courses with high technology content, such as artificial intelligence education, the dependence on teaching software is stronger, so a teaching software that can meet the real needs of young students has a crucial impact on the quality of the education. After identifying some of the above research gaps, this study constructs a user-centered structured design method that combines qualitative and quantitative analysis methods and emphasizes iterative design for the design of AI educational software.

2.2. USE Questionnaire

The USE Questionnaire is a standard scale developed by Arnold Lund in 2001 [33], which mainly includes the measurement of four factors, namely the usefulness of eight items: Ease of Use has eleven items, Ease of learning has four items, and Satisfaction has seven items, for a total of 30 items. This questionnaire was constructed as a seven-point Likert rating scale. The users were asked to rate agreement with the statements, ranging from strongly disagree to strongly agree [33]. Usability testing is the critical content of the USE Questionnaire. According to ISO 9241-11, in short, usability is how well a product can be utilized by others effectively, efficiently, and satisfactorily. Previously, much research has used the USE scale to evaluate the usability performance of certain services or products. In order to find recent related research evaluating user interfaces, we searched for some keywords, including the following: USE Questionnaire, User Interface, software, application, and so on, in the Web of Science database. Several of the articles listed below are similar to our research, using the USE Questionnaire to evaluate the usability of an application. In these pieces of research, many studies only exert the analytical method of descriptive statistics on the data collected through the use of the USE Questionnaire [34,35,36,37,38,39,40,41,42,43,44]. Hendra et al. [45] adopted a similar analytical method as that used in our research, namely descriptive statistics and multiple linear regression. However, the essential differences between us are related to the regression results obtained by the use of multiple linear regression methods. They obtained a regression equation that is Y = 2.784 + 0.224 X1 + 0.198 X2 (Y = Satisfaction, X1 = Usefulness, X2 = Ease of Use). Originally, this equation included the variable of Ease of Learning (EOL), whereas the level of significance of the EOL variable is 0.537 (>0.05). As a result, they think that Ease of Learning does not have a significant and positive effect on the satisfaction variable. An overview of the studies using the USE scale mentioned above is detailed in Table 1 below. In general, most of the previous studies using the USE scale have only performed a simple descriptive analysis of data results to assess product usability; although a small number of studies have explored the influence patterns between factors in usability, they are insufficient. If the pattern of how each factor affects usability is not clear, there will be no effective feedback on the path to improving usability through the USE measurements.
Table 1. An overview of the studies using the USE scale.
AuthorAnalytic Method
(USE Questionnaire)
ResultConclusion
Teruel et al. (2014) [34]descriptive statisticsThe results for this questionnaire showed an average value of 6.06, with the values for ease of learning (6.53) and satisfaction (5.88) being the highest and lowest, respectively.From several results, they concluded that CT’12 achieves a high level of usability, but it also has several flaws that must be addressed.
Vanmulken et al. (2015) [35]descriptive statisticsAs to the feasibility of the application of haptic robot technology, the mean USE score was 65%.It is feasible to train C-SCI persons with the HM. Therapists report that working with the HM is easy to learn and easy to perform.
Jiang et al. (2018) [46]descriptive statistics and post hoc multiple
comparisons
The Servo author received the highest overall average scores for the USE Questionnaire
(5.684 ± 0.900, p < 0.05), and the Evital 4 author received the lowest (4.894 ± 0.981, p < 0.05). For the post hoc comparisons of the overall average scores, usefulness, and satisfaction, the Evital 4 resulted in lower scores than did the Servo I
(p < 0.05).
Participants thought Servo I would have more usefulness and higher user satisfaction
(p < 0.01 and p = 0.04, respectively) than Evital 4.
Gonzalez-Landero, F.
et al. (2018) [47]
descriptive statistics and paired t-testsThe highest-ranked feature of the app was the ease of learning dimension from the USE scale, with a mean value of 82.94%.PriorityNet app was easy to learn according to the USE scale.
Hendra et al. (2018) [45]descriptive statistics and multiple linear regression1. Measurement usability resulted in 75.23%.
2. The regression equation: Y = 2.784 + 0.224 X1 + 0.198 X2 + 0.095 X3
Where: Y = Satisfaction, X1 = Usefulness, X2 = Ease of Use, X3 = Ease of Learning (P1, P2 < 0.05, P3 = 0.537 >0.05)
1. The usability of the web-based student grade processing information system in Atisa Dipamkara’s high school has the value of “Feasible”.
2. The usefulness variables and ease of use variables significantly influence the satisfaction variable. However, the ease of learning variable does not significantly affect the satisfaction variable.
Kusumasari et al. (2018) [36]descriptive statisticsUsability of average 90.05%.The application has very good usability; it can be interpreted that the application has been designed to meet the needs of the child as a learning application.
Gumay et al. (2019) [39]descriptive statisticsUsability value of 87%.The re-design that has been undertaken met the needs of the deaf, with the use of appropriate communication for people with hearing loss so that they can confirm emergencies properly.
Ulya et al. (2019) [38]descriptive statisticsThe first usability iteration value was 65.87%. The second usability iteration value was 82.75%.The user interface of the
“Tebak Budaya Sunda” application has met the needs of deaf children.
Ridzky et al. (2019) [37]descriptive statisticsPretest: a usability average of 58%. Posttest: 90% with an excellent category.Based on the use of the user-centered design method, the introduction of SIBI alphabet user interface modeling met the needs of deaf children.
Hardianto et al. (2019) [40]descriptive statisticsAverage of Satisfaction: 87.5%.
Average of Ease Of Use: 93.6%.
The overall design of the paola.id website was very satisfactory.
Priowibowo et al. (2020) [41]descriptive statisticsPretest: usability of average 77.3%. Posttest: usability of average 87.4%.The application is convenient, effortless to use, painless to learn and pleasing for visually impaired users.
Fatima et al. (2020) [42]descriptive statisticsInternational Banking Websites:
Usefulness (64%), Ease of use (76%), Ease of Learning (83%),
satisfaction (52%) Pakistani Banking Websites: Usefulness (52%), Ease of use (60%), Ease of Learning (43%), satisfaction (31%)
The users’ expectations are higher than what they are delivered. There is much more to do to improve the usability of banking websites.
Suzianti et al. (2020) [48]descriptive statistics and Wilcoxon signed-rank testPretest: The average USE Questionnaire results overall on a scale of 1–7 is 4.49. Posttest: The average value on this questionnaire experienced a statistically significant increase.There are increased attributes of satisfaction, learnability, and memorability in the design improvement of the
MRT Jakarta Application.
Rizal et al. (2020) [43]descriptive statisticsThe results of usability testing measurements performed on the Mozita application obtained a usefulness value of 84.52%, ease of use at 83.53%, ease of learning at 80.95% and satisfaction at 85.03%.The Mozita application, by usability, has met the needs of midwives (cadres) as users to assist in completing their work.
Shi et al. (2021) [44]Descriptive statistics, One-way ANOVAs and Fisher’s exact testsThe average total usability survey score was 53.04 (SD = 21.07;
range 0–100). “Ease of learning” scored higher than other usability components.
TAY users had mixed perceptions about the usability of Thought Spot, and a high usage attrition rate was observed.

2.3. Artificial Intelligence Education

The concept of AI was first proposed at Dartmouth Conference in 1956, so it has achieved remarkable achievements after more than 60 years of development [49]. Baker and Smith (2019) provide a broad definition of AI: “Computers which perform cognitive tasks, usually associated with human minds, particularly learning and problem-solving” [50]. According to the many reports or research cited above, Artificial Intelligence has increasingly become one of the most important focuses in the educational field in recent years. Countries around the world strive to claim a place in the field of AI education, and they have issued many incentive policies to facilitate AI education [4]. Machine learning is a concept that is often mentioned in conjunction with artificial intelligence; Popenici and Kerr define machine learning “as a subfield of artificial intelligence that includes software able to recognize patterns, make predictions, and apply newly discovered patterns to situations that were not included or covered by their initial design” [51]. A lot of previous research related to AI education has mainly focused on how AI can be utilized to help enhance the quality of traditional education, such as in Luckin et al., where they describe three categories of AI software applications in education that are available today: (a) personal tutors, (b) intelligent support for collaborative learning and (c) intelligent virtual reality [52]. They think that AI offers the possibility of learning that is more personalized, flexible, inclusive and engaging. At the same time, it can provide teachers and learners with tools that allow us to respond not only to what is being learned but also to how it is being learned and how the student feels [52]. In 2020, Hsieh et al., designed and developed an interactive robot device to assist teachers and students in teaching and learning through the use of AI big data technology, but more importantly, they verified that the device could effectively improve students’ continuous learning motivation and learning outcomes, cultivate higher-order thinking skills and have a positive impact on future education and research in relevant fields [53]. In addition, the basic and important knowledge of AI also needs to be taught to students, especially at the primary and secondary levels. From another perspective, the boom in artificial intelligence education also represents the richness of various courses that teach underlying knowledge related to artificial intelligence. In 2015, Fernandes presented a problem-based learning (PBL) proposal for use in Artificial Intelligence courses, which includes student-developed artificial intelligence solutions to optimize the movement of a robot in an unknown environment, avoiding obstacles. The study’s results show that that proposal can be recognized by students [54]. To some extent, this kind of program is effective, but it is also very limited. It just changes traditional teacher-centered education to an educational approach centered on the questions raised by the teacher. In 2021, González-Carrillo et al., designed and built the “UNCode notebook” automatic grader on the “Jupyter notebook”, a programming tool that supports the operation of more than 40 programming languages, real-time code, mathematical equations, visualization and more, providing instant summary and formative feedback on programming results, helping students quickly identify and correct mistakes [55]. Compared with the former, the design of the automatic grading system has a better effect on improving the effectiveness of artificial intelligence courses, and this system is really trying to form a student-centered approach through rapid feedback results, stimulating students’ interest and ability to learn independently. As mentioned above, in the context of countries strengthening the layout of artificial intelligence in the field of education, artificial courses for primary and secondary school students have gradually entered people’s fields of vision. We hope young school students become interested in AI education by using visual and graphical programming applications to develop programs concerning AI. Firstly, we must have a high usability visual programming application. Therefore, we will explore the structured methodology of AI teaching software user interface design using the redesign of the user interface of the AI teaching software Blockly–Electron as an example.

3. Method

From the above analysis of past studies, it can be seen that there have been few studies on user-centered design methods for AI educational software, insufficient emphasis on quantitative analysis and iterative design in user-centered design methods, and a lack of research on the relationship between the four factors of usability measured in the USE scale. Therefore, this research will explore the user-centered design approach applicable to AI educational software through the user interface redesign of the AI educational software Blockly–Electron. At the same time, linear regression is used to explore the relationship between Ease of learning, Usefulness, Ease of use and Satisfaction in terms of usability. This study adopted a hybrid approach combining qualitative and quantitative analysis, and the following are some details of the methodology used in this study.

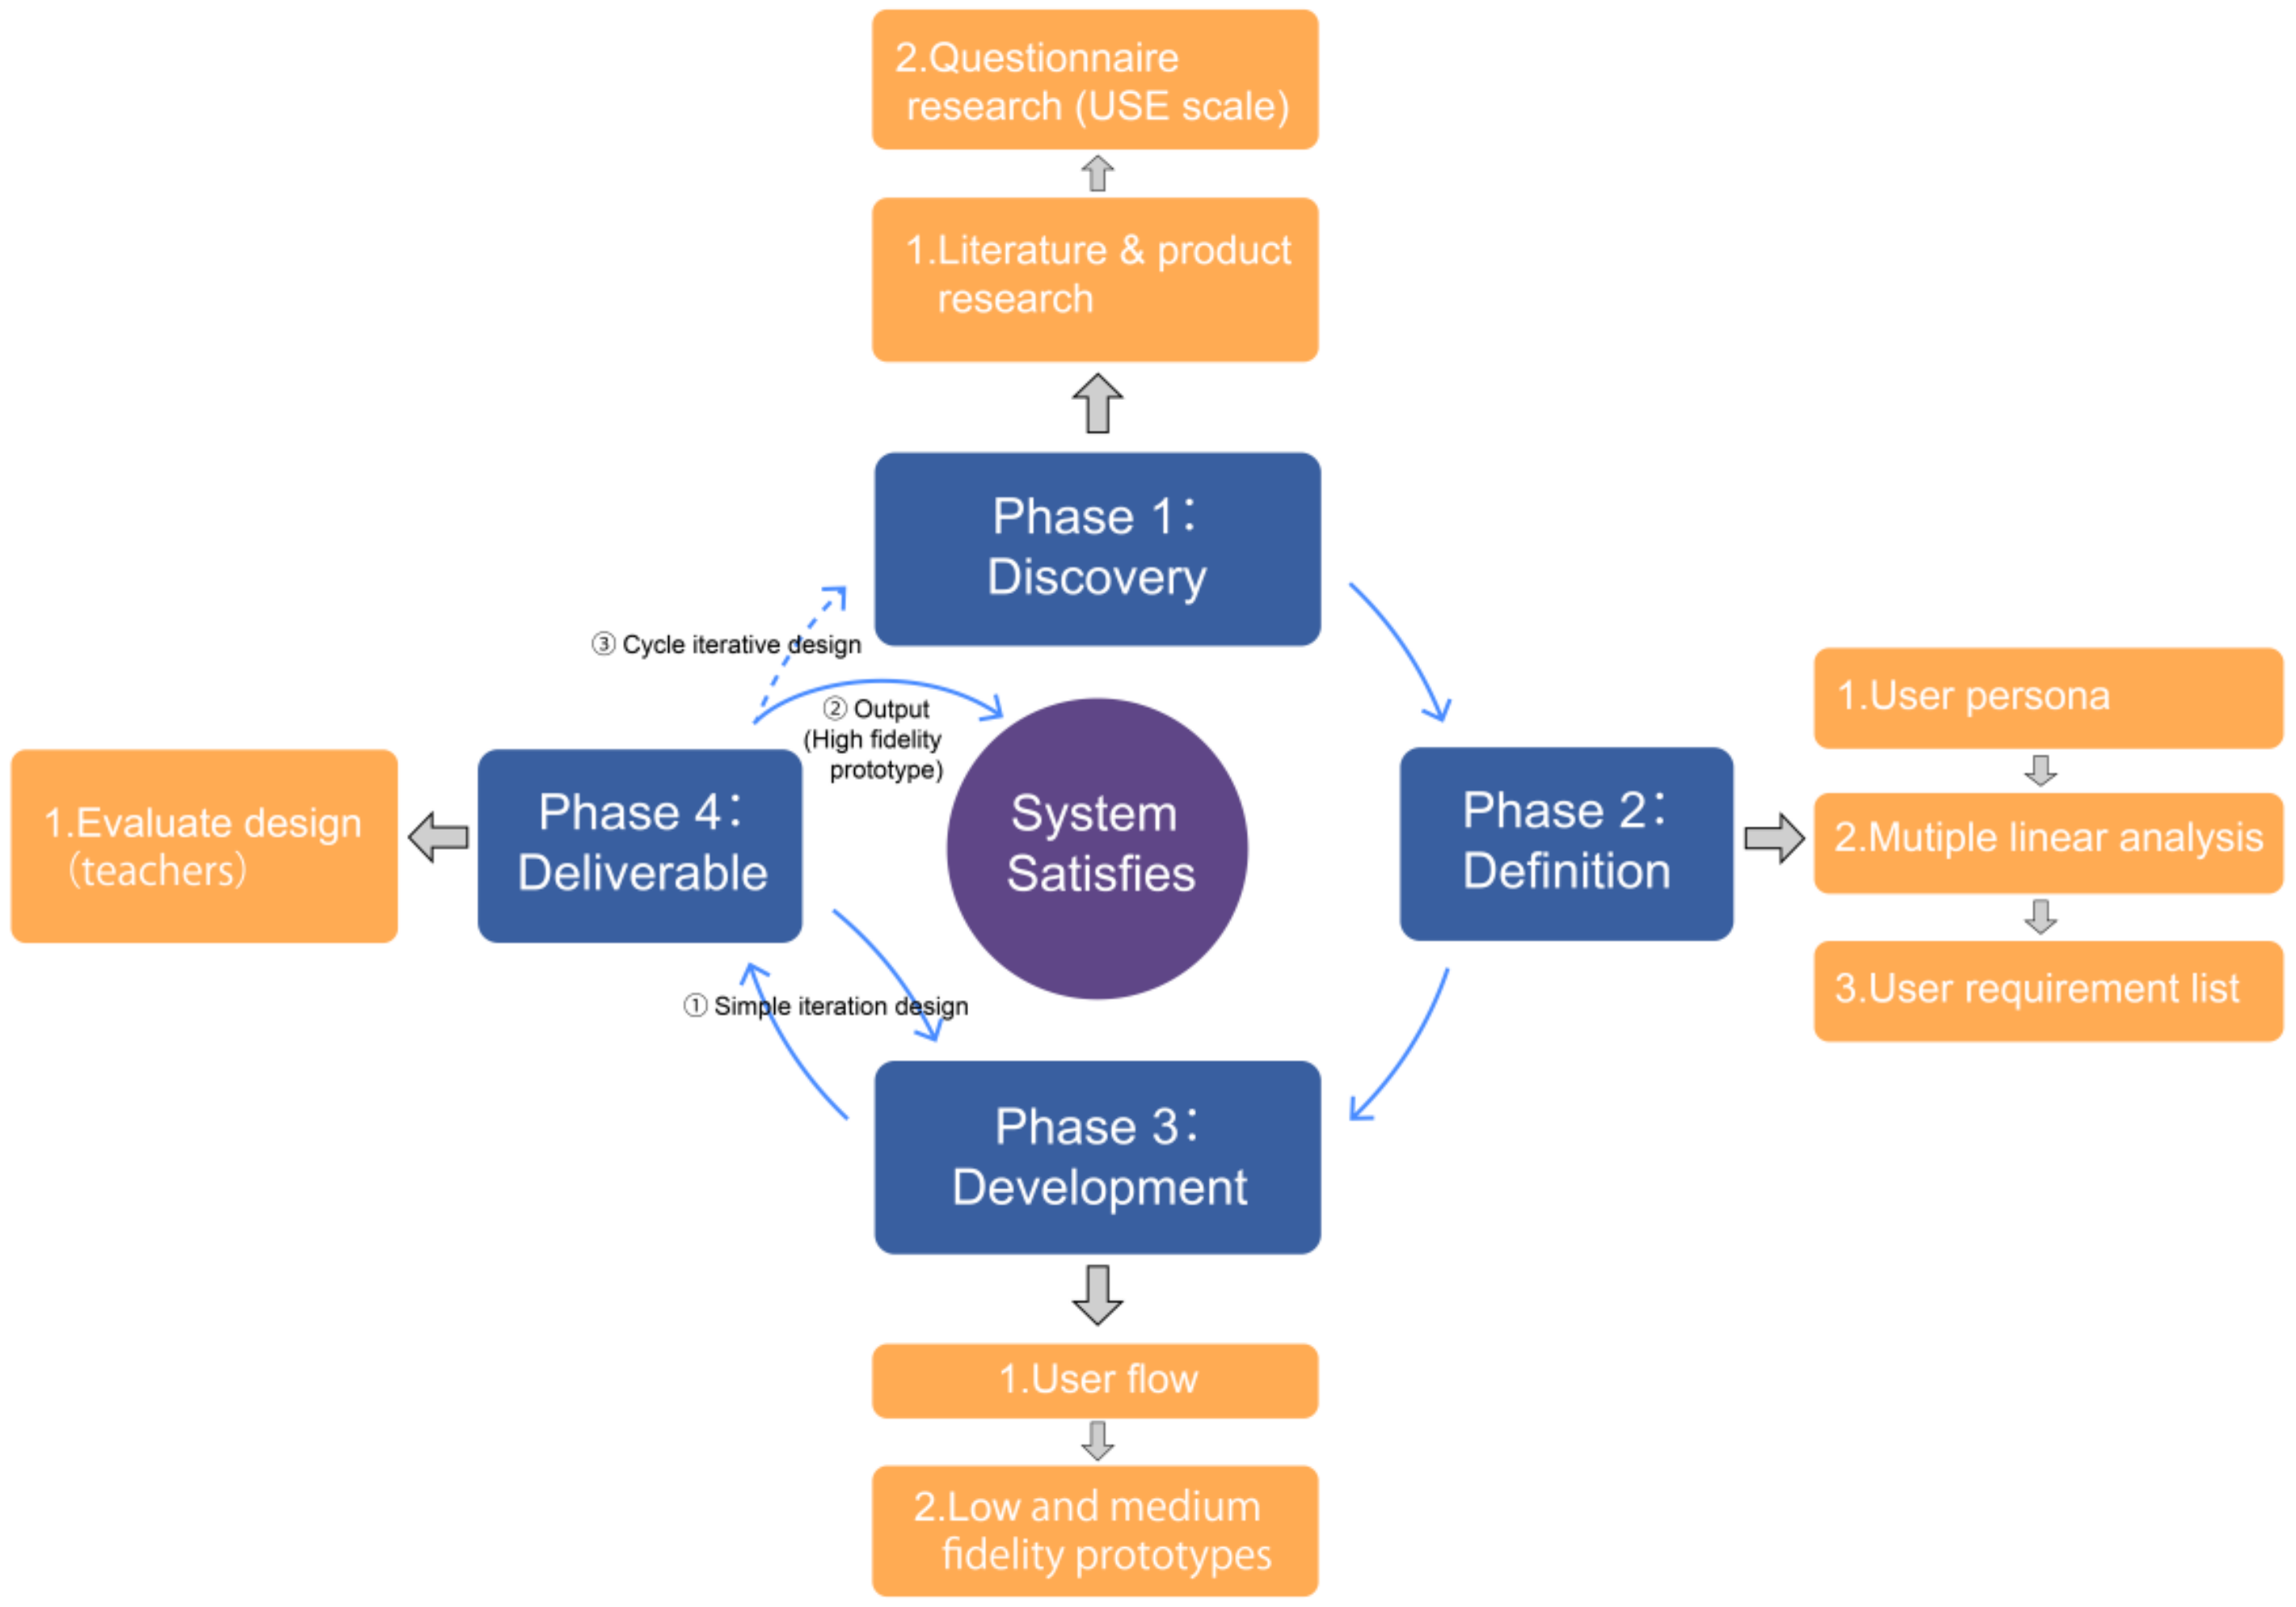
3.1. User-Centered Design

User-centered design (UCD) or user-driven development (UDD) is a framework of the process (not restricted to interfaces or technologies) in which usability goals, user characteristics, environment, tasks and the workflows of a product, service or process are given extensive attention at each stage of the design process. Because of the characteristics of UCD, which is a framework of processes, not specific work rules, designer may use different and specific work phases to design and develop different types of products based on the main objectives and framework of UCD. In our research, we designed a user-centered approach based on the user-centered design process proposed by the Digital Communications Division (DCD), a division of the Office of the Assistant Secretary for Public Affairs in the USA [56], and the Double Diamond design model proposed by the British Design Council [57]. It is worth noting that the theoretical method of UCD has been continuously applied to more specific projects from the earliest Norman proposal [20], DCD and other institutions to this day, which is a process of continuous attempts to improve the method, which also means that the theory is constantly improving rather than remaining static [19,21,22,23,24,25,26,27,28,29,30,31,32]. This approach is based on four stages (discovery, definition, development, and delivery), similar to the double-diamond model, and we designed the user-centered design methodology model used in this study based on the four-stage idea of designing around user needs and iterative design. It is worth noting that this model is suitable for both single-shot design development processes and multi-iteration designs. Figure 1 is a visual model of this user-centered design methodology, and the work that needs to be undertaken at each stage is clearly explained below.
In the first phase (discovery), two tasks need to be undertaken. First, according to our target users and the products requiring improvement, we searched the relevant literature and similar projects to obtain the characteristics of target users and basic optimization ideas. Secondly, 73 middle school students will fill in the USE scale to evaluate the software’s usability, namely, Usefulness, Ease of Use, Ease of Learning and Satisfaction after taking the artificial intelligence course based on Blockly–Electron. The user characteristics and usability evaluation results after statistical analysis will be used in the next stage to draw user persona and generate user requirement lists.
Phase II (Definitions) entails three tasks. First, the information retrieved from previous literature and projects during the discovery phase will be used to make the target user personae. A persona can be defined as “an archetype of a user that is given a name and a face, and it is carefully described in terms of needs, goals and tasks” and is used by the design team to satisfy the user’s needs and goals [58]. Second, the results of the USE scale survey obtained in the previous stage will be used for attribution analysis using the statistical method of multiple linear regression, that is, Satisfaction as the dependent variable, to explore the relationship between the three independent variables of Usefulness, Ease of Learning, Ease of Use, and Satisfaction. It is worth mentioning that we found a new impact model in the USE scale. The details of the innovative findings will be fully displayed in the results section. Third, based on the results of user persona and statistics, we summarize the list of user requirements redesigned by Blockly–Electron. Each design requirement in the list is prioritized based on the usability score while further translating abstract user requirements into implementable design approaches.
The third phase (development) mainly accomplished two tasks. First, according to the user requirement list and user persona, the user flow was redesigned to further optimize the steps of user interaction. Second, design and manufacture low-fidelity and medium-fidelity prototypes for a Blockly–Electron user interface. Then, the user flow, low- and medium-fidelity prototypes are delivered to the next stage for simple iterative design.
Phase 4 (deliverable) is the culmination of a single user-centered design process. In this stage, another group of users was selected, and this study selected teachers who used the software when teaching and qualitatively evaluated the user flowcharts and the low- and medium-fidelity prototypes produced during the development stage. The evaluation could include different components. For example, in the user flow, the participating teachers were asked to evaluate (1) whether the steps were placed in a logical order, (2) whether the text was clear, and (3) whether the provision of information was complete or what was missing. Additionally, with regard to the prototypes, they were asked to evaluate which they preferred (and why) and what they (dis)liked (and why), specifically, such as the use of colors, readability, instructions, language, and feedback. After the evaluation, all of the feedback or usability problems were considered and processed. The results of each evaluation were tidied and recorded. As shown in Figure 1, the results of the user reviews are traced back to the development phase to complete a simple iterative design. After solving the specified problem, the output results will continue to be sent for evaluation. If further improvement is needed, the simple iterative design will continue. If there is no further improvement suggestion, it can be output in the form of a high-fidelity prototype. In addition, the steps connected by dotted lines in Figure 1 are the beginning of cycle iterative design, and one or more rounds of circular, iterative design can be carried out after the completion of a single design to obtain the final product with high usability. The user interface redesign of Blockly–Electron has completed the simple iterative design without the cycle iterative design. The subsequent research will take the cycle iterative design as one of the research directions.

3.2. USE Questionnaire and Participants and Multiple Linear Regression

As stated above, the USE Questionnaire is a standard scale developed by Arnold Lund in 2001, which is usually used to evaluate subjective reactions to the usability of a product or application. In our research, the USE questionnaire was used during the first (discovery) phase of the UCD method in the process of Blockly–Electron user interface redesign. Overall, the 73 participants that completed the USE questionnaire are from the Chaozhou School Affiliated with South China Normal University. Thirty-eight students are in the first grade of junior high school, and the others are in the second grade. Before filling out the USE questionnaire, they learned knowledge related to graphic programming by using Blockly–Electron to finish related practice cases in a lesson named “Getting Started with Programming—Introduction to Graphical Programming”. A quantitative research method was used to analyze the results of the USE questionnaire, respectively, descriptive statistics and multiple linear regression. We will explore the relationship between satisfaction and ease of use, ease of learning and usefulness through linear regression methods.

4. Result

In the previous chapter, the hybrid research method used in the study was systematically elaborated. In this section, the results from different stages of the hybrid research methodology will be presented, including qualitative results from qualitative studies and quantitative data results from descriptive or inferential analyses of the USE scale results.

4.1. Discovery

In this phase, two steps of our study were organized. Firstly, we searched some related literature and projects concerning previous study structures as well as the target user information of the app we developed. Additionally, then, the results in this step were summarized in two parts. One is the search and summary of the literature from previous relevant studies (elaborated in the literature review section), and the other is an analysis of the same type of project, the specific results of which are shown in Figure 2 below. In addition, we administered a questionnaire to 73 middle school students. We excluded incomplete questionnaires and those showing obvious regularity and lacking certain answers. Finally, 50 questionnaires were analyzed by SPSS. The participants used our app to finish some practice courses related to AIE before completing the USE questionnaire. Thirty questions belonging to four aspects of usability were included in this questionnaire. The results taken from it show that the item of ‘I can use it without written instructions’ achieved the lowest mean of the thirty items, with just 4.16. At the same time, the mean of Ease of Use was only 5.36, which is the lowest of the four aspects of usability. The rest of the data concerning this descriptive analysis are detailed in Table 2 below.

4.2. Definition

The user persona of our product generated from our research is shown in Figure 3. Additionally, then, for the data collected from the USE questionnaire, we administered multiple linear regression statistics. The independent variables are Usefulness, Ease of use, and Ease of Learning, while Satisfaction is categorized as a dependent variable. This paper uses a causal research design that aims to analyze the relationship between one variable with another variable. The causal design is used to empirically analyze the variables that affect user satisfaction, that is, the Usefulness, Ease of Use, and Ease of Learning based on the USE Questionnaire.
Before conducting the multiple linear regression for Usefulness, Ease of Use, Ease of Learning, and Satisfaction, the linear relationships between the three independent variables and dependent variables need to be determined. In addition, a correlation analysis between the four variables was also performed. Figure 4 below shows scatterplots of the three independent variables versus Satisfaction. According to Figure 4, the three independent variables all have a certain linear relationship with the satisfaction of the dependent variable, which meets one of the conditions for regression analysis. Table 3 shows the correlation analysis among the four variables: Usefulness, Ease of Use, Ease of Learning, and Satisfaction. According to Table 3, there is a high correlation between Usefulness, Ease of Use, Ease of Learning, and Satisfaction (p < 0.01, Pearson: 0.621, 0.686, and 0.559). The high correlation between the independent variable and the dependent variable allows further regression analysis to be performed. However, it is worth noting that in the correlation detection of the four variables, Usefulness and Ease of Use are highly correlated (p < 0.01, Pearson: 0.802), indicating that these two variables are not suitable for synchronous regression analysis together; that is, the regression model may have high collinearity. As a result, we performed several regression analyses below to examine how Usefulness, Ease of Use, and Ease of Learning actually affect Satisfaction.
In the regression test, we conducted a total of eight linear regression tests. As shown in Table 4, in the first regression analysis, with Satisfaction as the dependent variable and Usefulness, Ease of use, and Ease of Learning as the independent variables, the adjusted R-square value of the regression model is 0.483, indicating that the above independent variables can explain 48.3% of the variation of the dependent variable of Satisfaction. The value of the Durbin–Watson coefficient is 1.825, meeting the range of 0 to 4, and the data independence meets the requirements. Then, variance analysis was conducted on the model, F = 16.263, p < 0.001, indicating that at least one independent variable explained part of the changes in the dependent variables, which made the regression variable larger and reduced the residual, and the model was successfully established. However, when the regression coefficients of independent variables were calculated, the results showed that the p-values of Usefulness, Ease of Use, and Ease of Learning were all greater than 0.05 (Usefulness p = 0.2, Ease of Use p = 0.071, Ease of Use p = 0.098), indicating that the regression coefficients of the variables in the model were not statistically significant.
Based on the above results, we speculate that there is a mediating variable among the three independent variables of Usefulness, Ease of Use, and Ease of Learning, which will affect the significance of the other two variables when the regression analysis is conducted. Since we have just found a strong correlation between Usefulness and Ease of Use in our correlation tests, we speculate that Ease of Use plays a role as a mediator variable in this model. In the next seven regression analyses, we tried to test this hypothesis. Firstly, we identified three independent variables that could predict satisfaction in the second to fourth regression tests. Later, in the fifth to seventh regression analyses, we combined the independent variables in pairs and continued the regression analysis with Satisfaction as the dependent variable. The results show that when Ease of Use is one of the independent variables, the significance of the other independent variable (Usefulness or Ease of Learning) will decrease significantly. Finally, in the eighth regression analysis, Ease of Use was taken as the dependent variable and Usefulness and Ease of Learning as the independent variable of the regression test. The results show that the adjusted value of R square is 0.717, indicating that the above independent variable can explain the 71.7% change in the dependent variable, and the variance analysis of the model and the significance test of the coefficient have passed. The detailed results of these eight linear regression tests are shown in Table 4 below.
In summary, we find that Ease of Use plays a mediating role in the regression model of Satisfaction. Usefulness and Ease of Learning first affect Ease of Use changes, and then Ease of Use affects Satisfaction. Therefore, the model mainly consists of two regressions. Figure 5 below shows the frequency histogram of standardized residuals and the scatter plots of standardized predicted values and standardized residuals of the two regression analyses, respectively. According to Figure 5, the residuals of the two regressions are approximately subject to a normal distribution and meet the homogeneity of variance. Based on the above results and corresponding analysis, the regression equations of the two regressions in this model can be derived as follows:
Y = −0.439 + 0.329 X1 + 0.739 X2
where: Y = Ease of Use; X1 = Ease of Learning; X2 = Usefulness
Y = 2.304 + 0.654 X
where: Y = Satisfaction; X = Ease of Use
Based on the results of the multiple regression analysis described above, several items that can be used to make a list of requirements for the software can be summarized. According to the results of linear regression, user satisfaction with the software is directly affected by the ease of use, and the ease of use of the software is directly affected by the ease of learning and usefulness of the software. Therefore, in combination with the problem settings of the three independent variables in the USE questionnaire used in this study and the results of regression, we can obtain a list of user requirements with three dimensions. The highest dimension is Satisfaction, which is relatively abstract and difficult to use as a direct requirement for UI design. The second dimension is Ease of Use, which belongs to the intermediate dimension, and the requirements of this dimension can be further refined by the Ease of Learning and Usefulness dimension. Finally, the user needs of the dimension of ease of learning and usefulness; this dimension is the most direct UI design requirement and based on the first regression equation, it can be seen that usefulness is more important than ease of learning for ease of use, so in the actual design, the user demand for usefulness should be higher than the ease of learning. Details of the list of requirements for the three dimensions can be found in Table 5 below. Table 5 shows the user requirements summarized according to the results taken from the USE questionnaire and linear regression analysis and the specific design directions corresponding to different user needs. The details relating to software development and design are explained in detail in the development phase below.

4.3. Development

Based on the above two stages of work, especially the specific design improvement direction in Table 5, which is translated from the real feedback of users after using existing products, we were able to carry out the redesign and development of our product, the graphical programming software Blockly–Electron for artificial intelligence education in primary and secondary schools. It is worth noting that in this phase, we integrate the iterative improvement design based on user feedback mentioned in the user-centered design approach into the design process. The simple iterative design here is aimed at several teachers who use the software because the user groups of the product can be roughly divided into primary and secondary school students and their teachers, so the user opinions of teachers also need to be considered.
We made a new design for the Blockly–Electron software user flow. Among them, we mainly undertook the following. First, according to the needs of users, we have simplified the interaction process of the entire software, trying to make the interaction of the software more in line with user habits; second, the overall functional system of the software is examined, and the advantages of similar products on the market are learned, and the functions that should be added to the software are discussed. Third, present the new user flow to teachers, receive their opinions, and continue to refine the user flow. Through the above steps, a new user flow of the software, as shown in Figure 6, was developed. The user process of the software Blockly–Electron can be roughly divided into three steps. In the first stage, first-time users will be asked to register a personal account and fill in the corresponding pre-registration code, which is provided to the user after the user pays for the software. Then, the user enters the software entry selection page of “AI hardware learning” and “AI simulator learning”. In the software interface of “AI hardware learning”, the students mainly learn and write corresponding code instructions through the software to control AI-related hardware modules, and our laboratory also developed matching hardware to achieve the teaching goal of artificial intelligence popular science learning. In the software interface of “AI simulator learning”, the students also learn and write code, but the difference is that the student’s code is used to control specific virtual characters or objects in the software to simulate behavior. It is worth noting that the content of this set of user interfaces of “AI simulator learning” is also proposed in the redesign of the Blockly–Electron software interface, but the object of this research is mainly to redesign the software interface in “AI hardware learning”. In the second stage, on the main page of “AI hardware learning”, users can perform two operations, one is to update the programming environment by downloading and uninstalling python libraries; the second is to choose the block mode or the coding mode to write code commands. In the third stage, the finished code can be executed in two save modes, one is to download it to the user’s computer, and the other is to upload it to the cloud we developed.
Based on the user flowchart, we further redesigned the low-fidelity prototype of the software, as shown in below Figure 7a. In this process, we implement user needs according to some interaction design principles that improve the user experience. The serial position effect is a psychological phenomenon that consists of two parts: The Primacy Effect and The Recency Effect. The series position effect theory states that users are more likely to remember the first term (first cause effect) and last term (Recency Effect) that appear in a series. Accordingly, we have specially arranged the various functional items in the main interface of Blockly–Electron in a new position, placing the more important modules of the software in the upper left and lower right corners of the entire interface. Because the common reading habits of Chinese users are from left to right, from top to bottom, according to the series of position effect theory, the items placed in the upper left and lower right corners can obtain more attention and memory. Hick’s law states that when people are faced with a choice, their reaction time depends on the number of choices, expressed in the equation RT = K log 2(N + 1), where RT is the reaction time, K is constant, and N is the number of possible choices. The implication that can be drawn from the application of interaction design is that when the software provides choices that let the user choose to achieve interaction, the options that appear in the user’s decision are reduced as much as possible, and the complexity of the options is reduced as much as possible when there are already multiple options. In this regard, when we redesigned the user interface of the Blockly–Electron software, we simplified some selection pages with many entries, especially the initial login page, and we merged unnecessary items as much as possible without affecting the functionality, simplifying the description of the original items.
Subsequently, we further designed and developed the medium-fidelity prototype of Blockly–Electron based on the user’s needs and the analysis of the design. As mentioned above, in order to improve the user experience of this software, we applied some theoretical principles to the design practice. During the design of the medium-fidelity prototype, we also followed this working idea, combining classical theory and actual user needs for design practice. First, we reintegrated the visual style of the overall software interface and the consistency of the way it interacts based on the principle of consistency. There are often multiple components (different functional components, visual elements, signs, etc.) in a piece of software. The principle of consistency states that visual and interaction design goals need to be consistent between different components. For example, this software takes primary and secondary school students as the target users and simplifies the interface logic as one of the design goals, and then the goal needs to be implemented as a whole, not just a part. At the same time, the visual appearance of elements also needs to be consistent, and the appearance of interactive elements often affects the user’s interaction effect. A consistent look and feel of the same software go a long way toward keeping the user focused and improving interactions. Psychologist Max Wertheimer’s succinct approach argues that in order to make it easier to understand the world, humans filter and simplify the vast amount of information they receive. The law of simplicity is the cornerstone and program of all Gestalt design principles and is the most fundamental principle of Wertheimer’s perceptual law. Studies have shown that our brains are good at recognizing complex information and processing it into simpler forms, good at giving priority to identifying the outline, shape, and whole of objects or pictures, and good at linking meaningless, abstract, and unfamiliar parts with some commonality to form meaningful, concrete and familiar things, greatly reducing the processing pressure on the brain. It is also the most instinctive information processing mode used by human beings, so our design has a solid theoretical and biological foundation; therefore, the law of simplicity has great guiding significance for our design. Under the influence of the law of simplicity, almost all the interfaces we see show certain geometric laws, and the vast majority of components/controls in the interface, whether it is real geometry or not, will present the impression that it is geometric in the brain. In all geometries, the order of the identified loads is roughly circular ≈ rectangular ≤ convex polygons < concave polygons. In 1995, Hitachi Design Center researchers Massaki Kurosu and Kaori Kashimura conducted detailed user experience tests on 252 participants using 26 different ATM interfaces and evaluated the determinants of apparent usability in the interface, such as digital key layout, operating procedures, etc. [59]. It turns out that many of these factors have little impact on real usability, but the impact of interface aesthetics on real usability is unexpectedly large, which also explains that the classical design theory of beauty is easy to use. The design principle is that when the interface is designed to be beautiful enough, users tend to tolerate minor, low-impact usability issues. One problem that must be pointed out here is that when users tolerate some more subtle usability problems because of the beauty of the interface, it does not mean that the problem disappears. Therefore, this suggests that it is not advisable to pursue only visual aesthetics and ignore usability, and vice versa. We should avoid the two extremes of good but ugly or beautiful but difficult to use, and choosing the most reasonable balance between the two is the key to solving this problem. Figure 8 is a comparison of the old and medium prototype home pages of Block–Electron. The three parts marked with red circles in the main interface of the old version have significant sustainability problems. First of all, the position of functional components in the top menu of the software in part A is not reasonable. The “View, function, about, update” button needs to be optimized, the top menu is not refined from the user’s operation logic, and the visual movement line and visual focus of the software are not clear. In this redesign, we observed the behavior of users when using the software and, combined with the relevant results of the above research as the basis, redesigned this part to achieve better usability and aesthetics. Secondly, there are two main problems with the design of Part B. First, the visual style is not unified. The thickness and design style of icons are messy, the rounded corners of button components are not unified, and the font and font size are not unified in style. The overall visual design is relatively trivial. It is worth noting that this problem is present throughout software UI design, but it is evident in this case and will be shown. Second, the color system is chaotic. Figure 9 shows the display of the building block library and its expanded secondary menu. It can be found that there are few connections between colors at different levels of classification, and too messy colors make the visual level unclear, leading to poor usability and affecting the overall visual perception. Finally, the problem with the design of part C is that the location of the output panel seriously occludes the display of the main functional areas, and the overall regional proportion of the software is not coordinated. In the redesign, we merged the output panel with the python source area on the right because, from an interactive logic perspective, users have a standard left-to-right approach when writing programs. Take out the blocks that need to be used from the building block library on the left, drag them to the middle workspace to combine them, and then view the python source code represented by the building blocks and their output results on the right. At this point, the medium-fidelity prototype of the key page has been redesigned, and the design of other pages is similar to the redesign process of this page. After that, we present the medium-fidelity prototype (Figure 7b) to the teachers who use the software for artificial intelligence education for evaluation.

4.4. Deliverable

The Blockly–Electron user interface redesign moved into the design and delivery phase of high-fidelity prototypes. At this stage, a simple iterative design will be used, and user flow, low- and medium-fidelity prototypes designed according to the user requirements obtained from the previous research steps will be presented to the relevant teachers for evaluation to obtain feedback on the shortcomings; we will make improvements, and then present the results. This process will be cycled until the teachers participating in the assessment are satisfied. Table 6 is a summary of teachers’ feedback, which mainly consists of three parts. The first is that the main color of blue and purple is easy to cause visual fatigue feedback. According to the principle of color and vision, generally speaking, compared with yellow, red, blue, and other bright lights, green light is absorbed more and has less refraction; therefore, the stimulation of the human eye is correspondingly smaller, so due to the long-term visual characteristics of green, visual fatigue is not as easily produced than with other colors. Therefore, in the iterative design, we changed the dominant color from blue-violet to green. Second, for the run and clear buttons on the right side of the main interface, due to the overall consistency of the design, they were placed in the same rounded rectangle range, easily leading to confusion in relation to the interactions. Therefore, we then added a small rectangle bar between the two keys as a visual identification distinction so as to enhance recognition and reduce interaction pressure while maintaining the consistency of the design. The third is the feedback related to all the second-level menu connections in the left block library. Teachers believe that the essence of classifying blocks with different functions is to quickly identify and select them. However, if the second-level menus under all categories are connected together and the interaction is carried out through mouse scrolling, it is very easy to miss the corresponding options when the mouse slides quickly, which requires repeated sliding back and forth to increase the selection time. In this regard, in the improved design, we store the blocks in each second-level menu of the building block library separately. When selecting blocks with different functions, we must classify them accordingly by the left mouse button and enter the second-level menu for selection. Figure 7c below shows a high-fidelity prototype after a simple iterative design, which continues to be presented to teachers for evaluation. This time, the feedback was positive, which meant that the drawings were well received by the teachers, and then we delivered the high-fidelity prototype to the program development team. At this point, the redesign of the Blockly–Electron software user interface was complete.

5. Discussion and Limitation

In the previous section, the qualitative and quantitative results of this study are presented one by one. In this section, the entire study will be summarized and discussed, followed by a Horizontal comparative analysis with similar projects to summarize the contributions and limitations. Based on the summary and analysis of previous studies, we define the overall research framework. In the introduction, we identify specific research directions through a problem-oriented format. Below we also discuss the work conducted in the overall study through the following questions.
(1)
When AI education is gradually popularized in schools, how should the teaching software design meet the user needs of students, especially for primary and secondary schools?
For this question, a user-centered structural design method, including quantitative research, iterative design and qualitative evaluation, is proposed. The proposed methodology is a theoretical hypothesis based on previous relevant research related to the design and production of artificial intelligence educational software, which was subsequently applied to the redesign of the user interface of Blockly–Electron to verify its feasibility and usefulness.
(2)
When the user-centered design concept is used in the design of artificial intelligence educational software for primary and secondary schools, how should it be optimized according to the specific scenario and user characteristics?
In this research, this part of the content is primarily obtained through qualitative and quantitative research methods, such as literature reviews, research on the similar user group products, and questionnaire surveys for specific users, etc., to obtain relevant information to support design and development work. It is worth noting that Blockly–Electron is a teaching software for artificial intelligence courses that is currently not being used on a large scale, so although the functional framework of the entire software exists at this stage, there are still some limitations that need to be discovered and improved.
(3)
Usability is one of the cores of a user-centered approach, but how can abstract usability be scientifically and effectively improved in design practice?
For this problem, we obtain the influencing relationships between the relevant factors through the quantitative analysis method on the basis of experts’ specific usability characteristics. Arnold Lund divides usability into four dimensions: “Ease of Learning”, “Ease of Use”, “Usefulness” and “Satisfaction” [33]. We believe that there is a further influencing relationship between these four factors, so we define it as four variables for analysis. From the data analysis results in the previous chapter, we found the relationship between these four dimensions: “Satisfaction” is significantly affected by the other three dimensions, and in this influence relationship, the “Ease of Use” variable has a mediating effect, that is, “Ease of Learning” and “Ease of Use” significantly affect the impact of “Ease of Use”, and then “Ease of Use” significantly affects “Satisfaction”. Overall, this finding has guiding significance for researchers and designers in the practice of usability improvement.
Many scholars have conducted similar studies, and we compared the two types of studies using the UCD method to improve software design and using the USE scale to analyze usability. On the one hand, by comparing the previous studies that use the UCD method to improve software design, we can find that our research paid more attention to the diversity of user research methods. Couture et al., mainly use qualitative usability test sessions with related task objectives to conduct software usability testing to analyze users needs [30]. Nguyen et al., conducted qualitative interviews to assess provider needs [31]. The method used by Jie et al., to obtain the characteristics of the target users obtains the general characteristics of the users mainly through the literature and then induction and analysis are conducted [32]. Duvaud et al., obtained relevant information mainly in the form of qualitative analysis related to the usability, usage statistics of the website, user behavior, and similar competitors to support the subsequent design [19]. In contrast to the above studies, our study emphasizes the importance of questionnaires to obtain quantitative data while retaining qualitative analysis methods, such as literature and competitor analysis. However, there are certain shortcomings in our research methodology, which will be discussed in detail below.
On the other hand, statements about past studies using the USE scale have been summarized in the literature review section and will not be repeated here. As mentioned above, previous studies have used the USE scale more as a consequential judgment tool, simply evaluating usability through descriptive analysis of the surface results of the scale but lacking more specific guidance for further usability improvement. Our study further analyzes the relationship between several dimensions on the basis of the surface results of the scale and finally finds the influential relationships between the four dimensions. Of course, this finding has some limitations that need to be clarified.
Regarding several limitations of the study, we must carefully and deeply reflect on it and avoid the same problems in the next phase of the research of the software. First, as mentioned above, although the study attempts to emphasize quantitative analysis to enhance the diversity of research methods based on the previous focus on qualitative analysis, there are actually many different types of judgment methods in the industry and academia for the acquisition of quantitative data, that is, the measurement of usability indicators. In this study, only the USE scale was selected for measurement, and there was a certain risk of error, and the probability of error should be further reduced by introducing other scales, such as SUS, QUIS, CSUQ, and other scales. However, the main use of the USE scale also has relevant reasons; as mentioned above, we want to explore more specific indicators related to usability and their impact relationship, and the division of usability is more in agreement with the dimension division of the USE scale, so we conducted in-depth analysis and research on its basis. In this regard, we feel that this can be carried out in the next phase of the study while maintaining the use of the USE scale but also introducing other scales to compare the overall usability of the data and control the difference to a small range.
Second, although the results of this in-depth study of usability metrics are exciting (providing designers and researchers with a deeper understanding of usability), it is worth noting that the sample size of the results is insufficient (n = 73), reducing the persuasiveness of the findings. This is why in the first regression test, Ease of Use, Ease of Learning, and Usefulness were taken as independent variables, and Satisfaction was taken as a dependent variable; the collinearity VIF value did not exceed the normal range. We speculated that the sample size was insufficient, so the value was not obvious. In addition, due to a lack of information, 23 questionnaires were eliminated in the cleaning stage because the answers to these questionnaires had partial or overall gaps and strong regularity, which led to a very large questionnaire loss rate. We must reflect deeply on this, and in the next stage of the study, we must expand the size of the overall sample to reduce the impact of questionnaire loss and emphasize the importance of carefully filling out the questionnaire to the children without affecting their independent judgment.
Third, in the design process of this study, the simple iterative design process only included teachers in the iterative evaluation. In theory, random sampling should be carried out on both sides of teachers and students, and then the number of teachers and students should be determined according to the ratio of the total number of teachers and students so as to further strengthen the emphasis on the opinions of students.
Fourth, this study was conducted in China, and the participants were all Chinese, and future studies should ensure that references are provided for the same type of problems across different regions. In this regard, we reflect on this, and think that the key to strengthening the universality of the study should be to pay more attention to the commonality of students of this age when extracting the relevant characteristics of the target users during the study and excluding characteristics due to the influence of context as much as possible. This is reflected in the specific analysis. More hypotheses concerning the control variables can be made and verified by comparing the corresponding analysis results so as to draw more universal conclusions.
Overall, as with most studies, this is not a perfect study, but, several key questions have been studied according to the methods of systems science, and some relevant results have been obtained to help solve these problems. The specific conclusions and contributions of the study are presented in detail in the next section.

6. Conclusions

This study takes the redesign of the user interface of the AI teaching software Blockly–Electron as an example to explore the application of improved user-centered design methods in the field of AI educational software design. According to the results, this method is feasible to a certain extent, but if it is to be widely promoted and used, the verification of more practice applications needs to be carried out, which is also one of the directions of subsequent research. The deliverables generated in the whole practice process, such as user persona, competitive product analysis, prototype diagrams and other data, can provide a reference for practice or research similar to this project to a certain extent. Based on the four usability variables discovered by Arnold Lund [31], this study also found a new relationship among them. It was found that in the relationship between Usefulness, Ease of Learning, Ease of Use, and Satisfaction, Ease of use was the mediation variable mainly affected by Usefulness and Ease of Learning, and then Ease of Use affected Satisfaction. The relationship model provides insight into this abstract feature of usability. If only a simple numerical evaluation results, in fact, the design of the targeted optimization is not helpful. All software is designed with the intention of improving user satisfaction, but the specific means of how this is undertaken is key. When we know that an increase in software ease of use significantly increases satisfaction, then software ease of use is a more specific optimization direction than satisfaction. By the same token, ease of use can be improved by improving usefulness and ease of learning. The gradual and deep traceability also means that the design can be optimized to a more specific and detailed point so as to create good software. Therefore, new discoveries can help designers identify specific directions to improve software usability in design practices. In addition, in view of the two problems mentioned above, namely the specific methods of AI education software design and the practices when user-centered design methods target primary and secondary school students, this study can be used as a relevant case as a reference, especially for the dependence of AI education on software and the diverse personalities of primary and secondary school students, more targeted and effective relevant practices need to be adopted to support the design process. Finally, this research is only one stage; the next stage of the software will be put into a larger range of specific practice while setting relevant tests to determine whether to perform circular, iterative design and further improve the user-centered design method for artificial intelligence education software for primary and secondary school students.

Author Contributions

Conceptualization, C.C. and T.J.; methodology, G.L. and K.L.; software, C.C. and L.L.; validation, K.L. and Q.X.; formal analysis, C.C. and T.J.; investigation, C.C., L.L. and Y.L.; resources, C.C., L.L. and Y.L.; data curation, Q.X.; writing—original draft preparation, C.C. and G.L.; writing—review and editing, T.J. and Q.X.; visualization, C.C., L.L. and Y.L.; supervision, G.L. and T.J.; project administration, C.C. and T.J.; funding acquisition, T.J. and Q.X. All authors have read and agreed to the published version of the manuscript.

Funding

This research received no external funding.

Institutional Review Board Statement

Not applicable.

Informed Consent Statement

Informed consent was obtained from all subjects involved in the study.

Data Availability Statement

Not applicable.

Acknowledgments

AI teaching software Blockly–Electron developed by the School of Information and Optoelectronic Science and Engineering of South China Normal University, invited our research team to redesign its user interface. During this redesign process, our team gradually developed the conceptualization and interest of this research and successfully completed this research. We have to thank Zhun Zhang and Qiongxiong Ma, as they provided this platform and opportunity for us and inspired our team to complete this research. We would also like to thank Yan Chen’s crucial recommendation to the School of Information and Optoelectronic Science and Engineering.

Conflicts of Interest

The authors declare no conflict of interest.

References

  1. Russell, S.J. Artificial Intelligence a Modern Approach; Pearson Education Limited: Harlow, UK, 2022. [Google Scholar]
  2. EDUCAUSE. 2021 EDUCAUSE Horizon Report Teaching and Learning Edition. Available online: https://library.educause.edu/-/media/files/library/2021/4/2021hrteachinglearning.pdf?la=en&hash=C9DEC12398593F297CC634409DFF4B8C5A60B36E (accessed on 8 February 2023).
  3. EDUCAUSE. 2022 EDUCAUSE Horizon Report Teaching and Learning Edition. Available online: https://library.educause.edu/-/media/files/library/2022/4/2022hrteachinglearning.pdf?la=en&hash=6F6B51DFF485A06DF6BDA8F88A0894EF9938D50B (accessed on 8 February 2023).
  4. Huang, X. Aims for cultivating students’ key competencies based on artificial intelligence education in China. Educ. Inf. Technol. 2021, 26, 5127–5147. [Google Scholar] [CrossRef]
  5. Zawacki-Richter, O.; Marin, V.I.; Bond, M.; Gouverneur, F. Systematic review of research on artificial intelligence applications in higher education-where are the educators? Int. J. Educ. Technol. High. Educ. 2019, 16, 1–27. [Google Scholar] [CrossRef] [Green Version]
  6. Tegmark, M. Life 3.0: Being Human in the Age of Artificial Intelligence; Penguin Books: London, UK, 2018. [Google Scholar]
  7. Bian, Y.; Lu, Y.; Li, J. Research on an Artificial Intelligence-Based Professional Ability Evaluation System from the Perspective of Industry-Education Integration. Sci. Program. 2022, 2022, 4478115. [Google Scholar] [CrossRef]
  8. Boom, K.-D.; Bower, M.; Siemon, J.; Arguel, A. Relationships between computational thinking and the quality of computer programs. Educ. Inf. Technol. 2022, 27, 8289–8310. [Google Scholar] [CrossRef]
  9. Buitrago Florez, F.; Casallas, R.; Hernandez, M.; Reyes, A.; Restrepo, S.; Danies, G. Changing a Generation’s Way of Thinking: Teaching Computational Thinking Through Programming. Rev. Educ. Res. 2017, 87, 834–860. [Google Scholar] [CrossRef]
  10. Antonio Rodriguez-Martinez, J.; Antonio Gonzalez-Calero, J.; Manuel Saez-Lopez, J. Computational thinking and mathematics using Scratch: An experiment with sixth-grade students. Interact. Learn. Environ. 2020, 28, 316–327. [Google Scholar] [CrossRef]
  11. Rose, S.P.; Habgood, M.P.J.; Jay, T. Designing a Programming Game to Improve Children’s Procedural Abstraction Skills in Scratch. J. Educ. Comput. Res. 2020, 58, 1372–1411. [Google Scholar] [CrossRef]
  12. Bau, D.; Gray, J.; Kelleher, C.; Sheldon, J.; Turbak, F. Learnable programming: Blocks and beyond. Commun. ACM 2017, 60, 72–80. [Google Scholar] [CrossRef] [Green Version]
  13. Feng, A.; Gardner, M.; Feng, W.-C. Parallel programming with pictures is a Snap! J. Parallel Distrib. Comput. 2017, 105, 150–162. [Google Scholar] [CrossRef]
  14. Saez-Lopez, J.M.; Del Olmo-Munoz, J.; Gonzalez-Calero, J.A.; Cozar-Gutierrez, R. Exploring the Effect of Training in Visual Block Programming for Preservice Teachers. Multimodal Technol. Interact. 2020, 4, 65. [Google Scholar] [CrossRef]
  15. Su, Y.-S.; Shao, M.; Zhao, L. Effect of Mind Mapping on Creative Thinking of Children in Scratch Visual Programming Education. J. Educ. Comput. Res. 2022, 60, 906–929. [Google Scholar] [CrossRef]
  16. Yi, M.; Wang, Y.; Tian, X.; Xia, H. User Experience of the Mobile Terminal Customization System: The Influence of Interface Design and Educational Background on Personalized Customization. Sensors 2021, 21, 2428. [Google Scholar] [CrossRef]
  17. Cruz, Y.P.; Collazos, C.A.; Granollers, T. The thin red line between usability and user experiences. In Proceedings of the XVI International Conference on Human Computer Interaction, Vilanova i la Geltru, Spain, 7–9 September 2015; pp. 1–2. [Google Scholar]
  18. ISO 9241-11:2018(en); Ergonomics of Human-System Interaction—Part 11: Usability: Definitions and Concepts. ISO: Geneva, Switzerland, 2018. Available online: https://www.iso.org/obp/ui/#iso:std:iso:9241:-11:ed-2:v1:en (accessed on 8 February 2023).
  19. Duvaud, S.; Gabella, C.; Lisacek, F.; Stockinger, H.; Ioannidis, V.; Durinx, C. Expasy, the Swiss Bioinformatics Resource Portal, as designed by its users. Nucleic Acids Res. 2021, 49, W216–W227. [Google Scholar] [CrossRef]
  20. Norman, D.A.; Draper, S.W. User Centered System Design: New Perspectives on Human-Computer Interaction; Erlbaum: Hillsdale, NJ, USA, 1986. [Google Scholar]
  21. Norman, D.A. The Psychology of Everyday Things; Basic Books: New York, NY, USA, 1988. [Google Scholar]
  22. De Troyer, O.M.F.; Leune, C.J. WSDM: A user centered design method for Web sites. Comput. Netw. Isdn Syst. 1998, 30, 85–94. [Google Scholar] [CrossRef]
  23. Gabbard, J.L.; Hix, D.; Swan, J.E. User-centered design and evaluation of virtual environments. IEEE Comput. Graph. Appl. 1999, 19, 51–59. [Google Scholar] [CrossRef] [Green Version]
  24. Pagulayan, R.J.; Keeker, K.; Wixon, D.; Romero, R.L.; Fuller, T. User-centered design in games. In The Human-Computer Interaction Handbook; CRC Press: Boca Raton, FL, USA, 2002; pp. 915–938. [Google Scholar]
  25. Schreuder, M.; Riccio, A.; Risetti, M.; Dähne, S.; Ramsay, A.; Williamson, J.; Mattia, D.; Tangermann, M. User-centered design in brain–computer interfaces—A case study. Artif. Intell. Med. 2013, 59, 71–80. [Google Scholar] [CrossRef] [Green Version]
  26. Moquillaza, A.; Molina, E.; Noguera, E.; Enríquez, L.; Muñoz, A.; Paz, F.; Collazos, C. Developing an ATM interface using user-centered design techniques. In Proceedings of the Design, User Experience, and Usability: Understanding Users and Contexts: 6th International Conference, DUXU 2017, Held as Part of HCI International 2017, Vancouver, BC, Canada, 9–14 July 2017; pp. 690–701. [Google Scholar]
  27. Afrianto, I.; Guntara, R.G.; Iop. Implementation of User Centered Design Method in Designing Android-based Journal Reminder Application. In Proceedings of the 2nd International Conference on Informatics, Engineering, Science, and Technology (INCITEST)-Building Competitive Advantage to Face Industry 4.0, Bandung, Indonesia, 18 July 2019. [Google Scholar]
  28. Trilar, J.; Sobocan, T.; Duh, E.S. Family-Centered Design: Interactive Performance Testing and User Interface Evaluation of the Slovenian eDavki Public Tax Portal. Sensors 2021, 21, 5161. [Google Scholar] [CrossRef]
  29. Still, B.; Crane, K. Fundamentals of User-Centered Design: A Practical Approach; CRC Press: Boca Raton, FL, USA, 2017. [Google Scholar]
  30. Couture, B.; Lilley, E.; Chang, F.; Smith, A.D.; Cleveland, J.; Ergai, A.; Katsulis, Z.; Benneyan, J.; Gershanik, E.; Bates, D.W.; et al. Applying User-Centered Design Methods to the Development of an mHealth Application for Use in the Hospital Setting by Patients and Care Partners. Appl. Clin. Inform. 2018, 9, 302–312. [Google Scholar] [CrossRef] [PubMed] [Green Version]
  31. Nguyen, K.A.; Patel, H.; Haggstrom, D.A.; Zillich, A.J.; Imperiale, T.F.; Russ, A.L. Utilizing a user-centered approach to develop and assess pharmacogenomic clinical decision support for thiopurine methyltransferase. BMC Med. Inform. Decis. Mak. 2019, 19, 194. [Google Scholar] [CrossRef] [Green Version]
  32. Jie, L.-J.; Jamin, G.; Smit, K.; Beurskens, A.; Braun, S. Design of the user interface for “Stappy”, a sensor-feedback system to facilitate walking in people after stroke: A user-centred approach. Disabil. Rehabil.-Assist. Technol. 2020, 15, 959–967. [Google Scholar] [CrossRef] [PubMed]
  33. Lund, A.M. Measuring usability with the use questionnaire. Usability Interface 2001, 8, 3–6. [Google Scholar]
  34. Teruel, M.A.; Navarro, E.; Lopez-Jaquero, V.; Montero, F.; Gonzalez, P. A CSCW Requirements Engineering CASE Tool: Development and usability evaluation. Inf. Softw. Technol. 2014, 56, 922–949. [Google Scholar] [CrossRef]
  35. Vanmulken, D.A.M.M.; Spooren, A.I.F.; Bongers, H.M.H.; Seelen, H.A.M. Robot-assisted task-oriented upper extremity skill training in cervical spinal cord injury: A feasibility study. Spinal Cord 2015, 53, 547–551. [Google Scholar] [CrossRef] [PubMed] [Green Version]
  36. Kusumasari, D.; Junaedi, D.; Kaburuan, E.R. Designing an interactive learning application for ADHD children. In Proceedings of the 3rd Annual Applied Science and Engineering Conference (AASEC), Univ Pendidikan Indonesia, Bandung, Indonesia, 18 April 2018. [Google Scholar]
  37. Ridzky, D.; Effendy, V.; Junaedi, D. User Interface Modelling for SIBI (Sistem Isyarat Bahasa Indonesia/Indonesian Sign Language System) learning applications using the User-Centered Design Method. In Proceedings of the 2nd International Conference on Data and Information Science (ICoDIS), Bandung, Indonesia, 15–16 November 2018. [Google Scholar]
  38. Ulya, A.H.; Effendy, V.; Junaedi, D. User Interface Modelling of Sundanese Culture Introduction for Deaf Youth using User-Centered Design Method. In Proceedings of the 2nd International Conference on Data and Information Science (ICoDIS), Bandung, Indonesia, 15–16 November 2018. [Google Scholar]
  39. Gumay, M.R.A.; Effendy, V.; Junaedi, D. Modeling user interface design for panic button application for deaf people using user-centered design method. In Proceedings of the 3rd International Conference on Innovation in Engineering and Vocational Education (ICIEVE), Univ Pendidikan Indonesia, Bandung, Indonesia, 26 November 2019. [Google Scholar]
  40. Hardianto, Z.I.P.; Karmilasari. Analysis and Design of User Interface and User Experience (UI / UX) E-Commerce Website PT Pentasada Andalan Kelola Using Task System Centered Design (TCSD) Method. In Proceedings of the 2019 Fourth International Conference on Informatics and Computing (ICIC), Semarang, Indonesia, 16–17 October 2019; pp. 1–8. [Google Scholar]
  41. Priowibowo, B.; Effendy, V.; Junaedi, D. Designing user interface using user-centered design method on reproductive health learning for visual impairment teenagers. In Proceedings of the 3rd International Conference on Innovation in Engineering and Vocational Education (ICIEVE), Univ Pendidikan Indonesia, Bandung, Indonesia, 26 November 2019. [Google Scholar]
  42. Fatima, K.; Bawany, N.Z.; Bukhari, M.; IEEE. Usability and Accessibility Evaluation of Banking Websites. In Proceedings of the 12th International Conference on Advanced Computer Science and Information Systems (ICACSIS), Univ Indonesia, Fac Comp Sci, ELECTR NETWORK, Depok, Indonesia, 17–18 October 2020; pp. 247–255. [Google Scholar]
  43. Rizal, M.F.; Widodo, A.P.; Adi, K.; Riyanto, D.E.R.; Nurhayati, O.D. Usability testing mozita application based on use questionnaire model. J. Phys. Conf. Ser. 2020, 1524, 012104. [Google Scholar] [CrossRef]
  44. Shi, J.; Lo, B.; Wong, H.W.; Hollenberg, E.; Sanches, M.; Abi-Jaoude, A.; Chaim, G.; Cleverley, K.; Henderson, J.; Johnson, A.; et al. Assessing the usability and user engagement of Thought Spot-A digital mental health help-seeking solution for transition-aged youth. Internet Interv.-Appl. Inf. Technol. Ment. Behav. Health 2021, 24, 100386. [Google Scholar] [CrossRef]
  45. Hendra, S.; Arifin, Y. Web-based usability measurement for student grading information system. Procedia Comput. Sci. 2018, 135, 238–247. [Google Scholar] [CrossRef]
  46. Jiang, M.; Liu, S.; Gao, J.; Feng, Q.; Zhang, Q. Comprehensive Evaluation of User Interface for Ventilators Based on Respiratory Therapists’ Performance, Workload, and User Experience. Med. Sci. Monit. 2018, 24, 9090–9101. [Google Scholar] [CrossRef]
  47. Gonzalez-Landero, F.; Garcia-Magarino, I.; Lacuesta, R.; Lloret, J. PriorityNet App: A Mobile Application for Establishing Priorities in the Context of 5G Ultra-Dense Networks. IEEE Access. 2018, 6, 14141–14150. [Google Scholar] [CrossRef]
  48. Suzianti, A.; Belahakki, A. Redesigning User Interface of MRT Jakarta’s Mobile Application using Usability Testing Approach. In Proceedings of the 6th International Conference on Industrial and Business Engineering, Macau, Macao, 27–29 September 2020; pp. 73–78. [Google Scholar]
  49. Qu, J.; Zhao, Y.; Xie, Y. Artificial intelligence leads the reform of education models. Syst. Res. Behav. Sci. 2022, 39, 581–588. [Google Scholar] [CrossRef]
  50. Nesta. Educ-AI-tion Rebooted? Exploring the Future of Artificial Intelligence in Schools and Colleges. Available online: https://media.nesta.org.uk/documents/Future_of_AI_and_education_v5_WEB.pdf (accessed on 8 February 2023).
  51. Popenici, S.A.D.; Kerr, S. Exploring the impact of artificial intelligence on teaching and learning in higher education. Res. Pract. Technol. Enhanc. Learn. 2017, 12, 22. [Google Scholar] [CrossRef]
  52. Luckin, R.; Holmes, W.; Griffiths, M.; Forcier, L.B. Intelligence Unleashed: An Argument for AI in Education; Pearson: London, UK, 2016. [Google Scholar]
  53. Hsieh, Y.-Z.; Lin, S.-S.; Luo, Y.-C.; Jeng, Y.-L.; Tan, S.-W.; Chen, C.-R.; Chiang, P.-Y. ARCS-Assisted Teaching Robots Based on Anticipatory Computing and Emotional Big Data for Improving Sustainable Learning Efficiency and Motivation. Sustainability 2020, 12, 5605. [Google Scholar] [CrossRef]
  54. Fernandes, M.A.C. Problem-Based Learning Applied to the Artificial Intelligence Course. Comput. Appl. Eng. Educ. 2016, 24, 388–399. [Google Scholar] [CrossRef]
  55. Gonzalez-Carrillo, C.D.; Restrepo-Calle, F.; Ramirez-Echeverry, J.J.; Gonzalez, F.A. Automatic Grading Tool for Jupyter Notebooks in Artificial Intelligence Courses. Sustainability 2021, 13, 12050. [Google Scholar] [CrossRef]
  56. User-Centered Design Basics. Available online: https://www.usability.gov/what-and-why/user-centered-design.html (accessed on 19 November 2022).
  57. The Double Diamond: A Universally Accepted Depiction of the Design. Available online: https://www.designcouncil.org.uk/our-work/news-opinion/double-diamond-universally-accepted-depiction-design-process/ (accessed on 19 November 2022).
  58. Blomquist, Å.; Arvola, M. Personas in action: Ethnography in an interaction design team. In Proceedings of the Second Nordic Conference on Human-Computer Interaction, Aarhus, Denmark, 19–23 October 2002; pp. 197–200. [Google Scholar]
  59. Kurosu, M.; Kashimura, K.; IEEE. Determinants of the apparent usability. In Proceedings of the 1995 IEEE International Conference on Systems, Man and Cybernetics-Intelligent Systems for the 21st-Century, Vancouver, BC, Canada, 22–25 October 1995; pp. 1509–1514. [Google Scholar]
Figure 1. User-Centered Design Methodology.
Sustainability 15 05232 g001
Figure 2. Reference for product positioning and UI design for similar projects.
Sustainability 15 05232 g002
Figure 3. User persona.
Sustainability 15 05232 g003
Figure 4. Scatterplots of the three independent variables versus satisfaction.
Sustainability 15 05232 g004
Figure 5. Frequency histogram of standardized residuals, scatterplot of standardized residuals with standardized predicted values. (1) IV: Usefulness and Ease of Learning; DV: Ease of Use; (2) IV: Ease of Use; DV: Satisfaction.
Sustainability 15 05232 g005
Figure 6. User flow.
Sustainability 15 05232 g006
Figure 7. The UI prototype of Blockly–Electron. (a). Low-fidelity prototype; (b). Medi-um-fidelity prototype; (c). High-fidelity prototype of Blockly–Electron.
Sustainability 15 05232 g007
Figure 8. Home page comparison of the old and medium-fidelity prototype.
Sustainability 15 05232 g008
Figure 9. The block library and its secondary menu (original version).
Sustainability 15 05232 g009
Table 2. Descriptive statistics of the USE scale.
CategoryNQuestionnaire (Mean)Mean ± SD
Usefulness50Q1
6.28
Q2
5.52
Q3
6.06
Q4
5.04
Q5
5.14
Q6
5.06
Q7
5.10
Q8
5.04
5.41 ± 0.95
Ease of Use50Q9
5.54
Q10
5.22
Q11
5.80
Q12
5.20
Q13
5.04
Q14
4.80
Q15
4.16
Q16
5.88
Q17
6.00
Q18
5.44
Q19
5.92
5.36 ± 1.09
Ease of Learning50Q20
5.84
Q21
5.60
Q22
5.44
Q23
5.12
5.50 ± 1.09
Satisfaction50Q24
6.34
Q25
5.60
Q26
6.16
Q27
5.78
Q28
5.82
Q29
5.26
Q30
5.74
5.81 ± 1.03
Table 3. Inter-correlation of Usefulness, Ease of Use, Ease of Learning, and Satisfaction.
SatisfactionUsefulnessEase of UseEase of Learning
SatisfactionPearson10.6210.6860.559
Sig.(2-tailed) 0.0000.0000.000
UsefulnessPearson0.62110.8020.467
Sig.(2-tailed)0.000 0.0000.001
Ease of UsePearson0.6860.80210.632
Sig.(2-tailed)0.0000.000 0.000
Ease of LearningPearson0.5590.4670.6321
Sig.(2-tailed)0.0000.0010.000
Table 4. The result of several regression test.
Regression ModelAdjusted R SquareD-WSig.
(ANOVA)
Sig. (Coefficients)VIF
(1) DV: Satisfaction
IV: Usefulness
Ease of Use
Ease of Learning
0.4831.8250.0000.200
0.071
0.098
2.826
3.680
1.677
(2) DV: Satisfaction
IV: Usefulness
0.3731.5810.0000.0001.000
(3) DV: Satisfaction
IV: Ease of Use
0.4601.7460.0000.0001.000
(4) DV: Satisfaction
IV: Ease of Learning
0.2902.0260.0000.0001.000
(5) DV: Satisfaction
IV: Usefulness
Ease of Use
0.4631.7000.0000.261
0.004
2.805
2.805
(6) DV: Satisfaction
IV: Usefulness
Ease of Learning
0.4571.8710.0000.000
0.006
1.278
1.278
(7) DV: Satisfaction
IV: Ease of Use
Ease of Learning
0.4751.8710.0000.124
0.000
1.665
1.665
(8) DV: Ease of Use
IV: Ease of Learning
Usefulness
0.7172.0250.0000.000
0.000
1.278
1.278
Table 5. User Requirement list.
Usefulness and Ease of LearningMeanSpecific Design Methods
1. It should be more productive.5.52Reorganize the software’s workflow.
Added some useful features that were not there before.
Simplify the use of features.
Reduce the number of steps.
2. It should be more useful.6.06
3. It should be more effective6.28
4. It should be skillful quickly.5.12
5. It should be learned easily.5.44
6. It should be remembered easily.5.60
7. It should be learned quickly.5.84
Ease of Use:
1. It should be more effortless.4.80Design clear how-to tips and help messages.
Unify the overall visual style and improve the hierarchical recognition system of colors, graphics and fonts.
2. It should be flexible.5.04
3. It should have the fewest steps.5.20
4. It should be simpler.5.22
5. It should be user-friendly.5.80
Satisfaction:
1. It should be pleasant to use.5.74Rearrange functional locations and regional ranges according to the use frequency and importance of the function.
2. It should be wonderful.5.82
3. It should be fun to use.6.16
Table 6. Summary of teachers’ feedback.
Collation of Teachers’ Feedback
1. The color combination in the interface meets the aesthetic requirements, but the blue-violet color under prolonged use makes the eyes very prone to fatigue
2. The distinction between the Run and Clear buttons on the right side of the main interface is somewhat blurred, and it takes more time to avoid accidental touches when using.
3. The second-level menu expanded for each category item in the library is interconnected, giving users more time to swipe repeatedly, as mouse swipes often go beyond the scope of the search.
Disclaimer/Publisher’s Note: The statements, opinions and data contained in all publications are solely those of the individual author(s) and contributor(s) and not of MDPI and/or the editor(s). MDPI and/or the editor(s) disclaim responsibility for any injury to people or property resulting from any ideas, methods, instructions or products referred to in the content.

