1. Introduction
Mountain sports have experienced a significant growth worldwide, especially in the last decade. A recent study on sports habits in Spain [
1] reports that the discipline of sports most practised in 2021 was hiking/mountaineering, with 30.8% of the population where the study was carried out. Such a discipline has a sporting environment with its own characteristics, different from other sports, as well as certain risk conditions in some cases, which may affect the athlete’s profile on a physical level but, above all, psychologically [
2].
This study involves technicians linked to the Spanish Federation of Mountain and Climbing Sports (FEDME), that is, the only Spanish sports federation that will participate in the Summer Olympics with climbing and in the Winter Olympics with ski mountaineering, which will be the first Olympic discipline in Milan-Cortina d’Ampezzo in 2026. The contribution of this study is to provide the vision of technicians and professionals who work in this sport in the context of the study.
There are still few studies that analyse emotional intelligence (EI), resilience, and its relationship with life satisfaction in mountain sports. EI and resilience are likely to positively affect sporting performance under extreme conditions. Resilience is defined as the ability to present adaptive responses to adverse situations [
3]. It is a factor related to emotions, such as optimism, as well as well-being and problem-solving ability [
4]. Tabibnia [
5] considers that among the usual techniques for increasing resilience is exposure to nature and the natural environment through hiking in natural areas. The resilience of mountain athletes has been analysed in relation to addiction to mountain sports [
6,
7], as well as to emotional regulation for better-integrated risk management [
8].
EI has been conceptualised by Mayer and Salovey [
9] as an ability to perceive, assimilate, understand, and regulate one’s own emotions and those of others, in order to promote emotional and intellectual growth. In relation to the concept of EI, Petrides et al. [
10] distinguish between two different constructs of EI: EI as a personality trait, and on the other hand, EI as a capability. Among the studies of practitioners of outdoor sports activities, the authors highlight those that employ emotional regulation strategies [
11,
12], as well as the influence of EI on performance [
13] or climbing [
14].
2. Literature Review
One of the most productive fields of EI research focuses primarily on providing evidence of the relationship with psychological well-being and life satisfaction, both objective and subjective. Life satisfaction concerns the state of the individuals in which their needs, both objective and subjective, are satisfied [
15]. In this regard, the authors highlight some studies that have analysed the relationship between life satisfaction and optimism in mountain sports [
16], as well as personality and emotional responses in hikers [
17]. In other words, different studies point to the existence of a positive correlation between emotional intelligence as a trait and perceived happiness [
18]. On the other hand, from the ability model, some studies based on Spanish mountaineering and climbing athletes shows that emotional clarity and regulation are positively correlated with life satisfaction [
11]. Similarly, the dimensions of personal competence and self- and life acceptance mediate the relationship between EI and life satisfaction [
19]. It should be considered that attitudes associated with personal emotions determine the variation in subjective well-being to a large extent. Different studies indicates that emotional competencies involve an ability that allows mountain and climbing athletes to orient their thoughts and reflect on their emotions, helping them improve their performance levels [
6,
7].
Supporting this position, Frochot et al. [
20] analysed the satisfaction of practitioners of these mountain sports disciplines and the self-perceived well-being produced by this activity in mountain tourism contexts, finding relationships between them. It has also been shown that outdoor sports activity in a natural environment improves self-esteem and it is more restorative than sports activity in an urban environment [
21,
22]. Engemann et al. [
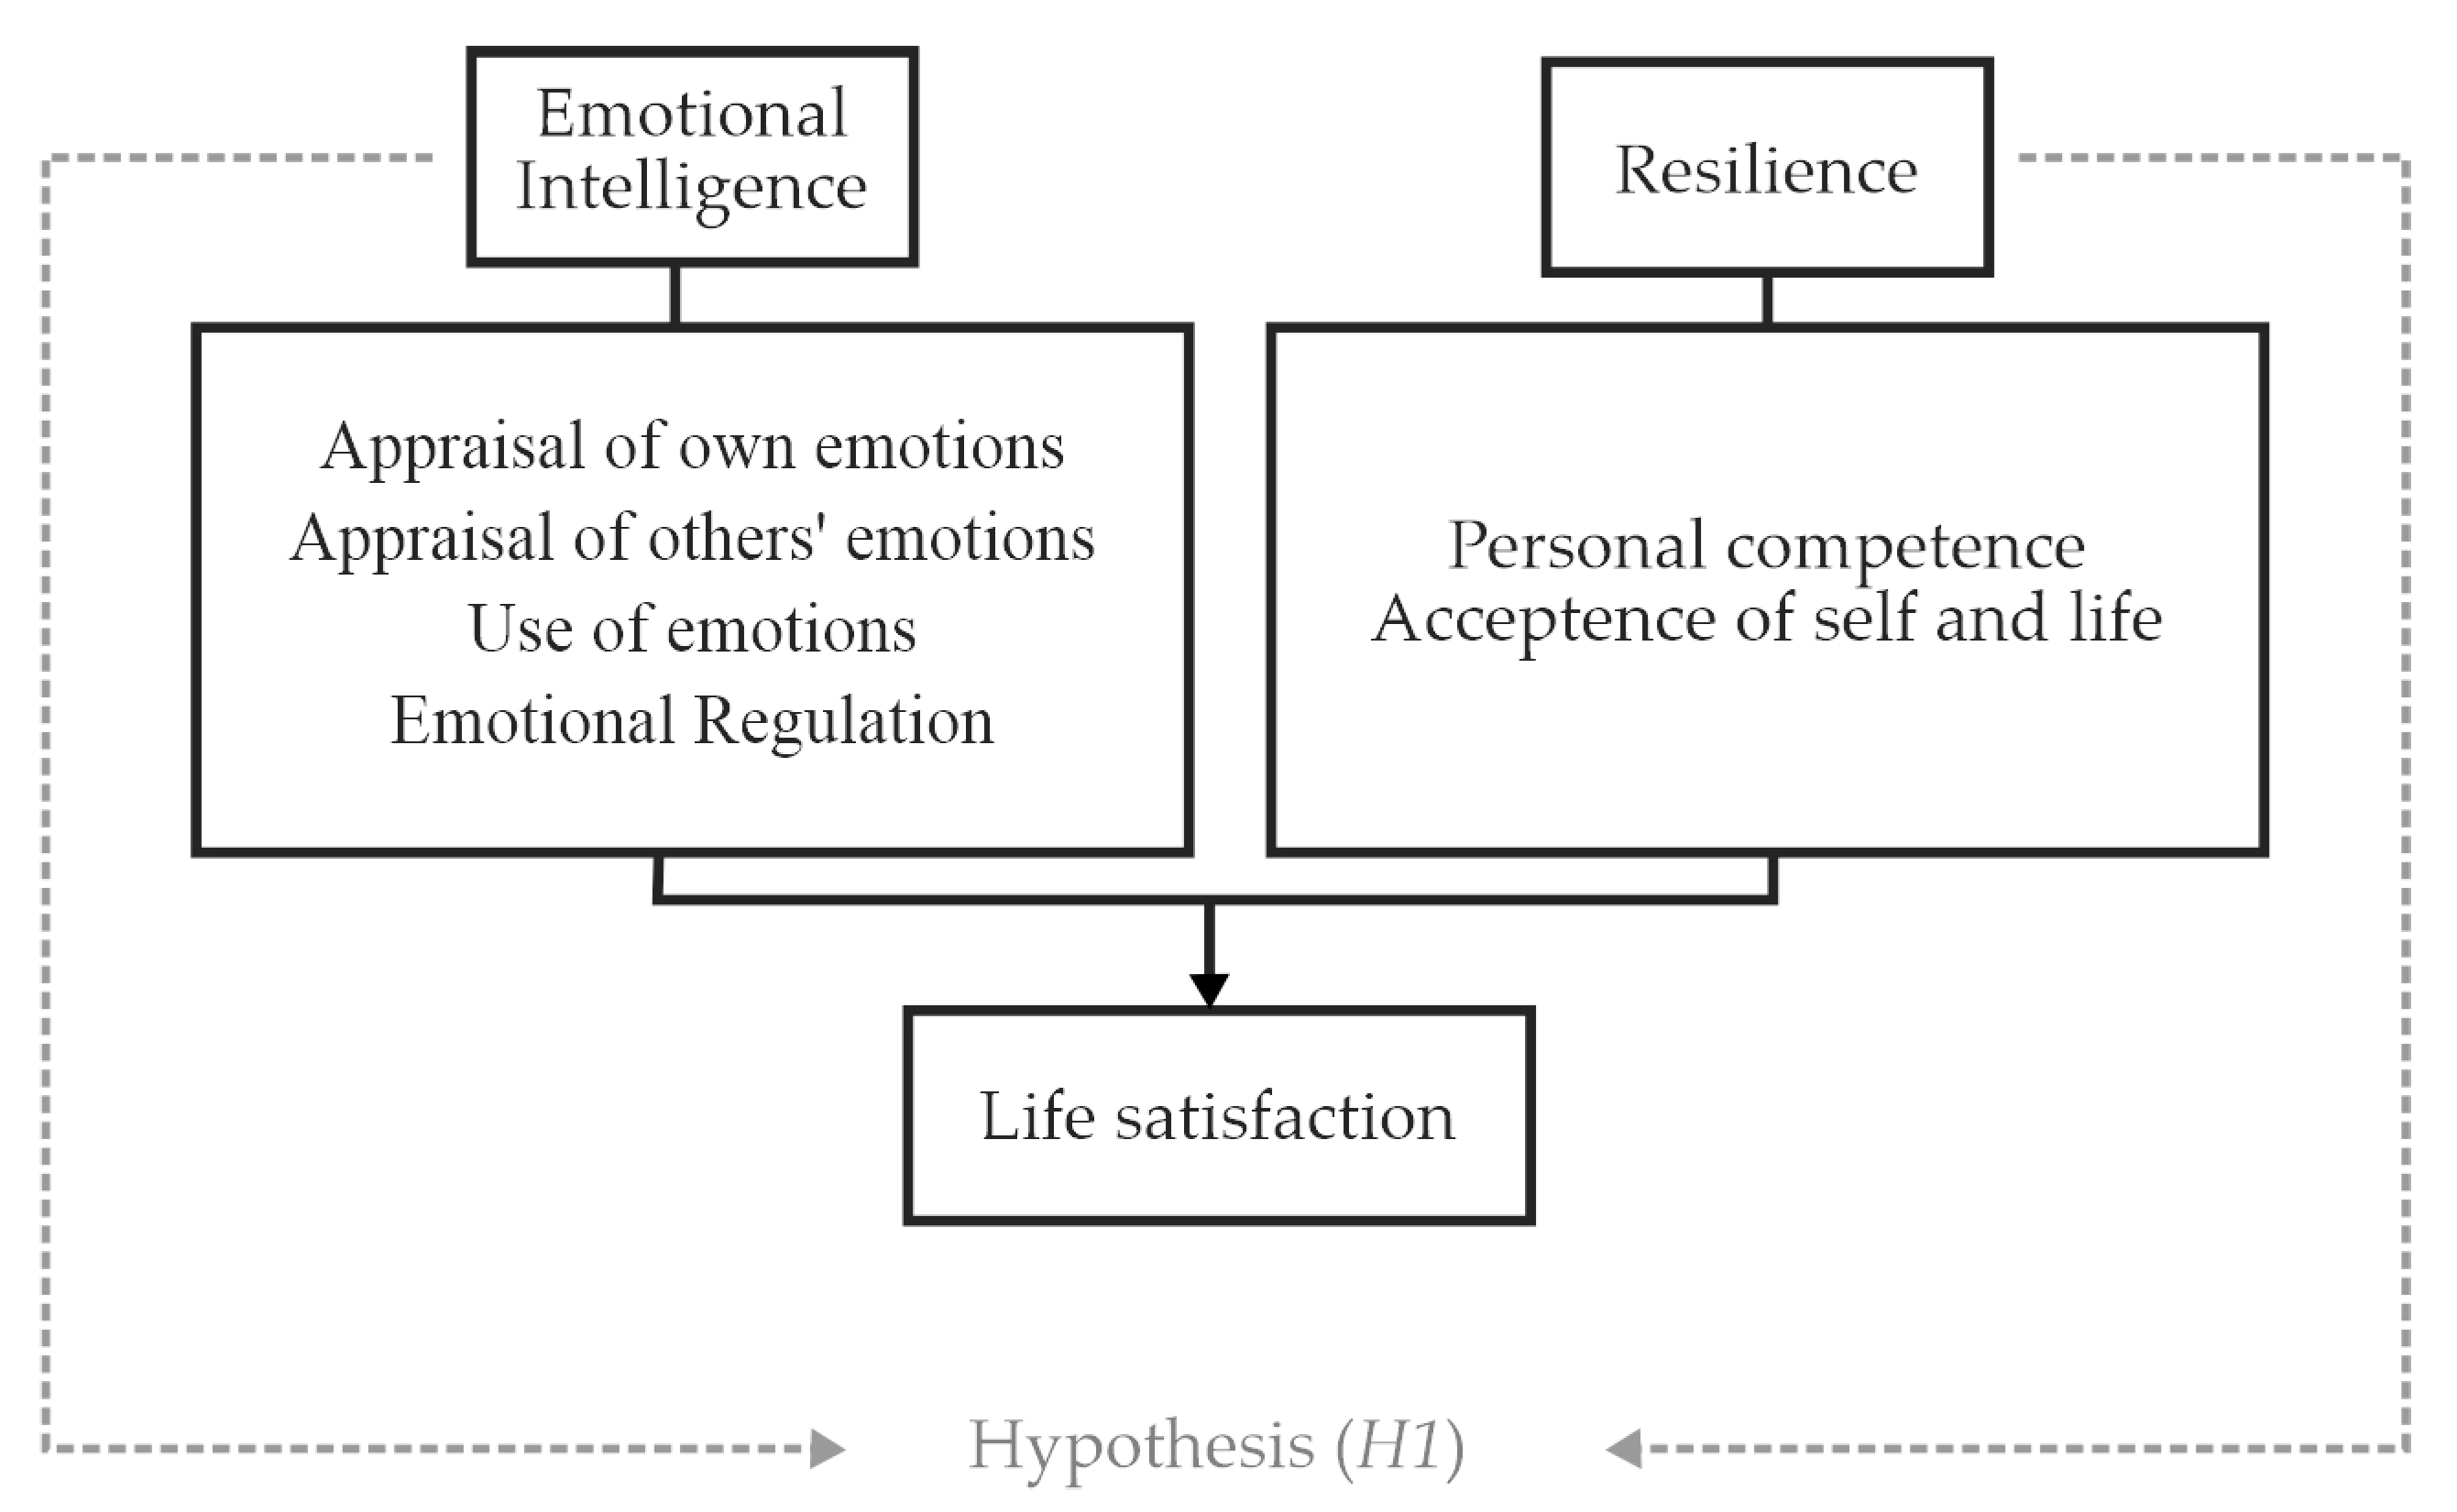
23] found that the risk of psychological disorders from adolescence to adulthood decreases when there are numerous green spaces near the residence place. The positive effects of EI and resilience, related to life satisfaction, can promote effective coping strategies in adverse situations [
19], as can be seen in
Figure 1, where the proposed theoretical model is presented.
Based on these considerations, this paper has the following three general objectives: (a) To analyse the reliability and internal consistency of each of the scores, as well as the existence of significant correlations between the dimensions of the instruments considered (WLEIS-S) of EI, (RS-14) of resilience, and (SWLS) for life satisfaction. (b) To determine the existence of mean differences between each of the dimensions of the instruments used and the socio-demographic variables of gender and age. (c) To predict which dimensions explain greater life satisfaction.
EI and resilience are skills that influence the way people manage stress and cope with life’s challenges. In the case of mountain and climbing athletes, these skills may be of particular relevance due to the demanding and risky nature of the activities involved in their sport. Overall, the following hypothesis (H1) is proposed: athletes with high levels of EI and resilience are better able to cope effectively and adaptively with challenges and risks, which in turn could lead to greater satisfaction with life.
3. Materials and Methods
3.1. Participants
The sample is made up of 788 people with training in mountain sports, who participated in this study during the year 2022. All these people had a valid sports license from the Spanish Federation of Mountain Sports and Climbing and had taken some formal mountain sports training or federative training throughout their lives. We selected the sample for convenience, in order to ensure that the participants were accessible and suitable for the objectives of this research. The following inclusion criteria were established in the research: that the participants were federated and over 18 years of age; they had experience; they had been active for a significant period of time. With regard to gender distribution, 75.3% were men (593 cases) and 24.5% were women (193 cases), and 2 people (0.3%) considered themselves as belonging to the “other gender” category (non-binary, etc.). The mean age of the participants was 49.8 years (±12.8), which ranged from 18 to 78 years.
The sample exceeds the minimum number of subjects necessary to infer the sample size for a confidence level of 95% and an estimation error of 4%. The number of estimated subjects is 598, with the number of subjects in the study sample exceeding this value (n = 788).
The number of predictors of life satisfaction in our model is two, the results of the statistical power analysis show a power of 0.948 above 80% and at the 5% significance level to observe R2 values of less than 10%. Consequently, no problems related to the adequacy of the sample size were found.
3.2. Instruments
In order to carry out the different analyses, the socio-demographic variables of gender and age were included in order to collect relevant information and to analyse the existence of significant differences according to these variables.
The Spanish version of the Wong Law Emotional Intelligence Scale (WLEIS-S) was used to assess EI [
18]. It is based on the Wong and Law EI scale (WLEIS-S) [
24] and it is made up of 16 items and 4 dimensions, namely intrapersonal perception (evaluation of one’s own emotions), interpersonal perception (evaluation of the emotions of others), assimilation (use of emotions), and emotional regulation. A 7-point Likert-type scale (1 to 7 points) was used, which has validity and reliability in Spanish contexts of (
α = 0.91). In our study, the reliability of this scale was Cronbach’s α = 0.906 and McDonald’s
ω = 0.909.
The Spanish version of the Resilience Scale (RS-14) [
25], which was made by Wagnild [
26], measures the degree of resilience, considered as a positive personality characteristic that allows the individual to adapt to adverse situations. The RS-14 measures 2 dimensions, namely personal competence (11 items, including self-confidence, independence, decisiveness, resourcefulness, and perseverance) and acceptance of self and life (3 items, namely adaptability, balance, and flexibility and a stable outlook on life). The reliability of this scale was Cronbach’s
α = 0.899 and McDonald’s
ω = 0.906.
The Satisfaction with Life Scale (SWLS) [
27], specifically the version of the Satisfaction with Life Scale by Vázquez et al. [
28], was used to assess life satisfaction. It consists of five items where participants must indicate the degree of agreement or disagreement for each of the response options of the instrument. The scale in the Spanish version reports an internal consistency of
α = 0.82. The reliability of this scale was Cronbach’s
α = 0.885 and McDonald’s
ω = 0.907.
3.3. Procedure
The authors followed the ethical guidelines promoted and encouraged by national and international regulations for conducting research with people, following the indications of the Declaration of Helsinki [
29]. Informed consent and confidentiality and anonymity of the data obtained were guaranteed for each of the participants. The instruments were administered individually through a Google platform (Google Forms). The approximate response time for each subject was 15 min. This research has the approval of the Human Research Ethics Committee of the University of Jaén (Spain), ID code OCT.22/2 LINE (line of research: “Evaluation of emotions throughout the life cycle”).
3.4. Data Analysis
Descriptive statistics (means and standard deviations) were obtained. The validity, reliability (Cronbach’s alpha and Omega coefficient) and internal consistency of each instrument were analysed a priori through confirmatory factor analysis (CFA) to verify the psychometric properties of the questionnaire and to obtain the factor loadings of each item. The normality analysis was carried out by means of multivariate hypothesis testing (being the distribution of the multivariate normal set, each of the marginal variables will meet the criteria of univariate normality, but not vice versa), which resulted in a normal distribution. Consistency was determined according to the computation of the composite reliability coefficient (CR). Convergent validity was verified by calculating the extracted average variance (AVE), where values greater than 0.50 show adequate convergent validity [
30]. In relation to the coefficients considered in this study, the Chi-square test (
χ2), the degrees of freedom (
df), and the CFI, GFI, SRMR, and RMSEA fit indices were used. In this sense,
χ2 should be understood from the ratio in relation to the degrees of freedom (
χ2/
df). The comparative fit index (CFI) calculates the relative fit of the observed model, whose value should be greater than 0.90, indicating a good fit. Similarly, the goodness-of-fit index (GFI), above 0.90, indicates the proportion of variance and covariance of the model data. Similarly, the standardised root mean square residual (SRMR), the standardised means of the residuals, i.e., the difference between the observed and model matrix, being less than 0.10, indicates a good model fit. The root mean square error of approximation per degree of freedom (RMSEA), as a measure of discrepancy, should have results below 0.08 [
31]. A 95% confidence level (significance
p < 0.05) was used in all cases.
To achieve a better fit for each of the tests, the data were transformed according to their factor loadings [
31]. The correlation between the resulting scores of each of the EI dimensions of the WLEIS-S instrument (appraisal of own emotions, appraisal of others’ emotions, use of emotions, and emotional regulation); resilience (RS-14) and its dimensions (personal competence and acceptance of self and life), and life satisfaction (SWLS) was analysed with Pearson’s
r test. Subsequently, to analyse the differences according to gender (men vs. women), Student’s
t-test for independent samples was used. For age, the ANOVA test for independent samples was performed. Finally, to explore the predictive value of the life satisfaction variable, a stepwise regression study was carried out, respectively. In all cases, a 95% confidence level was used (significance
p < 0.05). The analyses were carried out using SPPS Statistics (version 25.0. Chicago, IL, USA) and the jamovi software (The jamovi Project, version 1.2. San Francisco, CA, USA).
4. Results
4.1. Descriptive Results
The descriptive values (central tendency and distribution) of the variables that make up the different instruments are also calculated. Regarding skewness and kurtosis, it has been observed that the EI dimensions, resilience, and life satisfaction dimensions are distributed within the range −2 and 2, according to the criteria established by Bandalos and Finney [
32], which presents a good distribution (see
Figure 2). The corrected homogeneity index also presents acceptable values above 0.500.
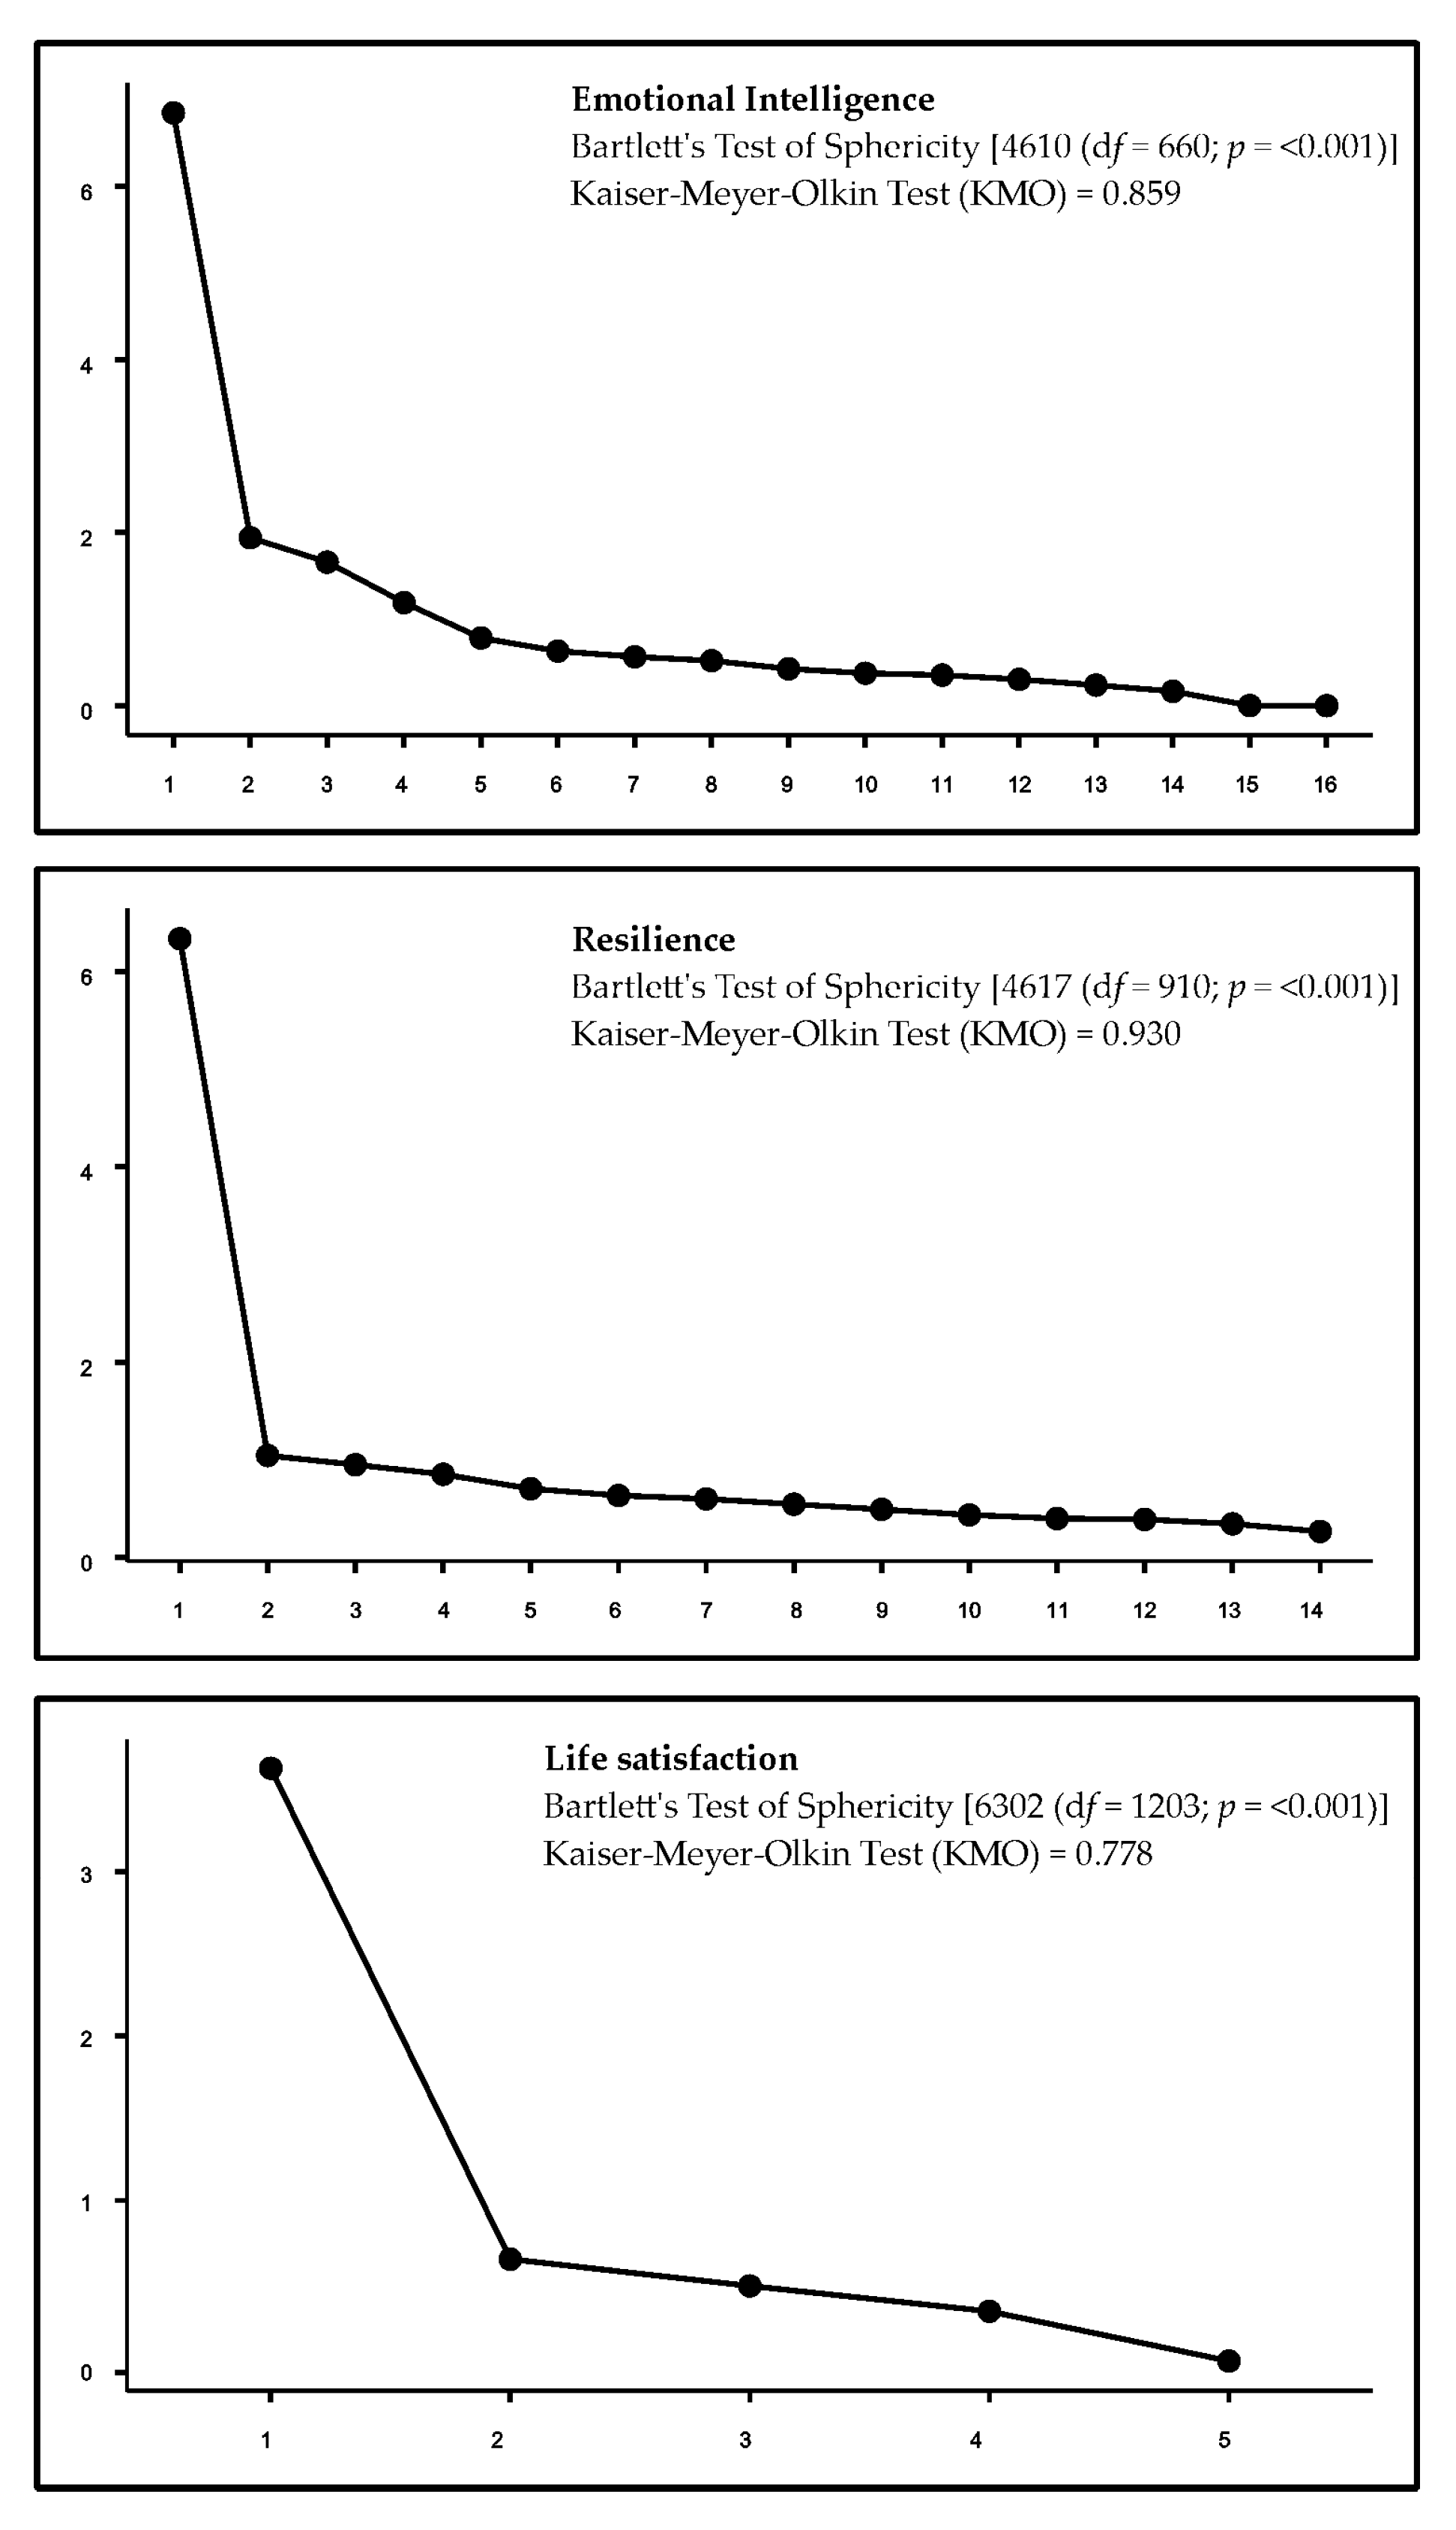
Bartlett’s statistic and the Kaiser–Meyer–Olkin test of sampling adequacy (KMO) reveal a good fit of the data to be subjected to factor analysis, and taking into account the ordinal nature of the data recording (Likert scale from 1 to 7) of the factor extraction in the Exploratory Factor Analysis (EFA), it is convenient to perform it through the robust estimation of unweighted least squares (ULS) and polychoric matrices.
Secondly, the authors assess whether the data assume the assumption of normality with Mardia’s multivariate test to contrast the skewness and kurtosis of the observed variables, which shows that the data follow a normal distribution. The assumptions of multicollinearity, homogeneity, and homoscedasticity are analysed to verify that the resulting distribution meets the criteria of dependence between variables.
From the data obtained with each of the instruments (
Table 1), confirmatory factor analysis (CFA) is performed to verify the validity and internal structure of each item. Critical
Z-score values using a 99% confidence level (standard deviations) will determine a small
p-value to reflect a statistically significant spatial structure in the data.
The factor loadings for the items on the EI scale (WLEIS-S) had an adequate fit [
33],
χ2/
df = 3.259, with CFI = 0.973, SRMR = 0.0380, and RMSEA = 0.067. The reliability of this scale was Cronbach’s
α = 0.906 and McDonald’s
ω = 0.909.
The factor loadings for the items on the Resilience Scale (RS-14), presented an adequate fit [
33];
χ2/
df = 2.967; with CFI = 0.911; SRMR = 0.046; RMSEA = 0.078 (See
Table 2). The reliability of this scale was Cronbach’s
α = 0.899 and McDonald’s
ω = 0.906.
The factor loadings for the items of the Life Satisfaction Scale (SWLS), presented an adequate fit [
33]:
χ2/
df = 3.041; with CFI = 0.963; SRMR = 0.034; RMSEA = 0.068. The reliability of this scale was Cronbach’s
α = 0.885 and McDonald’s
ω = 0.907 (See
Table 3).
To analyse each of the variables observed between all the dimensions that make up the model (See
Table 4), the correlation matrix (Pearson’s
r) was developed together with the descriptive statistics (means and standard deviations) and the reliability of the scores (Cronbach’s alpha and omega coefficient), with the highest correlation established between personal competence and use of emotions (
r(784) = 0.680;
p < 0.001), personal competence and acceptance of self and life (
r(784) = 0.683;
p < 0.001), and acceptance of self and life and life satisfaction (
r(784) = 0.611;
p < 0.001), with a statistically significant relationship in the rest of the variables.
4.2. Differences According to Socio-Demographic Variables
To determine the difference in means in relation to the gender variable, the Student’s
t-test for independent samples was used (see
Table 5).
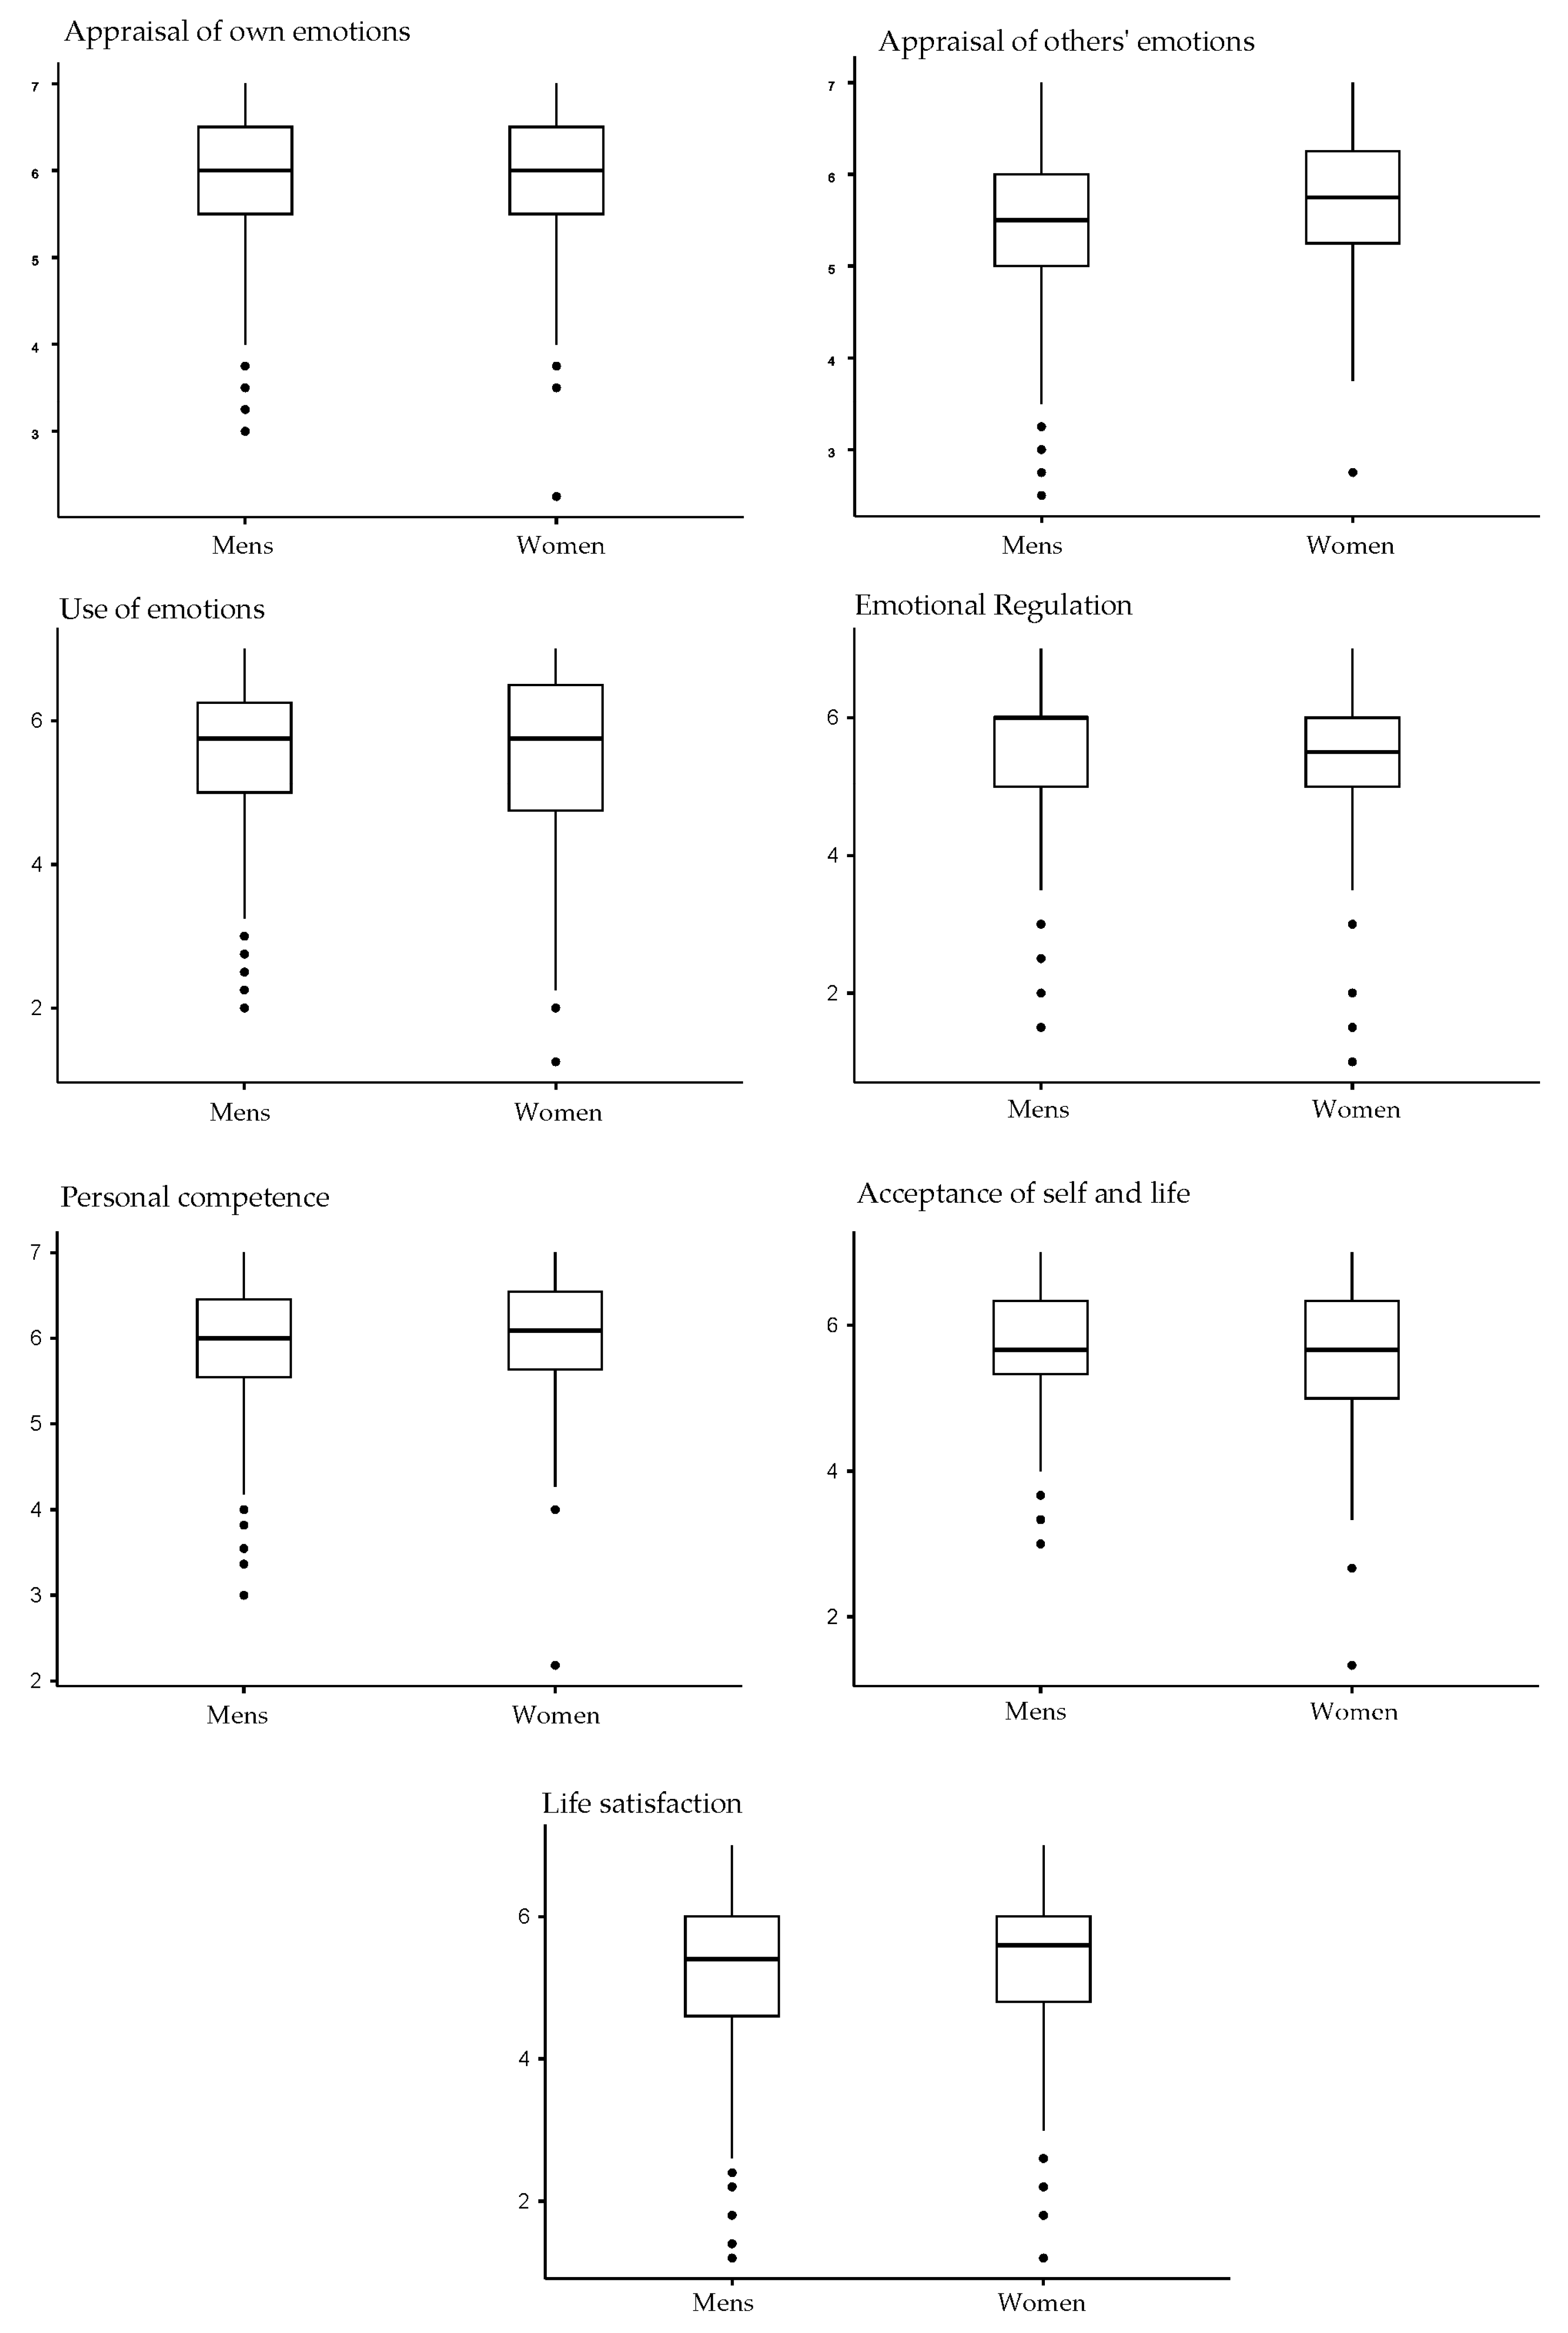
The results (see
Table 5 and
Figure 3) indicate that there are only significant differences in the following EI variables: use of emotions (
t784 = 2.182;
p < 0.001); emotional regulation (
t784 = 2.888;
p < 0.05), where the scores obtained are higher in men than in women; appraisal of others’ emotions (
t784 = 4.664;
p < 0.05), where the scores are higher in women. There are also significant differences in the resilience variable, namely acceptance of self and life (
t784 = 1.853;
p < 0.05), with higher values in men.
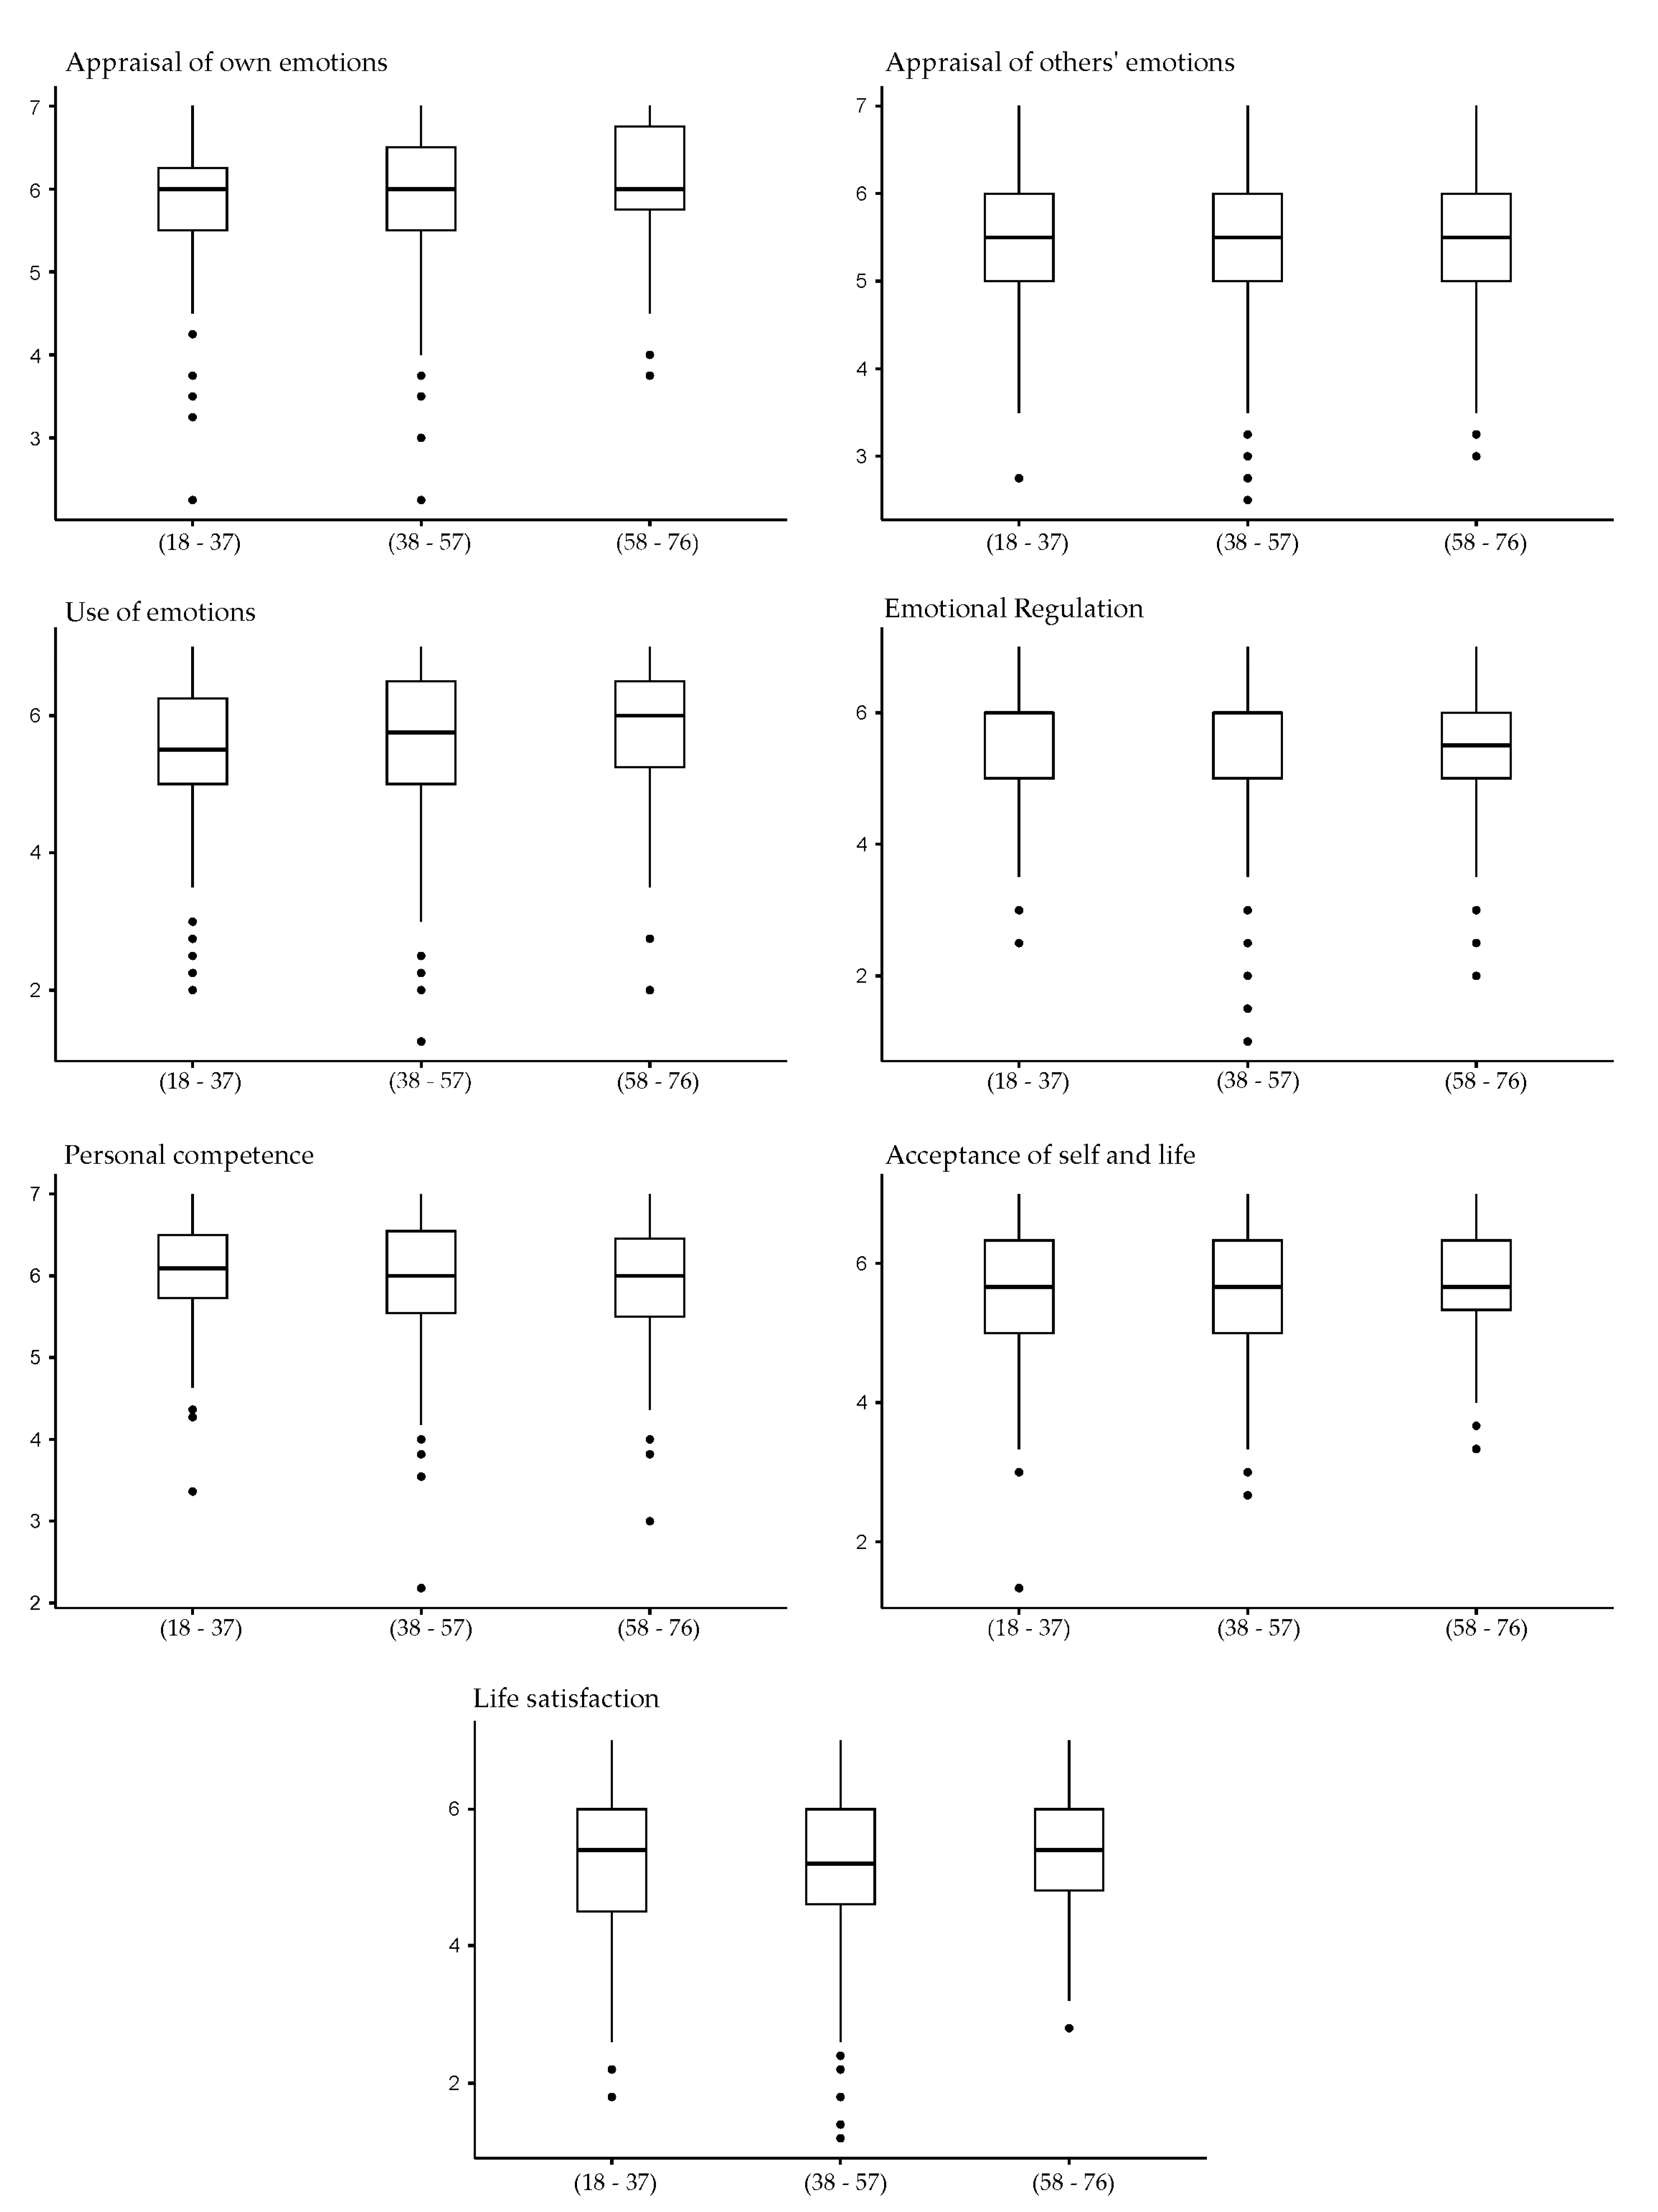
Three age intervals (18–37 years, 28–57 years, and 58–76 years) were established in order to test the homogeneity of the covariance matrices for the variable age of the participants, and ANOVA tests were carried out (see
Table 6 and
Figure 4). The criteria established in the Survey of Sports Habits in Spain 2022 [
1] published by the Spanish Ministry of Culture and Sport were established, grouped into three age ranges.
Statistically significant differences were found in the EI dimensions appraisal of own emotions (F(2-784) = 5.036; p = 0.007) and use of emotions (F(2-784) = 6.196; p = 0.002), with higher values for older participants (58–76 years). Significant differences were also found for life satisfaction (F(2-784) = 3.191; p = 0.042).
Tukey’s HSD test shows significant differences between participants in the range of 58–76 years of age. The effect size is small in all cases (η2).
4.3. Linear Regression Model (Step-by-Step)
To determine the degree of functional relationship between the variables, a linear regression analysis was carried out, including life satisfaction as a dependent variable together with the rest of the research variables, which were entered step by step following the theoretical model proposed (see
Table 7).
The main contribution is distributed as follows: appraisal of own emotions (β = 0.104; p < 0.001); use of emotions (β = 0.30; p < 0.001); emotional regulation (β = 0.103; p < 0.001); personal competence (β = 0.402; p < 0.001), which present an adequate level of significance and explain positively the regression model with an accuracy of 44.1%. The evaluation of others’ emotions was significant in the initial steps of the analysis, but then lost its significance. Similarly, the variable acceptance of self and life did not enter the regression model.
5. Discussion
The aim of the research was to evaluate the relationship between each of the dimensions of EI (appraisal of own emotions, appraisal of others’ emotions, use of emotions, and emotional regulation), resilience (personal competence, acceptance of self and life), and life satisfaction; furthermore, we aimed to analyse these associations according to gender and age in mountaineers and climbers who have taken some formal training in this discipline. The results showed a statistically significant correlation between EI, resilience, and life satisfaction, which is consistent with different studies that highlight the benefits of physical activities in the mountains as generators of positive emotions [
20,
34] and greater satisfaction with life. This statement is confirmed by studies already conducted on emotions [
35], where physical exercise is a key factor in the increase in serotonin and dopamine that affects emotional state and psychological well-being [
21,
36]. Some studies show that satisfying basic psychological needs increases task involvement and effort, which favours internal motivational states [
37,
38]. Other authors [
20] analysed satisfaction with mountain sports and the well-being that this activity produces, achieving similar results.
The results demonstrate significant differences between each of the dimensions of the instruments considered and the socio-demographic variable of gender. The results show higher values for women than men in two of the dimensions of EI, on the emotional self-perception and on the other ones, and also in the dimension of resilience, personal competence, and life satisfaction. However, these results should be taken with caution, as the proportion is higher for women than for men. Other authors corroborate these results as women practice mountain activities less than men, data that are consistent with global sport statistics [
39,
40]. Similarly, Salmela-Aro et al. [
3] show that women manage their emotions slightly better than men, in agreement with Acebes et al. [
41]. Other studies, such as that of Doyle and Thompson [
42], corroborate in their research on stereotypes and EI, with better data in men, although they argue that these results may be conditioned by stereotypes generated over time.
In relation to age, significant differences were found in older participants. This is corroborated by other studies that argue that as people progress through the different stages of life, different physical, psychological, and social changes occur [
43], which have an impact on their well-being. Older people may have greater control, emotional maturity, and adaptive response than middle-aged people. Similarly, older people use emotional regulatory strategies depending on the obstacles they face [
44].
Regarding regression analysis, the dimensions that predicted greater life satisfaction were appraisal of own emotions, use of emotions, emotional regulation, and personal competence, i.e., people with high levels of EI are more aware of their emotions and have more developed skills to manage them effectively, which in turn can help them better adapt to difficult situations [
45]. In addition, resilience and EI may contribute to greater life satisfaction. The most resilient people can face and overcome challenges more easily, and this can help them feel more confident and able to achieve their goals, which in turn may contribute to greater well-being [
18]. The influence of EI on performance in mountain and climbing sports seems to be demonstrated [
13,
14].
6. Conclusions
This research has some limitations. Firstly, it is a descriptive cross-sectional study, which implies that causal relationships between variables cannot be estimated, as well as the bias of dealing with mountain and climbing sportsmen and women nationwide. Secondly, although the sample is large, it is necessary to extend it, as well as to be able to carry out longitudinal or generational studies. Thirdly, the number of participants, mostly men, may have influenced the results found, so caution should be exercised when generalizing these data to the general population. Fourth, the use of structural equations (SEM) would be advisable. SEM would allow more complex relationships between variables to be modelled, and multiple latent variables could be included. In addition, SEM enables the assessment of measurement validity and reliability, and the examination of causal relationships between each of the dimensions, which is not possible with a regression model. Finally, it is suggested that the evaluation of social desirability be considered for future research.
Consistent with the results obtained, the authors point out that each of the dimensions of EI and resilience are variables of psychological adjustment associated with well-being [
46], which is key to personal and social growth [
47], adaptive processes, and personal competence [
48].
The results of this research make two main contributions: on the one hand, it shows a statistical relationship between the dimensions of EI, resilience, and life satisfaction in mountain and climbing athletes that reinforces the proposal to analyse the emotional benefits and development of strategies for the development of EI and resilience; on the other hand it suggests the need to extend the benefits at an early age and, more specifically, in the training of practitioners of this discipline. Likewise, this study points to the need to increase the number of studies that contribute to responding to the questions related to gender, emotional competencies, and sports performance in mountain and climbing disciplines.
Author Contributions
Conceptualization, Ó.G.-C., L.M.-T., G.S.-J. and D.M.; methodology, Ó.G.-C. and D.M.; software, Ó.G.-C.; writing—original draft preparation, Ó.G.-C. and D.M.; writing-review and editing, L.M.-T., G.S.-J. and D.M.; supervision, Ó.G.-C. and D.M. All authors have read and agreed to the published version of the manuscript.
Funding
This research received no external funding.
Institutional Review Board Statement
The study was conducted according to the guidelines of the Declaration of Helsinki and approved by the Ethics Committee of University of Jaén (Reference: OCT.22/2-LINE).
Informed Consent Statement
Informed consent was obtained from all individual participants included in the study.
Data Availability Statement
The datasets generated during and/or analysed during the current study are available from the corresponding author on reasonable request.
Acknowledgments
The investigation was made possible thanks to the collaboration provided by the Spanish Federation of Mountain Sports and Climbing (Federación Española de Deportes de Montaña y Escalada—FEDME).
Conflicts of Interest
The authors declare no conflict of interest.
References
- Ministry of Culture and Sports. Sports Habits Survey 2022; Ministry of Culture and Sports, Government of Spain: Madrid, Spain, 2022.
- Ramos-Cabal, H.; Salguero, A.; González-Diñeiro, A.; Molinero-González, O.; Márquez-Rosa, S. Adaptation for Mountain Sports (PCSP-M) of the Spanish Version of the Questionnaire “Psychological Characteristics related to Sports Performance” (PCSP). Rev. Iberoam. Diagn. Eval. Aval. Psicol. 2017, 47, 185–196. [Google Scholar]
- Salmela-Aro, K.; Hietajärvi, L.; Lonka, K. Work Burnout and Engagement Profiles among Teachers. Front. Psychol. 2019, 10, 2254. [Google Scholar] [CrossRef] [PubMed] [Green Version]
- Salanova, M. Resiliencia. In ¿Cómo me Levanto Después de Caer? Aguilar Books: Madrid, Spain, 2021. [Google Scholar]
- Tabibnia, G. An affective neuroscience model of boosting resilience in adults. Neurosci. Biobehav. Rev. 2020, 115, 321–350. [Google Scholar] [CrossRef] [PubMed]
- Méndez-Alonso, D.; Prieto-Saborit, J.A.; Bahamonde, J.R.; Jiménez-Arberás, E. Influence of Psychological Factors on the Success of the Ultra-Trail Runner. J. Environ. Res. Public Health 2021, 18, 2704. [Google Scholar] [CrossRef]
- Niedermeier, M.; Frühauf, A.; Kopp, M. Intention to Engage in Mountain Sport During the Summer Season in Climate Change Affected Environments. Front. Public Health 2022, 10, 828405. [Google Scholar] [CrossRef]
- Habelt, L.; Kemmler, G.; Defrancesco, M.; Spanier, B.; Henningsen, P.; Halle, M.; Sperner-Unterweger, B.; Hüfner, K. Why do we climb mountains? An exploration of features of behavioural addiction in mountaineering and the association with stress-related psychiatric disorders. Eur. Arch. Psychol. Clin. Neuros. 2022, 1–9. [Google Scholar] [CrossRef]
- Mayer, J.D.; Salovey, P. What is Emotional Intelligence. In Emotional Development and Emotional Intelligence: Implications for Educators; Salovey, P., Sluyter, D., Eds.; Basic Books: New York, NY, USA, 1997; pp. 3–31. [Google Scholar]
- Petrides, K.V.; Frederickson, N.; Furnham, A. The Role of Trait Emotional Intelligence in Academic Performance and Deviant Behavior at School. Personal. Individ. Differ. 2004, 36, 277–293. [Google Scholar] [CrossRef]
- Castro-Sánchez, M.; Lara-Sánchez, A.J.; Zurita-Ortega, F.; Chacón-Cuberos, R. Motivation, Anxiety, and Emotional Intelligence Are Associated with the Practice of Contact and Non-Contact Sports: An Explanatory Model. Sustainability 2019, 11, 4256. [Google Scholar] [CrossRef] [Green Version]
- Nicolas, M.; Martinent, G.; Millet, G.; Bagneux, V.; Gaudino, M. Time courses of emotions experienced after a mountain ultra-marathon: Does emotional intelligence matter? J. Sports Sci. 2019, 37, 1831–1839. [Google Scholar] [CrossRef]
- Laborde, S.; Dosseville, F.; Allen, M.S. Emotional intelligence in sport and exercise: A systematic review. Scand. J. Med. Sci. Sports 2015, 26, 862–874. [Google Scholar] [CrossRef]
- Garrido-Palomino, I.; España-Romero, V. Role of emotional intelligence on rock climbing performance. Rev. Cienc. Deporte 2019, 15, 284–294. [Google Scholar] [CrossRef]
- Biswas-Diener, R. Wellbeing research needs more cultural approaches. J. Wellbeing 2022, 12, 20–26. [Google Scholar] [CrossRef]
- Próchniak, P.; Próchniak, A. Future-Oriented Coping with Weather Stress among Mountain Hikers: Temperamental Personality Predictors and Profiles. Behav. Sci. 2021, 11, 15. [Google Scholar] [CrossRef]
- Próchniak, P. Profiles of Wellbeing in Soft and Hard Mountain Hikers. J. Environ. Res. Public Health 2022, 19, 7429. [Google Scholar] [CrossRef]
- Extremera, N.; Rey-Peña, L.; Sánchez-Álvarez, N. Validation of the Spanish version of the Wong Law emotional intelligence scale (WLEIS-S). Psicothema 2019, 31, 94–100. [Google Scholar]
- Gavín-Chocano, Ó.; García-Martínez, I.; Pérez-Navío, E.; Molero, D. Resilience as a mediating variable between emotional intelligence and optimism-pessimism among university students in Spanish universities. J. Furth. High. Educ. 2022, 1–14. [Google Scholar] [CrossRef]
- Frochot, I.; Elliot, S.; Kreziak, D. Digging deep into the experience—Flow and immersion patterns in a mountain holiday. Int. J. Cult. Tour. Hosp. Res. 2017, 11, 81–91. [Google Scholar] [CrossRef]
- Schebella, M.F.; Weber, E.; Schultz, L.; Weinstein, P. The wellbeing benefits associated with perceived and measured biodiversity in Australian urban green spaces. Sustainability 2019, 11, 802. [Google Scholar] [CrossRef] [Green Version]
- Valladares, F. More biodiversity to improve our health: The benefits to human well-being of favouring functional and diverse ecosystems. Metode Sci. Stud. J. 2022, 13. [Google Scholar] [CrossRef]
- Engemann, K.; Pedersen, C.B.; Arge, L.; Tsirogiannis, C.; Mortensen, P.B.; Svenning, J. Residential green space in childhood is associated with lower risk of psychiatric disorders from adolescence into adulthood. Proc. Natl. Acad. Sci. USA 2019, 116, 5188–5193. [Google Scholar] [CrossRef] [Green Version]
- Wong, C.S.; Law, K.S. The effects of leader and follower emotional intelligence on performance and attitude: An exploratory study. Leadersh. Q. 2002, 13, 243–274. [Google Scholar] [CrossRef] [Green Version]
- Sánchez-Teruel, D.; Robles-Bello, M.A. Escala de resiliencia 14 ítems (RS-14): Propiedades psicométricas de la versión en español. Rev. Iberoam. Diagn. Evaluación Avaliação Psicol. 2015, 2, 103–113. [Google Scholar]
- Wagnild, G. A Review of the Resilience Scale. J. Nurs. Meas. 2009, 17, 105–113. [Google Scholar] [CrossRef] [PubMed]
- Diener, E.; Emmons, R.; Larsen, R.J.; Griffin, S. The Satisfaction with Life Scale. J. Personal. Assess. 1985, 49, 71–75. [Google Scholar] [CrossRef] [PubMed]
- Vázquez, C.; Duque, A.; Hervás, G. Satisfaction with Life Scale in a Representative Sample of Spanish Adults: Validation and Normative Data. Span. J. Psychol. 2013, 16, 1–15. [Google Scholar] [CrossRef]
- WMA. Declaration of Helsinki. Ethical Principles for Medical Research on Human Beings. In Proceedings of the 64th General Assembly, Fortaleza, Brazil, 27 October 2013; Available online: https://www.wma.net/wp-content/uploads/2016/11/DoH-Oct2013-JAMA.pdf (accessed on 21 January 2023).
- Fornell, C.; Larcker, D.F. Evaluating structural equation models with unobservable variables and measurement error. J. Mark. Res. 1981, 18, 39–50. [Google Scholar] [CrossRef]
- Kline, R. Principles and Practice of Structural Equation Modeling; Guilford Press: New York, NY, USA, 2015. [Google Scholar]
- Bandalos, D.L.; Finney, S.J. Factor Analysis: Exploratory and Confirmatory. In Reviewer’s Guide to Quantitative Methods; En, G., Hancock, R., Mueller, R.O., Eds.; Routledge: New York, NY, USA, 2010. [Google Scholar]
- Hair, J.F.; Sarstedt, M.; Ringle, C.M.; Gudergan, S.P.; Castillo-Apraiz, J.; Cepeda-Carrión, G.A.; Roldán, J.L. Manual Avanzado de Partial Least Squares Structural Equation Modeling (PLS-SEM); OmniaScience Scholar: Barcelona, Spain, 2021. [Google Scholar]
- Muñoz-Arroyave, V.; Lavega-Burgués, P.; Costes, A.; Damian, S.; Serna, J. Los juegos motores como recurso pedagógico para favorecer la afectividad desde la educación física. Retos. Nuevas Tend. Educ. Física Deporte Recreación 2020, 38, 166–172. [Google Scholar]
- Pic, M.; Lavega-Burgués, P.; Muñoz-Arroyave, V.; March-Llanes, J.; Echeverri-Ramos, J.A. Predictive variables of emotional intensity and motivational orientation in the sports initiation of basketball. Cuad. Psicol. Deporte 2019, 19, 241–251. [Google Scholar] [CrossRef] [Green Version]
- Bisquerra, R. Universo de Emociones; PalauGea: Valencia, Spain, 2018. [Google Scholar]
- Moreno, J.A.; Hellín, G. El interés del alumnado de Educación Secundaria Obligatoria hacia la Educación Física. Redie Rev. Electr. Investig. Educ. 2007, 9, 1–20. Available online: http://redie.uabc.mx/vol9no2/contenido-moreno.html (accessed on 18 January 2023).
- Niubò-Solé, J.; Lavega-Burgués, P.; Sáenz-López, P. Emotions According to Type of Motor Task, Sports and Gender Experience. Apunt. Educ. Física Deportes 2022, 148, 26–33. [Google Scholar] [CrossRef]
- Martín-Talavera, L.; Mediavilla-Saldaña, L. Gender differences in the profile and habits of practitioners of outdoor activities. Retos Neuvas Tend. Educ. Fis. Deporte Recreacion 2020, 38, 713–718. [Google Scholar]
- Espada, M.; Martín, M.; Jiménez, V.; Moscoso, D.; Jiménez-Beatty, E.; Rivero, A. Leisure sports habits in Spanish adults: Gender and social differences. Rev. Cienc. Soc. 2018, 13, 495–513. [Google Scholar] [CrossRef] [Green Version]
- Acebes-Sánchez, J.; Diez-Vega, I.; Esteban-Gonzalo, S.; Rodriguez-Romo, G. Physical activity and emotional intelligence among undergraduate students: A correlational study. BMC Public Health 2019, 19, 1241. [Google Scholar] [CrossRef] [Green Version]
- Doyle, R.A.; Thompson, A.E. The influence of stereotype threat and implicit theories of emotion on gender differences in emotional intelligence. J. Men’s Stud. 2021, 29, 131–155. [Google Scholar] [CrossRef]
- Bernaras, E.; Jaureguizar, J.; Soroa, M.; Ibabe, I.; Cuevas, C. Child depression in the school context. Procedia Soc. Behav. Sci. 2011, 29, 198–207. [Google Scholar] [CrossRef] [Green Version]
- Pulido-Acosta, F.; Herrera-Clavero, F. Relaciones entre rendimiento e inteligencia emocional en secundaria. Tend. Pedagógicas 2018, 31, 165–186. [Google Scholar] [CrossRef] [Green Version]
- Cejudo, J.; López-Delgado, M.L.; Rubio, M.J. Inteligencia emocional y resiliencia: Su influencia en la satisfacción con la vida en estudiantes universitarios. Anu. Psicol. 2016, 46, 51–57. [Google Scholar] [CrossRef]
- Guevara, R.M.; Moral-García, J.E.; Urchaga, J.D.; López-García, S. Relevant Factors in Adolescent Well-Being: Family and Parental Relationships. J. Environ. Res. Public Health 2021, 18, 7666. [Google Scholar] [CrossRef]
- Baumsteiger, R.; Hoffmann, J.D.; Castillo-Gualda, R.; Brackett, M.A. Enhancing school climate through social and emotional learning: Effects of RULER in Mexican secondary schools. Learn. Environ. Res. 2022, 25, 465–483. [Google Scholar] [CrossRef]
- Brackett, M.A.; Bailey, C.S.; Hofmann, J.D.; Simmons, D.N. Ruler: A theory-driven, systemic approach to social, emotional, and academic learning. Educ. Psychol. 2019, 54, 144–161. [Google Scholar] [CrossRef]
| Disclaimer/Publisher’s Note: The statements, opinions and data contained in all publications are solely those of the individual author(s) and contributor(s) and not of MDPI and/or the editor(s). MDPI and/or the editor(s) disclaim responsibility for any injury to people or property resulting from any ideas, methods, instructions or products referred to in the content. |
© 2023 by the authors. Licensee MDPI, Basel, Switzerland. This article is an open access article distributed under the terms and conditions of the Creative Commons Attribution (CC BY) license (https://creativecommons.org/licenses/by/4.0/).


