Article

Localizing and Monitoring Climate Neutrality through the Sustainable Development Goals (SDGs) Framework: The Case of Madrid

1
Escuela Técnica Superior de Ingeniería de Caminos, Canales y Puertos, University of A Coruña, 15001 A Coruña, Spain
2
European Commission, Joint Research Centre, Fair and Sustainable Economy Unit, 41092 Seville, Spain
*
Author to whom correspondence should be addressed.
Sustainability 2023, 15(6), 4819; https://doi.org/10.3390/su15064819
Submission received: 13 February 2023 / Revised: 3 March 2023 / Accepted: 7 March 2023 / Published: 8 March 2023

Abstract

:
Madrid’s Roadmap to Climate Neutrality by 2050 is the city’s strategy to attain a 65% reduction in greenhouse gas (GHG) emissions by 2030 and decarbonisation in 2050. This paper analyses the Roadmap to extract a concept of neutrality, as defined from the perspective of a local or regional government (LRG). It then runs a semantic comparison between the Roadmap’s policy lines and indicators and the metrics used in a sample of other LRGs voluntary local reviews on the localisation of the Sustainable Development Goals (SDGs). It assesses the extent to which the roadmap’s policy priorities and goals fit with the idea of climate neutrality and decarbonisation that other LRGs are monitoring. The paper also links the Roadmap with the SDGs, studying to what extent certain goals resonate with the climate neutrality dimension monitored therein and the other reviews in the sample. The paper suggests that there is still significant diversity in the way LRGs approach climate neutrality, although carbon emissions and sustainable transport remain common priorities. A large majority of indicators monitoring climate neutrality still refer to key climate-related SDGs, such as SDG 7, 11, 12, and 13, even though there is growing evidence that LRGs are diversifying the concept of decarbonisation policy with which they are working.

1. Introduction

In March 2021, Madrid city council published the Roadmap to Climate Neutrality by 2050 [1], hereinafter ‘the Roadmap’. The Roadmap advances a diverse set of policy initiatives and scenarios to attain a 65% reduction of greenhouse gas (GHG) emissions within the municipal limits by the year 2030 and local climate neutrality by 2050. The Roadmap is the latest in a set of policy frameworks towards decarbonisation that the city of Madrid has developed over the last 15 years. It also explicitly acknowledges a policy link with the Paris Climate Agreement and the European Green Deal (EGD)—the European Commission’s overarching strategic response to the challenge of climate change and sustainability [2,3].
Climate neutrality and the overall reduction of GHG emissions have also been at the core of the United Nations’ 2030 Agenda for Sustainable Development (hereinafter ‘2030 Agenda’), which vows to “to protect the planet from degradation, including through sustainable consumption and production, sustainably managing its natural resources and taking urgent action on climate change” [4] (p. 5). The 17 Sustainable Development Goals (SDGs) that operationalize the 2030 Agenda include, among others, targets for CO2 emissions, air quality, energy intensity, recycling rates, and food waste. The topic of climate neutrality in different sectors, domains and fields, has been extensively examined in the literature, e.g., on transportation and mobility [5]; tourism [6,7]; energy [8,9]; circular economy [10] and lately on cross-sectoral dimensions taking into account recent crises, such as COVID-19 [11], or combining different domains, including water and energy [12].
Over the past few years, the relevance of local policy contributions to the achievement of the SDGs has increased steadily [13,14]. Through their voluntary local reviews (VLRs), many local and regional governments (LRGs) have monitored the localisation of the Sustainable Development Goals (SDGs), while also providing indicators and data to monitor climate change and shared policy outcomes and best practices concerning local responses to climate change and local initiatives towards more climate-neutral local communities [15,16].
Madrid’s Roadmap is, in this regard, uncharacteristic. Even if the Roadmap acknowledges that “EU policies, such as the European Green Deal… set the pace for municipal policies” [1] (p. 38), it has no explicit connection with the 2030 Agenda or the SDGs. The latter are neither referenced nor mentioned anywhere in the document. The Roadmap also has a precise policy focus on climate neutrality, which complements the city’s SDG localisation strategy [17] and its ongoing work on a full-fledged VLR.
In this context, this paper explores two main research questions (rq1 and rq2 below). First, it studies the concept of climate neutrality used in the Roadmap to compare it to that used in VLRs by other LRGs. To address this question, the paper delimits the concept of neutrality of the Roadmap by defining a ‘neutrality toolkit’, i.e., a set of indicators and policy lines through which the document defines the decarbonisation scenarios that city hall plans up to 2050.
rq1. To what extent does the concept of climate neutrality, defined in the Roadmap, relate to climate policy dimensions monitored in other LRGs’ voluntary local reviews?
Second, it tries to bridge the gap between the Roadmap’s strategic framework and the 2030 Agenda, by looking at the degree of compatibility between the Roadmap’s policy focus and recommendations and the SDGs that VLRs are monitoring to report on climate-related policy performance and output.
rq2. What SDGs are more resonant with the policy dimensions of climate neutrality that the Roadmap and the sampled VLRs are adopting?
The remainder of the paper is structured as follows: Section 2 contextualizes the institutional process that led to the definition of the Roadmap, with a specific focus on: (1) path-dependency on Madrid’s long-standing experience and initiatives on decarbonisation and emissions reduction; and (2) linkages with the city’s proactivity in international and European local diplomacy. Section 3 introduces the concept of neutrality as extracted from the contents of the Roadmap, as well as the methods that are used to set up the comparison with a sample of 22 VLRs published globally. Section 4 presents data from the analysis and discusses the findings on the two research questions. Section 5 concludes with the main outcomes of and takeaways from the paper’s analysis.

2. Road to the Roadmap: Path-Dependency and International Projection

The Roadmap to Climate Neutrality by 2050 is the policy-planning document within which the city of Madrid set out the policy mechanisms to reach its 65% GHG emissions reduction objectives within the municipal limits on the baseline of 1990 levels by 2030. This objective sets a higher percentage reduction than the EGD—which aims at a 55% cut by 2030—on the way to full neutrality by 2050. The Roadmap identifies three potential scenarios according to the degree of required policy intervention: business-as-usual (trend), intensive (sustainable), and intensive with full innovation and technological penetration (extended). Uncertainty on policy outcomes and the confidence of the policy scenarios is acknowledged to increase with each higher degree of policy intervention.
The policy items selected in the Roadmap build on the city’s long-standing experience with decarbonisation planning and serve as the latest piece on the city’s consistent path of interventions. The Roadmap, moreover, aimed to align “municipal policies with European and state policies” [1] (p. 3) and has worked as the city’s response and commitment to the requirements of European and global frameworks. The following subsections address these issues.

2.1. Madrid’s Work on Emissions and the Roadmap’s Path-Dependency

The Roadmap is nested within the ‘Madrid 360 Environmental Strategy’, the city’s larger climate-related strategic framework. Madrid 360 was established in September 2019 with the goal of transforming “Madrid into a more environmentally sustainable city”, as a driver of improved “quality of life” and “greater security and resilience in the face of climate risks” [1] (p. 3). The strategy is also designed to align the city’s sustainability policy to the requirements of Directive 2008/50/EC, through a plan based on urban environment, sustainable mobility and open administration measures.
Madrid 360 and the Roadmap are but the latest steps on a policy path that has engaged Madrid with decarbonisation and local climate action for the last 15 years. In June 2008, Madrid’s city council adopted its Plan on the Sustainable Use of Energy and Prevention of Climate Change (Plan de Uso Sostenible de la Energía y Prevención del Cambio Climático de la Ciudad de Madrid). The Plan de Uso is a policy planning document which budgeted over EUR 100M for a set of 55 initiatives designed to curb energy use by 342,000 MWh/year and CO2 emissions by 691,000 tonnes/year [18]. In 2017, Madrid’s city council adopted the Plan A: Air Quality and Climate Change Plan for the City of Madrid (Plan A: Plan de Calidad del Aire y Cambio Climático de la Ciudad de Madrid). The report worked with 2020 as a short-term deadline for the city to comply with air quality and pollution goals required by EU-compliant local legislation, and 2030 as a longer-term threshold for Madrid to undertake “the necessary energy transition and consolidation of a low-emission city model” [19] (p. 2). The analysis built on city-wide data on CO2 emissions (on a 25-year time-series) and concentrations of other key pollutants (NOx, SO2, NH3, NMVOC, PM10 and PM2.5) on a 15-year time-series with 2012 as baseline. Plan A also took an important step in terms of linking city policy with the global framework, as it vowed to “achieve by 2030 an over 40% reduction in total GHG emissions in the municipality of Madrid compared to 1990, thereby helping to meet the objectives of the Paris Agreement and the EU Climate Agenda, and in line with the new Covenant of Mayors for Climate and Energy” [19] (p. 19). As the Roadmap’s contents and categories mirror those of Plan A, it can be argued that the Roadmap updates those policy goals to the new standards defined by the EGD.
This path-dependent process has bridged the gap between local data from the city council’s resources on air quality and urban decarbonisation and the strategic frameworks at the European and international level. It has also informed several other aspects of Madrid’s policy approach to the reduction of GHG emissions. Approved in July 2020, the ‘Villa Agreements’ (Acuerdos de la Villa) laid out over 350 local policy measures to be implemented for socio-economic recovery in the face of the COVID-19 pandemic. In 2021, Madrid published the ‘2019–2023 Operational Government Plan’ and the ‘Localization Strategy for the Sustainable Development Goals of the 2030 Agenda in the City of Madrid’, i.e., the city’s strategic framework for the local implementation of the 2030 Agenda, currently the city’s core guideline as it drafts its first VLR. In late 2021, the city council also published the strategic planning document ‘Recovery, Transformation and Resilience Plan for the City of Madrid’ (MRRP), as well as the all-encompassing ‘City of Madrid’s Report on the State of the Urban Agenda’. The latter attempts at bridging the city council’s efforts on sustainability policy with the commitments set out by national, European and global policy frameworks—with a specific focus on Madrid’s compliance with Spain’s national urban agenda.

2.2. The Roadmap and Multi-Actor Policy Partnerships: Local and International Dimensions

The city council also developed the Roadmap as a contribution to Madrid’s strategic effort as a front-running city against climate change and the challenges that it poses to the local level. As evidence collected via interviews for previous work suggests (Ciambra, 2022), the city’s participation in the 2015 United Nations Climate Change Conference in Paris was a wake-up call for Madrid’s municipal government. As pointed out in interviews with Madrid representatives, after the UN Climate Change Conference in Paris in 2015 (COP 21), Madrid “knew it could work as a living laboratory to test a sustainable urban model consistent with the requirements of the Paris Agreements and, later, the 2030 Agenda and the European Green Deal” [20] (p. 10).
Madrid also built on a growing multi-actor partnership that saw city hall actively engage with a coalition of research institutions, private sector businesses, and civil society stakeholders. The partnership took part in one of the ‘Healthy, Clean Cities Deep Demonstration’ of the Climate—Knowledge and Innovation Community (KIC) programme. Finally in 2022, Madrid was selected as one of the one-hundred cities participating in the ‘100 Climate-Neutral and Smart Cities’ Mission—one of the five ‘Mission’ funding and policy frameworks that the European Commission introduced as part of the Horizon Europe programme. As part of the commitments for the EU Mission, the city of Madrid will have to define its own climate city contract, setting “out their plans to achieve climate neutrality by 2030” [21] (p. 3). The Roadmap will be Madrid’s baseline document for their climate city contract.
Consistent with a sustained international presence, Madrid also increased its activity within the Cities Climate Leadership Group (C40) global network, an organisation gathering about 100 mayors around an agenda to mitigate and reverse the most pressing impact of climate change at the local level. Through its Deadline 2020 programme, C40 has also engaged its members to develop local ‘climate change action plans’ in compliance with the Paris agreements and with a baseline commitment to curb GHG emissions by 40%. The Roadmap also serves as Madrid’s action plan in this framework.

3. A Localized Concept of Climate Neutrality? Definition and Methods

This paper uses the indicators and policy ‘lines of action’ set out by Madrid’s Roadmap to understand what concept of neutrality the city is aiming to achieve: what policies are considered part of this toolkit? Through what specific initiatives does Madrid hope to cut emissions? How much does a policy intervention (and in which socio-economic sector) contribute to the decarbonisation goal?
In setting out guidelines for a 65% cut in GHG emissions by 2030 on the path to full decarbonisation by 2050, the Roadmap methodology centres on a set of ten indicators with varying degrees of disaggregation and sector-based measurements, i.e., emissions by residential, commercial and industrial activity, and emissions by road transport, and emissions of CO2 within municipal limits. Table 1 lists the ten indicators, their units of measurements and time availability, as well as the main source of related data.
The rest of Madrid’s ‘neutrality toolkit’ is organized into six comprehensive policy sectors: the decarbonisation of the electricity system; zero-emissions residential buildings; zero-emissions transport; zero-emissions service sector buildings and premises; reducing waste impact; reducing emissions in other sectors.
These key sectors are then structured down to 19 “policy drivers” (palancas), including the establishment of local ‘energy communities’, reducing energy demand via energy isolation and efficiency, electrification and renovation of municipal vehicle fleets, reduction of waste generation, collection and treatment of organic waste, and the naturalization and reforestation of the city.
These policy drivers, finally, are operationalized through 48 lines of action, i.e., the policy initiatives and measures through which the city plans to achieve the 2050 decarbonisation goal. The lines of action are not indicators proper: they list the policy dimensions on which the city plans to intervene to achieve its mid- and long-term objectives on climate neutrality. In this regard, the policy lines refer to measurable objectives in a way that is so technically and discursively proximate to that of many ‘conventional’ indicators often and commonly used in local SDG implementation monitoring, that it is possible to compare the policy dimensions to which they refer across a range of diverse documents. A full list of the Roadmap’s policy lines is available in Table A1, in Appendix A.
These metrics enable comparison between Madrid’s neutrality toolkit and the climate-related indicators selected in a sample of VLRs by other LRGs. To assess the policy balance of each local government’s approach to climate neutrality, this paper identifies five core categories of Madrid’s neutrality toolkit:
  • GHG emissions and air quality;
  • Mobility and transport;
  • Energy efficiency;
  • Waste management; and
  • Efficient city services.
Section 4 analyses differences and similarities in each document’s approach to climate neutrality and sustainability according to these five categories.

Methodology: A Climate Neutrality Map as Comparison between the Roadmap and the VLRs

This paper analyses 22 published VLRs from local governments worldwide looking for indicators that, in their use of language, terminology or measurement: (1) fit any of the five categories adopted for the ‘neutrality toolkit’ comparison, i.e., the indicators they use clearly have a connection with these policy dimensions; and (2) can be easily and clearly referred to a comparable or proximate Roadmap indicator or line of action.
For the definition of a meaningful sample (considering the large amount of raw information available), VLRs that: (1) use indicators and data, and (2) tend to analyse all or most SDGs were preferred. Additionally, documents produced by local governments in a socio-demographic situation comparable to that of Madrid were also given priority. In addition to Madrid’s Roadmap, documents produced by the following 17 LRGs (out of 113 available for analysis at the time of writing) were found to meet the two main selection criteria: Asker [22], Barcelona [23], Belo Horizonte [24], Bonn [25], Bristol [26], Buenos Aires [27], Dangjin [28], the province of Deqing [29], Espoo [30], the province of Jaén [31], Los Angeles [32], Mannheim [33], New York [34], the municipality of São Paulo [35], Taipei City [36], Taoyuan [37], and Yokohama [38]. The diversity of the characteristics of the sample cities and regions was considered positive for the analysis, as the objective was not to compare similar kinds of areas (and possibly VLRs representing ‘similar’ cities and regions), but on the contrary, to have in the sample VLRs from different populations, economies, political systems and urban functions.
The most obvious example of the proposed comparison method are indicators on GHG emissions. The Roadmap indicator reads [1] (p. 9):
Total GHG emissions in Madrid (Mt CO2 eq; 2000–2015)
The United Nations’ Global Indicator Framework for the SDGs defines Indicator 13.2.2 (to be measured in million tonnes of CO2 equivalent, Mt CO2 eq) on SDG 13 as:
Total greenhouse gas emissions per year
The VLR of the Brazilian city of Belo Horizonte uses indicator O13-I02:
Per capita emissions of carbon dioxide (t CO2 eq/inhab.)
These three metrics are close in language, scope and measurement, and various similar instances can be found across almost all VLRs that use indicators or data that address SDG 13. Proximity between indicators and lines of action can sometimes be less straightforward. One of the Roadmap’s lines of action recommends cutting GHG emissions via increased replacements of conventional heating systems with heat pumps:
[Residential equipment] replacement with heat pump
It is less common to find metrics that approach energy efficiency in residential buildings with this level of detail in other VLRs. However, the VLR of the Finnish municipality of Espoo adopts the following indicator for SDG 7 on affordable and clean energy [30] (p. 220):
Number of geoenergy wells for ground source heat pumps
Even if discursively distant, both metrics refer to a very specific issue (heat pumps for residential heating) and address it from the same policy context: this closeness of scope is considered sufficient to regard both metrics as proximate in the energy efficiency category for the sake of this study.
To avoid misrepresentation of specific data approaches in some of the VLRs and documents analysed in the study, the comparative data is relativised against the total number of indicators that form the ‘neutrality-related’ toolkit of each VLR/document, consistent with the Roadmap’s approach to this policy concept. This was necessary in order not to overestimate the prevalence of neutrality-related indicators in reviews that have a larger number of indicators and/or use data and indicators for all or most SDGs—as opposed to documents with a more limited reliance on metrics or those that only analyse specific subsets of SDGs. These neutrality-related figures are also compared to the total number of indicators used in the VLRs that were analysed. This could provide insightful information on how relevant this practical approach to climate neutrality as a policy priority was when local governments designed their reviews and/or set up their data.
Finally, since many VLRs link specific indicators with specific SDGs, the composition of the review’s neutrality-related toolkits was disaggregated per SDG whenever possible. This provides a helpful overview of which SDGs are considered more relevant when planning climate neutrality initiatives and targets.

4. A Data-Map of Neutrality in Local SDG Implementation and Monitoring

Table 2 shows an analysis of the Roadmap’s ‘neutrality toolkit’ comparison with a sample of VLRs and similar SDG-related documents that provide information on comparable, contextually proximate data and metrics. Considering the 58 metrics of Madrid’s roadmap as the baseline neutrality toolkit, this analysis sought conceptually and technically comparable indicators in published SDG-related documents. The resulting information can be interpreted through several variables that can help define Madrid’s standing vis-à-vis the work that other LRGs have carried out to measure their compliance with the SDGs and their performance on specific dimensions of climate neutrality, climate change and sustainability policy more generally.
This paper suggests three basic readings of the data on the VLRs’ neutrality toolkits:
  • A comparison of the core dimensions of climate neutrality emphasized in VLRs and similar documents in terms of collected data and measured indicators;
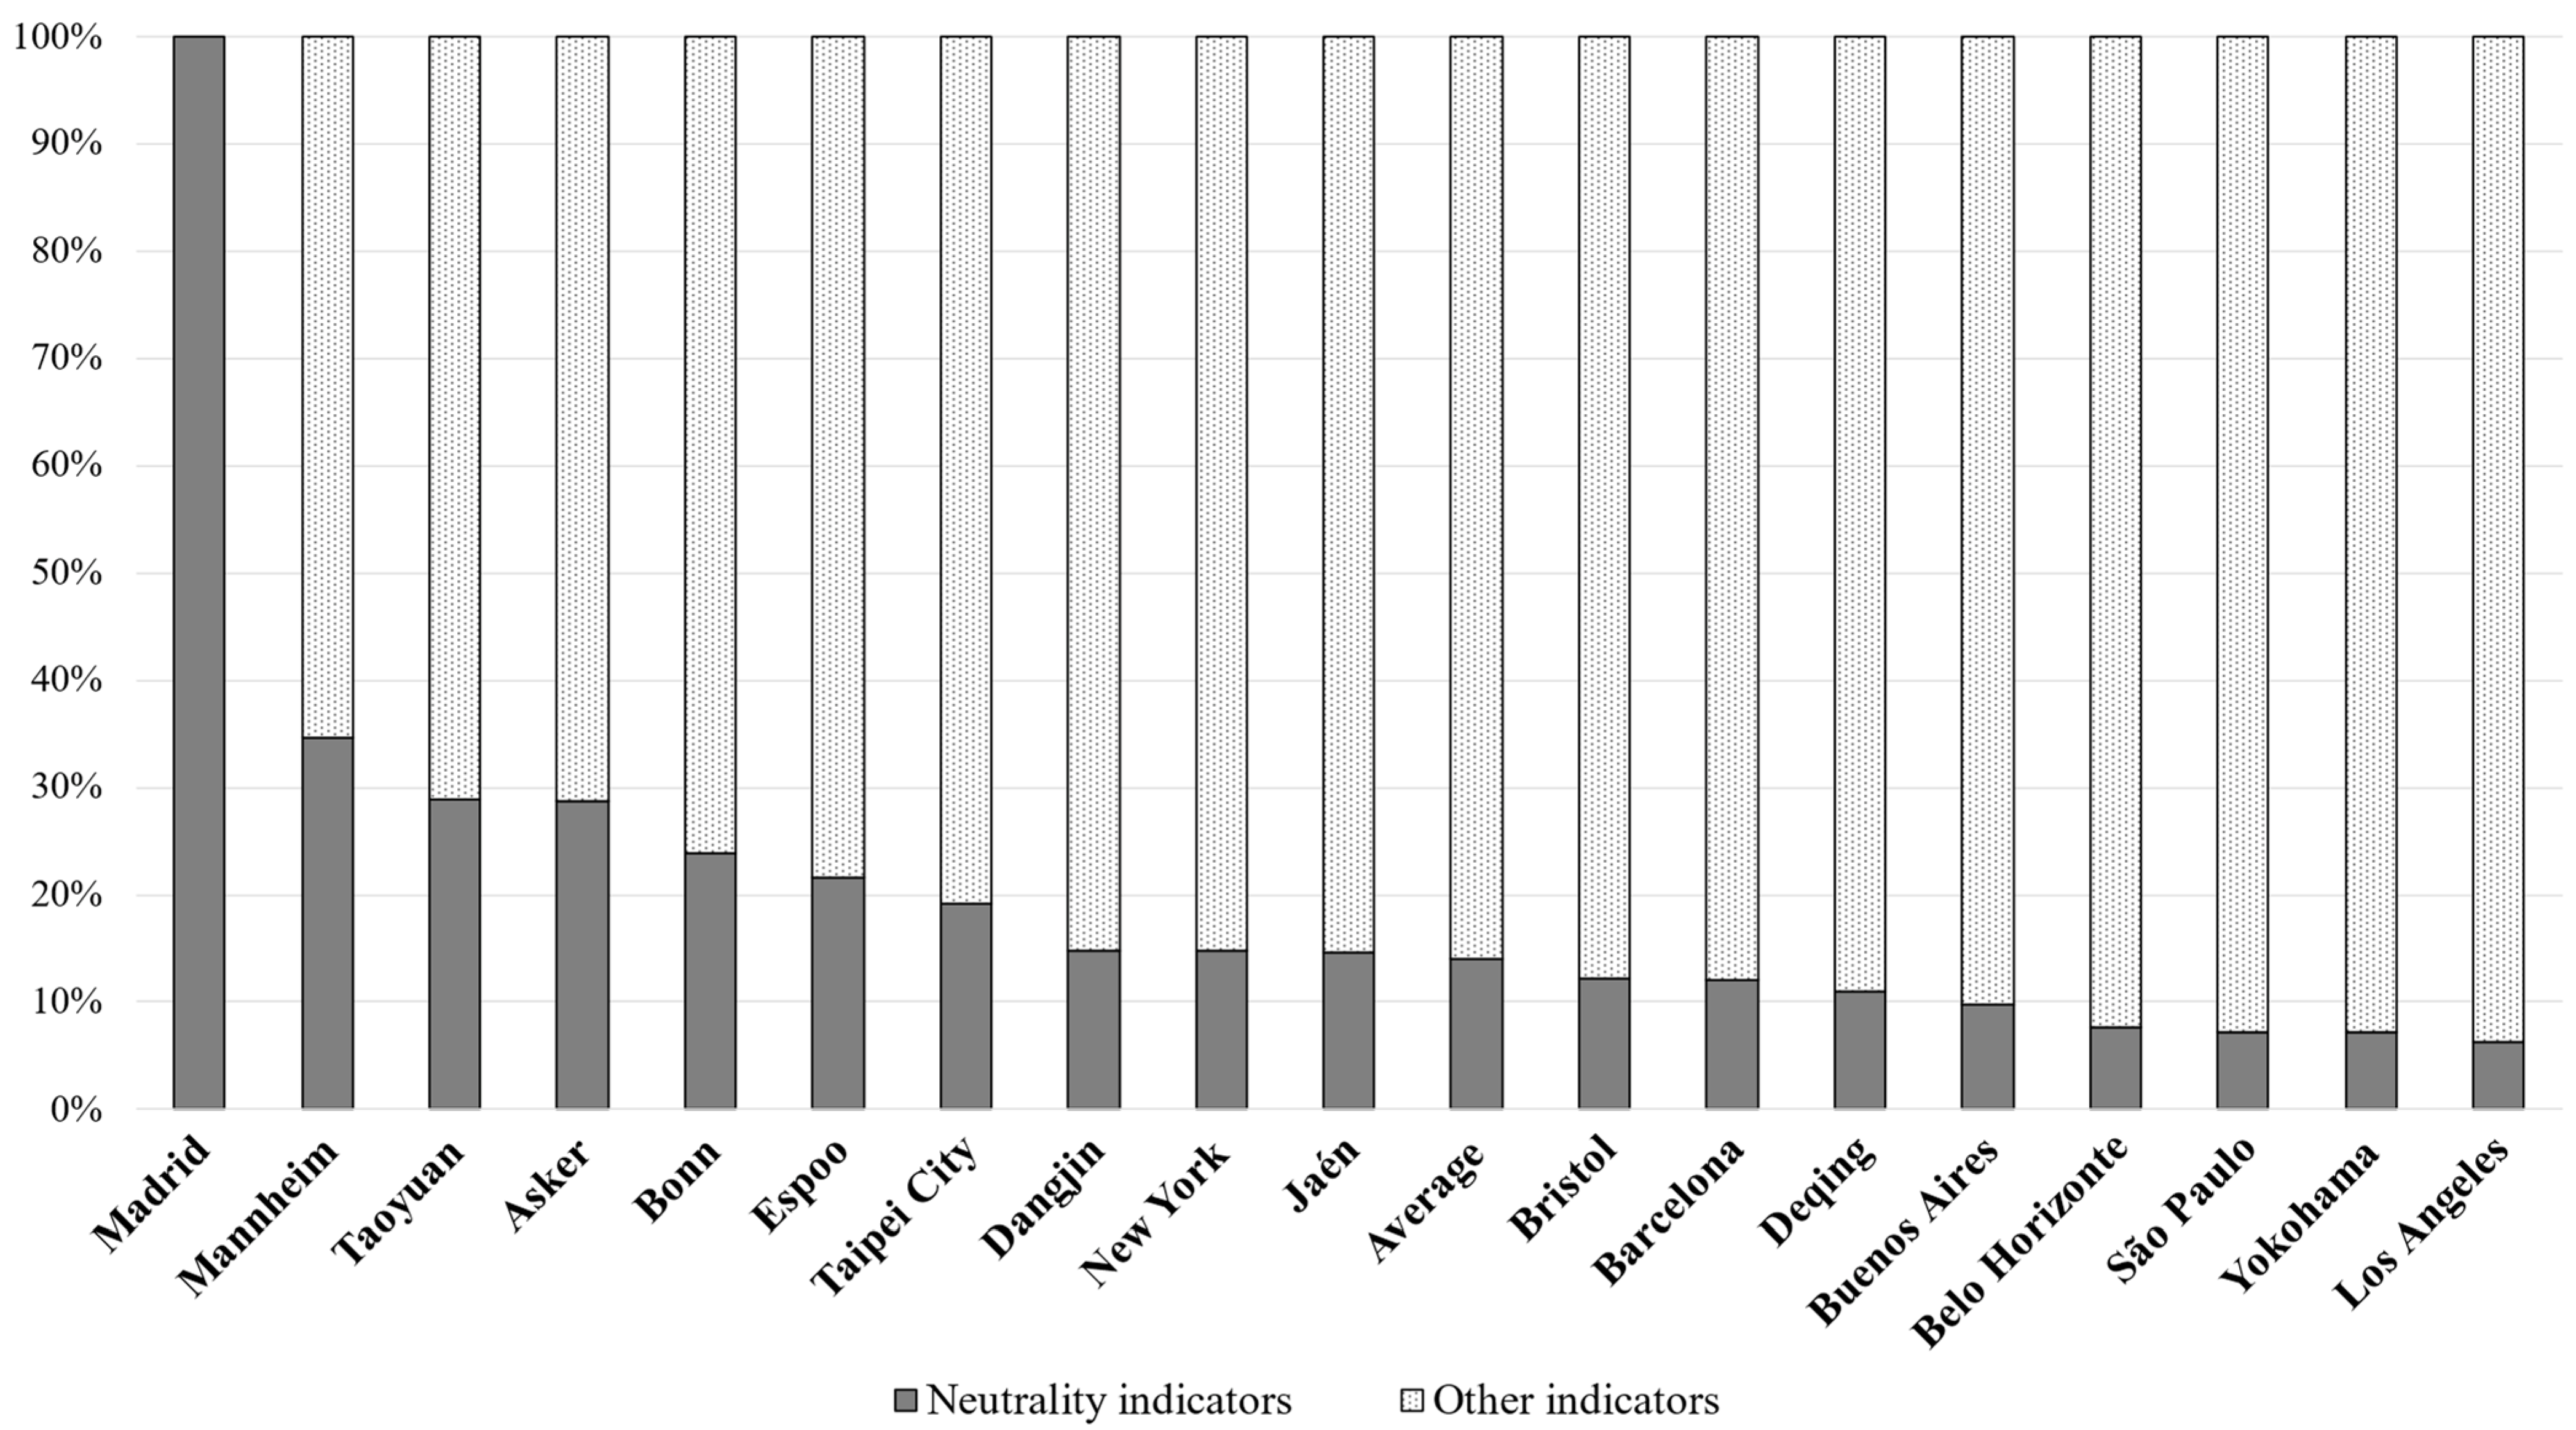
  • An overview of the relevance of each document’s neutrality toolkit over the total of indicators used;
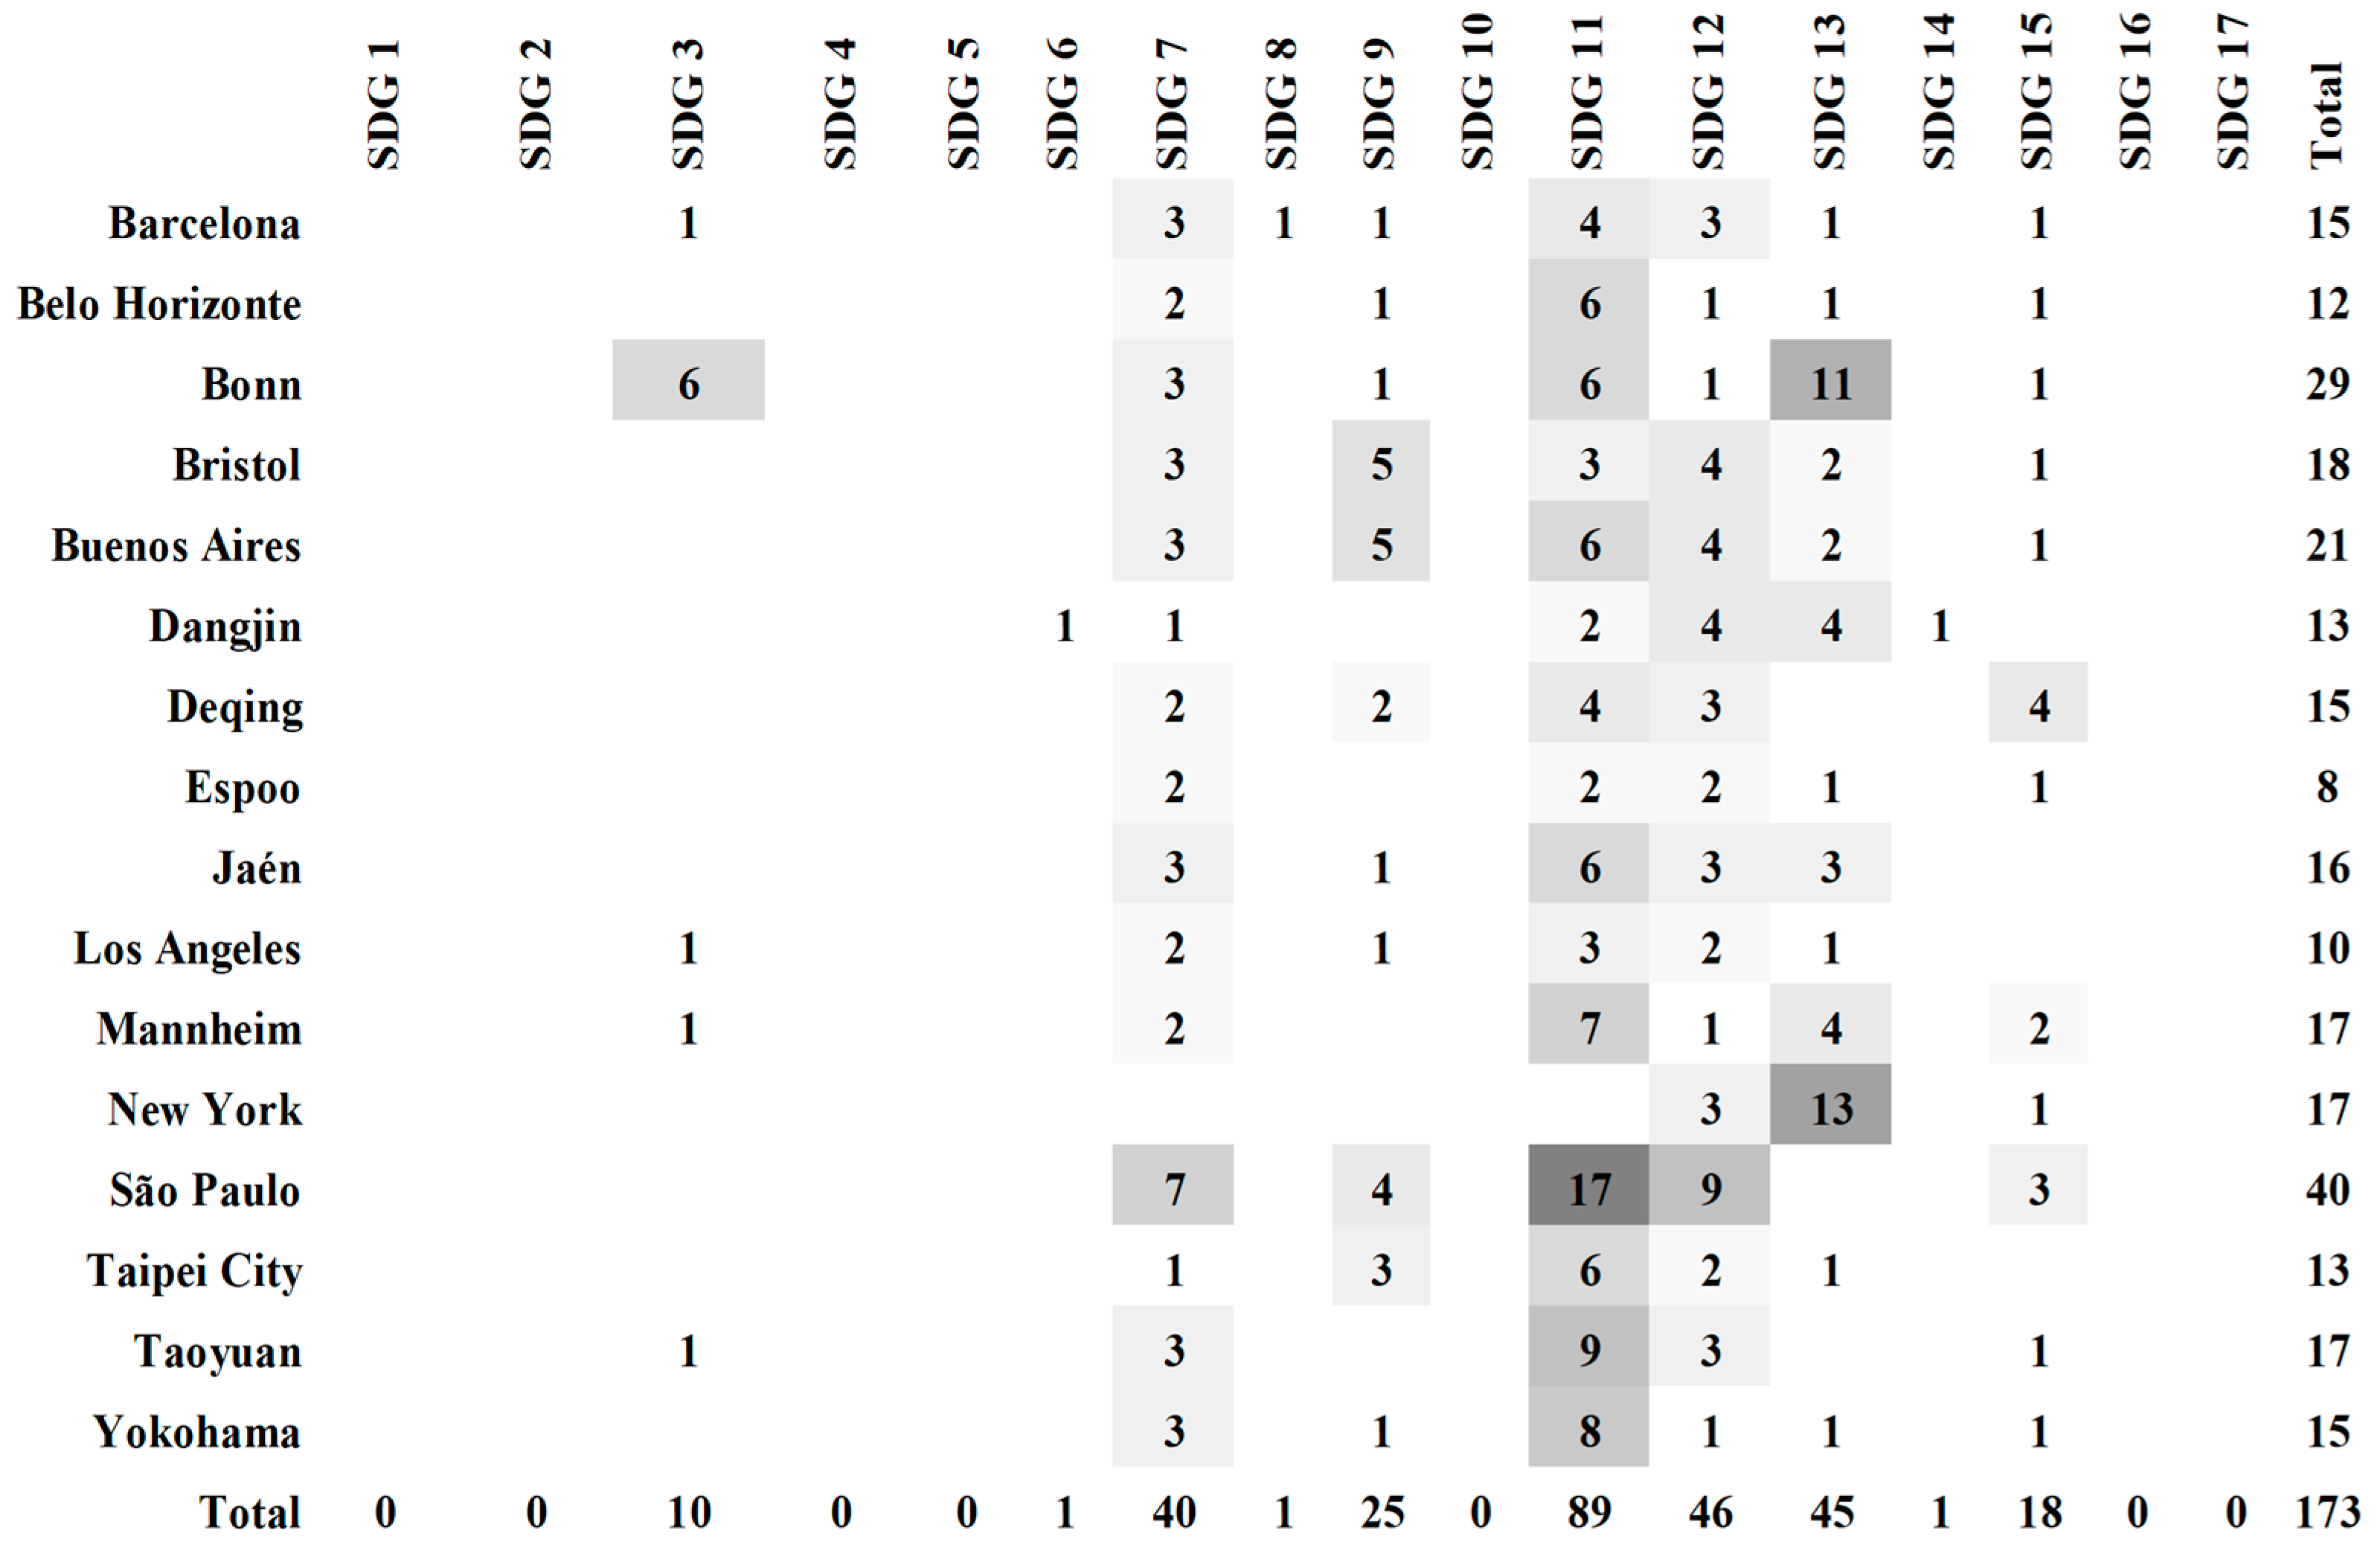
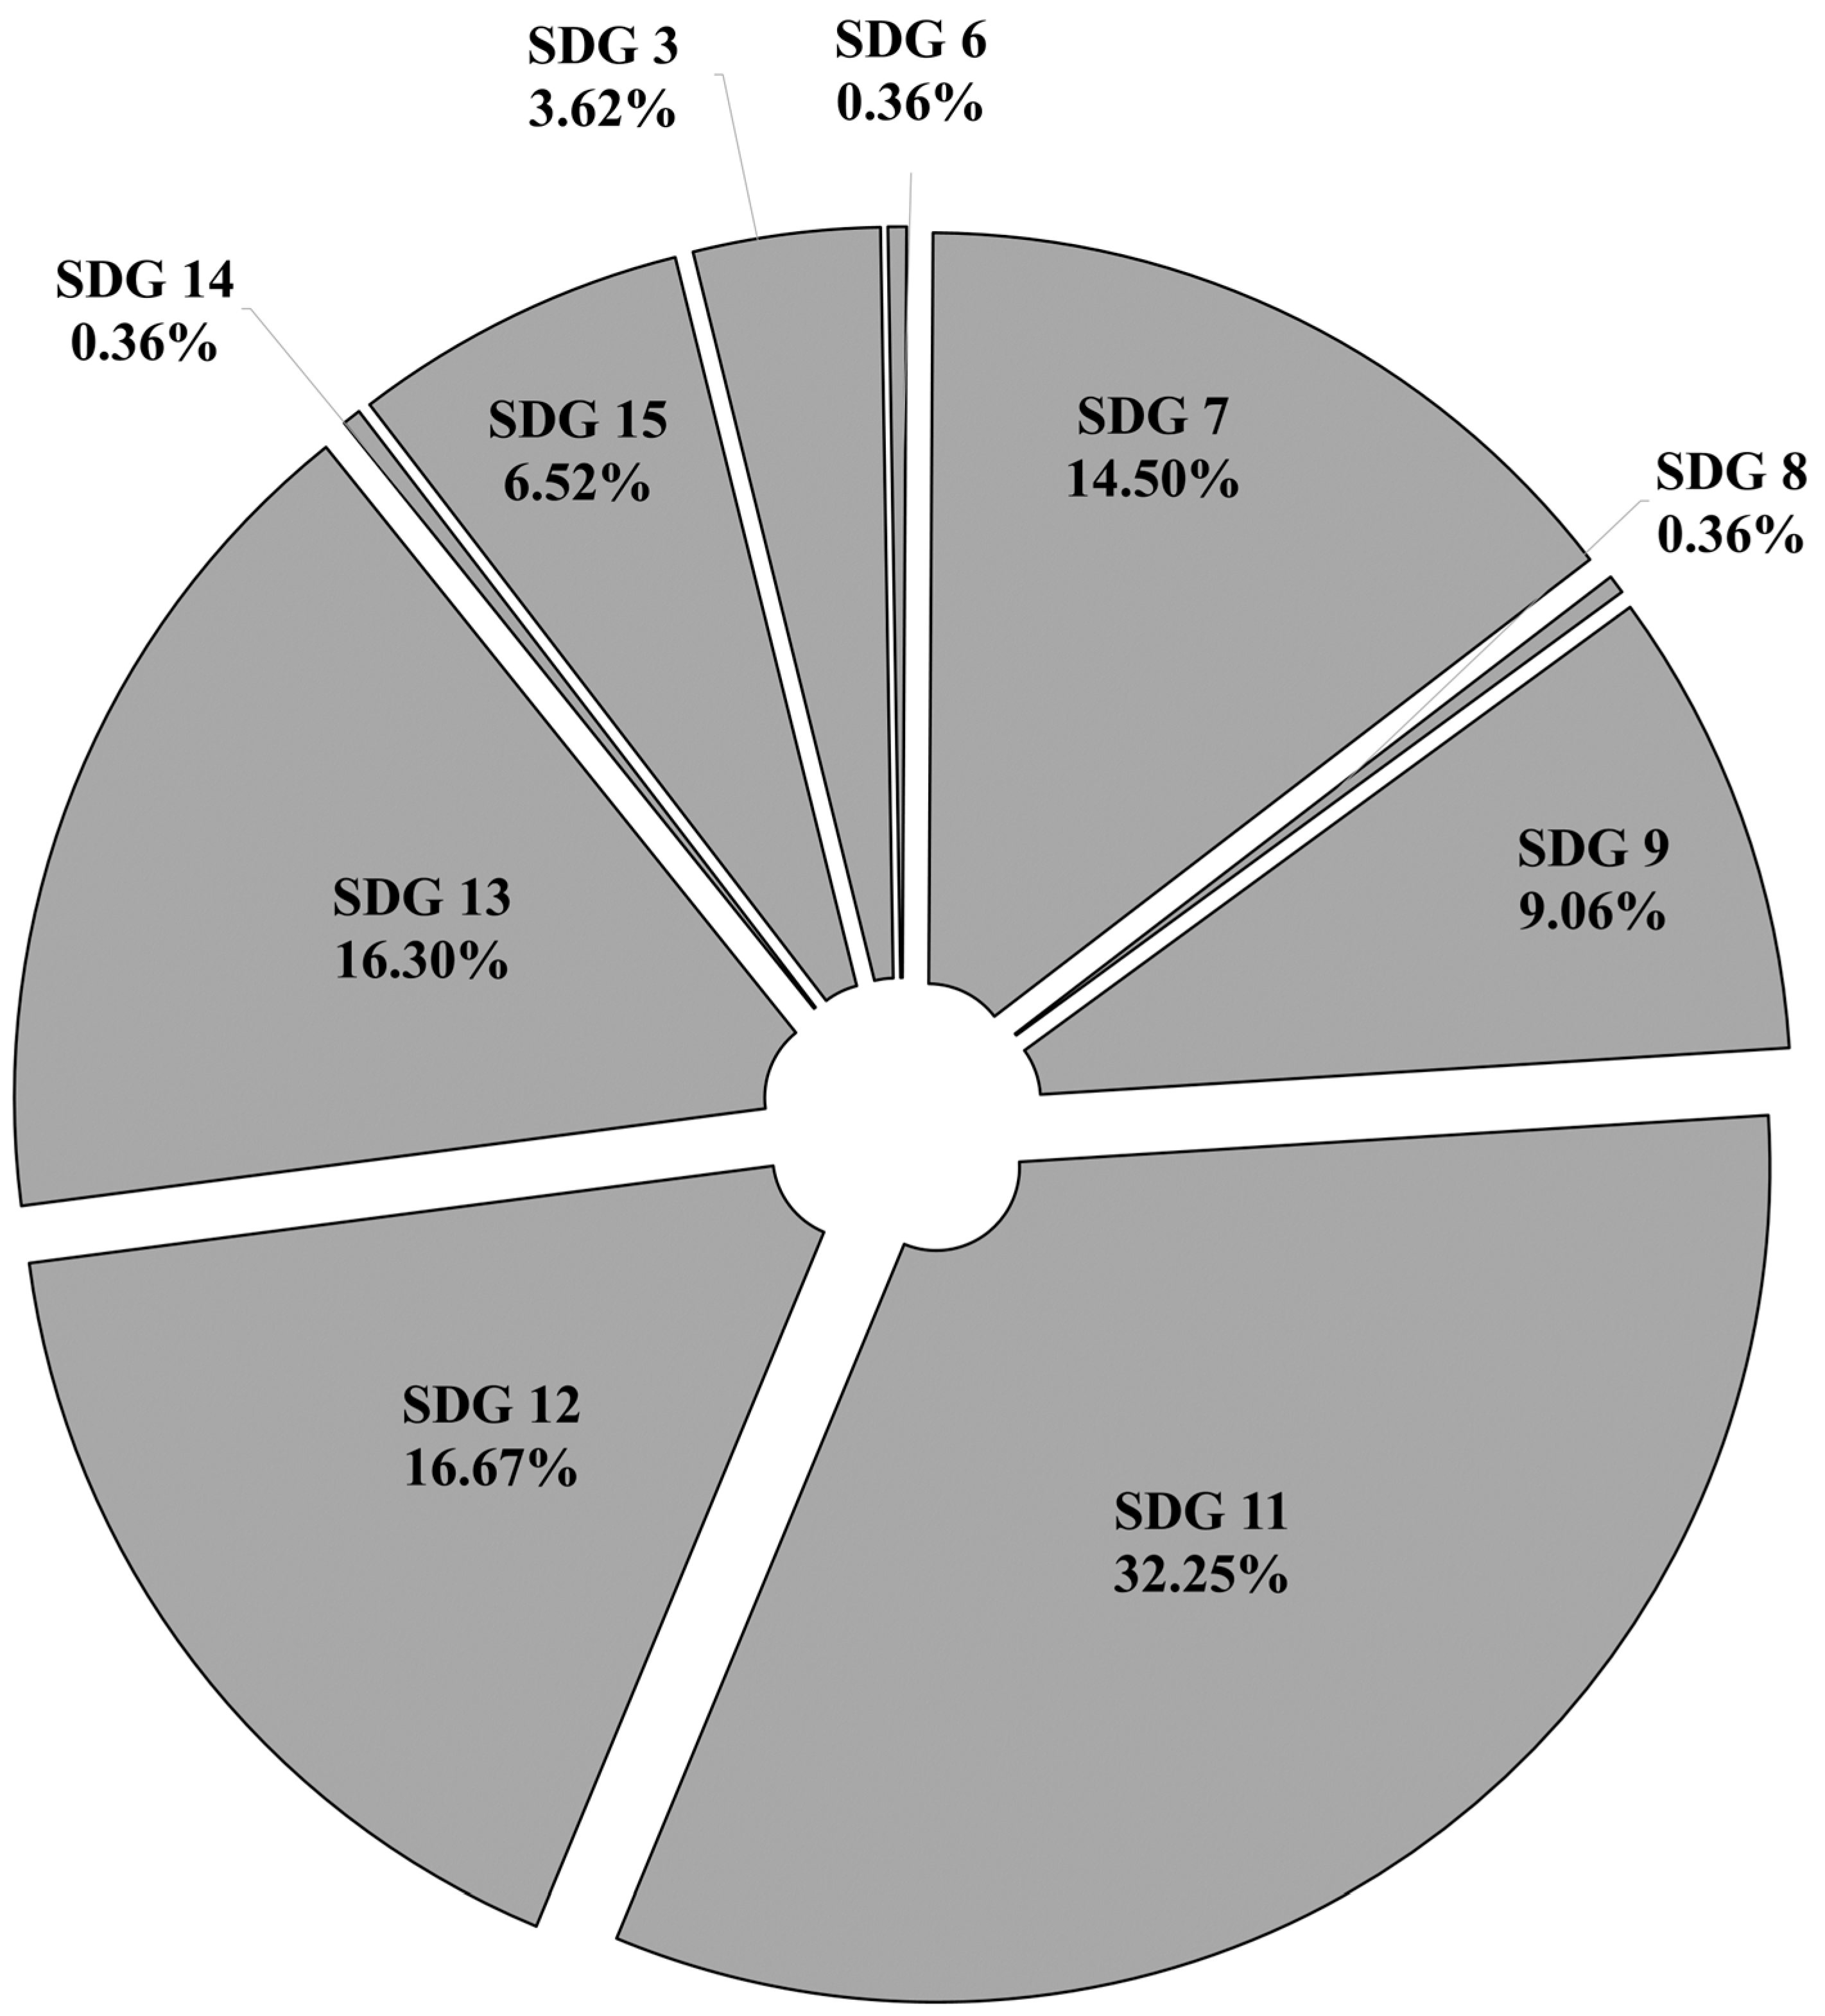
  • An overview of how the metrics included in such neutrality toolkits are being allocated to specific SDGs.
Available data show that there is significant variation across LRGs in the sample in terms of which dimensions of neutrality-related policies are more relevant to their community’s approach to the SDGs and the 2030 Agenda. Most neutrality toolkits—quite independently from the size of the local government or its geographical location—tend to include a larger share (over 36%) of indicators addressing GHG emissions and air quality, followed by transport and mobility data at just above 25%. Energy efficiency metrics (e.g., building regulations for new buildings, insulation and other efficiency-related practices, refurbishment of public buildings, etc.) account for about 17% of the neutrality toolkits in the sample, while waste management and, most relevantly, recycling and the circular economy account for 15.1%. Efficient city services are the least relevant category (5.2% of analysed indicators), mostly due to the narrow focus of the category, even though a few VLRs (e.g., Taipei City or Asker) have a meaningful focus on smart monitoring in public service provision. Several VLRs measured progress in the renovation of public lighting and/or the provision of smart urban furniture or instruments, but these were more an exception than they were the rule.
Figure 1 plots Madrid’s neutrality toolkit distribution across the five policy categories against an average from the other VLRs included in the analysis. Considering these visuals alongside the data included in Table 2, it is noticeable that:
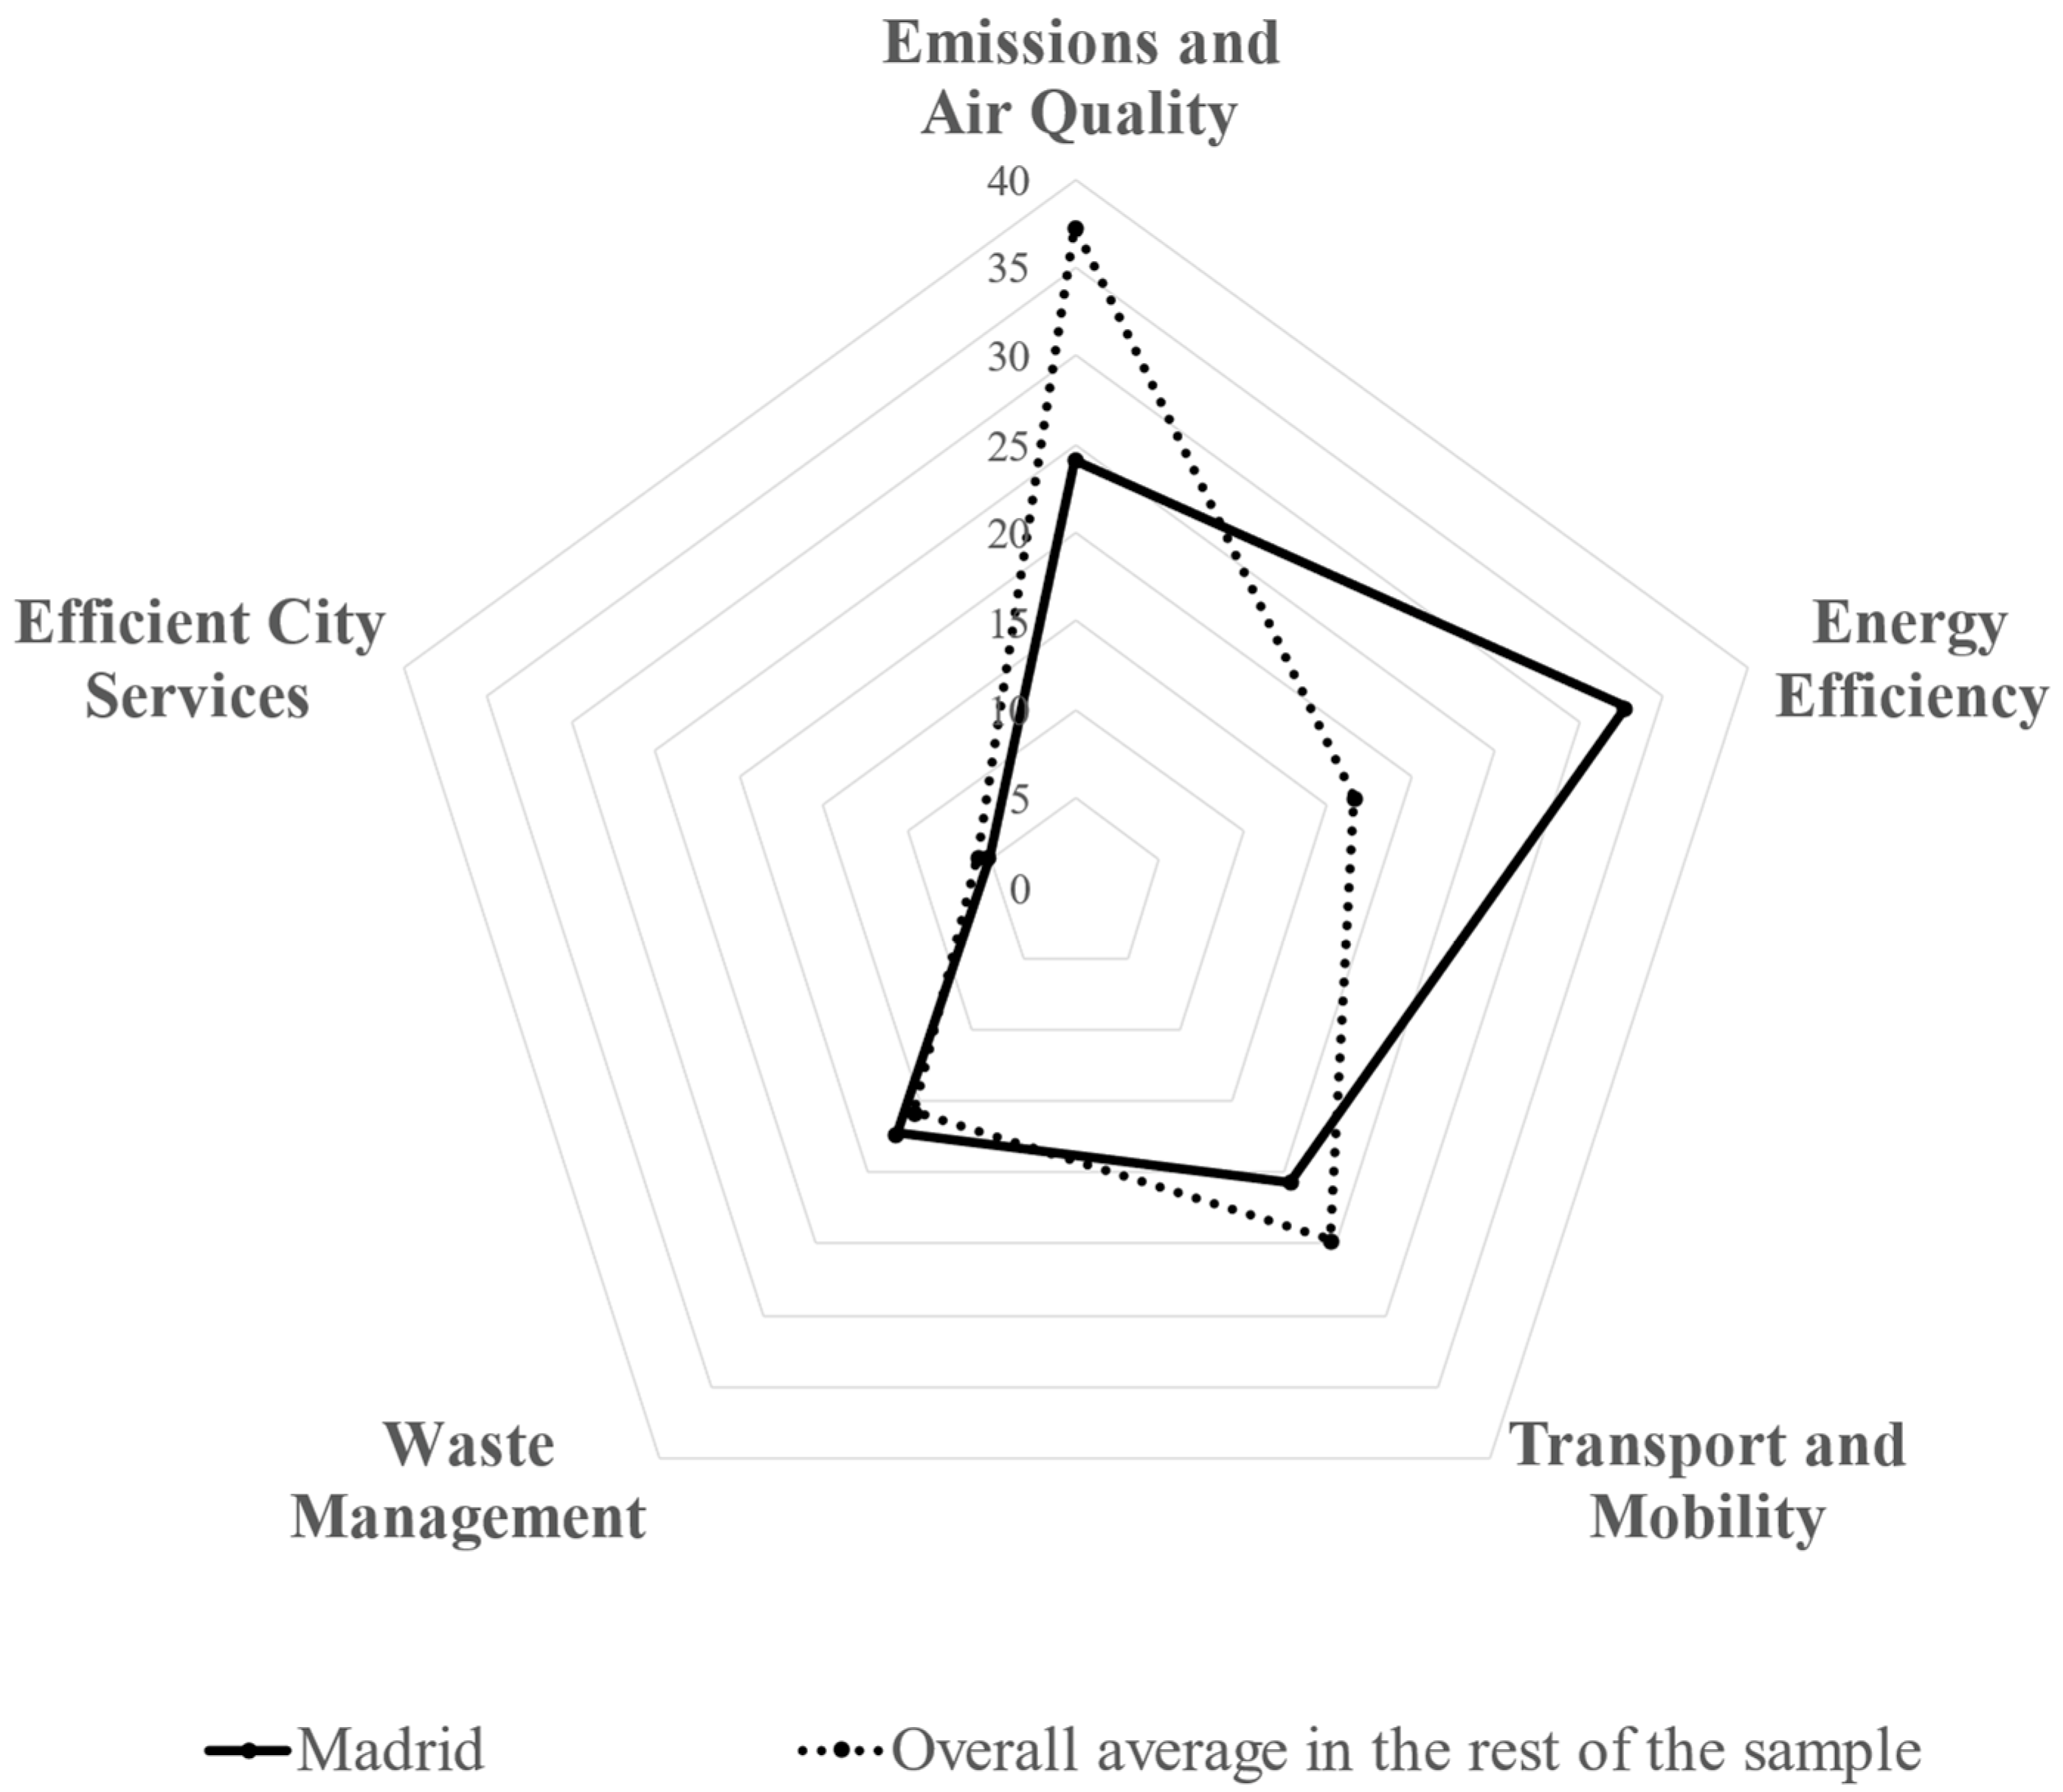
  • Madrid lines of policy action are more equally distributed across nearly all categories in the toolkit;
  • Madrid puts significantly more focus on issues of energy efficiency (+15.8% on average), such as refurbishment and insulation of buildings, as well as more efficient and sustainable ways of providing building heating;
  • Madrid’s quota of metrics dedicated to emissions and air quality and transport and mobility is lower than in most other documents.
As for energy efficiency, several local governments collect and report on data and information about efficiency in buildings, and public buildings in particular, but there are much fewer instances of data-driven analysis on (residential, commercial or public) heating or climate-oriented initiatives in support of refurbishing. This can partly explain Madrid’s separation from the average.
As for Madrid’s focus on mobility, the share of indicators dedicated to transport was significantly higher in the first iteration of the Roadmap in 2021, but mostly because of a technicality: following the 2022 update, some previously disaggregated metrics (e.g., electrification in private transport, commercial services and municipal fleet were each an individual line of action) have now been merged into fewer, more comprehensive ones, lowering the relative relevance of transport over the total number of lines of action.
As regards the limited share of emission-related lines of action, this may read counterintuitively considering that the Roadmap is a policy document designed to reduce CO2 emissions and improve air quality. It should be taken into consideration that the Roadmap favours a more integrated approach across all neutrality dimensions, whereas other local governments tend to rely extensively on GHG emissions as an overall litmus test for progress on SDG 13 and other climate-related objectives. It should also be noted that most air quality metrics in VLRs rely on the measurement of particulate matter and other hazardous elements, an inherently local task that many local governments have been carrying out for decades with locally-sourced databases and monitoring. Air quality and emissions indicators, in other words, may be especially available to local governments, even in long-running time series and disaggregated sets, thus making them a readily available and inexpensive tool to monitor and show progress on a sensitive topic, such as climate change mitigation and decarbonisation policy.

4.1. Neutrality as Part of the Local Government’s Sustainability Policy Agenda

The analysis carried out in this paper also provides interesting insights into the role that neutrality as a policy concept or category plays in local governments’ approach to the 2030 Agenda, the climate emergency and sustainability policy more generally. This study looks at this issue from two different points of view: (1) the relative prevalence of neutrality-related indicators (calibrated on the Roadmap’s selection of policy actions) over the total of metrics that a certain VLR or document takes into consideration; and (2) the distribution of such neutrality-related indicators across the 17 SDGs.
Figure 2 shows the relative prevalence of neutrality-related indicators over the total used in document reviews. The Roadmap stands out in this group, considering that the entire structure of its indicators and lines of action is devoted to climate neutrality. No other reviewing document comes close to its 100% dedication to neutrality. Almost 35% of Mannheim’s VLR indicators could be considered close to the Roadmap’s concept of neutrality, whereas Taoyuan and Asker’s are close to 29%. Bonn and Espoo are the only other VLR documents in which neutrality-related indicators account for more than 20% of all metrics. It is worth noting that these percentages are affected by the 2022 update of the Roadmap’s lines of action: compared to the original version published in 2021. For instance, Taoyuan’s neutrality ‘toolkit’ would not include several waste management indicators related to incineration and electricity production. Similarly, as the new version of the Roadmap introduced lines of action on widely available metrics, such as tree cover or local renewable energy production, the total average of neutrality-related indicators rose from 10% to 14%.
Considering the small sample and the specific design of the Roadmap choice of policy initiatives, however, it is hard to draw any hard conclusions on the actual weight that climate neutrality and its related indicators have on these local governments’ overall approach to the SDGs and localisation. On the one hand, the SDGs explicitly approach climate neutrality only with SDG 13. On the other hand, however, the climate emergency impacts so many policies that it has become a truly transversal issue which affects almost all sectors. Climate neutrality commanding 14% of all metrics in a framework that acknowledges 17 key policy fields can be considered a testament to the relevance that climate has in the policy agenda of many and diverse local governments.
It is also notable from the raw data in Table 2 that the higher the number of total indicators used in a review, the lower the relative share dedicated to climate neutrality. For example, São Paulo has the most neutrality-related indicators in absolute figures (40) besides Madrid, but the third-lowest relative prevalence (7.2%), as the city has established a massive data-management platform that controls information on 557 different indicators. VLRs with larger indicator sets tend to have access to larger amounts of data sourced and managed locally [39], which inevitably dilutes the relative weight of specific issues such as climate. At the same time, this favours policy sectors (e.g., health, education, housing, labour and social security) where larger amounts of local disaggregated data can be simply and inexpensively available

4.2. Neutrality Toolkits as Part of the SDG Spectrum in Local Reporting

Madrid’s Roadmap is also sui generis to the extent that the document itself is defined as a target to implement SDG 13 in Madrid by the city’s SDG localisation strategy. Consistent with this perspective, the Roadmap’s ten ‘pure’ indicators are all dealing with GHG emissions—in line with the UN’s official indicator 13.2.2 on total GHG emissions per year. However, if the lines of action were operationalized, progress in implementation would have to be monitored with indicators that have commonly been used for various SDGs other than SDG 13. Figure 3 provides a ‘heat map’ of how many indicators have been linked to what SDGs in the VLRs included in the sample (N = 16). Figure 4 is a visualization of the share of neutrality indicators connected to specific SDGs in these reviews.
The map of neutrality-related indicator distribution per SDG in the VLRs shows a prevalence of SDG 11 on sustainable communities (32.2% of all indicators), a transversal goal which often includes metrics with a connection to many key urban dimensions. Most metrics on public transportation, modal shifts to non-motorized options, air quality and exposure to hazardous levels of air pollution, and a share of indicators on recycling patterns are included in SDG 11 monitoring. SDG 12 is the most common frame for indicators on recycling, waste management and the implementation of circular economy. SDG 7 generally contains indicators of energy efficiency (including renovation, heating and insulation) and the production and distribution of renewable energy. SDG 13, unsurprisingly, is the goal of reference for most measurements of GHG emissions and most air quality indicators.
The SDG distribution of neutrality indicators was the part of this analysis on which the 2022 update of Madrid’s Roadmap had the largest impact. The update expanded the Roadmap’s ‘toolkit’ to include a few more lines of action, the focus and language of which are often found in VLR indicator sets. Several indicators in the VLR sample were now consistent with the Roadmap’s new line of action on “locally-produced renewable electricity”, which added to SDG 7’s overall relevance. The update also introduced initiatives about lower reliance on waste-generated electricity or improved plastic recycling, which increased the share of SDG 12 indicators. The introduction of a policy line on tree cover added several references to SDG 15 to the set of selected indicators: ultimately, 18 indicators in neutrality toolkits across VLRs refer to SDG 15 (6.5% of all indicators) following the Roadmap’s update, whereas originally only one indicator was counted in the pre-update analysis.
The ‘heat map’ is, however, a testament to the pervasiveness of climate neutrality as a key policy issue that affects various core competences of local governments. It is also very helpful to highlight aberrations, i.e., those instances that do not align with ‘normal’ values, as well as those indicators that—while useful to study climate neutrality policy at the local level—are also connected to SDGs that would not normally be immediately linked to climate change or decarbonisation. Bonn links most of its GHG-related indicators to SDG 3 on health and wellbeing, because of the clear linkage between exposure to pollutants and health and quality of life. The South Korean harbour city of Dangjin, moreover, shows a specific relationship with water-related SDGs. Dangjin’s is the only VLR with an indicator on the re-use of treated wastewater and has the only SDG 14 neutrality indicator in the whole sample: it measures how much of the polystyrene used to sell seafood in the municipal fish market is recycled.
In the end, the distribution of neutrality-related indicators across the SDG spectrum shows that arguing that climate neutrality is a matter of a core group of ‘technical’ SDGs, such as SDGs 7, 11, 12 and 13 would be a knee-jerk interpretation, given the data. There are in fact several indications that local governments are being increasingly aware of the local impact of the current climate emergency on health and economic performance, as well as on key social dimensions, such as economic fairness, equality, and inclusiveness.

5. Conclusions

The Roadmap to Climate Neutrality by 2050, published in 2021 by the City of Madrid, is a relevant case-study in the localisation of sustainability policy for several reasons. It builds on the city’s long-standing experience with air quality and climate change policy initiatives. It provides programmatic support to the city’s international commitment to decarbonisation as it serves, for example, as Madrid’s policy action plan for its participation in the European Union’s 100 Climate-Neutral and Smart Cities’ Mission. It is also an attempt to fully localise pressing policy issues, such as decarbonisation, climate change mitigation and local climate neutrality—setting out local initiatives for an effective long-term decarbonisation of the city, while using locally-sourced data.
This paper studied the concept of neutrality that the Roadmap has defined and attempted at linking it with the 2030 Agenda and the Sustainable Development Goals (SDGs). It did so by comparing the Roadmap with the indicators and data used by other local and regional governments (LRGs) in their local reviews of SDG implementation, i.e., their voluntary local reviews (VLRs) or other relevant local reports, and by studying where the Roadmap’s policy actions are located across the SDG spectrum.
The comparison and findings revealed the following:
(a) There is significant diversity across the VLRs when it comes to the key policy dimensions of neutrality toolkits.
On average, issues of emissions reduction and air quality are still the prevailing component (36.8% of all sampled indicators, not including the Roadmap) of most LRGs’ approach to climate policy and decarbonisation—also considering that emissions measurement is often easily available at the local level and many LRGs have inexpensive access to long time-series data. Transport and mobility, another staple of local policy competences, is also a core element of sampled neutrality approaches (26.1% of all indicators). If compared to other VLRs, the Roadmap’s approach to climate neutrality policy shows a specific policy focus on actions related to energy efficiency (32.8% of all Roadmap metrics, 15.8% more than the VLRs’ average);
(b) No significant relation appears between the Roadmap’s approach and the trends of either other European LRGs or other large (i.e., one million inhabitants or more) municipalities.
It cannot be argued, therefore, that there is a visible ‘European’ or ‘metropolitan’ concept to neutrality with similar priorities or policy goals;
(c) The analysis also offered insight into the current relevance of neutrality and decarbonisation in the localisation strategies of LRGs across different policy and national contexts.
On average, neutrality-related indicators and data account for only 14% of all indicators included in the sampled VLRs. In addition to Madrid’s Roadmap, only three VLRs and strategy documents (Asker, Mannheim and Taoyuan) have more than 25% of their indicators and metrics related to climate neutrality policy.
Since VLRs tend to link their data and indicators to the measurement of specific SDGs and their respective targets, this analysis also provided insight into the link between the SDGs and the various policy dimensions of climate neutrality. Overall, the SDGs that are generally considered closer to issues of climate change, sustainability and emissions reduction—SDGs 7, 11, 12 and 13—are still largely prevalent (79.7% of all indicators). Outsiders include SDG 15 (6.5%, especially for metrics related to tree cover and forest area) and SDG 9 (9.1%, mostly because some mobility indicators on commuting are often categorise under this goal). SDG analysis of neutrality indicators was especially interesting because of specific statistical aberrations: some VLRs list transport or emissions metrics under SDG 3 because of their implications for health and wellbeing; a growing number of VLRs is now exploring the climate-related implications of water SDGs, such as SDG 6 and 14. In general, some of the policy dimensions of certain SDGs, such as SDG 2 on nutrition, SDG 6 on water and sanitation or SDG 10 on inequality remain probably underexplored by current monitoring methods and framework.
The analysis also revealed potential new lines of research in this field. It will be interesting to look at the evolution of the concept of climate neutrality and decarbonisation in VLRs, according to the policy priorities and the indicators and data they use, over a larger time span, e.g., whether specific dimensions, such as energy efficiency, sensorization or sustainable mobility become more or less important in the policy toolkits of local governments. It would be also interesting to replicate this kind of policy-based analysis to fields other than climate change and neutrality. Issues firmly within the spectrum of the 2030 Agenda and the SDGs, such as socio-economic equality or prosperity, provide a wide range of policy actions and objectives, and their complexity and diversity can provide valuable insight into how these issues are perceived and translated into actual policy interventions in different socio-geographic contexts and administrative traditions.
Finally, studying and showcasing how climate neutrality is monitored at a local city level can make significant contributions to the global scale efforts to mitigate climate change. Among others, local monitoring can have a global impact by: setting an example (as is the case of Madrid for other European cities and regions); identifying best practices for reducing GHG that can be shared with other cities and help them accelerate progress towards global climate goals; providing data (as monitoring at the local level can generate data that can be used to inform global climate policy); and fostering innovation (that can lead to the development of new solutions that can be scaled up and applied in other cities around the world).

Author Contributions

Conceptualization, A.C., I.S. and A.S.; methodology, A.C., I.S. and A.S.; validation, I.S. and A.S.; formal analysis, A.C.; investigation, A.C.; data curation, A.C.; writing—original draft preparation, A.C.; writing—review and editing, A.C., I.S. and A.S.; visualization, A.C.; supervision, I.S. and A.S.; project administration, A.S.; funding acquisition, A.S. All authors have read and agreed to the published version of the manuscript.

Funding

This research received no external funding.

Institutional Review Board Statement

The scientific output expressed in this article does not imply a policy position of the European Commission. Neither the European Commission nor any person acting on behalf of the Commission is responsible for the use that might be made of this publication. For information on the methodology and quality underlying the data used in this publication for which the source is neither Eurostat nor other Commission services, users should contact the referenced source. The designations employed and the presentation of material on the maps do not imply the expression of any opinion whatsoever on the part of the European Union concerning the legal status of any country, territory, city or area or of its authorities, or concerning the delimitation of its frontiers or boundaries.

Informed Consent Statement

Not applicable.

Data Availability Statement

All data sources included in the analyses, tables and figures are referenced in the text.

Acknowledgments

This paper builds on research conducted and developed in the framework of the Joint Research Centre’s URBAN2030 and URBAN2030-II project. The URBAN2030-II Project aims at fostering the achievement of SDGs in European cities and regions. It focuses on providing methodological support and inspiration for the design and implementation of SDG voluntary local reviews. It builds on the knowledge and experience gained in the URBAN2030 project (2018–2020) developed with the support of the Directorate General for Regional and Urban Policy.

Conflicts of Interest

The authors declare no conflict of interest.

Appendix A

Table A1. “Lines of action” for emission cuts policy planning in the Roadmap towards climate neutrality.
Policy SectorPolicy Drivers Metrics or ‘Lines of Action’
Electric system decarbonisationAdvocate for a more ambitious renewable energy target and changes to national government1Advocate for a more ambitious renewable energy target and changes to national government on residential sectors, transport sectors and on services, commercial and institutional sectors;
Energy communities2Study of photovoltaic potential and legal formulations to set the roles of energy communities;
Local actions to decarbonise the electric system3Increasing renewable energy generation on municipal buildings and facilities;
4Renewable energy generation for self-consumption;
5Working together with different administrations towards almost near-zero emissions energy and own energy self-consumption urban buildings.
Zero-emissions residential buildingsReduce energy demand improving building isolation and energy efficiency6Improve building isolation and energy efficiency through refurbishing roofs, façades and windows and new control systems, such as in air conditioning;
Shifting to more efficient equipment and installations7Shifting to heat pumps;
8Shifting to natural gas condensing boilers;
9Other equipment, such as garage or elevator ventilation systems;
10Shifting to more efficient household appliances (A+++ vs. A++) and lighting;
Self-consumption11Renewable energy generation for self-consumption.
Zero-emissions transportReducing travel/private transport demand12Reduce work-related travel (private transport);
13Reduce domestic travel by promoting proximity urban planning (15-min city);
14Promoting deterrent policies, such as the controlled parking restricted service (SER), or creating new low-emission (ZBE) and special protection (ZEE) areas;
Modal shift from private vehicle towards different modes/intermodality15Prioritise pedestrian mobility on new urban development, and shift towards it on the rest of the city;
16Promote public transport (bus, train and underground);
17Creating new cycling lanes to promote cycling and micromobility vehicles (VMP);
18Promote shared mobility modes, such as carpool, carsharing or motorcycle sharing;
Fleet electrification and renovation19Promoting fleet electrification (private vehicle, freight transport, taxi/vehicle for hire and municipal fleet, public transport buses);
20Optimise urban goods distribution services;
21Develop logistic hubs and optimise logistic processes (reverse logistics);
22On-demand public transport systems and routes optimisation;
23Improving the efficiency of non-shared public transport, such as taxi or vehicles for hire;
Emission reductionin aviation24Advocate national government for implementation plans to reduce emissions on the aviation sector.
Zero-emissions service sector buildings and premisesReducing energy demand by building isolation and boosting energy efficiency25Working on commercial and institutional buildings and premises;
26Working on municipal buildings and premises;
27Implementing smart heating and lighting control systems on premises and buildings;
Shifting to more efficient equipment and installations28Shift to heat pumps;
29Improve current air conditioning equipment;
30Other equipment, such as garage or elevator ventilation systems;
31Shifting to more efficient household appliances (A+++ vs. A++) and lighting;
Local actions for electric system
decarbonisation
32Renewable energy generation for self-consumption;
33Working together with different administrations towards almost near-zero emissions energy and own energy self-consumption urban buildings.
Waste managementReduction of waste generation34Procedures, platforms and methods for reusing products for citizens;
35Cut down on packaging and identify reverse logistics processes on supply chains;
36Reduce food waste;
37Reduce construction and demolition waste on urban public works;
Increased regeneration rates38Update and revise recruitment documents for waste management centres, with ambitious recovery goals in mind;
39Improve rates on local waste facilities;
Collection and treatment of organic waste40Raise the volume of waste management by creating a new plant-based and selective-collection organic fraction waste digestate composting facility in 2022;
41Reduce emissions by transforming waste into energy, by improving biomethanation process and by generating more electric energy for self-consumption;
42Improve the purity of selective-collection organic fraction waste through awareness campaigns;
43Injecting higher volumes of biogas into the gas network.
Emission cuts in other sectorsReduced refrigerant gases and solvents44Support research focused on cutting down the impact of solvent and refrigerant gases on the atmosphere;
Reduced emissions in the industrial sector45Improve the efficiency of industrial processes;
46Boost electric energy use of processes and activities;
Naturalised and re-forested city47Plant trees: boosting ‘Madrid Compensa’;
48Integrate nature on urbanisation and regeneration projects using nature-based solutions.

References

  1. Madrid City Council. Roadmap to Climate Neutrality by 2050. Ayuntamiento de Madrid. 2022. Available online: https://www.madrid.es/UnidadesDescentralizadas/Sostenibilidad/EspeInf/EnergiayCC/06Divulgaci%C3%B3n/6cDocumentacion/6cNHRNeutral/Ficheros/RoadmapENG2022.pdf (accessed on 12 February 2023).
  2. Eckert, E.; Kovalevska, O. Sustainability in the European Union: Analyzing the Discourse of the European Green Deal. J. Risk Financ. Manag. 2021, 14, 80. [Google Scholar] [CrossRef]
  3. Wolf, S.; Teitge, J.; Mielke, J.; Schütze, F.; Jaeger, C. The European Green Deal—More Than Climate Neutrality. Intereconomics 2021, 56, 99–107. [Google Scholar] [CrossRef] [PubMed]
  4. United Nations General Assembly. Transforming Our World: The 2030 Agenda for Sustainable Development (Resolution Adopted by the General Assembly A/RES/70/1). 2015. Available online: https://documents-dds-ny.un.org/doc/UNDOC/GEN/N15/291/89/PDF/N1529189.pdf?OpenElement (accessed on 4 September 2022).
  5. Nieuwenhuijsen, M.J. Urban and transport planning pathways to carbon neutral, liveable and healthy cities; A review of the current evidence. Environ. Int. 2020, 140, 105661. [Google Scholar] [CrossRef] [PubMed]
  6. da Silva Lopes, H.; Remoaldo, P.C.; Ribeiro, V.; Martín-Vide, J. Effects of the COVID-19 Pandemic on Tourist Risk Perceptions—The Case Study of Porto. Sustainability 2021, 13, 6399. [Google Scholar] [CrossRef]
  7. Lopes, H.S.; Remoaldo, P.C.; Ribeiro, V.; Martin-Vide, J. Pathways for adapting tourism to climate change in an urban destination—Evidences based on thermal conditions for the Porto Metropolitan Area (Portugal). J. Environ. Manag. 2022, 315, 115161. [Google Scholar] [CrossRef] [PubMed]
  8. Capros, P.; Zazias, G.; Evangelopoulou, S.; Kannavou, M.; Fotiou, T.; Siskos, P.; De Vita, A.; Sakellaris, K. Energy-system modelling of the EU strategy towards climate-neutrality. Energy Policy 2019, 134, 110960. [Google Scholar] [CrossRef]
  9. Wiese, F.; Thema, J.; Cordroch, L. Strategies for climate neutrality. Lessons from a meta-analysis of German energy scenarios. Renew. Sustain. Energy Transit. 2022, 2, 100015. [Google Scholar] [CrossRef]
  10. Rizos, V.; Elkerbout, M.; Egenhofer, C. Circular Economy for Climate Neutrality: Setting the Priorities for the EU; CEPS Policy Brief No 2019/04; CEPS: Brussels, Belgium, 2019. [Google Scholar]
  11. Gürbüz, H.; Şöhret, Y. Evaluating effects of the COVID-19 pandemic period on energy consumption and enviro-economic indicators of Turkish road transportation. Energy Sources Part A Recovery Util. Environ. Eff. 2021. [CrossRef]
  12. Kılkış, Ş.; Krajačić, G.; Duić, N.; Rosen, M.A. Advances in integration of energy, water and environment systems towards climate neutrality for sustainable development. Energy Convers. Manag. 2020, 225, 113410. [Google Scholar] [CrossRef]
  13. Ordonez-Ponce, E. The role of local cultural factors in the achievement of the sustainable development goals. In Sustainable Development; Wiley Online Library: Hoboken, NJ, USA, 2022. [Google Scholar] [CrossRef]
  14. Managi, S.; Lindner, R.; Stevens, C.C. Technology policy for the sustainable development goals: From the global to the local level. Technol. Forecast. Soc. Change 2021, 162, 120410. [Google Scholar] [CrossRef]
  15. Bilsky, E.; Moreno, A.C.; Fernández Tortosa, A. Local Governments and SDG Localisation: Reshaping Multilevel Governance from the Bottom Up. J. Hum. Dev. Capab. 2021, 22, 713–724. [Google Scholar] [CrossRef]
  16. Narang Suri, S.; Miraglia, M.; Ferrannini, A. Voluntary Local Reviews as Drivers for SDG Localisation and Sustainable Human Development. J. Hum. Dev. Capab. 2021, 22, 725–736. [Google Scholar] [CrossRef]
  17. Madrid City Council. Localisation Strategy for the Sustainable Development Goals of the 2030 Agenda in the City of Madrid. Ayuntamiento de Madrid. 2021. Available online: https://www.madrid.es/UnidadesDescentralizadas/FondosEuropeos/madrid_es/AGENDA2030/Especial%20Informativo/Cap%C3%ADtulos/Estrategia%20de%20localizaci%C3%B3n/ESTRATEGIA%202030-INGLES.pdf (accessed on 13 October 2022).
  18. Madrid City Council. Plan de Uso Sostenible de la Energía y Prevención del Cambio Climático de la Ciudad de Madrid. Government Department for the Environment. 2008. Available online: https://hispagua.cedex.es/sites/default/files/hispagua_documento/Planenergiasostenible2008.pdf (accessed on 15 October 2022).
  19. Madrid City Council. Plan A: The Air Quality and Climate Change Plan for the City of Madrid. Department of Environment and Transport. 2017. Available online: https://www.madrid.es/UnidadesDescentralizadas/Sostenibilidad/CalidadAire/Ficheros/PlanAire&CC_Eng.pdf (accessed on 11 November 2022).
  20. Ciambra, A. Monitoring Localised Decarbonisation Goals: Lessons Learnt from Madrid’s Roadmap to 2050; Publications Office of the European Union: Luxembourg, 2022. [Google Scholar] [CrossRef]
  21. European Union. EU Missions: 100 Climate-Neutral and Smart Cities. Meet the Cities; Publications Office of the European Union: Luxembourg, 2022. [Google Scholar]
  22. Municipality of Asker. Agenda 2030 in Asker. Voluntary Local Review 2021. Asker Kommune. 2021. Available online: https://unhabitat.org/sites/default/files/2021/07/asker_2021_en.pdf (accessed on 9 October 2022).
  23. Barcelona City Hall. Barcelona: Futur Sostenible. Disset Objectius Socials, Econòmics i Ambientals. Oficina del Comissionat d’Agenda 2030. 2020. Available online: https://ajuntament.barcelona.cat/agenda2030/sites/default/files/2021-01/Agenda%202030%20de%20Barcelona.%20Fites%20ODS%20i%20indicadors%20clau_0.pdf (accessed on 12 November 2022).
  24. Prefeitura Belo Horizonte. Relatório de Acompanhamento dos Objetivos de Desenvolvimento Sustentável de Belo Horizonte 2020. 2020. Available online: https://unhabitat.org/sites/default/files/2021/06/belo_horizonte_2020_pt.pdf (accessed on 28 August 2022).
  25. Mayor of the City of Bonn. Voluntary Local Review. Agenda 2030 on the Local Level. Implementation of the UN Sustainable Development Goals in Bonn. Department of International Affairs and Global Sustainability. 2020. Available online: https://unhabitat.org/sites/default/files/2021/07/bonn_2020_en.pdf (accessed on 14 November 2022).
  26. Fox, S.; Macleod, A. Bristol and the SDGs. A Voluntary Local Review of Progress 2019. Cabot Institute for the Environment, University of Bristol. City of Bristol. 2019. Available online: https://unhabitat.org/sites/default/files/2021/06/bristol_2019_en.pdf (accessed on 1 December 2022).
  27. Arano, A.; Cámara, I.; Cammisa, M.; Zamichiei, B. Voluntary Local Review. Buenos Aires Adaptation of the 2030 Agenda. Buenos Aires Ciudad. City of Buenos Aires. 2020. Available online: https://unhabitat.org/sites/default/files/2021/06/buenos_aires_2020_en.pdf (accessed on 3 October 2022).
  28. Dangjin City. Voluntary Local Review: Dangjin Sustainable Development Report. Sustainable Development Official of Dangjin City. 2020. Available online: https://unhabitat.org/sites/default/files/2021/09/dangjin_2020_en.pdf (accessed on 17 December 2022).
  29. Jun, C.; Shu, P.; Huiru, R.; Yuejing, G.; Nan, W.; Yu, H.; Jingyun, J.; Wei, H.; Xiaofeng, L.; Qin, D.; et al. Deqing’s Progress Report on Implementing the 2030 Agenda for Sustainable Development. A Comprehensive Assessment with Statistical and Geospatial Information. National Geomatics Centre for China. 2017. Available online: https://unhabitat.org/sites/default/files/2021/06/deqing_2017_en.pdf (accessed on 11 October 2022).
  30. City of Espoo. Voluntary Local Review. Implementation of the United Nations’ Sustainable Development Goals 2030 in the City of Espoo. City of Espoo. 2020. Available online: https://unhabitat.org/sites/default/files/2021/06/espoo_2020_en.pdf (accessed on 9 August 2022).
  31. Herradores Lindes, I.; Martín Mesa, A.; Fernández Moreno, J.P. Indicadores para Medir la Consecución de los ODS de la Provincia de Jaén (p. 152). Fundación Estrategias para el Desarrollo Económico y Social de la Provincia de Jaén. 2019. Available online: https://unhabitat.org/sites/default/files/2021/06/jaen_2019_es.pdf (accessed on 23 September 2022).
  32. City of Los Angeles. Los Angeles Sustainable Development Goals. A Voluntary Local Review of Progress in 2021. City of Los Angeles. 2021. Available online: https://unhabitat.org/sites/default/files/2021/10/los_angeles_2021_en.pdf (accessed on 14 September 2022).
  33. Hübel, C.W.; Ebert, A.; Mikulasch, L.; Müller, L.; Roth, R.; Schnizer, M.; Vehnekamp, K.; Vögtel, A. The Implementation of the United Nations’ Sustainable Development Goals in Mannheim 2030. Department of Democracy and Strategy. City of Mannheim. 2019. Available online: https://t.ly/Lur9 (accessed on 30 November 2022).
  34. NYC Mayor’s Office for International Affairs. Voluntary Local Review: Global Vision Urban Action. New York City’s Implementation of the 2030 Agenda for Sustainable Development (p. 118). NYC Mayor’s Office. 2019. Available online: on.nyc.gov/2yDmr9t (accessed on 14 December 2022).
  35. São Paulo City Hall. Report of Localization of Sustainable Development Goals in São Paulo. Cidade de São Paulo. 2021. Available online: https://unhabitat.org/sites/default/files/2022-07/sao_paulo_2021_en.pdf (accessed on 7 September 2022).
  36. Taipei City Government & Taipei Council for Sustainable Development. 2021 Taipei City Voluntary Local Review. Department of Environmental Protection. 2021. Available online: https://unhabitat.org/sites/default/files/2021/10/taipei_2021_en.pdf (accessed on 1 October 2022).
  37. Taoyuan City Government. Sustainable Development Goals. Taoyuan City Voluntary Local Review. 2020. Available online: https://unhabitat.org/sites/default/files/2021/09/taoyuan_2020_e.pdf (accessed on 24 November 2022).
  38. City of Yokohama. Voluntary Local Review 2021 Yokohama. Report on the Implementaton of the 2030 Agenda for Sustainable Development. International Affairs Bureau. 2021. Available online: https://unhabitat.org/sites/default/files/2021/12/yokohama_2021_en.pdf (accessed on 13 December 2022).
  39. Ciambra, A. European SDG Voluntary Local Reviews: A Comparative Analysis of Local Indicators and Data. Joint Research Centre. 2021. Available online: https://bit.ly/3j2RJeU (accessed on 9 October 2022).
Figure 1. Madrid’s distribution (in %) of neutrality indicators and policy lines (N = 58) per policy field vis-à-vis distribution in the other indicator sets in the sample (N = 384 indicators across 22 documents).
Sustainability 15 04819 g001
Figure 2. Relative prevalence of neutrality-related indicators over total indicators and metrics used in Madrid’s Roadmap and the other VLRs/document included in the sample (N = 18).
Sustainability 15 04819 g002
Figure 3. Prevalence of certain SDGs in neutrality toolkits of VLRs and review documents, visualised as an SDG ‘heat map’ (darker shades correspond to a higher amount of indicators related to an SDG).
Sustainability 15 04819 g003
Figure 4. Relative distribution of indicators per SDG in analysed VLRs.
Sustainability 15 04819 g004
Table 1. Core emission-related indicators in the Roadmap towards Climate Neutrality in 2050 (data extracted from [1]).
IndicatorUnit of MeasurementTime AvailabilityMain Source of Data
Direct and indirect GHG emissionskt CO2 eq; %1990–2018Madrid city council
Sectoral breakdown of total GHG emissionskt CO2 eq; %2018Madrid city council
Emissions in residential, commercial and industrial sectorskt CO2 eq2006–2018Madrid city council
Emissions in road transportkt CO2 eq2006–2018Madrid city council
Emissions per capitat CO2 eq/inhab.2018unavailable
Emissions per unit of GDPt CO2 eq/M€2018unavailable
Change in direct and indirect GHG emissions in Madrid between 2000 and 2015Mt CO2 eq2000–2015Madrid city council
Change in total GHG emissions in MadridMt CO2 eq2000–2015Madrid city council
Total GHG emission abatement (direct and indirect) by sectorMt CO2 eq2015–2030Madrid city council
Emission reduction by decarbonisation action%2015–2030Madrid city council
Table 2. Overall data of the comparison between ‘neutrality toolkits’ in N = 18 sustainability reports, VLRs and other SDG-related documents issued by local governments, including Madrid’s Roadmap. Darker shades in the relative figures correspond to higher values.
AbsoluteRelativeIndicator Data
GHG Emissions and Air QualityEnergy EfficiencyTransport and MobilityWaste ManagementEfficient City ServicesGHG Emissions and Air QualityEnergy EfficiencyTransport and MobilityWaste ManagementEfficient City ServicesNeutrality IndicatorsTotal # of IndicatorsNeutrality % Total
Madrid14191210324.132.820.717.25.25858100.0
Asker64132619.412.941.96.519.43110828.7
Barcelona7323046.720.013.320.00.01512412.1
Belo Horizonte4141233.38.333.38.316.7121587.6
Bonn3341027.327.336.49.10.0114623.9
Bristol6354033.316.727.822.20.01814712.2
Buenos Aires6375028.614.333.323.80.0212169.7
Dangjin5115138.57.77.738.57.7138814.8
Deqing7331146.720.020.06.76.71513710.9
Espoo2222025.025.025.025.00.083721.6
Jaén8620050.037.512.50.00.01611014.5
Los Angeles5432133.326.720.013.36.7152416.2
Mannheim9251052.911.829.45.90.0174934.7
New York133163037.18.645.78.60.03523814.7
São Paulo97149122.517.535.022.52.5405577.2
Taipei City3151323.17.738.57.723.1136819.1
Taoyuan7135141.25.917.629.45.9175928.8
Yokohama10311066.720.06.76.70.0152107.1
Total12469102561936.117.825.815.15.2370265114.0
Average without Madrid36.816.926.114.95.2 %
Difference of average values from Madrid’s values12.7−15.85.4−2.30.0
Disclaimer/Publisher’s Note: The statements, opinions and data contained in all publications are solely those of the individual author(s) and contributor(s) and not of MDPI and/or the editor(s). MDPI and/or the editor(s) disclaim responsibility for any injury to people or property resulting from any ideas, methods, instructions or products referred to in the content.

