Article

Fatigue Cracking Characteristics of Asphalt Pavement Structure under Aging and Moisture Damage

Department of Highway & Transportation Research, Korea Institute of Civil Engineering and Building Technology, Goyang-Si 10223, Republic of Korea
*
Author to whom correspondence should be addressed.
Sustainability 2023, 15(6), 4815; https://doi.org/10.3390/su15064815
Submission received: 21 November 2022 / Revised: 20 December 2022 / Accepted: 21 January 2023 / Published: 8 March 2023
(This article belongs to the Special Issue Advances in Sustainable Asphalt Materials and Pavements)

Abstract

:
Structural characteristics influence assessment of fatigue cracking behavior. In the assessment of asphalt pavements, the asphalt structure and practical conditions must be considered. This study analyzes changes in the elastic modulus of the pavement of different asphalt mixtures amid aging and moisture damage through fatigue cracking tests. A model to predict the tensile strain at the bottom of the pavement layer is developed through a structural analysis based on the material properties. The results are comparatively analyzed using the Mechanistic-Empirical Pavement Design Guide to predict the fatigue crack life. The test results indicate that moisture damage significantly influences the material properties of asphalt pavement and can accelerate pavement damage as the asphalt ages. The coefficient values of the proposed fatigue-life prediction model can be used to predict the fatigue life depending on the age of the asphalt and its moisture damage after aging. The degree of fatigue damage can be predicted by calculating the tensile strain using the regression equation and elastic modulus according to the aging and moisture damage.

1. Introduction

As an asphalt mixture ages, the asphalt binder becomes stiffer, and consequently exhibits brittle behavior, exposing the mixture to fatigue cracking. The increased stiffness also leads to losses of cohesion and adhesion between the aggregate and the asphalt binder, resulting in cracks under cyclic traffic loads [1]. The cracking of an asphalt pavement is accelerated by precipitation-led moisture penetration combined with traffic loads, approaching failure as the fatigue life of the pavement decreases. The fatigue cracks that occur in aged asphalt mixtures are generally known to increase the brittleness of the asphalt binders that have hardened over time, leading to increased cracking under cyclic traffic loads. Generally, studies that assess the fatigue cracking behavior of asphalt mixtures ex situ only investigate the material properties but disregard changes in the structural properties. As the asphalt binder ages, the stiffness (elastic modulus) of the asphalt mixture increases. This increased stiffness of the mixture can be leveraged to more accurately predict the pavement’s service life. However, this approach has never been examined or evaluated from a structural perspective; incorrect approaches may lead to prediction errors. Accordingly, evaluations of the variation of fatigue cracking performance with age must consider the structure of the asphalt mixture.
By 2020, the percentage of expressways and general national highways managed by the Government of Korea that had been paved was >98%, of which asphalt pavements comprised 85% [2]. A trend of maintaining, repairing, and managing existing pavements rather than constructing new roads is emerging. In the future, the increased pavement stiffness due to aging and localized heavy rains caused by climate change will accelerate pavement failure and significantly impact the national budget, owing to increasing maintenance costs. Accordingly, in this study, the effects of changes in the properties and fatigue cracking due to moisture damage were evaluated with consideration of the aging characteristics of asphalt pavements in Korea. In addition, the influence of age was investigated from the perspective of the structure of the asphalt pavement.
Safaeia et al. analyzed the strain response of the warm-mix asphalt pavement layer for the axial load of a vehicle using structural analysis of 3D multilayer viscoelastic pavement. For the material properties applied for structural analysis, the properties obtained from the dynamic modulus test and the cyclic fatigue test for the asphalt mixture specimen before and after water treatment were utilized. As a result of the structural analysis, the strain response due to the axial load was about twice as large in the structure using the properties of after-water-treatment specimen compared to in that using before-water-treatment specimen. In addition, a large amount of stripping occurred on the fatigue-broken surface in after-water-treatment specimens [3]. Sarsam and AL-Zubaidi investigated the moisture damage resistance of recycled asphalt pavement. They found that the deterioration of service life of recycled asphalt pavement due to water damage was mostly influenced by the degree of stripping that occurred inside the pavement. In addition, it was found that the adhesion and cohesion of the asphalt binder are reduced according to the occurrence of stripping, and as a result the stiffness characteristics of the pavement are reduced [4]. Xiao and Huang investigated the change to moisture susceptibility of HMA upon aging by using the chemistry of asphalt binder and the energy ratios of asphalt mixture. They found that for asphalt binders, short- and long-term aging deteriorates the adhesion of asphalt binders and therefore increases the possibility of delamination. However, for asphalt mixtures, short-term aging improves overall water damage resistance, while long-term aging weakens water damage resistance [5]. Various researchers have investigated the effect of water damage and/or aging on the performance of asphalt pavements. However, it is necessary to systematically analyze moisture damage and aging as they simultaneously affect pavement performance and also affect not only material properties but also pavement structural properties.
In this study, in order to evaluate the effect of aging and water damage on fatigue cracking of pavement structure, the material properties of the asphalt mixture and the fatigue cracking performance of the pavement were systematically evaluated. To analyze the change in mechanical properties due to aging and water damage of asphalt mixtures, the dynamic modulus test and the fatigue crack test were conducted for the specimen treated in various aging and water damage levels. In addition, through structural analysis based on the material properties obtained from the experiment, a model that can predict tensile strain occurring in the lower part of the pavement layer under load was developed and the results comparatively analyzed using the Mechanistic-Empirical Pavement Design Guide (MEPDG) to predict the fatigue crack life.

2. Materials and Methods

2.1. Materials

In this study, the hot-mix asphalt (HMA) mixture was used for the road pavement asphalt with PG 64-22 (Korean Company S) as the asphalt binder. A granite crushed stone aggregate (90% market share in Korea) was used for the aggregate, which satisfied the WC-3 (20 mm dense-graded asphalt mixture) particle-size standard presented in the guidelines of the Ministry of Land, Infrastructure and Transport [6]. The coarse aggregate used was a single-size Grade 1 aggregate with a flat and elongated particle percentage of <10%. Generally, as the weight ratio of fine aggregate increases, the asphalt content increases, increasing the resistance of the mixture to moisture damage. Thus, the ratio of coarse to fine aggregate was set to approximately 60:40 and the combined gradations were examined. Table 1 presents the passing weight percentages of the combined gradations determined in this study.

2.2. Mix Design

The mix design of the asphalt mixture was performed using the Marshall mix design method proposed by the Ministry of Land, Infrastructure and Transport [6]. The mixing and compaction temperatures of the asphalt mixture were 160 ± 3 and 135 ± 3 °C, respectively. Before compaction, the mixture was short-term aged at 135 ± 1 °C (compaction temperature) for 4 h. According to the mix design, the optimal asphalt content was determined to be 5.1%, and all the mix design factors met the standards suggested by the Ministry of Land, Infrastructure and Transport [6]. Table 2 presents the Marshall mix design results.

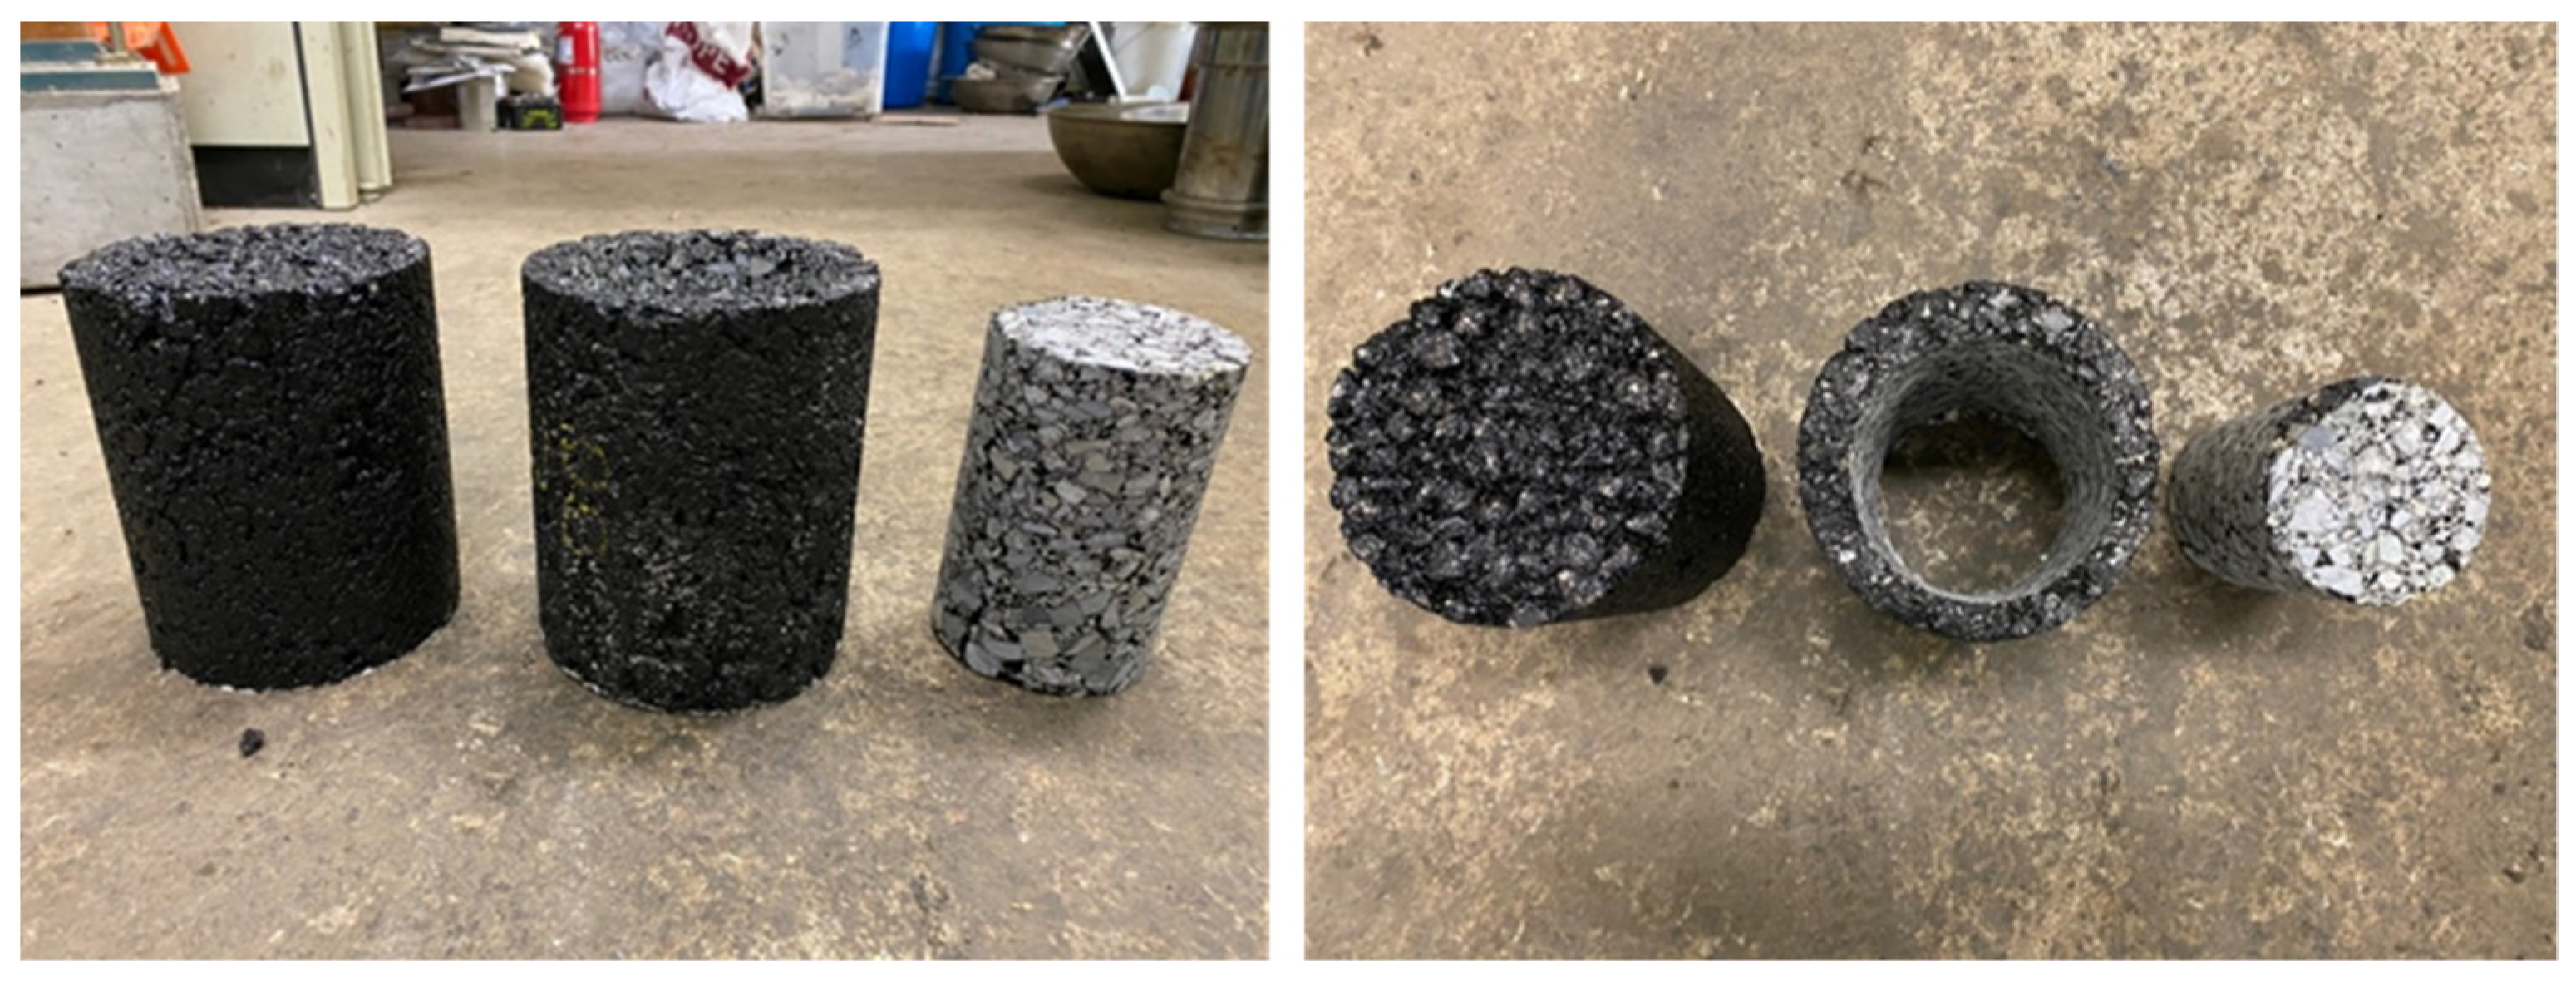
2.3. Fabrication of Specimens

All the test specimens were cylindrical, with a height of 178 mm and a diameter of 150 mm. They were prepared using a gyratory compactor. To ensure that all the specimens had the same air voids distribution, they were cut to a height of 150 mm and cored to a diameter of 100 mm. The target air voids of the cut specimen for the dynamic modulus test (DMT) and direct tension test were determined to be 6.5% ± 0.5%. To induce the target air voids of 6.5%, the specimens were manufactured with air voids of 10%, 8%, and 6% and cored. The voids were then measured, as listed in Table 3. The densities of all the specimens were measured using a CoreLok device to minimize errors in the void measurements. Figure 1 illustrates the specimen fabrication using the gyratory compactor and the specimens after coring.

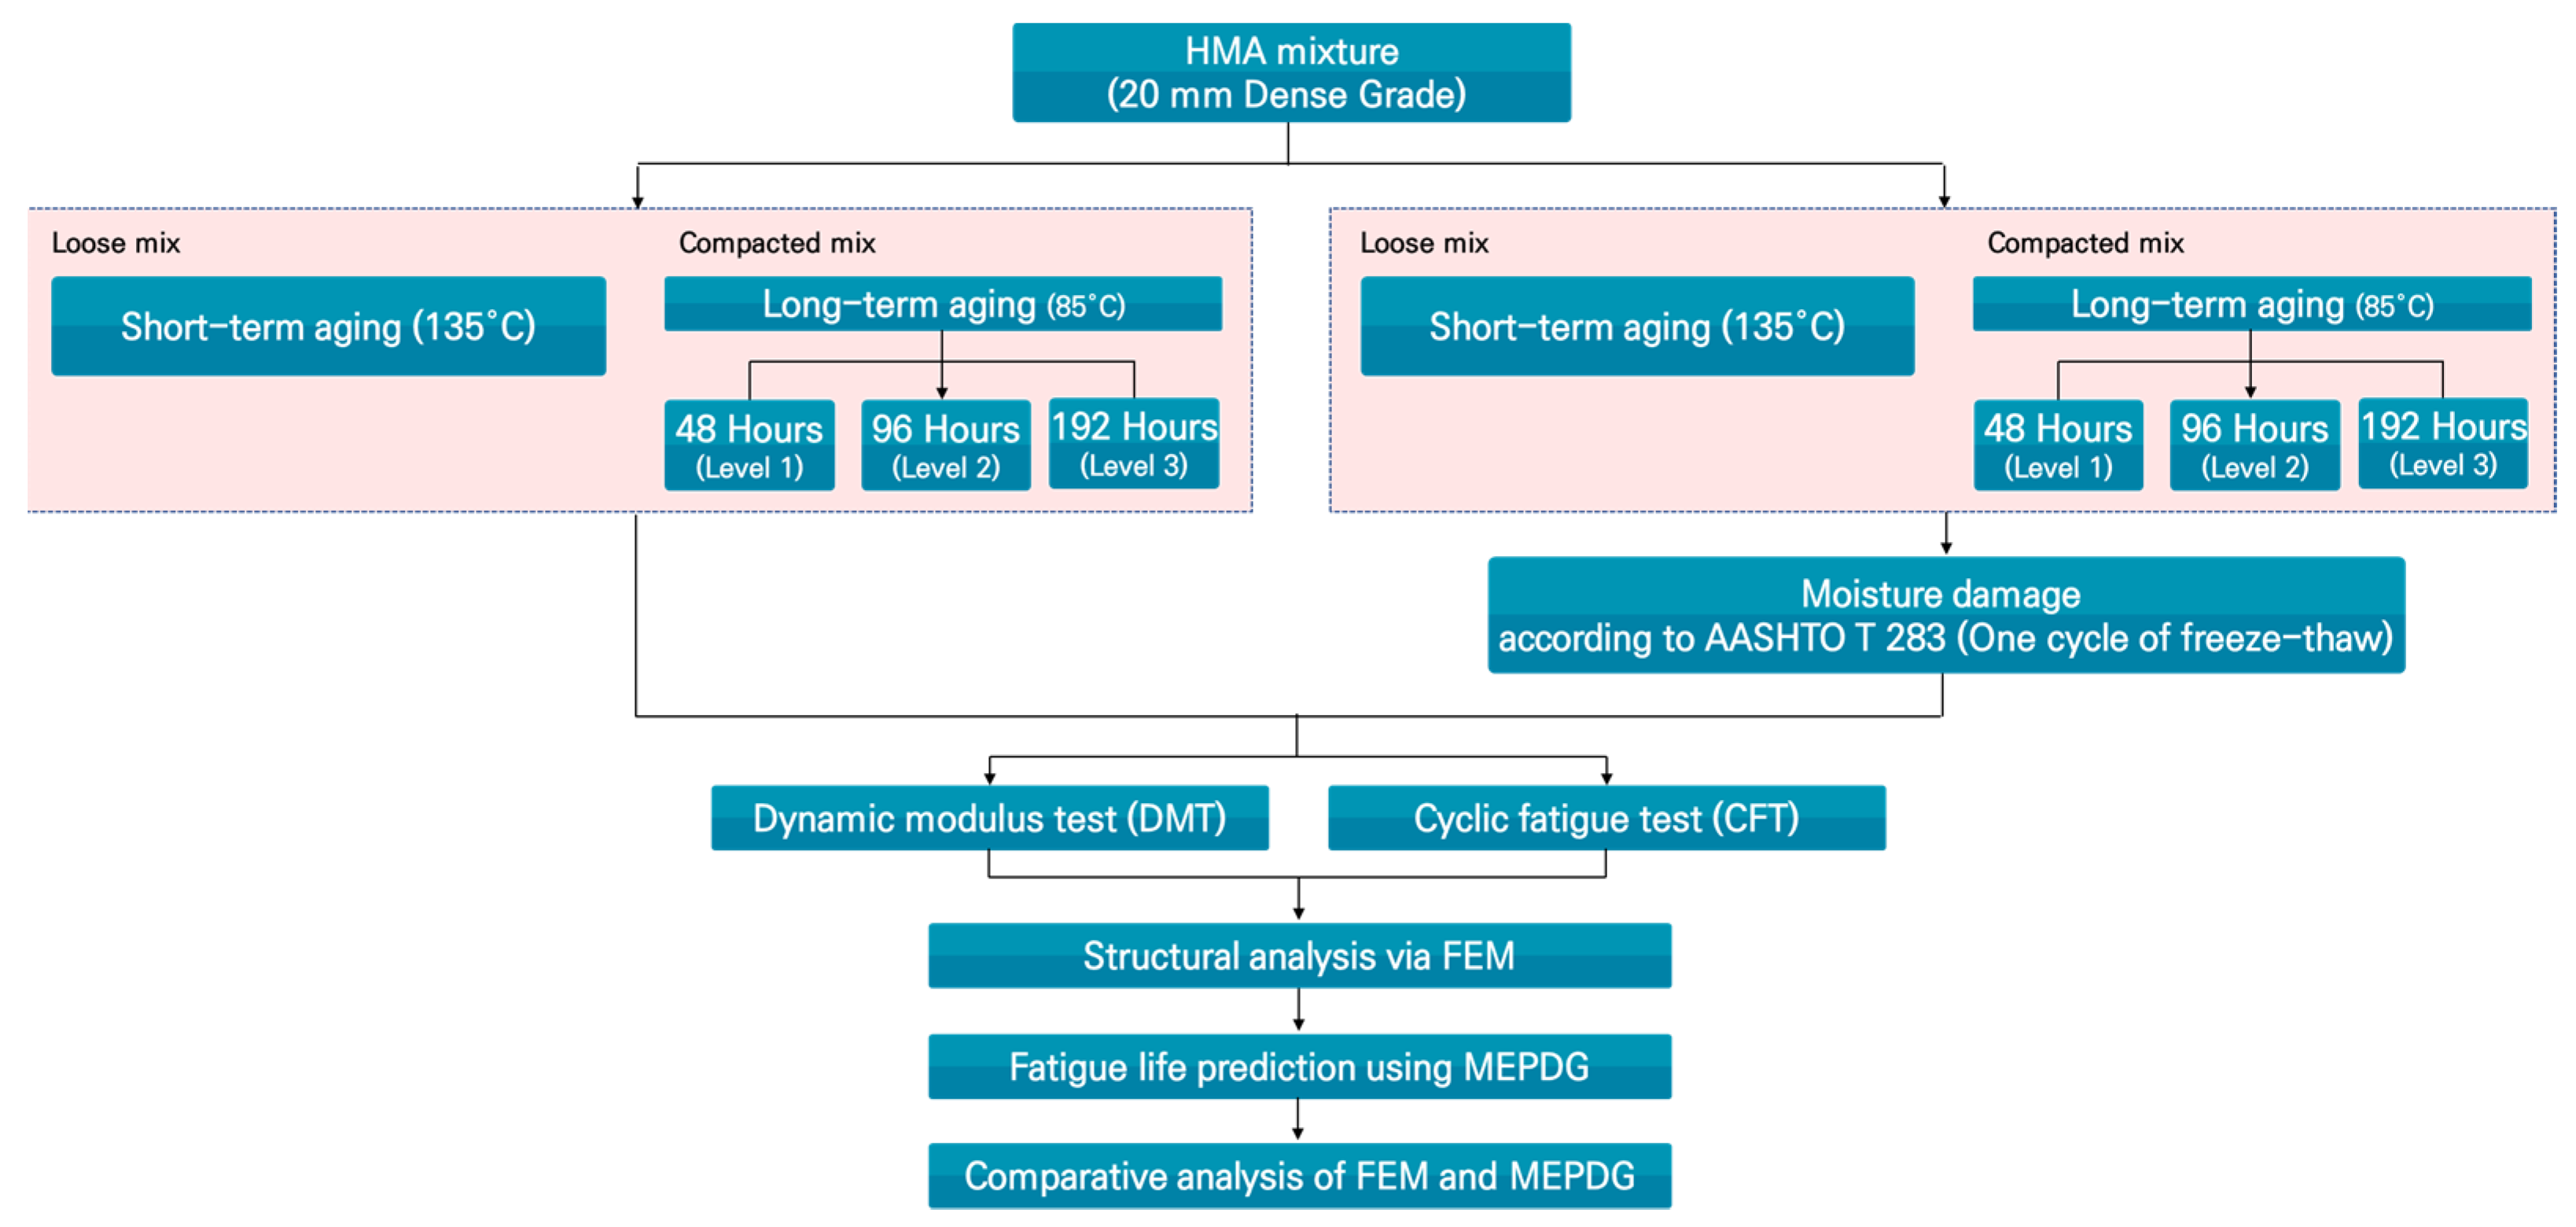
2.4. Experimental Program

The elastic moduli and fatigue cracking properties were evaluated according to the aging and moisture damage of HMA and warm-mix asphalt mixtures by applying the indoor aging property evaluation method presented in NCHRP 09-54 [7] and conducting a moisture-damage simulation experiment using the freeze-thaw method presented in AASHTO T 283 [8]. Figure 2 illustrates a flowchart of the experimental program.

2.4.1. Aging Method

NCHRP 09-54 [7] presents two main methods for simulating aging using asphalt mixtures. The first is based on the material type (compacted or loose) and the second on the pressure level (heat aging and pressure aging). In this study, in order to simulate aging during use of asphalt pavement, aging by heat was selected. Indoor aging simulations were conducted in a heating oven, with short-term aging (SA) conducted at 135 °C for 4 h according to AASHTO R 30 [9]. For long-term aging (LA), each asphalt mixture that underwent SA was compacted with the gyratory compactor to fabricate the specimens. These specimens were then cored and cut and aged in a heating oven at 85 °C for 48 (LA 1), 96 (LA 2), and 192 h (LA 3).
(1) Short-Term Aging (SA)
  • For the SA of HMA, the uncompacted asphalt mixture was poured on a pan, spread to a thickness of 21–22 kg/m2, and then placed in an oven at 135 ± 3 °C for 4 h.
  • The mixture was stirred every 60 min to uniformly age the mixture.
  • After 4 h, the HMA was removed from the hot-air dryer and immediately prepared for the necessary tests.
(2) Long-Term Aging (LA)
4.
Using the SA asphalt mixture and the gyratory compactor, a specimen was fabricated by this method.
5.
The fabricated test specimen was cooled to room temperature for 24 ± 1 h before being cored and cut to the required size.
6.
The prepared specimen was placed in a heating oven at 85 ± 3 °C, according to the duration of each stage of LA.
7.
After the LA test, the specimen was cooled to room temperature. It was left untouched during this process.

2.4.2. Moisture Damage Method
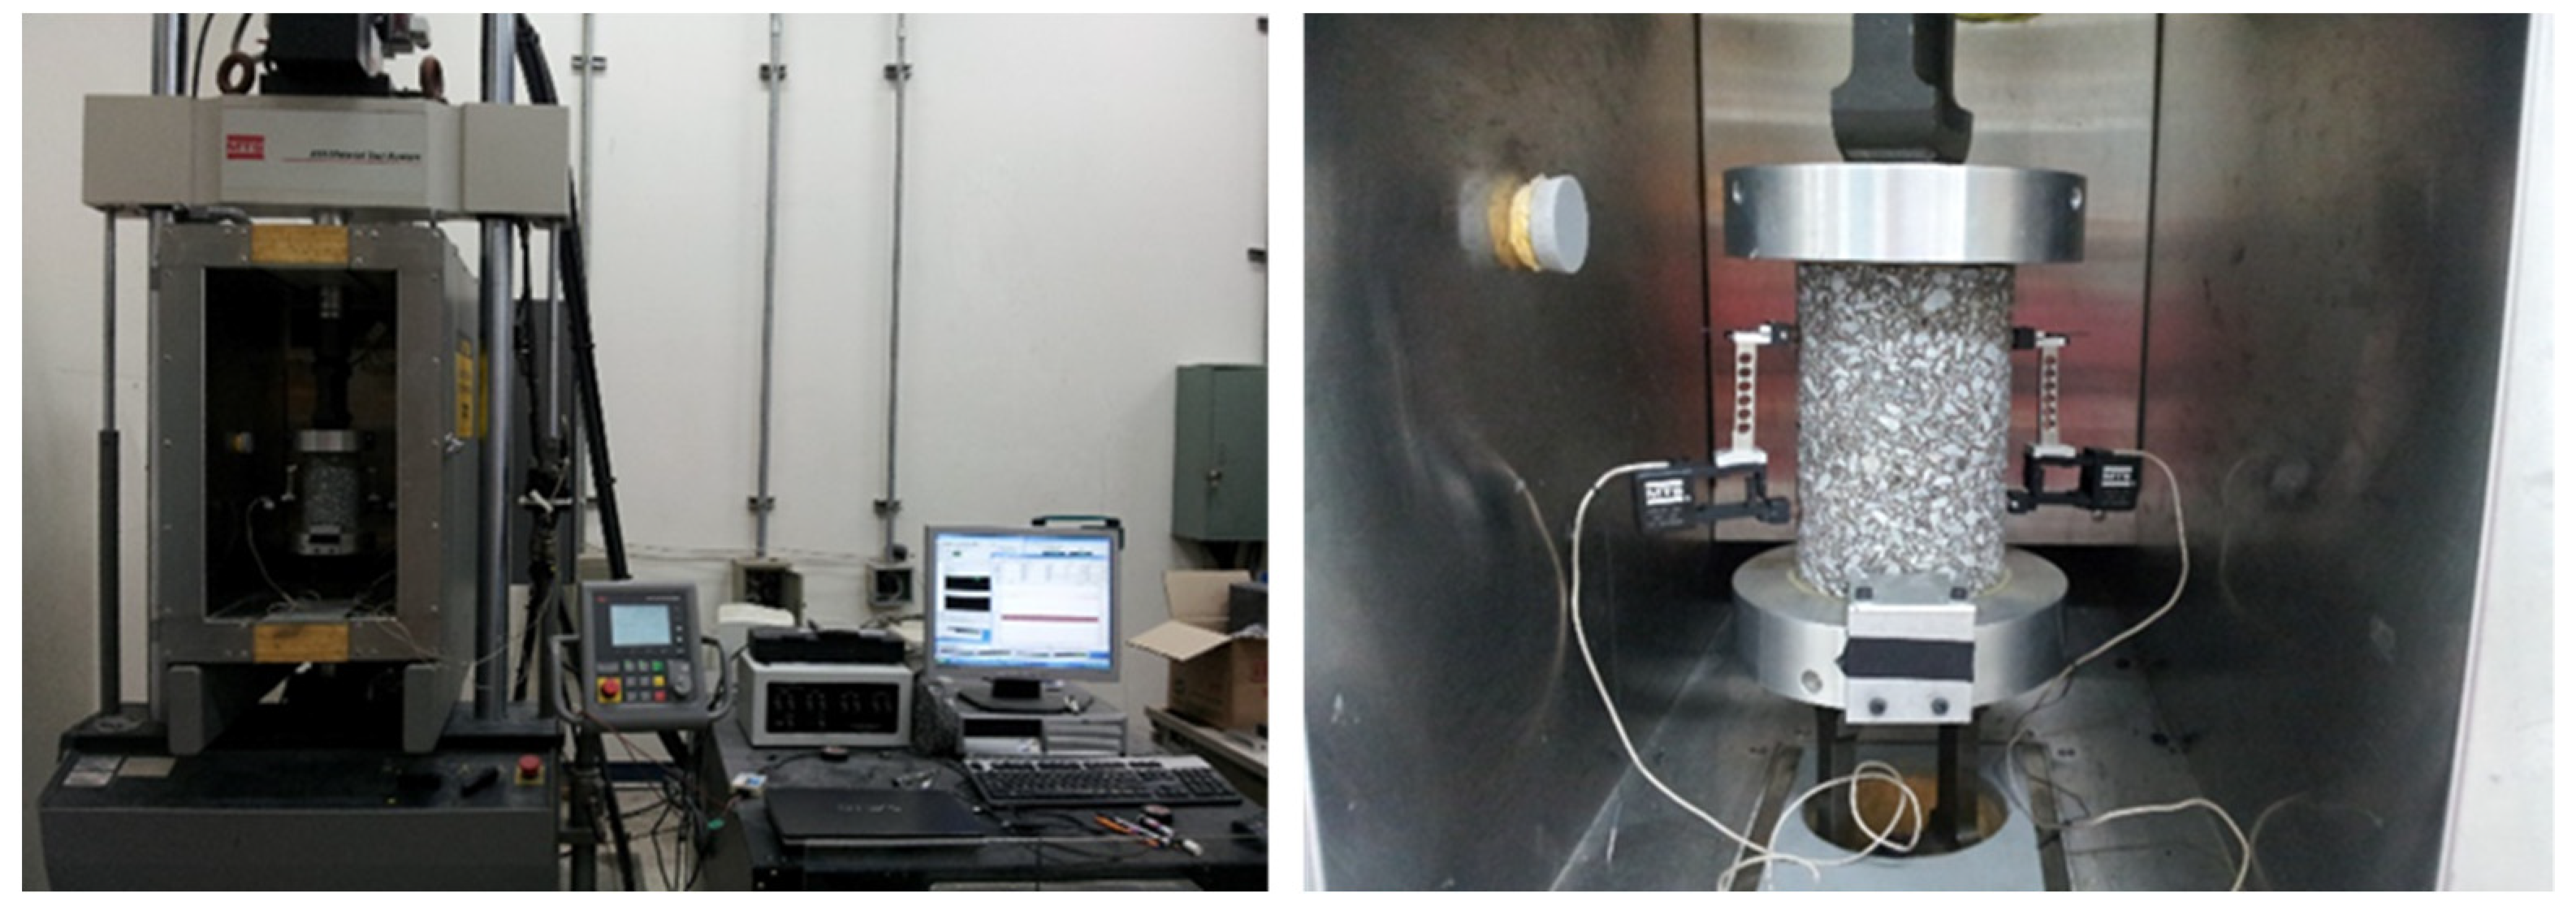
The water-immersion method used in the modified Lottman test of AASHTO T 283 [8] was applied to simulate the effects of moisture, while using asphalt pavements and the moisture damage of the asphalt mixture. Water freeze-thaw was applied once to simulate moisture damage caused by cyclic moisture. While this procedure does not comply with the current “Asphalt Mixture Production and Construction Guidelines (2017)” presented by the Ministry of Land, Infrastructure and Transport [6], freezing was included in the test; it was assumed that all specific regions requiring freezing were included. This condition was applied to all the specimens used in the DMT and cyclic fatigue tests. After moisture treatment, the moisture inside the specimen was forcibly removed for the performance evaluation. To achieve the same conditions as those before moisture treatment, after moisture removal, the specimen was placed in a dryer at 25 ± 1 °C for 24 h, and subsequently the DMT was performed.

2.4.3. DMT

To determine the basic material properties of a mixture using the DMT, the time–temperature superposition principle must be understood [10], where the elastic modulus is measured through stress and strain and expressed as a function of time for different combinations of temperatures and loading frequencies. The behavior of asphalt mixtures at high temperatures is identical to that when the cyclic loading frequency is reduced or the loading time is increased and vice versa. Asphalt mixtures in the linear viscoelastic range are known to be thermorheologically simple; this condition can be represented by a reduced frequency or reduced time, where the effects of time and temperature are complexly expressed. The reduced frequency is calculated using a time–temperature shift factor ( a T ):
f R = f × a T .
This equation allows for the entire graph to be horizontally shifted for creating one curve (master curve) that describes the asphalt-mixture behavior over a wide range of reduced frequencies. The time–temperature shift factor indicates the horizontal shift on a logarithmic scale needed to create the master curve. The shift amount is determined by a reference temperature and changes with respect to it.
The master curve is fitted to a sigmoidal function in accordance with Equation (2). The relationship between the shift factor and the temperature can be expressed by a quadratic function. The FlexMAT™ asphalt pavement analysis tool [11] was used to determine the sigmoidal coefficients and time–temperature shift factor. The shift factor becomes 0 at a specific temperature, which is the reference temperature. While the shift factor can be determined at any experimental temperature, an intermediate value is generally used. This logarithmic shift factor is fitted using Equation (3). Equation (2) is used to determine the elastic modulus at a given temperature, and the frequency and factor are determined using Equation (3).
log E * = a + b 1 + 1 e d + g * l o g f R
l o g a T = a 1 T 2 + a 2 T + a 3
The DMT in this study was conducted using the stress-control method in the uniaxial compression mode. The test was performed at six loading frequencies (20, 10, 5, 1, 0.5, and 0.1 Hz) and five temperatures (−5, 5, 20, 40, and 54 °C). An MTS 810 material testing machine was used for the DMT, and four extensometers (85 mm) were installed at 90° intervals at the center of the specimen. The reload magnitude for each temperature and loading frequency was determined as the load magnitude at which a strain of 55–70 µε occurred. Figure 3 displays front views of the MTS 810 tester and specimen mount.

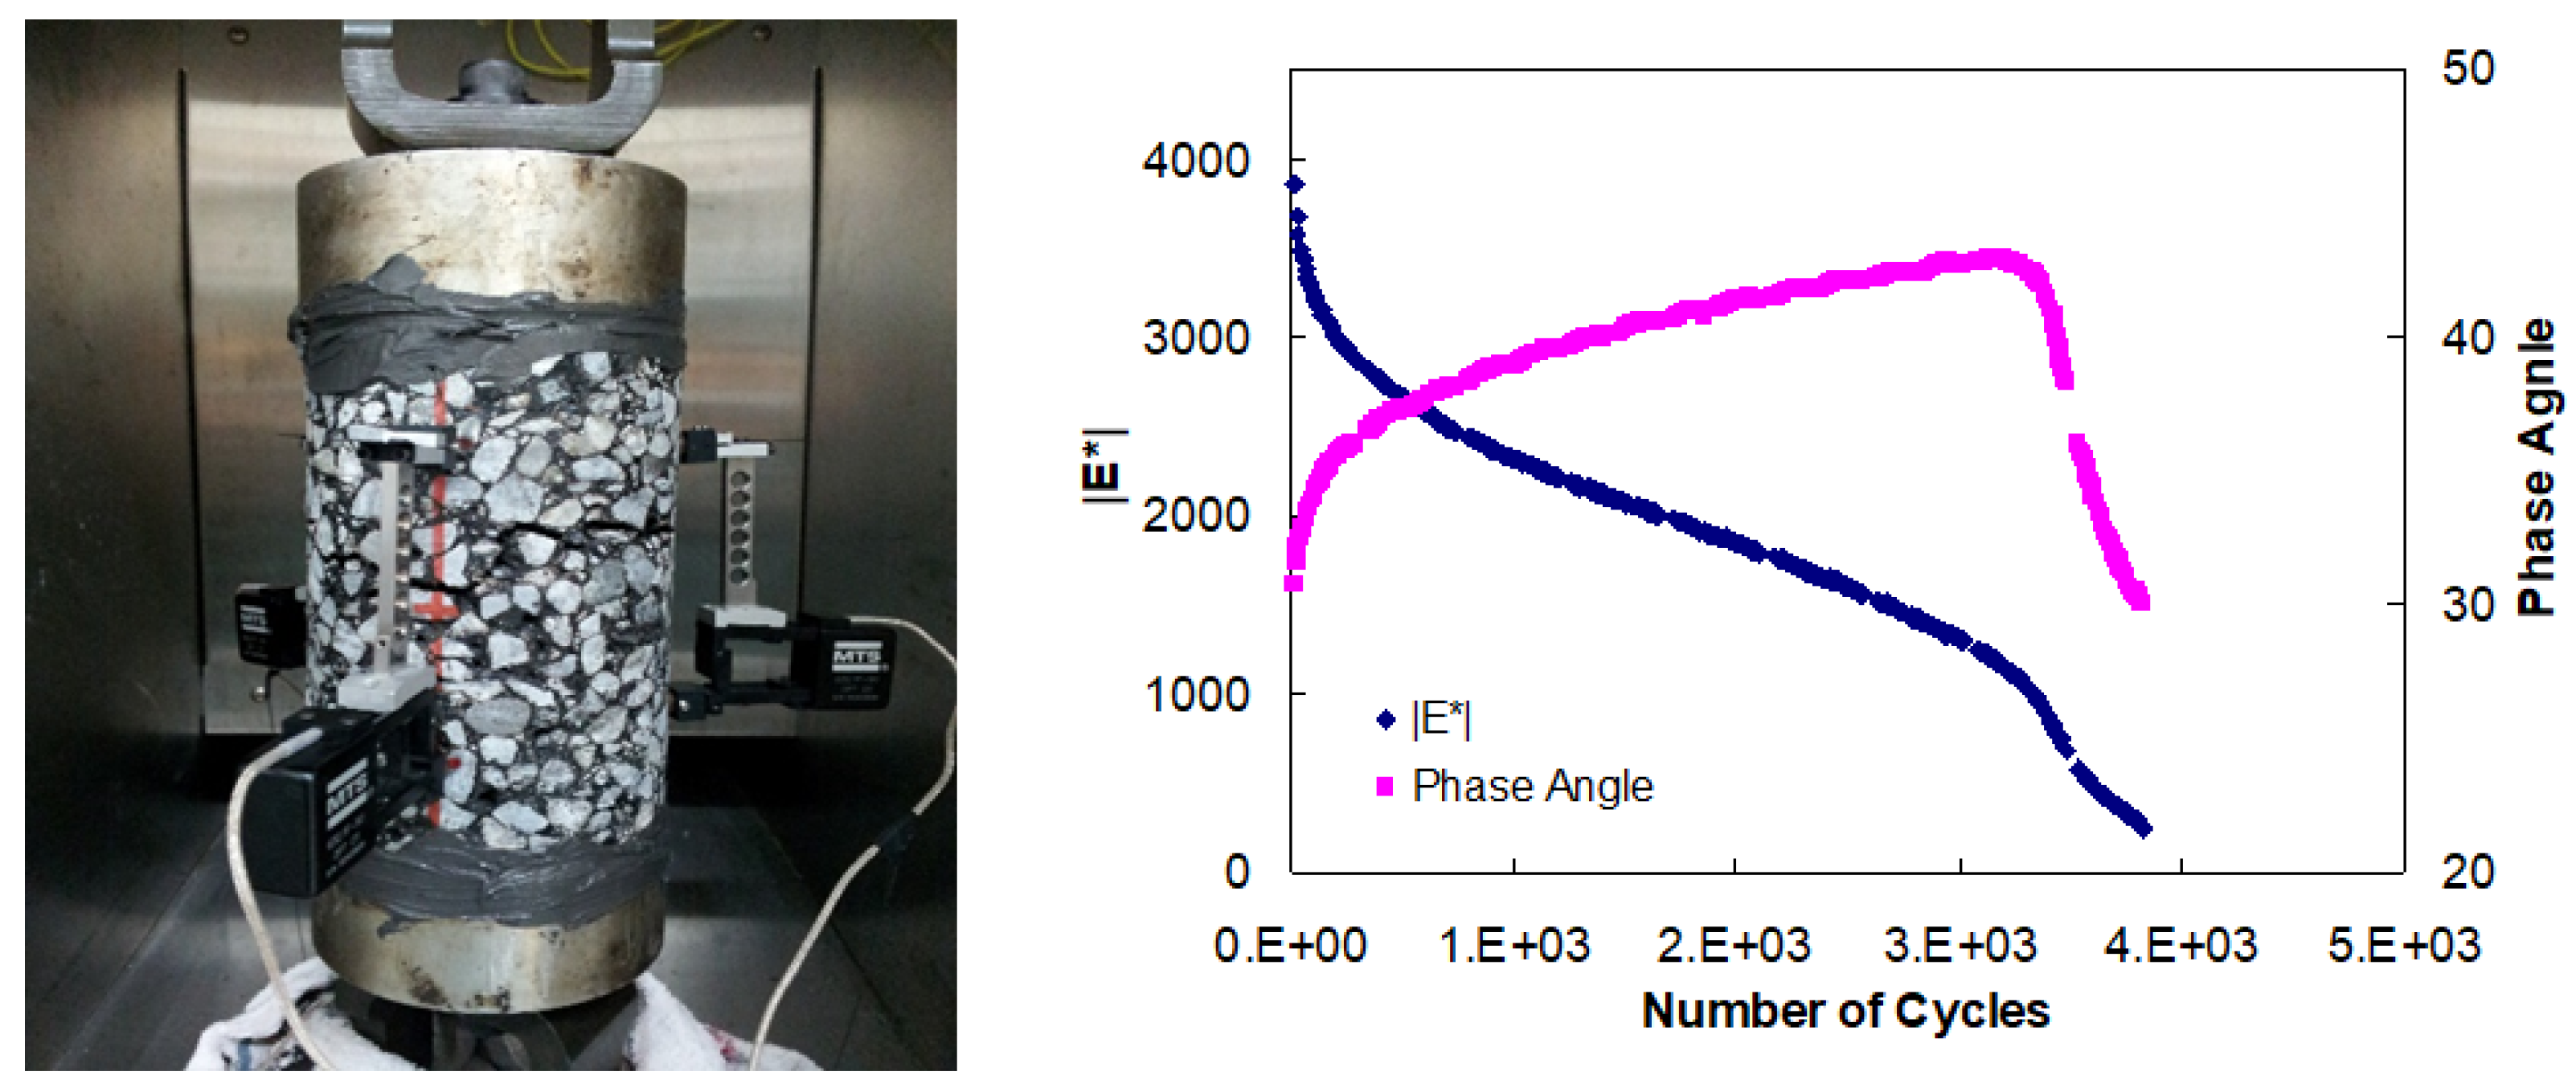
2.4.4. Cyclic Fatigue Test

Fatigue cracking in asphalt pavement is a major source of asphalt pavement failure, in addition to permanent deformation. It is caused by the accrual of wide ranges of cyclic and thermal loads. The tensile strain at the bottom of the pavement also occurs because of cyclic loads, causing microcracks to form at the bottom. These microcracks develop into macrocracks under cyclic loads, which can be observed on the pavement surface [12,13,14]. Existing fatigue tests and pavement performance prediction models empirically analyze the development of fatigue cracking according to the bottom-up cracking theory. Researchers generally simulate field conditions ex situ, i.e., in a laboratory, to analyze the fatigue behavior of pavement. An extant method involves applying cyclic bending stress to an asphalt beam with a specific cross-section and specific supporting conditions [13]. This test uses the stress- or strain-controlled approach. If the field test were conducted in an environment that differs from the laboratory test conditions, significant errors could arise in the performance predicted by the test. However, a more important issue is that the test simultaneously considers both the pavement material and structure. This challenge can be solved by separating the pavement material properties from the structural properties.
For this purpose, researchers recently developed a direct tensile fatigue test for cylindrical specimens and verified the test’s ability to yield similar results to the beam fatigue test [15]. Two test methods—stress- and strain-controlled—can be used, and experiments have indicated that they yielded contradictory results [16]. However, the strain-controlled approach was found to be consistent with the field results. Accordingly, in this study, a controlled crosshead cyclic (CX) test (strain-controlled method) was performed. A cyclic constant-velocity strain was applied to the specimen using the crosshead of the device. The strain-controlled approach is safer than the stress-controlled one and can better simulate the field conditions, where stress and strain occurred together with complex interactions. The CX test was performed by applying a tensile force to the specimen until failure occurred at 20 °C and a frequency of 10 Hz (Haversine loading). The time of failure was determined as the time at which the phase angle rapidly changed, in accordance with the method proposed by Reese [17]. Figure 4 illustrates changes in the phase angle and dynamic modulus with respect to the number of loading cycles. Generally, as the number of cycles increased, the dynamic modulus decreased, and the phase angle increased. After a load was applied for a certain period, the phase angle sharply decreased, indicating that the specimen was damaged. Figure 4 displays the curves of the dynamic modulus and phase angle.

3. Experimental Results

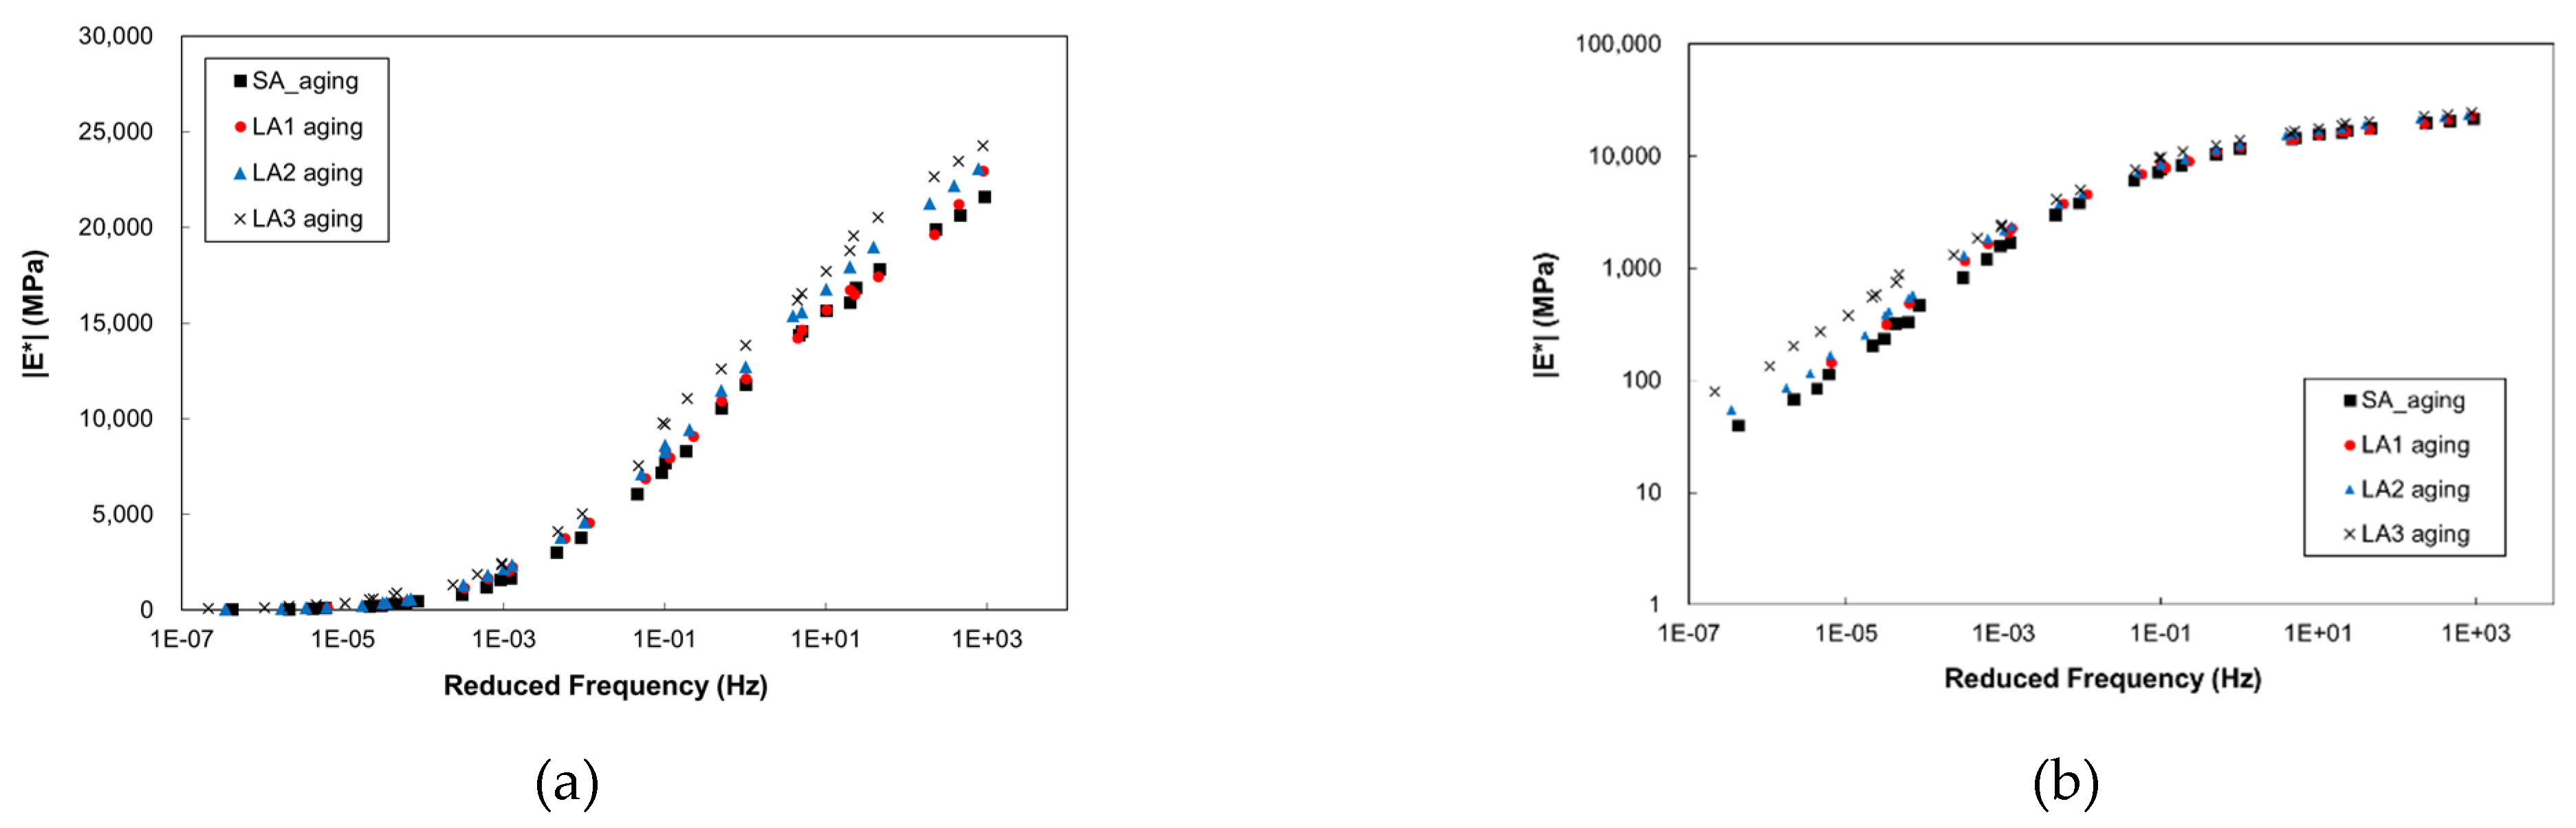
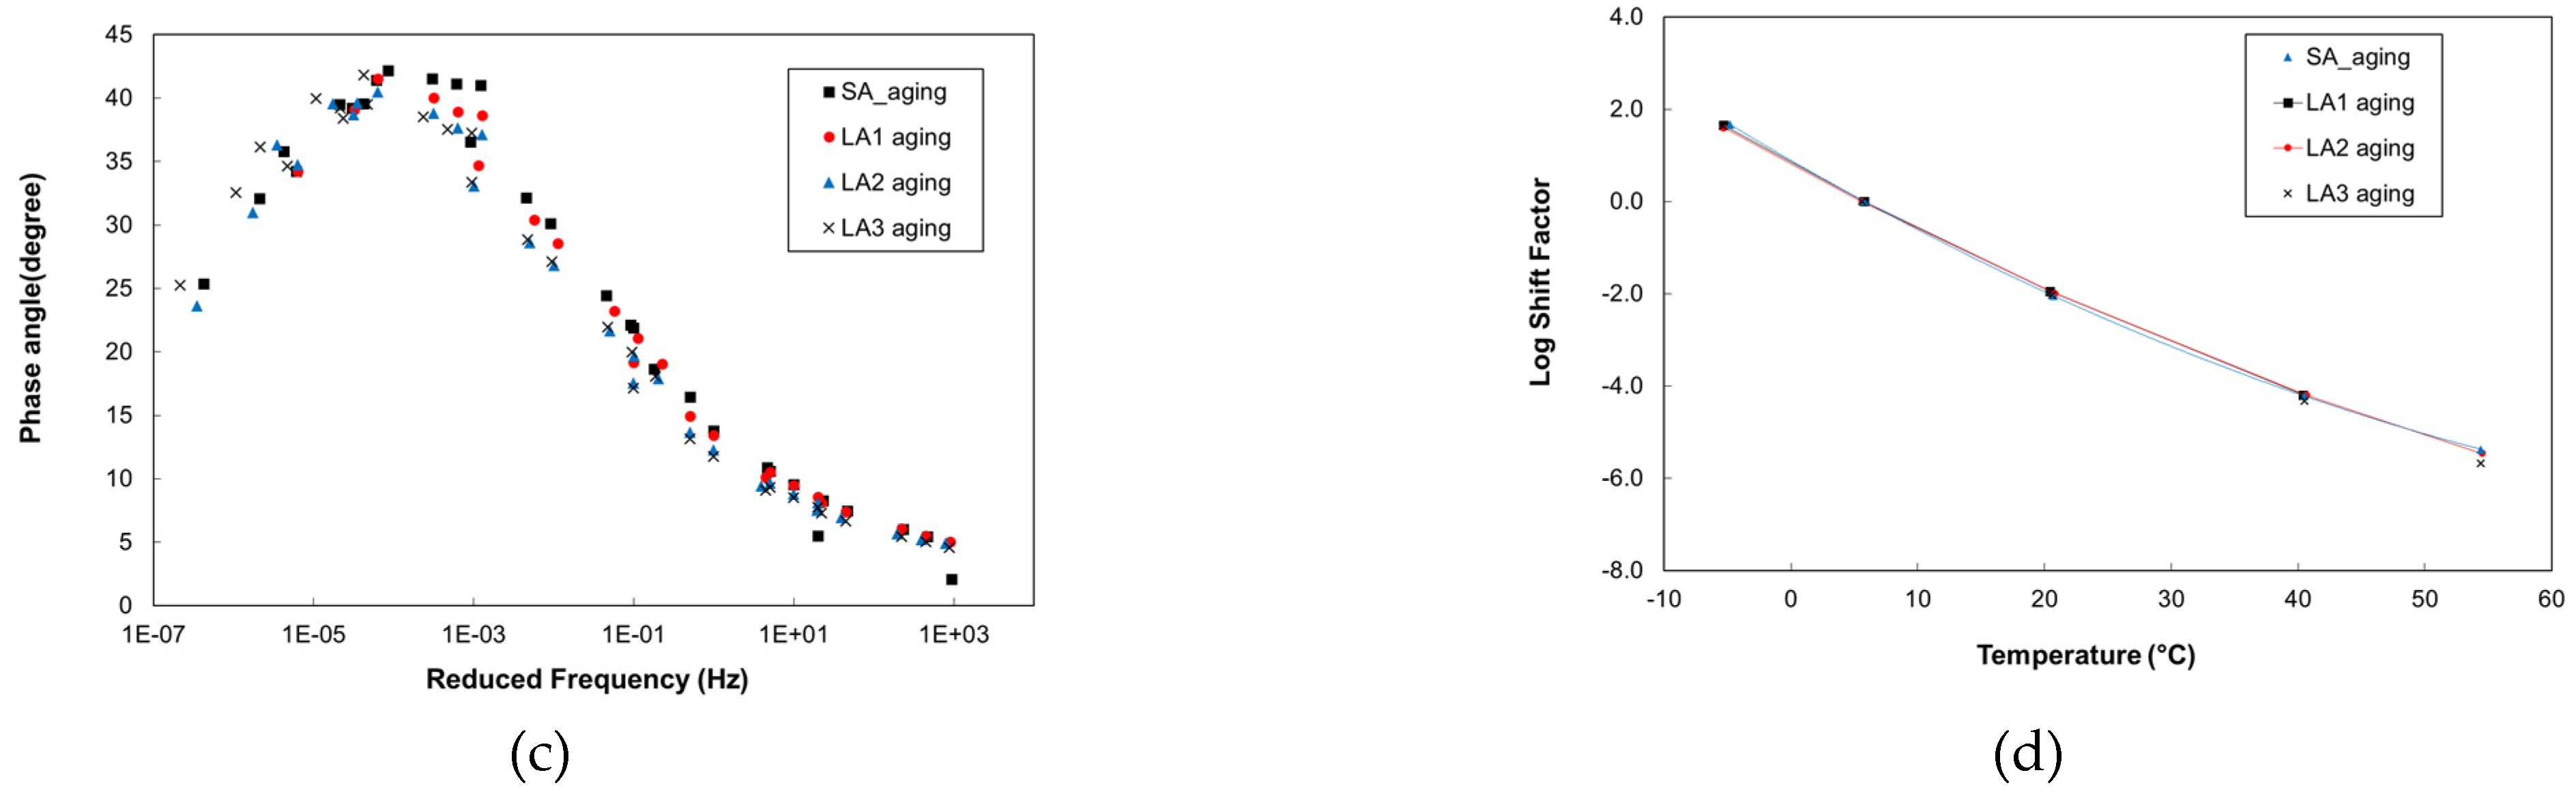
3.1. Dynamic Modulus
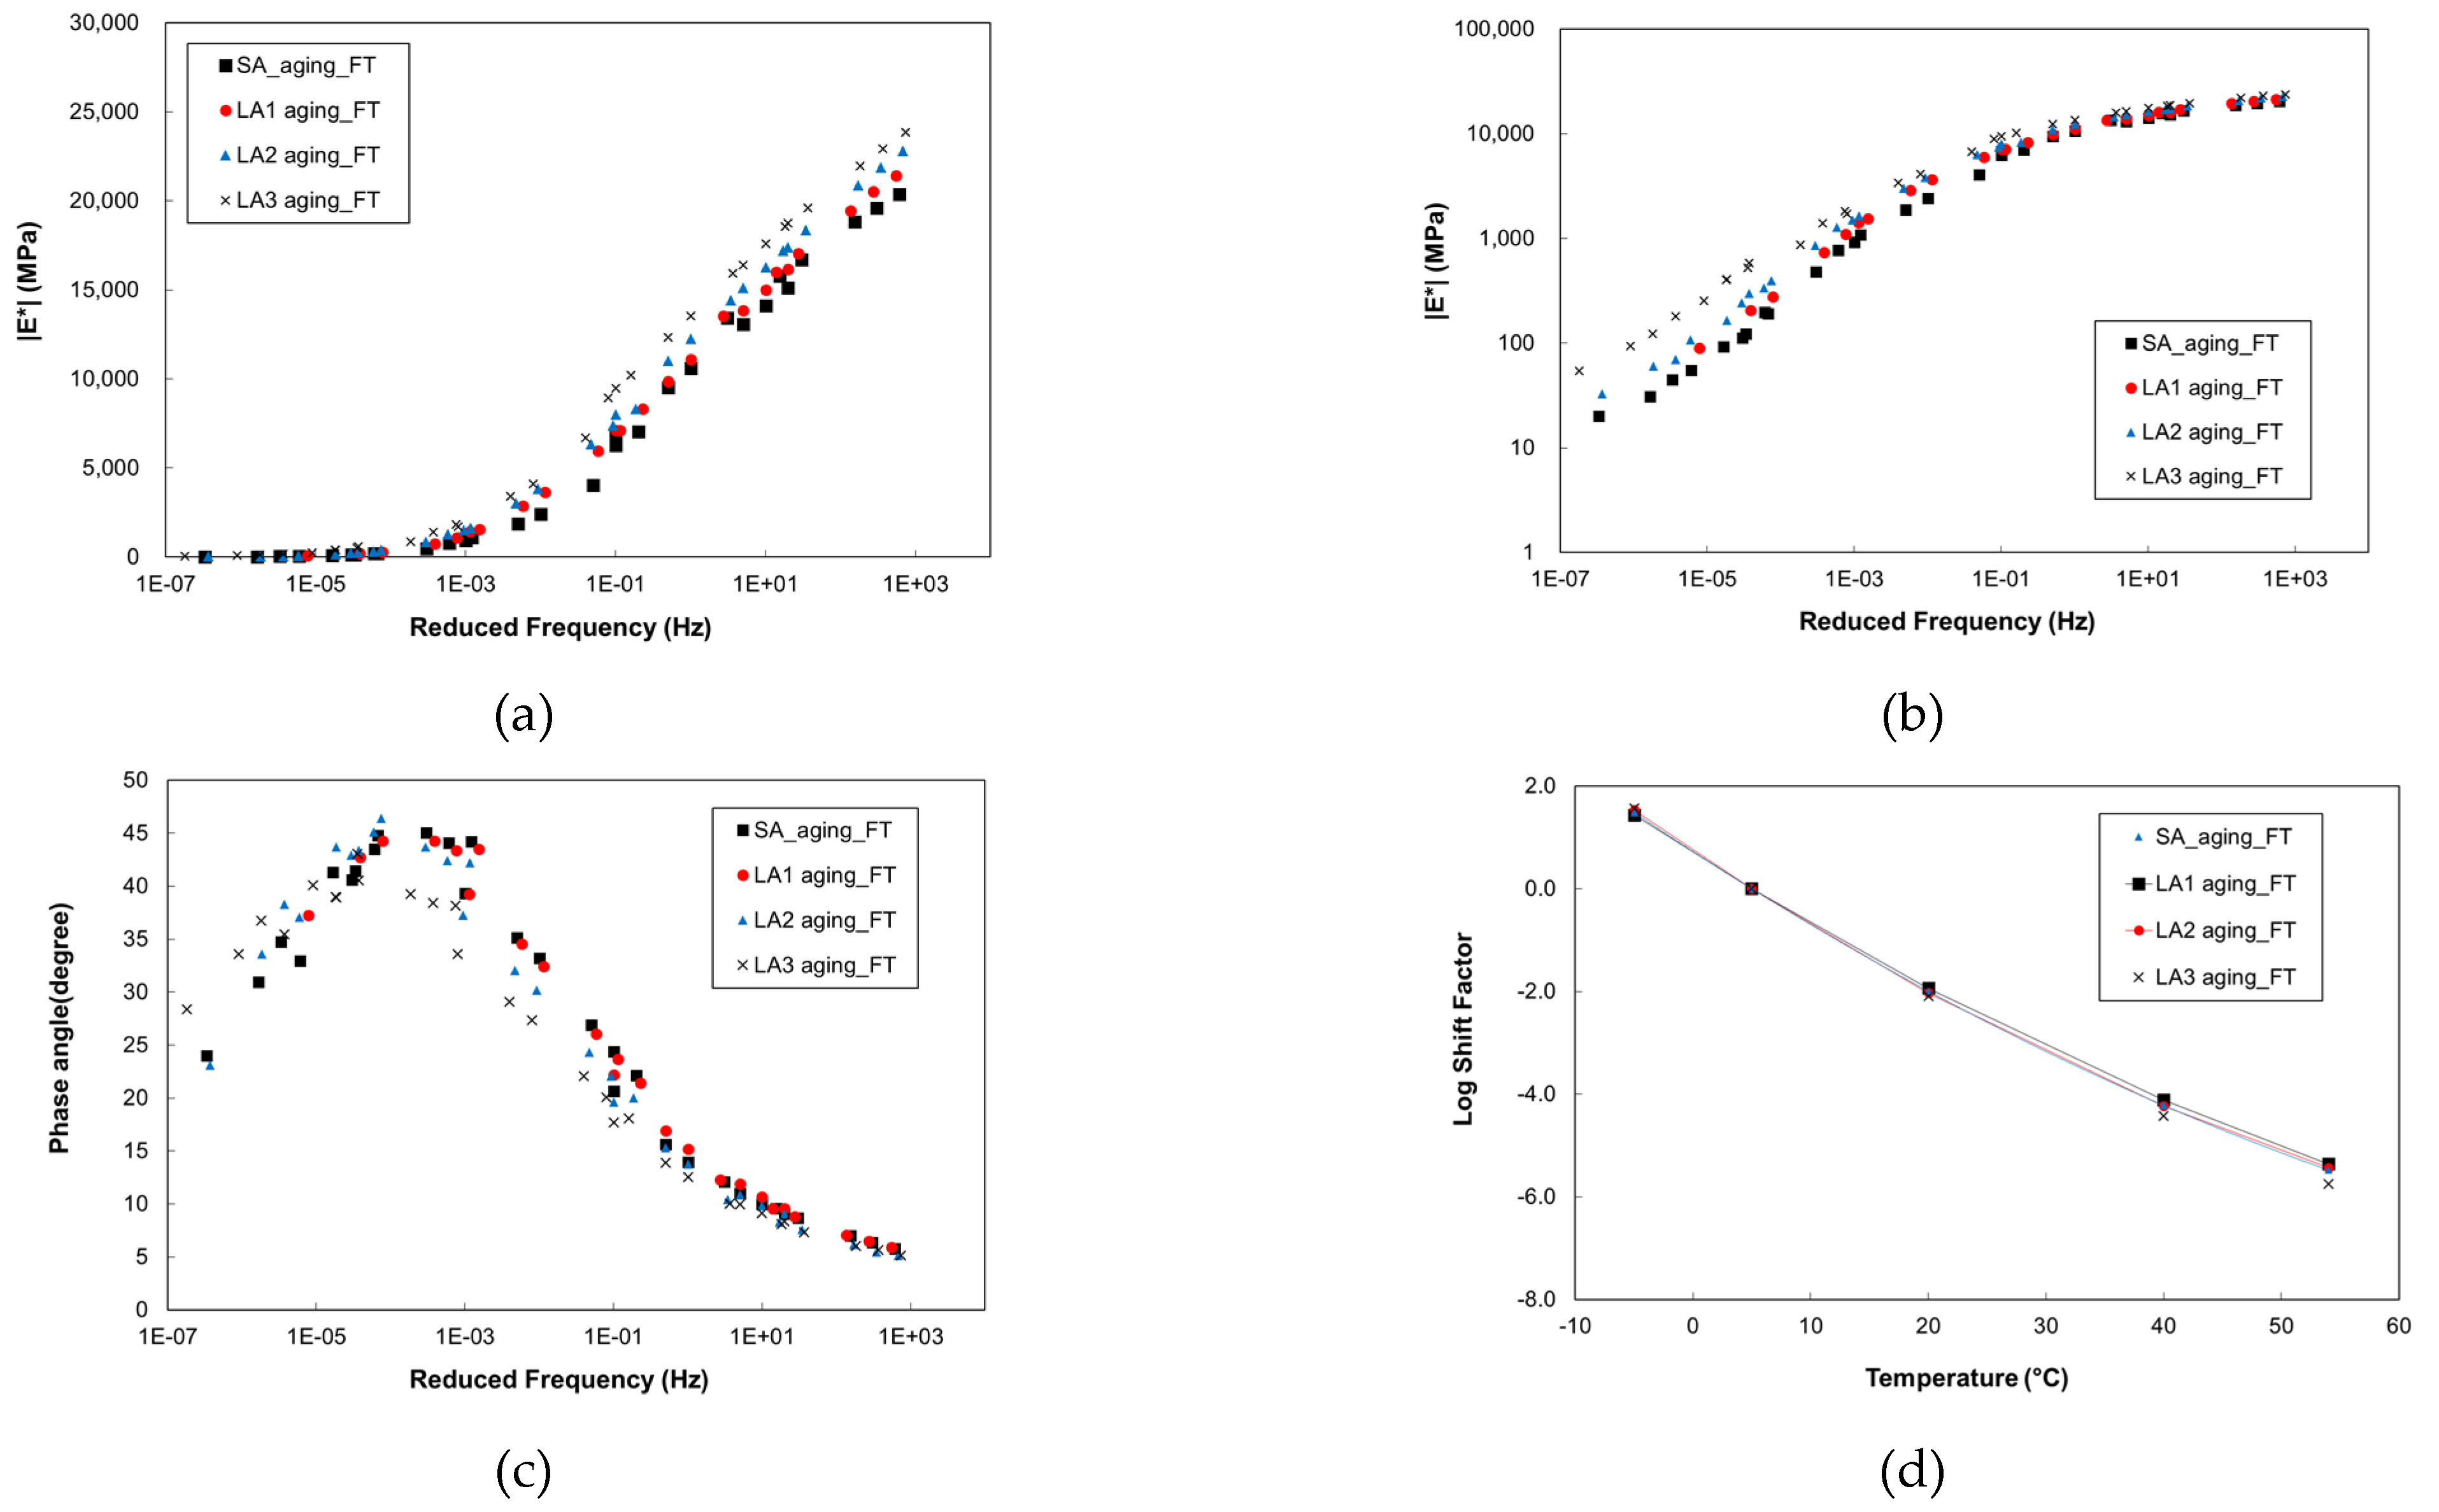
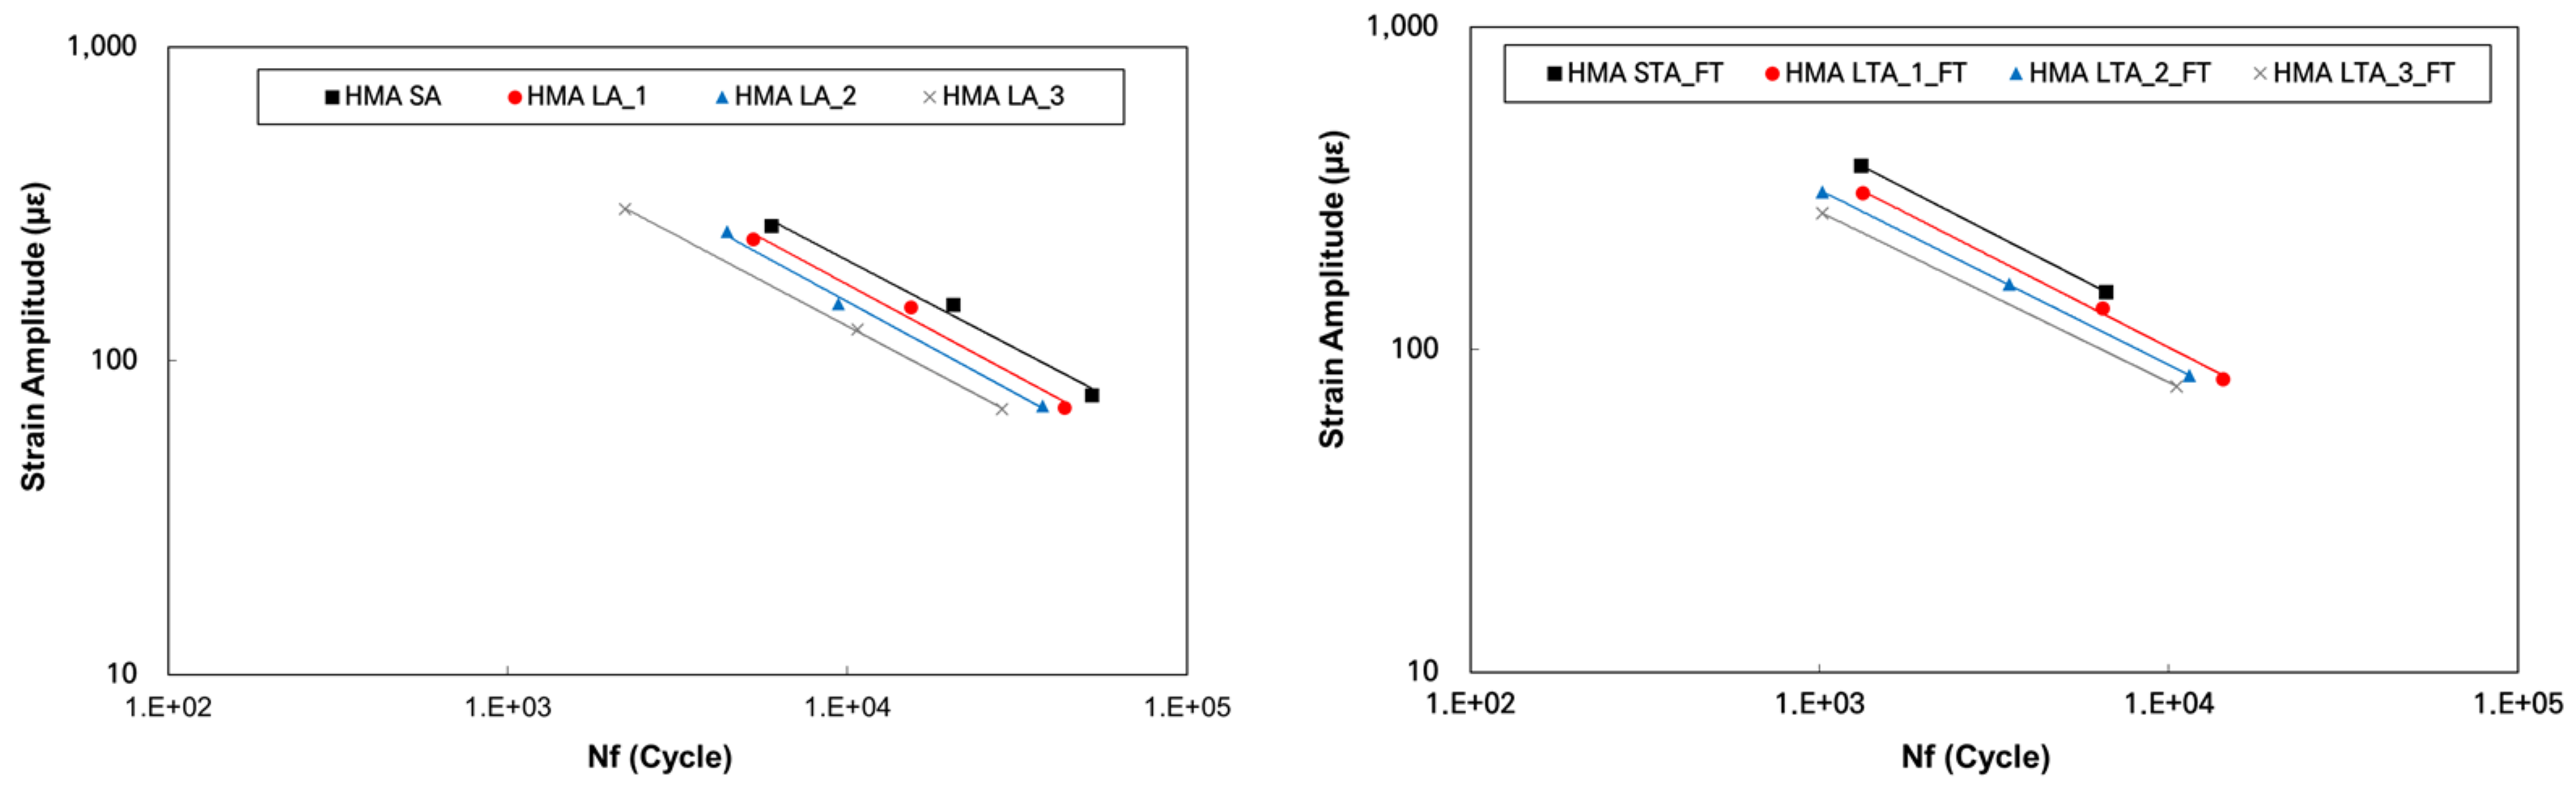
The stress-controlled dynamic modulus (|E*|) test was performed as a uniaxial tensile compression test to measure the linear viscoelastic properties of the asphalt mixtures. The reference temperature used to create the master curve of each mixture was 5 °C. The corresponding data are presented as semi-log and log-log graphs in Figure 5. The semi-log and log-log graphs reveal the behavior at low and high temperatures, respectively [18]. Figure 5 illustrates the DMT results for the HMA in different stages of aging, indicating that the dynamic modulus increased with age. The elastic modulus increased by approximately 10–35% at 10 Hz as SA progressed. The elastic modulus increased by up to 50% as the temperature increased or the loading frequency decreased.
Figure 6 displays the DMT results for the HMA after moisture treatment in different stages of aging. After moisture treatment was applied to the HMA, the dynamic modulus increased by 15%–42% at 20 °C and 10 Hz. The dynamic modulus continued to increase with aging despite the moisture treatment, albeit at a slower rate, indicating that moisture damage degraded the material performance.

3.2. Cyclic Fatigue

The fatigue cracking resistance of each mixture was evaluated via a cyclic fatigue test, which is a constant-velocity crosshead test that uses the strain-controlled approach. The CX test was conducted in which a constant-velocity strain was cyclically applied to the specimen using the crosshead of the device. To this end, a tensile force was applied to the specimen until failure at 20 °C and a frequency of 10 Hz (Haversine loading). Table 4 and Figure 7 present the number of fatigue cracks in the HMA with age and moisture damage after aging [18]. After each stage of aging and moisture damage, the instants at which the phase angle and dynamic modulus were sharply changed by varying the crosshead’s strain amplitude for each mixture to high, medium, and low were considered as points of failure. The number of cycles Nf at these points was determined. The results indicated that the stiffness (stress) increased with age, whereas the number of fatigue cracks decreased, suggesting that the fatigue properties of asphalt mixtures change significantly with age [17].
Moreover, the fatigue cracking resistance of the HMA was substantially reduced after moisture treatment. The resistance reduced even under a small strain. Kim [19] evaluated the fatigue cracking resistances of HMA samples obtained in situ according to the moisture damage and found that the HMA had a fatigue cracking resistance of approximately ≤50% on average. In this study, similar behavioral characteristics were observed for different ages and behavioral characteristics after moisture treatment, suggesting that moisture damage accelerates fatigue cracking failure in aged asphalt pavement.
Through the fatigue test results, the number of fatigue cracks until failure can be predicted using the relationship between elastic modulus and strain (Equation (4)) [15,20]. This equation was used to obtain the experimental coefficient values with respect to the age and moisture damage after aging according to the experimental results in terms of the material. Table 5 presents the coefficient values determined from the aging and moisture damage conditions through a regression analysis using the elastic modulus based on the experimental results.
N f = C k 1 1 ε t k 2 1 E k 3
Here, Nf represents the number of cycles to fatigue cracking; εt represents the tensile strain at the critical location; E represents the material stiffness; k1, k2, and k3 are laboratory regression coefficients; and C is the laboratory-to-field adjustment factor.

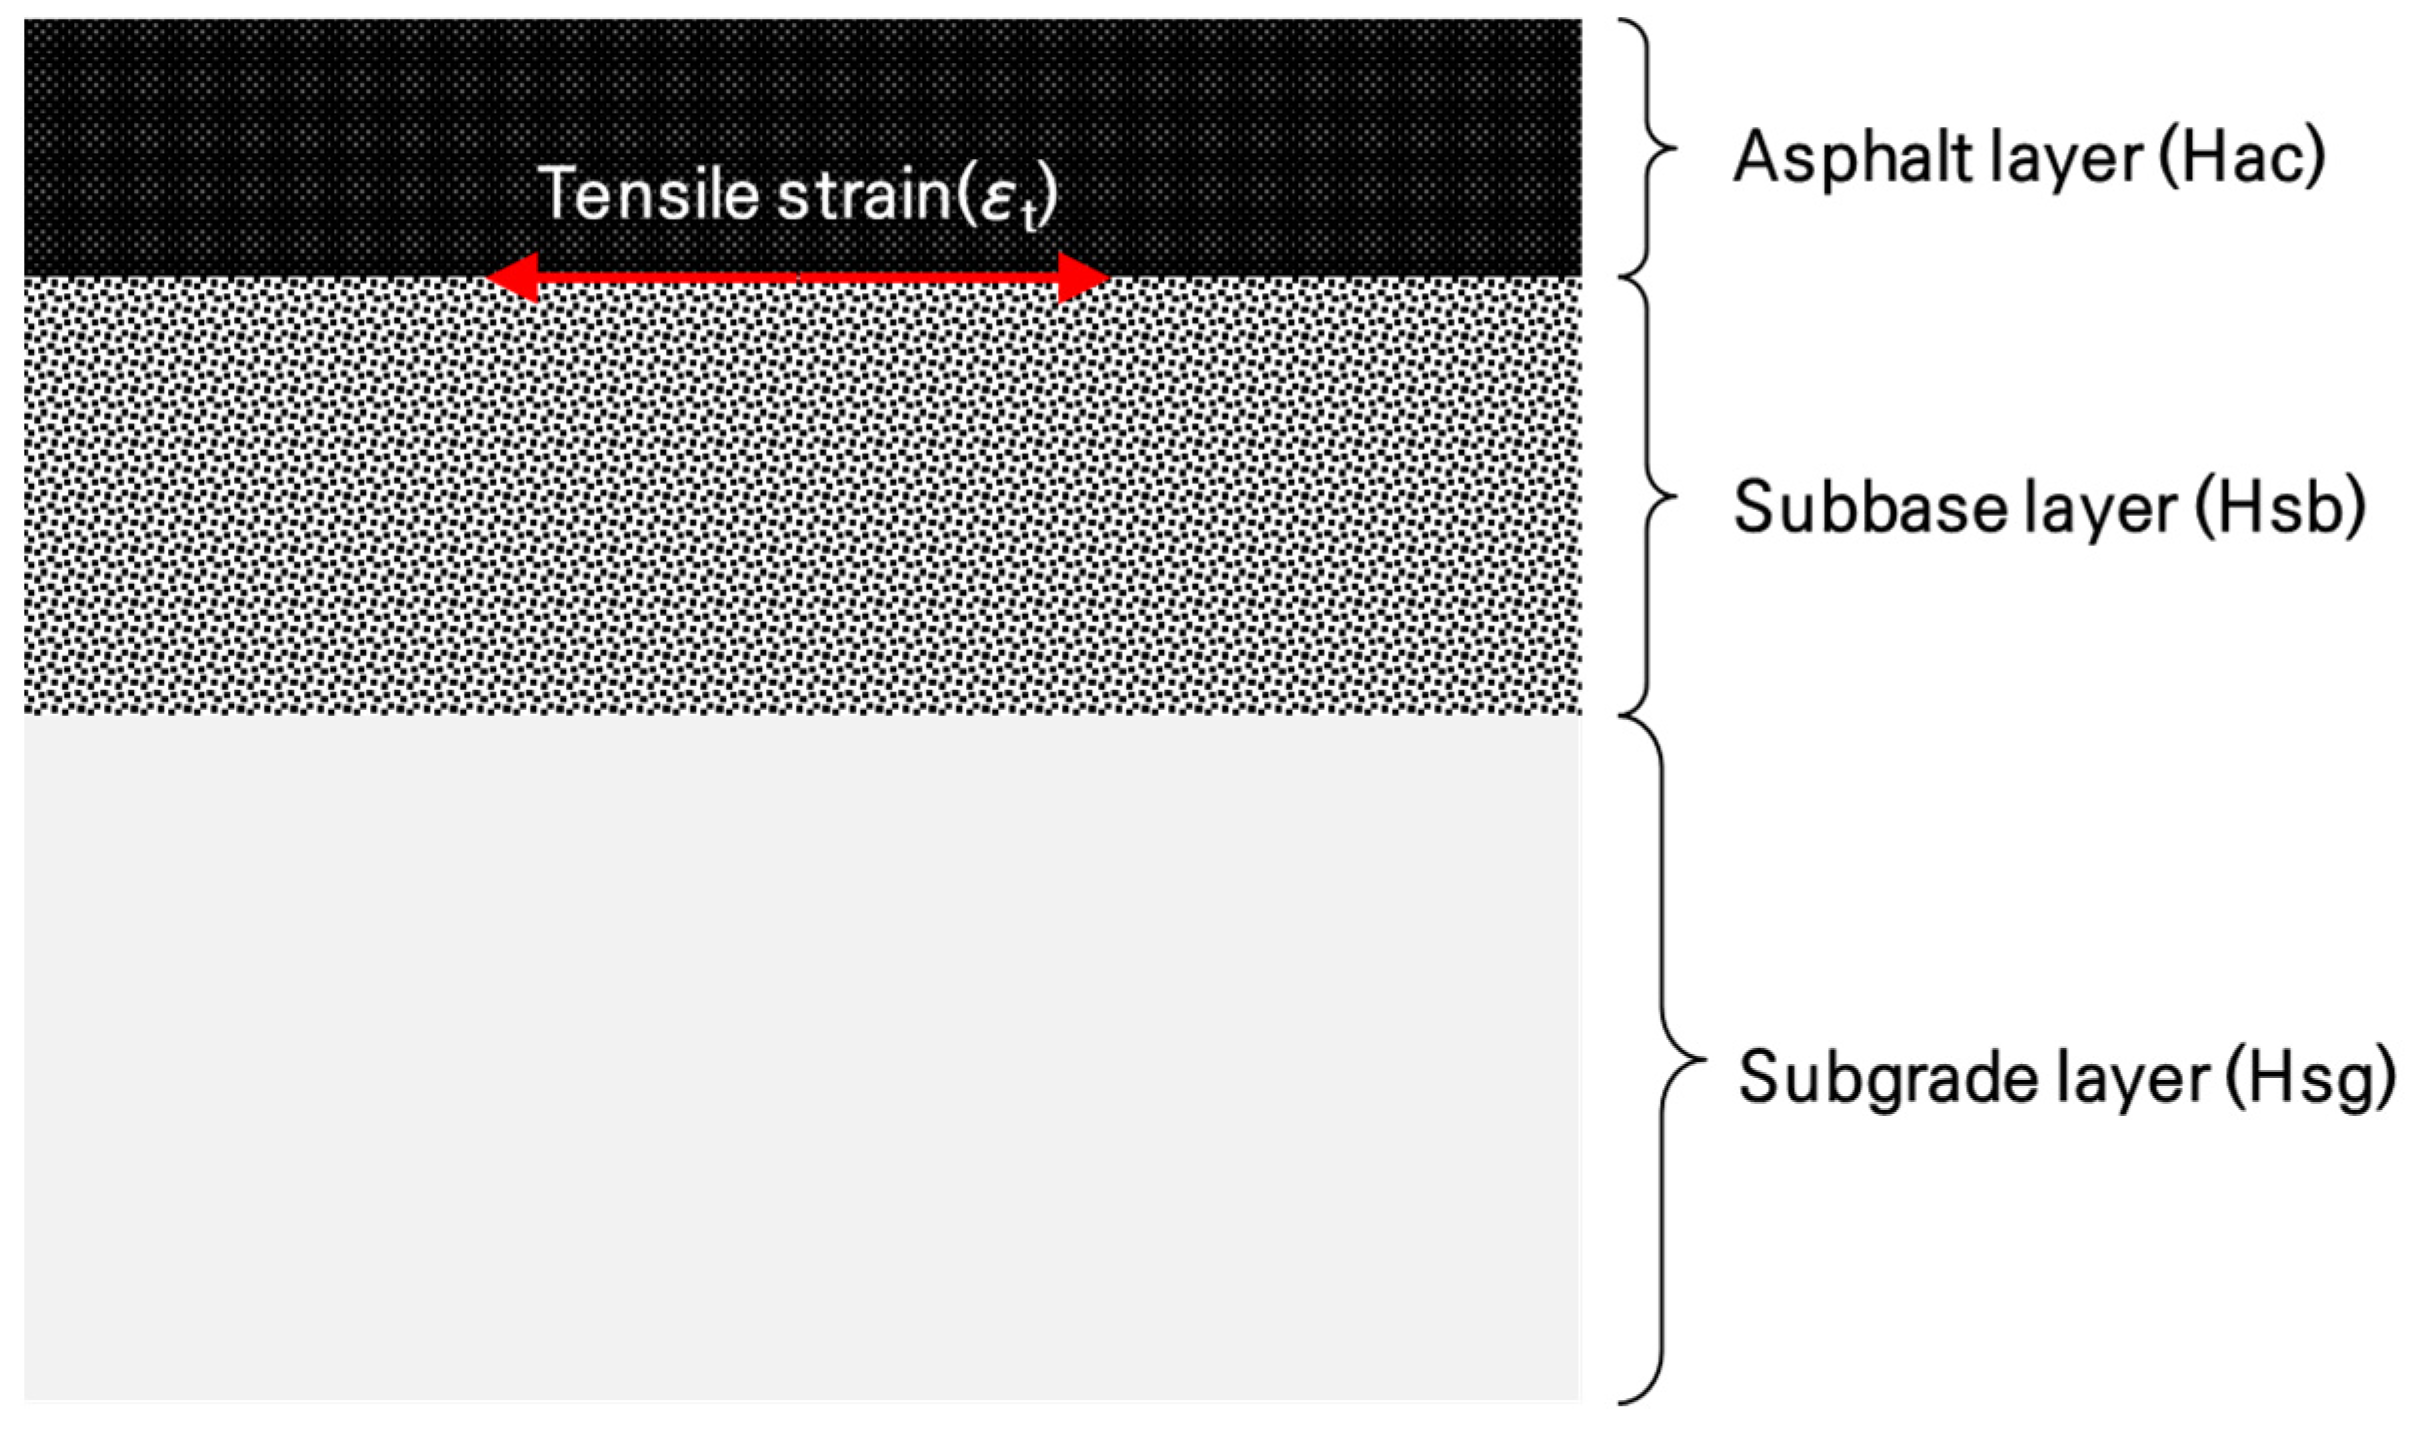
4. Finite-Element Analysis

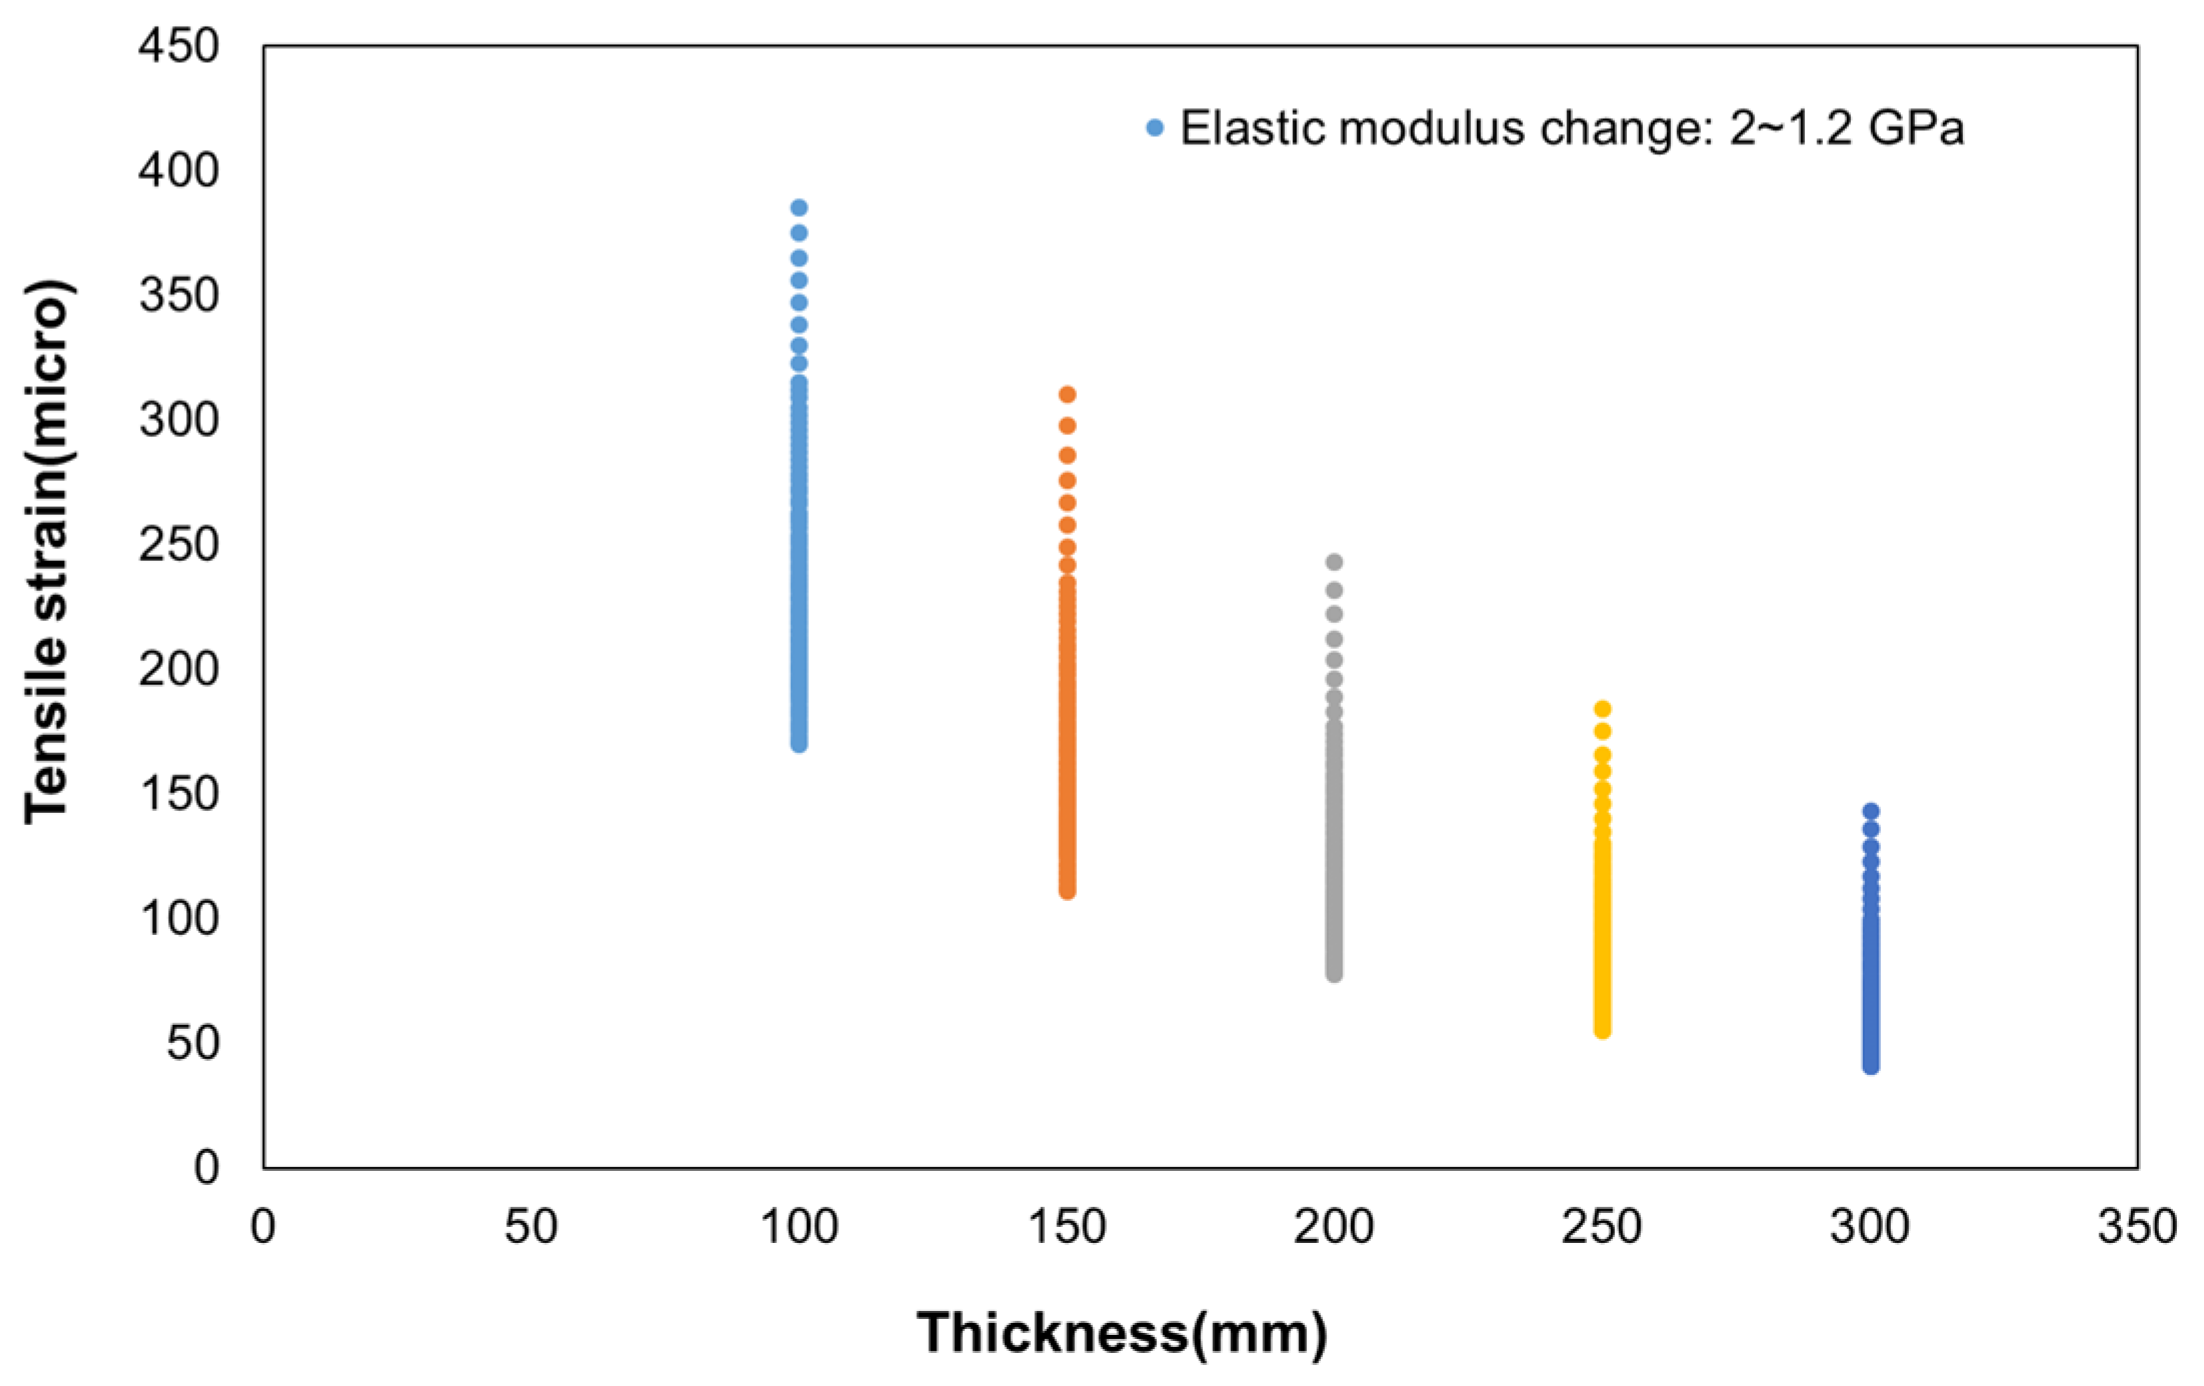
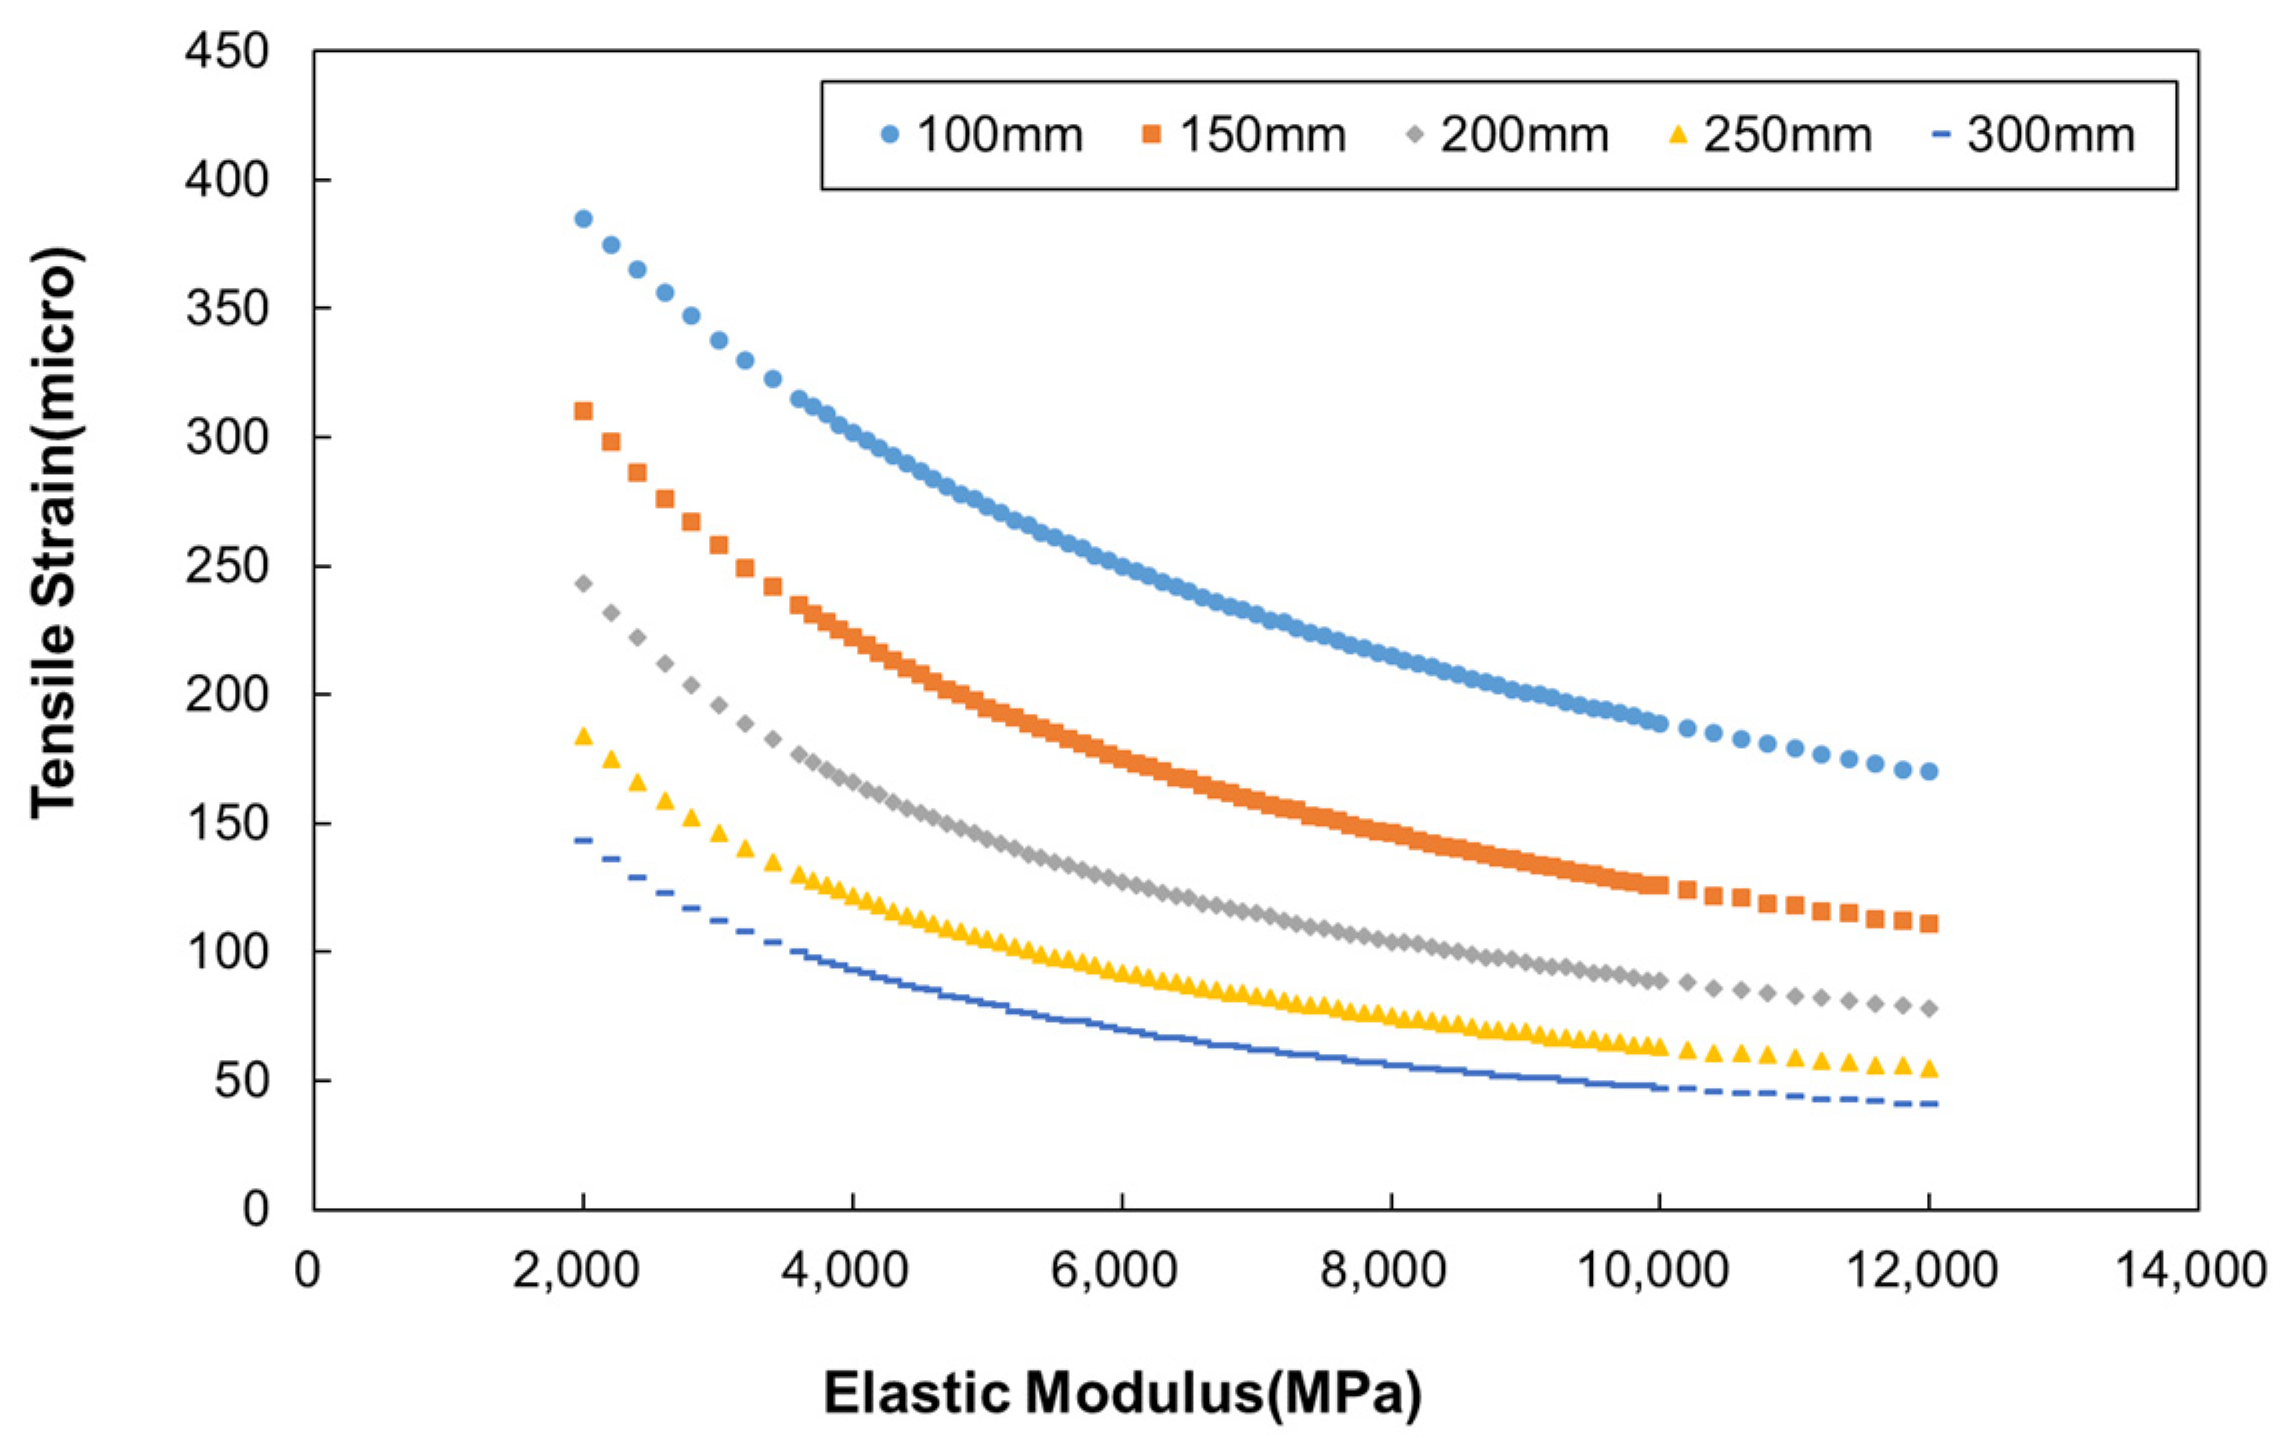
4.1. Sensitivity Analysis

The sensitivity analysis was performed on the strain of the pavement to identify the factors that most severely impacted fatigue cracking in asphalt pavement layers among the material-property changes under aging and moisture damage after aging. Figure 8 illustrates a cross-sectional diagram of the pavement used for the sensitivity analysis of the strain. The effects of changes in material properties were analyzed according to the asphalt pavement layer thickness, age, and moisture damage after aging on the tensile strain (εt) at the bottom of the asphalt layer. The pavement cross-section highlighted in Figure 8 was based on the total thickness generally used for national highways in Korea.
To determine the responses in the pavement, a database was constructed with the finite-element program ILLI-PAVE, using each pavement layer’s thickness and elastic modulus changes, according to the age and moisture damage after aging, as the input variables. ILLI-PAVE is a program for analyzing the asphalt pavement structure and uses an axisymmetric finite-element method (FEM) developed in 1980 at Illinois State University, United States. Because the axisymmetric FEM was applied, uniformly distributed circular loads were only considered. ILLI-PAVE performs interpolation while ensuring that the principal stresses produced in the subgrade and granular material layers do not exceed the material’s maximum strength calculated using the Mohr–Coulomb failure theory in the analysis process. In 1985, a study was performed to make ILLI-PAVE easier to use with the support of the Illinois Department of Transportation and the United States Department of Transportation. The researchers added an algorithm comprising a regression equation that could easily analyze general asphalt-pavement cross-sections and shear planes to ILLI-PAVE. The program creates and saves both the input and output as text files.
In this process, it was assumed that all pavement materials exhibited linear-elastic behavior. To simulate traffic loads, a ground contact pressure of 689 kPa was applied to a circular ground plane with a radius of 152.4 mm as the input. As only the elastic modulus at 20 °C was applied for the elastic modulus of the pavement, the behavior was assumed to be linear-elastic rather than viscoelastic. Using the FEM program, the tensile strain generated at the bottom of the asphalt layer, which causes fatigue cracking, was predicted through the responses in the pavement considered important. The 100 mm, 200 mm, and 300 mm cross-sections of the asphalt layer were selected to analyze the tensile strain generated at its bottom (Hac) according to changes in the material properties. The same thickness and elastic modulus were applied to the subbase (Hsb) and subgrade layers (Hsg); a thickness of 200 mm was input for the subbase layer and ≥700 mm for the subgrade layer to infinity. The elastic moduli of the subbase and subgrade layers were determined to be 275 and 50 MPa, respectively. The medium bearing capacity of lower ground presented in the Korean design catalog was input. Table 6 presents the thickness and elastic modulus of each pavement layer. Although fatigue cracking generally occurs at room temperature and below, Baek [20] reported that changes in the elastic modulus hardly affected the fatigue cracking characteristics at ≤5 °C. However, the fatigue crack life significantly varied with respect to the elastic modulus at room temperature (20 °C). Accordingly, the elastic-modulus values were obtained in the laboratory test while considering the fatigue cracking characteristics in spring or autumn at a pavement temperature of 20 °C.
The structural factor that most significantly affects the bottom-up cracking at the bottom of the asphalt pavement layer is the tensile strain. The factors that most significantly affect the tensile strain are the pavement thickness and elastic modulus of the asphalt layer. Accordingly, in this study, the tensile strain at the bottom of the asphalt layer was determined according to the changes in the elastic modulus at the asphalt pavement layer thicknesses of 100, 200, and 300 mm based on the age and aging moisture damage. The tensile strain was calculated according to the changes in the thickness and elastic modulus in units of 0.1 GPa between the maximum and minimum elastic moduli of the asphalt mixture for aging and moisture damage after aging in each layer.
Figure 9 illustrates the calculation results for the tensile strain at the bottom of the asphalt pavement according to the pavement layer thickness obtained using ILLI-PAVE based on the test results for the material properties. Figure 10 illustrates the values of tensile strain at the bottom of the pavement layer based on the elastic modulus according to the pavement thickness. As indicated by Figure 9, the tensile strain decreases as the pavement thickness increases, and the tensile strain becomes more sensitive to changes in the elastic modulus as the pavement layer thickness decreases. In particular, in the 100 mm pavement layer, the tensile strain changed from 150 to 400 με, whereas in the 300 mm pavement layer, it changed from 50 to 150 με. Moreover, as indicated by the measurements of the elastic-modulus changes according to the asphalt pavement layer in Figure 10, the tensile strain decreased as the elastic modulus increased.
To quantify the correlation between the tensile strain at the bottom of the asphalt pavement layer and the influencing factors, the Pearson correlation coefficients were calculated. The Pearson correlation coefficient (r) is the most frequently used coefficient to represent the relationship between two variables [21]. It has a value between −1 and 1, where r = −1 indicates a perfect negative linear relationship, r = 0 indicates no relationship, and r = 1 indicates a perfect positive linear relationship. Table 7 presents a relationship matrix of the Pearson correlation coefficient for each variable pair. In this study, the correlations between the tensile strain and the changes in the elastic modulus were analyzed according to aging, moisture damage, and pavement layer thickness. As the subbase and subgrade layers were assumed to have constant thickness values, as mentioned previously, the correlations of tensile strain at the bottom of the asphalt pavement layer with the changes in the asphalt pavement layer thickness (Hac) and elastic modulus (Eac) (Table 8) were analyzed. The tensile strain at the bottom of the pavement layer significantly varied with the elastic modulus; it decreased as the elastic modulus increased, indicating a negative linear relationship.

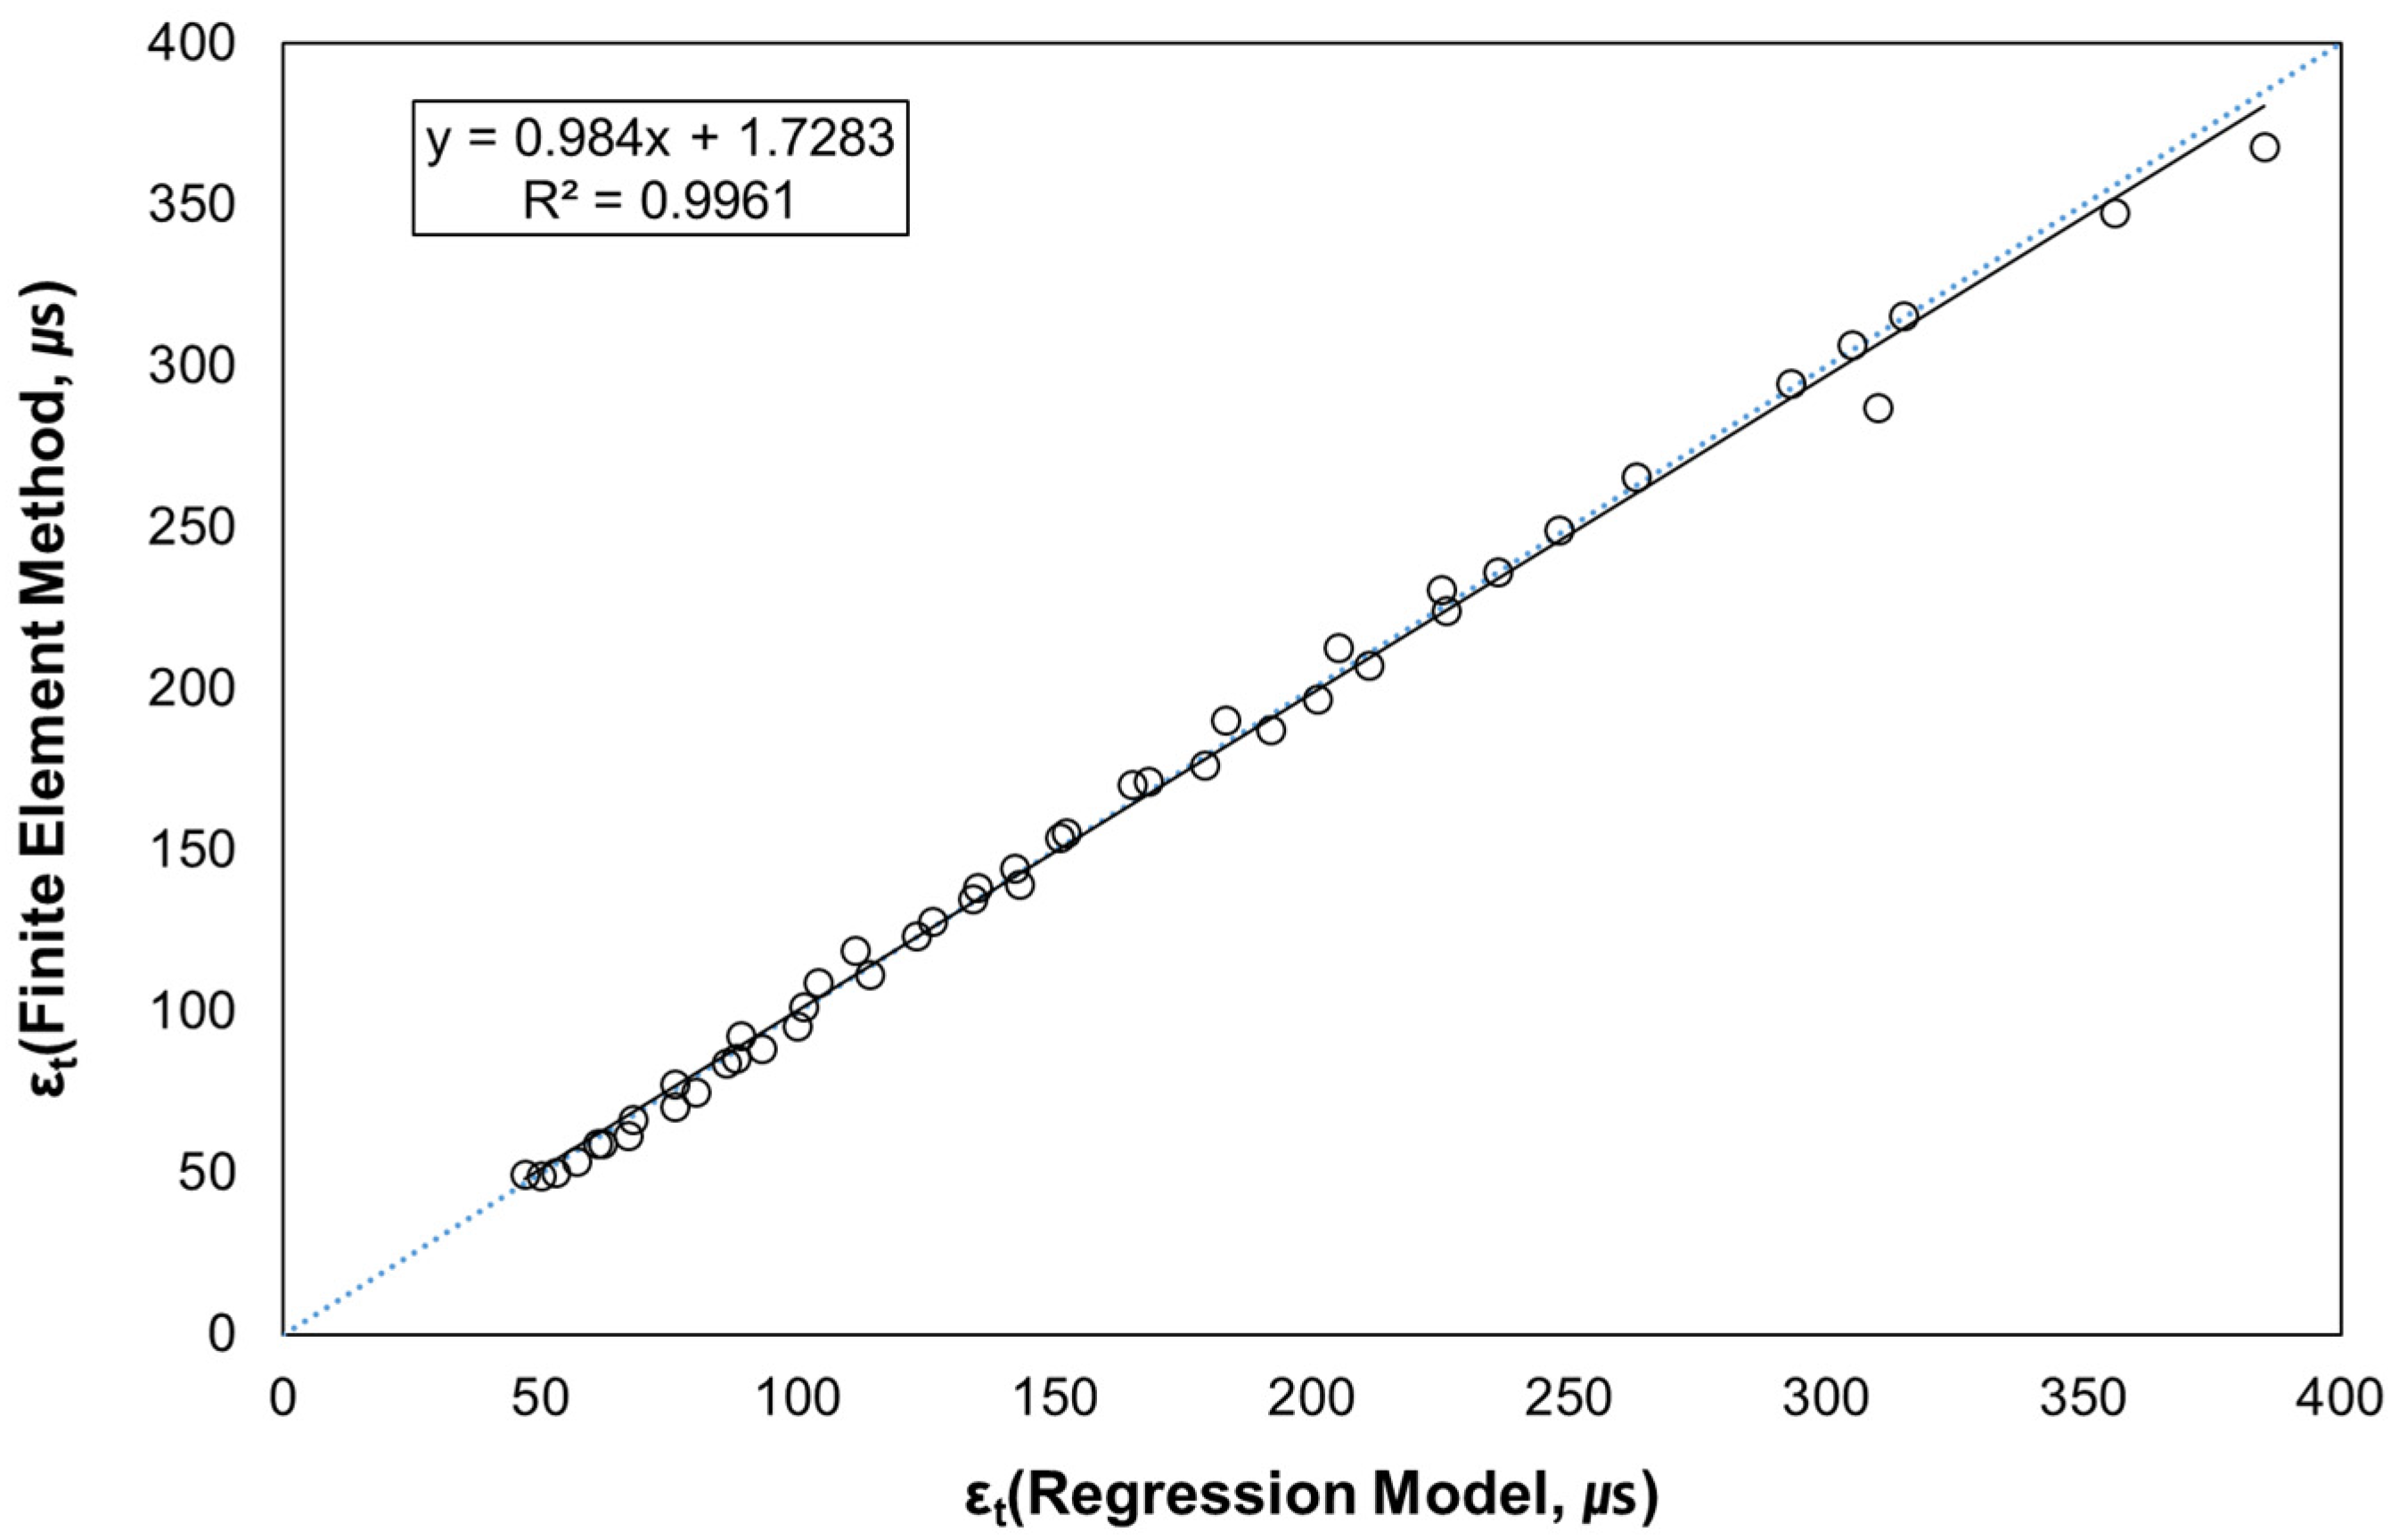
4.2. Prediction of Tensile Strain Response

A statistical analysis was performed to develop a regression model for predicting the tensile strain at the bottom of the asphalt pavement layer, using the layer’s thickness and elastic modulus as independent variables. A multiple linear regression analysis was performed for testing the relationship between two or more independent variables and one dependent variable. This relationship helped determine the independent variable that most significantly affected the tensile strain (the dependent variable) and derive a linear model that best predicted the dependent variable from the independent one. A polynomial regression model with two independent variables can be expressed as:
y = α 0 + α 1 x 1 + α 2 x 2 + α 3 x 1 2 + α 4 x 2 2 + α 5 x 1 x 2 + ε
where y is a dependent variable; α 0 , α 1 , , α 5 are regression coefficients; and ε is an error following a normal distribution with a mean of 0 and variance of σ 2 .
In the forward selection method, which is applied to the regression model first from the independent variable most correlated to the dependent variable, the regression model’s reliability occasionally declines with preceding independent variables when a new independent one is applied. To address this shortcoming, the stepwise selection method was applied, which examines an independent variable’s significance each time it is applied to the regression equation via forward selection and subsequently discards the unimportant variables.
Equation (6) is derived through the regression analysis according to changes in the elastic modulus with respect to the asphalt pavement layer’s thickness, age, and moisture damage after aging. Table 8 presents the regression-analysis results for the pavement thickness and elastic modulus. As indicated in the table, the p-values of all the variables were <0.0001. Hence, the results were significant.
ε t = 666.94 63.27 H a c 0.00032 E a c + 1.98 H a c 2 + 7.50 E a c 2 + 1.00 H a c E a c ,
where ε t represents the tensile strain at the bottom of the asphalt pavement layer ( μ ε ); H a c represents the asphalt layer thickness (in); and E a x represents the elastic modulus of the asphalt layer (psi).
Figure 11 presents a comparison of the tensile strain at the bottom of the asphalt pavement predicted by the regression model with the finite-element analysis (FEA) results (ILLI-PAVE), according to changes in the asphalt pavement layer thickness and elastic modulus. The regression model accurately predicted the tensile strain. The coefficient of determination (R2) between the FEA and regression models was 0.9958.

4.3. Analysis of Fatigue Cracking Resistance

Changes in the material properties according to the age and moisture damage after aging were examined via the DMTs of the asphalt mixtures. To evaluate the impact on the fatigue cracking resistance, the crosshead cyclic tests were conducted for each mixture and selected the experimental coefficient values (k1, k2, and k3) for each condition required for the fatigue cracking model. Using the test results, the influence of aging on fatigue cracking resistance was analyzed for each mixture. The elastic modulus and experimental coefficient values were applied in addition to the strain values at the bottom of the pavement layer, according to the changes in the elastic modulus by the pavement layer.
Table 9 lists the number of allowable loads until fatigue failure, according to the changes in the asphalt pavement thickness and elastic modulus for each mixture after aging. For the HMA, the number of allowable loads decreased with age, i.e., as the elastic modulus increased. Although the fatigue life marginally varied with changes in the pavement thickness, it decreased by at least 60%. For a thin pavement, the tensile strain had a significant effect owing to its impact on the fatigue cracking resistance; as the pavement layer thickness increased, the tensile strain decreased due to the elastic modulus. Hence, the fatigue cracking resistance increased as the elastic modulus increased.

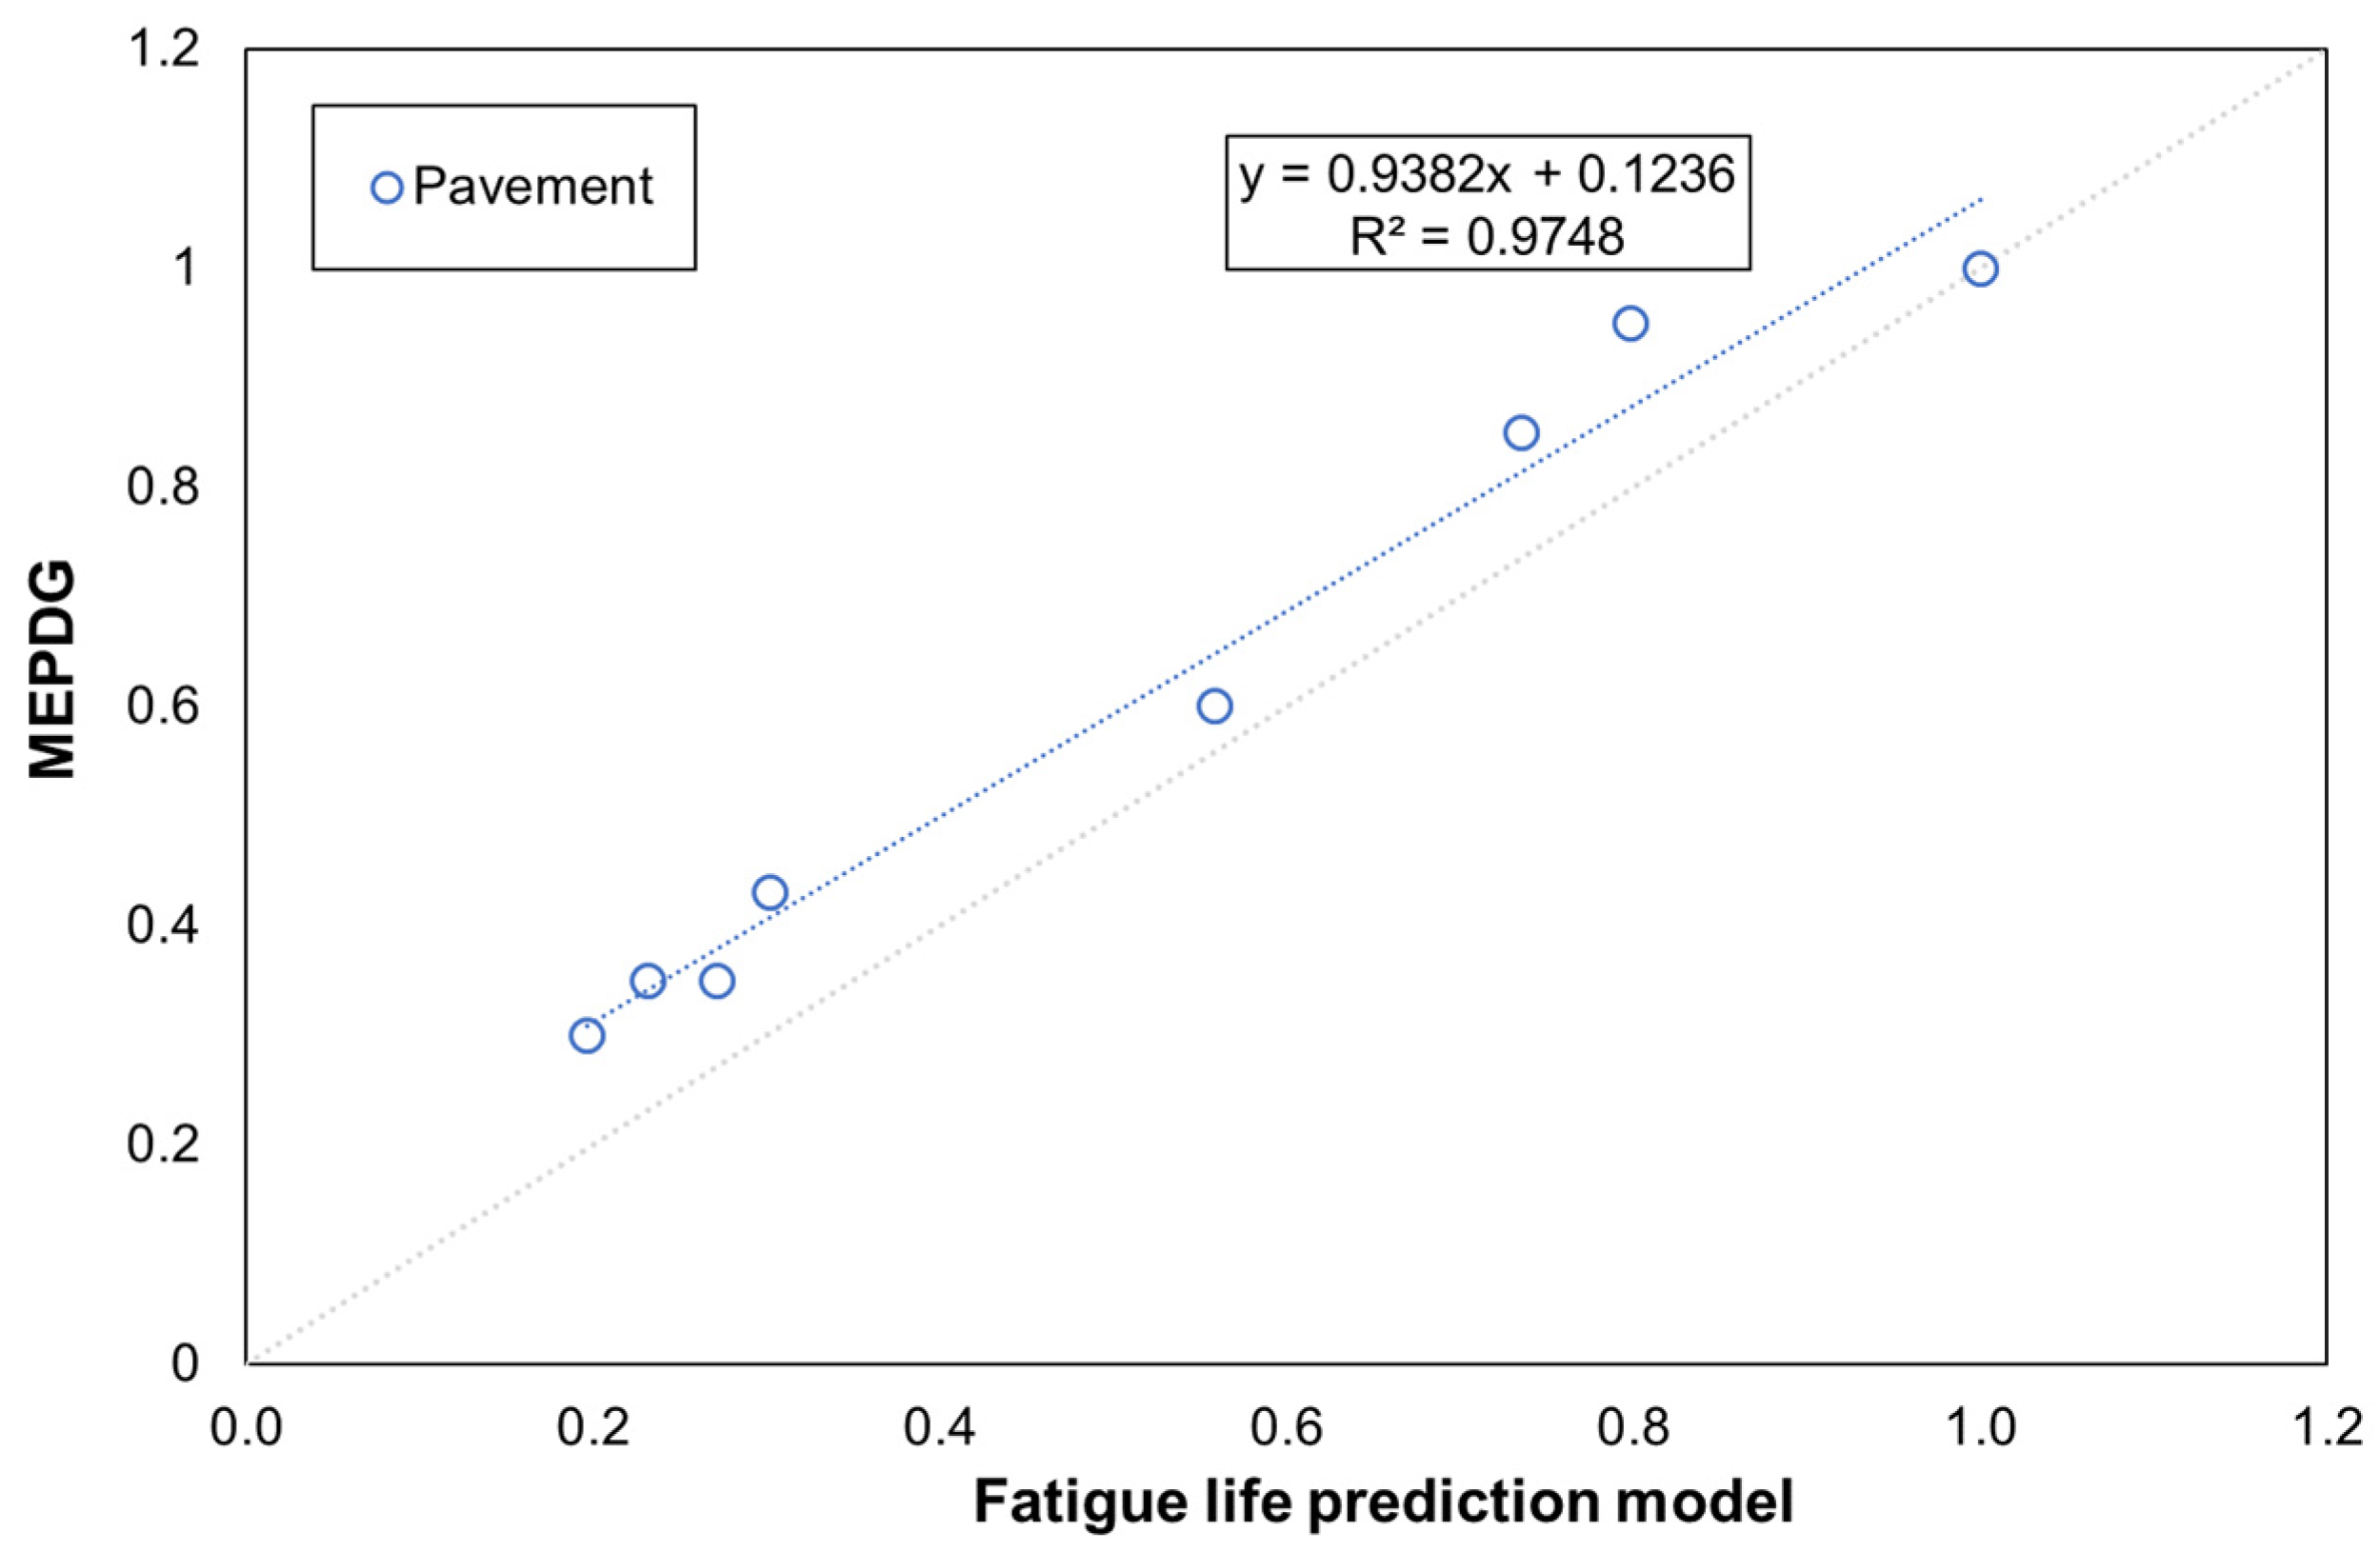
4.4. Verification of Fatigue Effect

The fatigue life under each condition was predicted. Subsequently, its correlation with the degree of fatigue damage under aging and moisture damage after aging was analyzed using the MEPDG [22]. For SA, the pavement thickness corresponding to a design life of 10 year was calculated. Table 10 presents the traffic volume, climatic conditions, and pavement material parameters needed for the pavement design. The calculated pavement thickness was 206 mm.
The fatigue cracking service life was analyzed for bottom-up cracking in each stage of aging for a pavement thickness of 206 mm. Next, the service life of each mixture was evaluated under each aging condition in the laboratory test using the MEPDG. The service life decreased with age. In the third stage of LA, bottom-up cracking failure occurred at six years of service life—a reduction of approximately 40%. Meanwhile, under moisture damage in the third stage of LA, bottom-up cracking failure occurred at three years of service life—a reduction of approximately 70%. Table 11 and Figure 12 present the results of a comparative analysis between the MEPDG results and the fatigue prediction model results, where the concept of the fatigue damage degree for fatigue cracking was applied. Regarding fatigue cracking resistance based on the fatigue prediction equation, the tensile strain was determined by Equation (6) for a pavement thickness of 206 mm and accordingly the number of fatigue cracks. As indicated in Table 11, the fatigue-life prediction equation underestimates the degree of fatigue cracking damage after aging compared with the MEPDG, as well as the degree of fatigue cracking damage due to moisture damage after aging. While the experimental method of the MEPDG for predicting fatigue cracking reflects the cyclic bending stress test, in this study, the results were obtained via a fatigue cracking test using a direct tension cyclic load test. Hence, the difference in results was attributed to the type of the test method.

5. Conclusions

In this study, the effects of aging and moisture damage after aging on the fatigue life of asphalt pavement were comparatively analyzed and the following conclusions were drawn.
  • Moisture damage can significantly influence the change in mechanical properties of asphalt mixture and eventually can be a cause that accelerates severe damage in asphalt pavement as aging progresses.
  • The experimental coefficient values in the fatigue model for predicting the number of fatigue cracks due to aging and moisture damage after aging were calculated. The number of fatigue cracks in asphalt mixtures due to aging and moisture damage after aging can be predicted through laboratory tests.
  • The differences between the results for the number of fatigue cracks and fatigue life between the MEPDG and the fatigue cracking prediction model were attributed to the fatigue test methods, as well as to differences between the laboratory test conditions (load, environment, etc.) and the prediction variables of the MEPDG.
  • According to the verification results, the coefficient values of the proposed fatigue-life prediction model can be used for predicting the fatigue life from aging and moisture damage after aging. In addition, the degree of fatigue damage can be predicted by deriving the tensile strain using the regression equation and the elastic modulus according to aging and moisture damage.
  • The results of this study can be valuable guidance for predicting the service life and remaining life of asphalt pavement considering the deterioration due to the aging and moisture.

Author Contributions

Conceptualization, S.Y. and C.B.; methodology, S.Y.; validation, S.Y., C.B., and H.P.; formal analysis, S.Y. and H.P.; investigation, C.B.; writing—original draft preparation, S.Y.; writing—review and editing, C.B. and H.P.; supervision, C.B.; project administration, S.Y.; funding acquisition, C.B. All authors have read and agreed to the published version of the manuscript.

Funding

This work was supported by a Korea Agency for Infrastructure Technology Advancement (KAIA) grant funded by the Ministry of Land, Infrastructure and Transport (Grant No. 22POQW-B152342-04).

Institutional Review Board Statement

Not applicable.

Informed Consent Statement

Not applicable.

Data Availability Statement

Not applicable.

Conflicts of Interest

The authors declare no conflict of interest.

References

  1. Little, D.N.; Jones, D.R. Chemical and Mechanical Processes of Moisture Damage in Hot-Mix Asphalt Pavements. In Proceedings of the Moisture Sensitivity of Asphalt Pavements National Seminar, San Diego, CA, USA, 4–6 February 2003. [Google Scholar]
  2. Ministry of Land, Infrastructure and Transport in Korea. Road Statistic. Available online: http://stat.molit.go.kr/portal/cate/statView (accessed on 30 October 2022).
  3. Safaeia, F.; Lee, J.; do Nascimento, L.A.H.; Hintz, C.; Kim, Y.R. Implications of warm-mix asphalt on long-term oxidative ageing and fatigue performance of asphalt binders and mixtures. Road Mater. Pavement Des. 2014, 15, 45–61. [Google Scholar] [CrossRef]
  4. Sarsam, S.I.; AL-Zubaidi, I.L. Resistance to Moisture Damage of Recycled Asphalt Concrete Pavement. J. Eng. 2016, 21, 48–57. [Google Scholar]
  5. Xiao, R.; Huang, B. Moisture Damage Mechanism and Thermodynamic Properties of Hot-Mix Asphalt under Aging Conditions, American Chemical Society. Sustain. Chem. Eng. 2022, 10, 14865–14887. [Google Scholar] [CrossRef]
  6. Ministry of Land, Infrastructure and Transport in Korea. Asphalt Mixture Production and Construction Guidelines; MOLIT: Sejong City, Republic of Korea, 2017.
  7. Kim, Y.R.; Castorena, C.; Saleh, N.F.; Braswell, E.; Elwardany, M.; Rad, F.Y. NCHRP 09-54 Extension Report: Long-Term Aging of Asphalt Mixtures for Performance Testing and Prediction; Transportation Research Board: Washington, DC, USA, 2020. [Google Scholar]
  8. AASHTO T 283; Method of Test for Resistance of Compacted Asphalt Mixtures to Moisture-Induced Damage. Association of State Highway and Transportation Officials: Washington, DC, USA, 2014.
  9. AASHTO R 30; Standard Practice for Mixture Conditioning of Hot Mix Asphalt. Association of State Highway and Transportation Officials: Washington, DC, USA, 2002.
  10. Goodrich, J.L. Asphaltic binder rheology, asphalt concrete rheology and asphalt concrete mix properties. J. Assoc. Asph. Paving Technol. 1991, 60, 80–120. [Google Scholar]
  11. Federal Highway Administration (FHWA). “Asphalt Pavement Performance Analysis Software.” (Website) Washington, DC. Available online: www.fhwa.dot.gov/pavement/asphalt/analysis/ (accessed on 10 May 2022).
  12. Myers, L.A.; Roque, R.; Ruth, B.E. Mechanisms of surface-initiated longitudinal wheel path cracks in high type bituminous pavements. Asphalt Paving Technol. 1998, 65, 401–432. [Google Scholar]
  13. Myers, L.A.; Roque, R. Evaluation of Top-Down Cracking in Thick Asphalt Pavements and the Implications for Pavement Design. Perpetual Bitum. Pavements 2001, 503, 79–87. [Google Scholar]
  14. Pellinen, T. Evaluation of Surface (Top-Down) Longitudinal Wheel Path Cracking in Indian; Joint Transportation Research Program, Purdue University: West Lafayette, IN, USA, 2002. [Google Scholar]
  15. Kutay, M.E.; Gibson, N.; Youtcheff, J. Conventional and viscoelastic continuum damage (VECD)-based fatigue analysis of polymer modified asphalt pavements. J. Assoc. Asph. Paving Technol. 2008, 77, 395–434. [Google Scholar]
  16. Schapery, R.A. Methods of interconversion between linear viscoelastic material functions. Part II—an approximate analytical method. Int. J. Solids Struct. 1999, 36, 1677–1699. [Google Scholar] [CrossRef]
  17. Reese, R. Properties of aged asphalt binder related to asphalt concrete fatigue life. J. Assoc. Asph. Paving Technol. 1997, 66, 604–632. [Google Scholar]
  18. Yang, S.L.; Baek, C.; Park, H.B. Effect of aging and moisture damage on fatigue cracking properties in asphalt mixtures. Appl. Sci. 2021, 11, 10543. [Google Scholar] [CrossRef]
  19. Kim, Y.R.; Baek, C.M. Evaluation of Moisture Susceptibility in A Warm Mix Asphalt Pavement: US 157, Hurdle Mills, NC, USA, 2010. In Proceedings of the 2nd International Conference on Warm Mix Asphalt, St. Louis, MO, USA, 13 October 2011. [Google Scholar]
  20. Baek, C.M. Investigation of Top-Down Cracking Mechanisms Using the Viscoelastic Continuum Damage Finite Element Program. Ph.D. Thesis, North Carolina University, Chapel Hill, NC, USA, 2010. [Google Scholar]
  21. Park, H.M.; Choi, Y.W.; Lee, H.J.; Lee, W.S. Development of an asphalt pavement response model for subsurface cavity section using the 3D finite element method. Int. J. Highw. Eng. 2018, 20, 85–91. [Google Scholar]
  22. Le, V.P.; Lee, H.J.; Flores, J.M.; Baek, J.; Park, H.M. Development of a simple asphalt concrete overlay design scheme based on mechanistic-empirical approach. Road Mater. Pavement Des. 2016, 18, 630–645. [Google Scholar] [CrossRef]
Figure 1. Specimen fabrication using gyratory compactor and cored specimens.
Sustainability 15 04815 g001
Figure 2. Experimental flowchart.
Sustainability 15 04815 g002
Figure 3. Front views of the MTS 810 tester and specimen mount.
Sustainability 15 04815 g003
Figure 4. Dynamic modulus and phase angle vs. number of loading cycles in the cyclic fatigue test [17].
Sustainability 15 04815 g004
Figure 5. DMT results for HMA at different ages: (a) semi-log scale; (b) log-log scale; (c) phase angle; (d) shift factor.
Sustainability 15 04815 g005aSustainability 15 04815 g005b
Figure 6. DMT results for HMA after moisture treatment at different ages: (a) semi-log scale; (b) log-log scale; (c) phase angle; (d) shift factor.
Sustainability 15 04815 g006
Figure 7. HMA fatigue strain amplitude: (left) by age and (right) by moisture damage after aging.
Sustainability 15 04815 g007
Figure 8. Cross-section of asphalt pavement.
Sustainability 15 04815 g008
Figure 9. Tensile strain with respect to the pavement thickness.
Sustainability 15 04815 g009
Figure 10. Tensile strain vs. elastic modulus.
Sustainability 15 04815 g010
Figure 11. Comparison of finite-element analysis and regression model results.
Sustainability 15 04815 g011
Figure 12. Comparison of the results of the Mechanistic-Empirical Pavement Design Guide and fatigue prediction model according to age and moisture damage after aging.
Sustainability 15 04815 g012
Table 1. Grading of aggregates for mix design.
TypeSieve Passing Weight Percentage (wt.%)
40 mm30 mm25 mm20 mm13 mm10 mm5 mm2.5 mm0.6 mm0.3 mm0.15 mm0.08 mm
Standard
gradation
Min.100100100907256352310532
Max.100100100100908065492819138
Combined gradation10010010099.983.466.843.731.318.213.89.75.6
Table 2. Marshall mix design results.
TypeOAC
(%)
Specimen
Density (g/cm3)
Theoretical Max.
Density (g/cm3)
VTM (%)VMA (%)VFA (%)
Standard---3–6≥1365–80
HMA5.12.4192.5204.015.9574.95
OAC: optimal asphalt content; VTM: voids in total mix; VMA: voids in mineral aggregate; VFA: voids filled with asphalt.
Table 3. CoreLok density measurement results.
SpecimenBag Weight
(g)
Dry Weight (g)Underwater Weight
(g)
Dry weight after Underwater Weight (g)Theoretical Maximum Density (g/cm3)Measured Density (g/cm3)Void
(%)
HMA (6%)27.52879.71700.12879.72.5222.4602.5
HMA (8%)27.42788.81647.72788.82.5222.4633.8
HMA (10%)27.62726.61568.92726.62.5222.3735.9
Table 4. Fatigue test results for different HMA ages and moisture damage after aging.
Specimen No.No.Peak-to-Peak Strain (με)Cycles at Failure
HMA SA17852,423
215120,423
32705975
HMA LA_117143,442
214815,373
32445269
HMA LA_217237,468
21529394
32584430
HMA LA_317028,487
212610,687
33042215
HMA SA_FT11516597
23721312
3--
HMA LA_1_FT18114,284
21356448
33071323
HMA LA_2_FT18311,437
21603483
33081016
HMA LA_3_FT1--
27710,530
32651016
SA: short-term aging; LA: long-term aging; FT: freeze-thaw.
Table 5. Coefficients of the fatigue cracking prediction model.
MixCoefficients
k1k2k3
HMA_SA3.71 × 1021.741.28
HMA_LA_14.89 × 1021.691.28
HMA_LA_24.62 × 1021.681.28
HMA_LA_32.05 × 1021.741.28
HMA_SA_FT7.04 × 101.801.28
HMA_LA1_FT6.03 × 101.801.28
HMA_LA2_FT3.39 × 101.851.28
HMA_LA3_FT1.89 × 101.901.28
Table 6. Thickness and elastic modulus of each pavement layer for the structural analysis.
CategoryThickness
(mm)
Aging|E*| (GPa)
Before Moisture TreatmentAfter Moisture Treatment
Asphalt (Hac)100
200
300
SA7.16.2
LA_17.97.1
LA_28.27.4
LA_39.78.9
Subbase (Hsb)200-275
Subgrade (Hsg)≥700-50
Table 7. Pearson’s product-moment correlation.
HacEacεt
Hac1.00
Eac0.001.00
εt−0.35−0.611.00
Table 8. Regression-analysis results for changes in pavement thickness and elastic modulus.
VariableParameter
Estimate
Standard
Error
Standardized
Estimate
t ValuePr > |t|Remarks
y -intercept666.942663.166800210.60441<0.0001R2 = 0.9961

Adjusted
R2 = 0.9958
H a c –63.272090.610401.0141 × 10−295–103.65545<0.0001
E a c –0.000323.79825 × 10−66.0683 × 10−265–86.47707<0.0001
H a c 2 1.984290.035122.8562 × 10−19556.48880<0.0001
E a c 2 7.50066 × 10−111.62857 × 10−126.095 × 10−16446.05684<0.0001
H a c E a c 1.00216 × 10−52.22261 × 10−78.6354 × 10−16145.08957<0.0001
Table 9. Number of allowable loads until fatigue cracking failure with respect to thickness and age.
CategoryHMA
AgingAging + FT
100 mmSA94502848
LA_175892485
LA_269142054
LA_347851610
200 mmSA31,8479578
LA_125,6258718
LA_223,3287636
LA_317,7416448
300 mmSA91,99728,504
LA_171,81726,078
LA_267,12923,383
LA_354,09920,977
Table 10. Basic input parameters of the Mechanistic-Empirical Pavement Design Guide (MEPDG).
CategoryDescription of Input
Traffic- AADTT (two-way): 1296
- AADT (two-way, Classes 1–3): 144
- Four lanes (round trip)
- Lane distribution factor: 0.5, Directional distribution factor: 0.9
- Vehicle design speed: 50 km/h
- Traffic volume increase: 0%
Sustainability 15 04815 i001
Climate- Mean annual temperature: 11.8 °C
- Mean annual precipitation: 1319.8 mm
- Freezing index: 115.1 °C-days
- Average annual number of freeze/thaw cycles: 99.9
Asphalt layer- Va = 7%, Vb = 4.4%, Vbe = 10.5%
- Creep: Level 3 (default value)
- Dynamic modulus: Level 1 (input test results)
Subbase &
Subgrade
- Subbase modulus: 275 MPa
- Subgrade modulus: 50 MPa
AADTT: Annual Average Daily Truck Traffic (Classes 4–13). AADT: Annual Average Daily Traffic.
Table 11. Degree of fatigue cracking damage due to age and moisture damage after aging (MEPDG vs. fatigue prediction model).
CategoryMEPDGFatigue Prediction Model
AgingAging + FTAgingAging + FT
SA1.000.431.000.30
LA10.950.350.800.27
LA20.820.350.740.23
LA30.600.30.560.20
Degree of damage = number of fatigue cracks due to aging and moisture damage/number of fatigue cracks in reference asphalt pavement.
Disclaimer/Publisher’s Note: The statements, opinions and data contained in all publications are solely those of the individual author(s) and contributor(s) and not of MDPI and/or the editor(s). MDPI and/or the editor(s) disclaim responsibility for any injury to people or property resulting from any ideas, methods, instructions or products referred to in the content.

