1. Introduction
In 2021, the Chinese government announced that it had eliminated absolute poverty after only eight years, thus providing valuable experience for developing countries. After poverty alleviation, the focus of poverty-stricken areas became how to consolidate the existing achievements, that is, how to achieve sustainable development under the risk of returning to poverty [
1,
2].
Paired assistance is an important measure of poverty alleviation. In offering economic, labor, capital, and technological assistance to poverty-stricken areas, developed regions can help them form the basis for local economic development, and thus alleviate poverty [
3,
4]. Under the paired assistance model, preventing a return to poverty is equally important. This means that we should not only pay attention to poverty alleviation in the affected regions, but also to their continued sustainable development. However, the bureaucracy involved in poverty alleviation has led to multiple unsuccessful attempts [
5,
6,
7]. According to the data, areas that have been lifted out of poverty can relapse into it, thus showing that poverty has not been fully alleviated. After poverty alleviation, many factors, such as insufficient endogenous motivation of the subject, a lack of resources, technology lags, etc., may lead to instability and poverty relapse [
8]. Therefore, the purpose of this paper is to investigate how to achieve lasting poverty alleviation, reduce the risk of poverty relapse, and ensure a smooth transition to sustainable development.
2. Literature Review
At present, improving the sustainable development capacity of poorer regions is one of the ways to achieve sustainable development [
9,
10,
11]. The concept of sustainable development first appeared in a report issued by the World Commission on Environment and Development in the late 1980s. In 1992, the United Nations Conference on Environment and Development (UNCED) introduced the concept of sustainable development into the action agenda and established a stable livelihood as the primary goal of poverty eradication. Most studies show that low income, individual self-development, national policy differences, and disadvantages in terms of the natural environment have created the vulnerability of poorer regions that affects their ability to access basic necessities [
12,
13,
14,
15]. Various strategies for the sustainable development of poverty-stricken areas have been proposed, focusing on finding solutions to the causes of vulnerability. For example, by building a long-term poverty alleviation system, improving social security [
16,
17], developing an industrial economy [
18,
19], and providing building services for poorer regions [
20,
21,
22].
With input from various resources, paired assistance can help poverty-stricken areas develop their economies and improve their sustainable development capacity. However, several studies see sustainable development in those regions as a process of both “institutions and the economy” [
23,
24]. From the economic perspective in the marketization of developing countries, paired assistance, mainly in the form of horizontal fiscal transfers and infrastructure investments, will have an important impact on the regional economic development index, industrial structure, and other economic factors in poverty-stricken areas [
25]. Public infrastructure investments in underdeveloped areas can improve production efficiency and social welfare, which, in turn, can improve labor productivity through economic agglomeration. In addition, financial aid can significantly promote regional economic growth and transformation of industrial structure to develop the economy and promote technological innovation [
26,
27,
28,
29]. However, the problem of temporary economic utility is not necessarily resolved by implementing paired assistance [
30,
31]. Due to the poor coordination between regions, the implementation of paired assistance seems arbitrary and ineffective. Transfer payments inhibit the financial efforts of poverty-stricken areas and do not reduce the differences between regions, but rather cause them to widen further [
32,
33]. Therefore, under the paired assistance model, sustainable development-focused research on poverty-stricken areas takes a wider perspective and focuses on the effects of education, institutional policies, intellectual property, and other factors on economic growth [
34,
35].
From a global perspective, there is a wealth of practice and experience in poverty eradication and alleviation in poor regions. Guided by the United Nations Sustainable Development Goals, sub-Saharan Africa has adopted several strategies to reduce poverty through job growth, health and energy privatization, community participation, and social enterprise partnerships with policy and financial support from international agencies, such as the Poverty Reduction Growth Fund, an arm of the International Monetary Facility (IMF) [
36,
37,
38]. Mainali et al. [
39] used a network analysis approach to examine synergistic pathways between the access to energy, sanitation, sustainable agriculture, and poverty reduction in sustainable development in South Asia and sub-Saharan Africa. You et al. [
40] proposed 17 sub-Saharan African (SSA) countries’ sustainable development approaches from the perspective of closing the technology gap through the systemic generalized method of moments (GMM). Liu and An [
41] conducted an econometric analysis of 44 developing countries and suggested that their premature deindustrialization is due to declining agricultural productivity, which is not conducive to poverty alleviation. Therefore, creating green and sustainable industries is important for overcoming poverty and promoting sustainable growth. Relying on external financial support or social enterprise intervention, the development of the tourism industry has been adopted to promote poverty alleviation in Romania, Ecuador, and Africa [
42,
43,
44]. However, this approach faces the same challenges as those in China. For example, in Nicaragua, after the small-scale intervention by external funding, the life expectancy of local businesses is short as they lack the skills to promote sustainable development, and are over-reliant on donors [
45].
In sum, the existing research focuses on the relationship between various elements in the paired assistance approach to poverty alleviation, that is, how to fully consider the role of individual factors in the development of regional economies. However, there are relatively few systematic and dynamic studies on sustainable development in regions where poverty has been alleviated by paired assistance. In terms of methodology, most studies have conducted quantitative or qualitative research by focusing on a specific economic factor or sustainability indicator for poverty eradication. There are relatively few systematic, comprehensive studies of a complete socioeconomic profile and predictive simulation studies for future sustainable development. Given the literature reviewed above, the research questions of this paper are: (1) Is there a risk of returning to poverty after the cessation of external funding in the regions assisted by the paired approach to poverty alleviation, and (2) how can those regions achieve sustainable development after poverty alleviation? To answer these questions and show the dynamic process of regional sustainable development after poverty alleviation, this study chose Lvchun County, a poverty-stricken border county in China’s Yunnan Province, as a sample, and the SD model as the analysis method.
3. Materials and Methods
3.1. Research Methods
In this paper, poverty alleviation and sustainable development of poverty-affected areas are regarded as dynamic processes [
46]. We use the SD model to conduct a dynamic and systematic simulation of poverty alleviation in Lvchun County, Yunnan Province, China. This method can integrate various factors in poverty alleviation into the estimation model, examine the change in poverty, and forecast the future. This work can provide a theoretical reference for modeling poverty alleviation and sustainable governance. In practical terms, it can shape the future of sustainable development and help consolidate the effects of poverty alleviation.
The SD model has several advantages over other analysis methods in addressing the problems studied in this paper. First, the SD model conducts an overall study of the research object. By analyzing the feedback mechanism of interaction among various factors in the system, it conducts long-term simulation and prediction analysis of the dynamic changes in events [
47,
48]. Second, the SD method determines the results of relevant influences through several variables and relationship parameters and has low sensitivity to the numerical values of different variables. The data quality does not significantly impact the simulation, and a trend change analysis can still be carried out with limited data [
49]. Therefore, the SD method is widely used in social development, for instance, in urbanization, urban land construction, and technology transfer [
50,
51,
52].
Following the general principles and methods of the SD analysis [
53], this paper constructs a causal relationship map of the development of poverty-stricken areas under paired assistance, then adjusts the model on the basis of the actual situation in the Lvchun County, and constructs the SD model through the definition of variables and parametric equations. Finally, we simulate and predict different scenarios of sustainable development in poor areas.
3.2. Sample Area Selection and Data Collection
The sample area selected in this paper is Lvchun County, Yunnan Province, China. Lvchun County is located on the southwest border of China. As of 2018, it had a total population of 246,700 distributed across 830 villages, and a rural population of approximately 80%. Before 2014, the incidence of poverty in Lvchun County was higher than 50%, which is typical of remote, rural regions, and thus a key area for poverty alleviation. In recent years, Shanghai, Chongqing, Shandong, and other provinces have carried out paired assistance approach. In 2019, the county’s poverty rate was below 3%.
Therefore, we chose Lvchun County as the sample area for two reasons. First, the poverty alleviation process is complete in Lvchun County. Thus, we can investigate the entire cycle, which reflects the actual situation in China. Second, Lvchun County is a rural county in a border area. This region is dominated by agricultural production, and its natural resources and industrial economy are underdeveloped. It has many typical characteristic vulnerabilities associated with poverty-stricken areas and, thus, is at a high risk of returning to poverty [
54].
Regarding the chosen study interval, the year 2014 was chosen because this is when the counterpart poverty alleviation in Lvchun County began, and because it is the year when China was charging ahead with the full-scale promotion and implementation of its poverty eradication program. The future year 2035 is of special nodal significance for China, and is the year when China aims to basically modernize its agriculture. According to the “Outline of the 14th Five-Year Plan of the National Economic and Social Development of the People’s Republic of China and Vision 2035” adopted at the fourth session of the 13th National People’s Congress, its clear requirement is the need to continue to promote the development of poverty-removal areas until 2035, focusing on promoting the sustainable development of special industries, and improving the monitoring and assistance mechanisms to prevent a return to poverty. To summarize, we have chosen the period 2014–2035 as the study interval.
The data used in this paper are derived from China’s Statistical Yearbook, the Statistical Bulletin of National Economic and Social Development, and the Government Work Report from 2014 to 2018 in Lvchun County. This is the official data regularly released by the government every year, including data on population, living, employment, industry, equipment, and capital.
3.3. Model Design
3.3.1. Subsystem Analysis
In the SD model, the behavior and results of the system are determined by internal factors, so defining the subsystem is the first step in constructing the paired assistance model [
48,
49]. The main form of paired assistance is funding inflows to poverty-stricken areas, which reduces the incidence of poverty. Three subsystems are involved in this process: economic subsystem, population subsystem, and social subsystem.
Economic subsystem. (1) The entry of external funding or resources will significantly promote economic growth, and increase the per capita income by transforming the industrial structure [
55,
56]. (2) Adjusting the industrial structure develops green and sustainable industries, eliminates high-pollution and energy-consuming industries, promotes the agglomeration of production factors in the region, and realizes the coordinated development of industries, and the full development of ecological resources [
57]. (3) Paired assistance affects fixed asset investment nationwide by adjusting the industrial structure, which improves the economic efficiency of poverty-stricken areas [
58,
59]. (4) The increase in economic output will gradually eliminate the dependence on external funding or resources, and form endogenous economic strength [
60]. At the same time, the increase in income in the poverty-stricken area will reduce the need for external funding, which means that paired assistance has achieved its goal of alleviating poverty in the target region.
Population subsystem. (1) In general, the incidence of poverty depends on the proportion of the poor population to the total population. The higher the population growth, the smaller the average poverty alleviation funding across the population, resulting in more difficulties in eliminating poverty. (2) In the short term, the outflow of labor from poverty-stricken areas will increase farmers’ income and reduce poverty. However, in the long run, labor outflow has an inverted U-shaped effect on economic development and poverty alleviation in poverty-stricken areas [
61]. That is, labor outflow will affect the input of labor resources for industrial development, affect the development of local economic industries, and thus, inhibit the sustainable growth of the regional economy.
Social subsystem. (1) The economic development of poverty-stricken areas needs to be reflected in individuals’ livelihoods. Individuals can share the fruits of economic development in poverty-stricken areas [
62], obtain a higher individual income, and improve their quality of life or living environment through consumption. This phenomenon is referred to as the individual development factor (IDF) in this article, expressed as the ratio of per capita income to per capita gross domestic product (GDP). The higher the IDF factor, the more GDP in poverty-stricken areas will be converted into per capita income, and the more poverty-stricken residents will be able to eliminate poverty. (2) Under the paired assistance model, we investigate whether the development of poverty-stricken areas is sustainable. We adopted GDP/FAI to express the contribution of FAI to the GDP of poverty-stricken areas, marked as GDP/FAI. This index focuses on whether the economic development of poverty-stricken areas causes damage to the environment. It reflects how many units of GDP growth can be increased per unit of FAI, and, if the indicator is high, it indicates that the growth of regional GDP depends on FAI. Although the increase in the amount of FAI will promote productivity and economic growth in poor regions, it does not sufficiently guarantee the non-destruction of the ecological environment. In terms of the connotation of sustainable development, the sustainable development of poor regions should rely on green industries and green resources [
63,
64]. Of course, this indicator is relative, and a relatively low GDP/FAI indicates that GDP growth tends to be environmentally friendly and vice versa. (3) The sustainable development of poverty-stricken areas is the result of both the economic and policy effects, and thus, we also consider the role of the government. Intervention in the market economy will affect the changes in the industrial structure, individual income, and poverty. Similarly, the government must provide resources and policy guarantees, reflecting the need for sustainable development coordinated at all levels.
3.3.2. Model Building
The SD model is constructed by specifying variables and their relationships in each subsystem, and linking the subsystem to the whole system through the relationships between variables. We constructed the SD model of sustainable development after poverty alleviation based on the parameters of the paired assistance method, which is based on the causal relationships that exist among the economic, demographic, and social subsystems of Lvchun County. In this model, by identifying and defining the variables of each subsystem, we can see that there is a strong correlation between the variables of the economic, demographic, and social subsystems, and this correlation forms a causal relationship between the subsystems. For example, population size in the demographic subsystem is related to the GDP per capita in the economic subsystem, which in turn is related to the individual development index in the social subsystem.
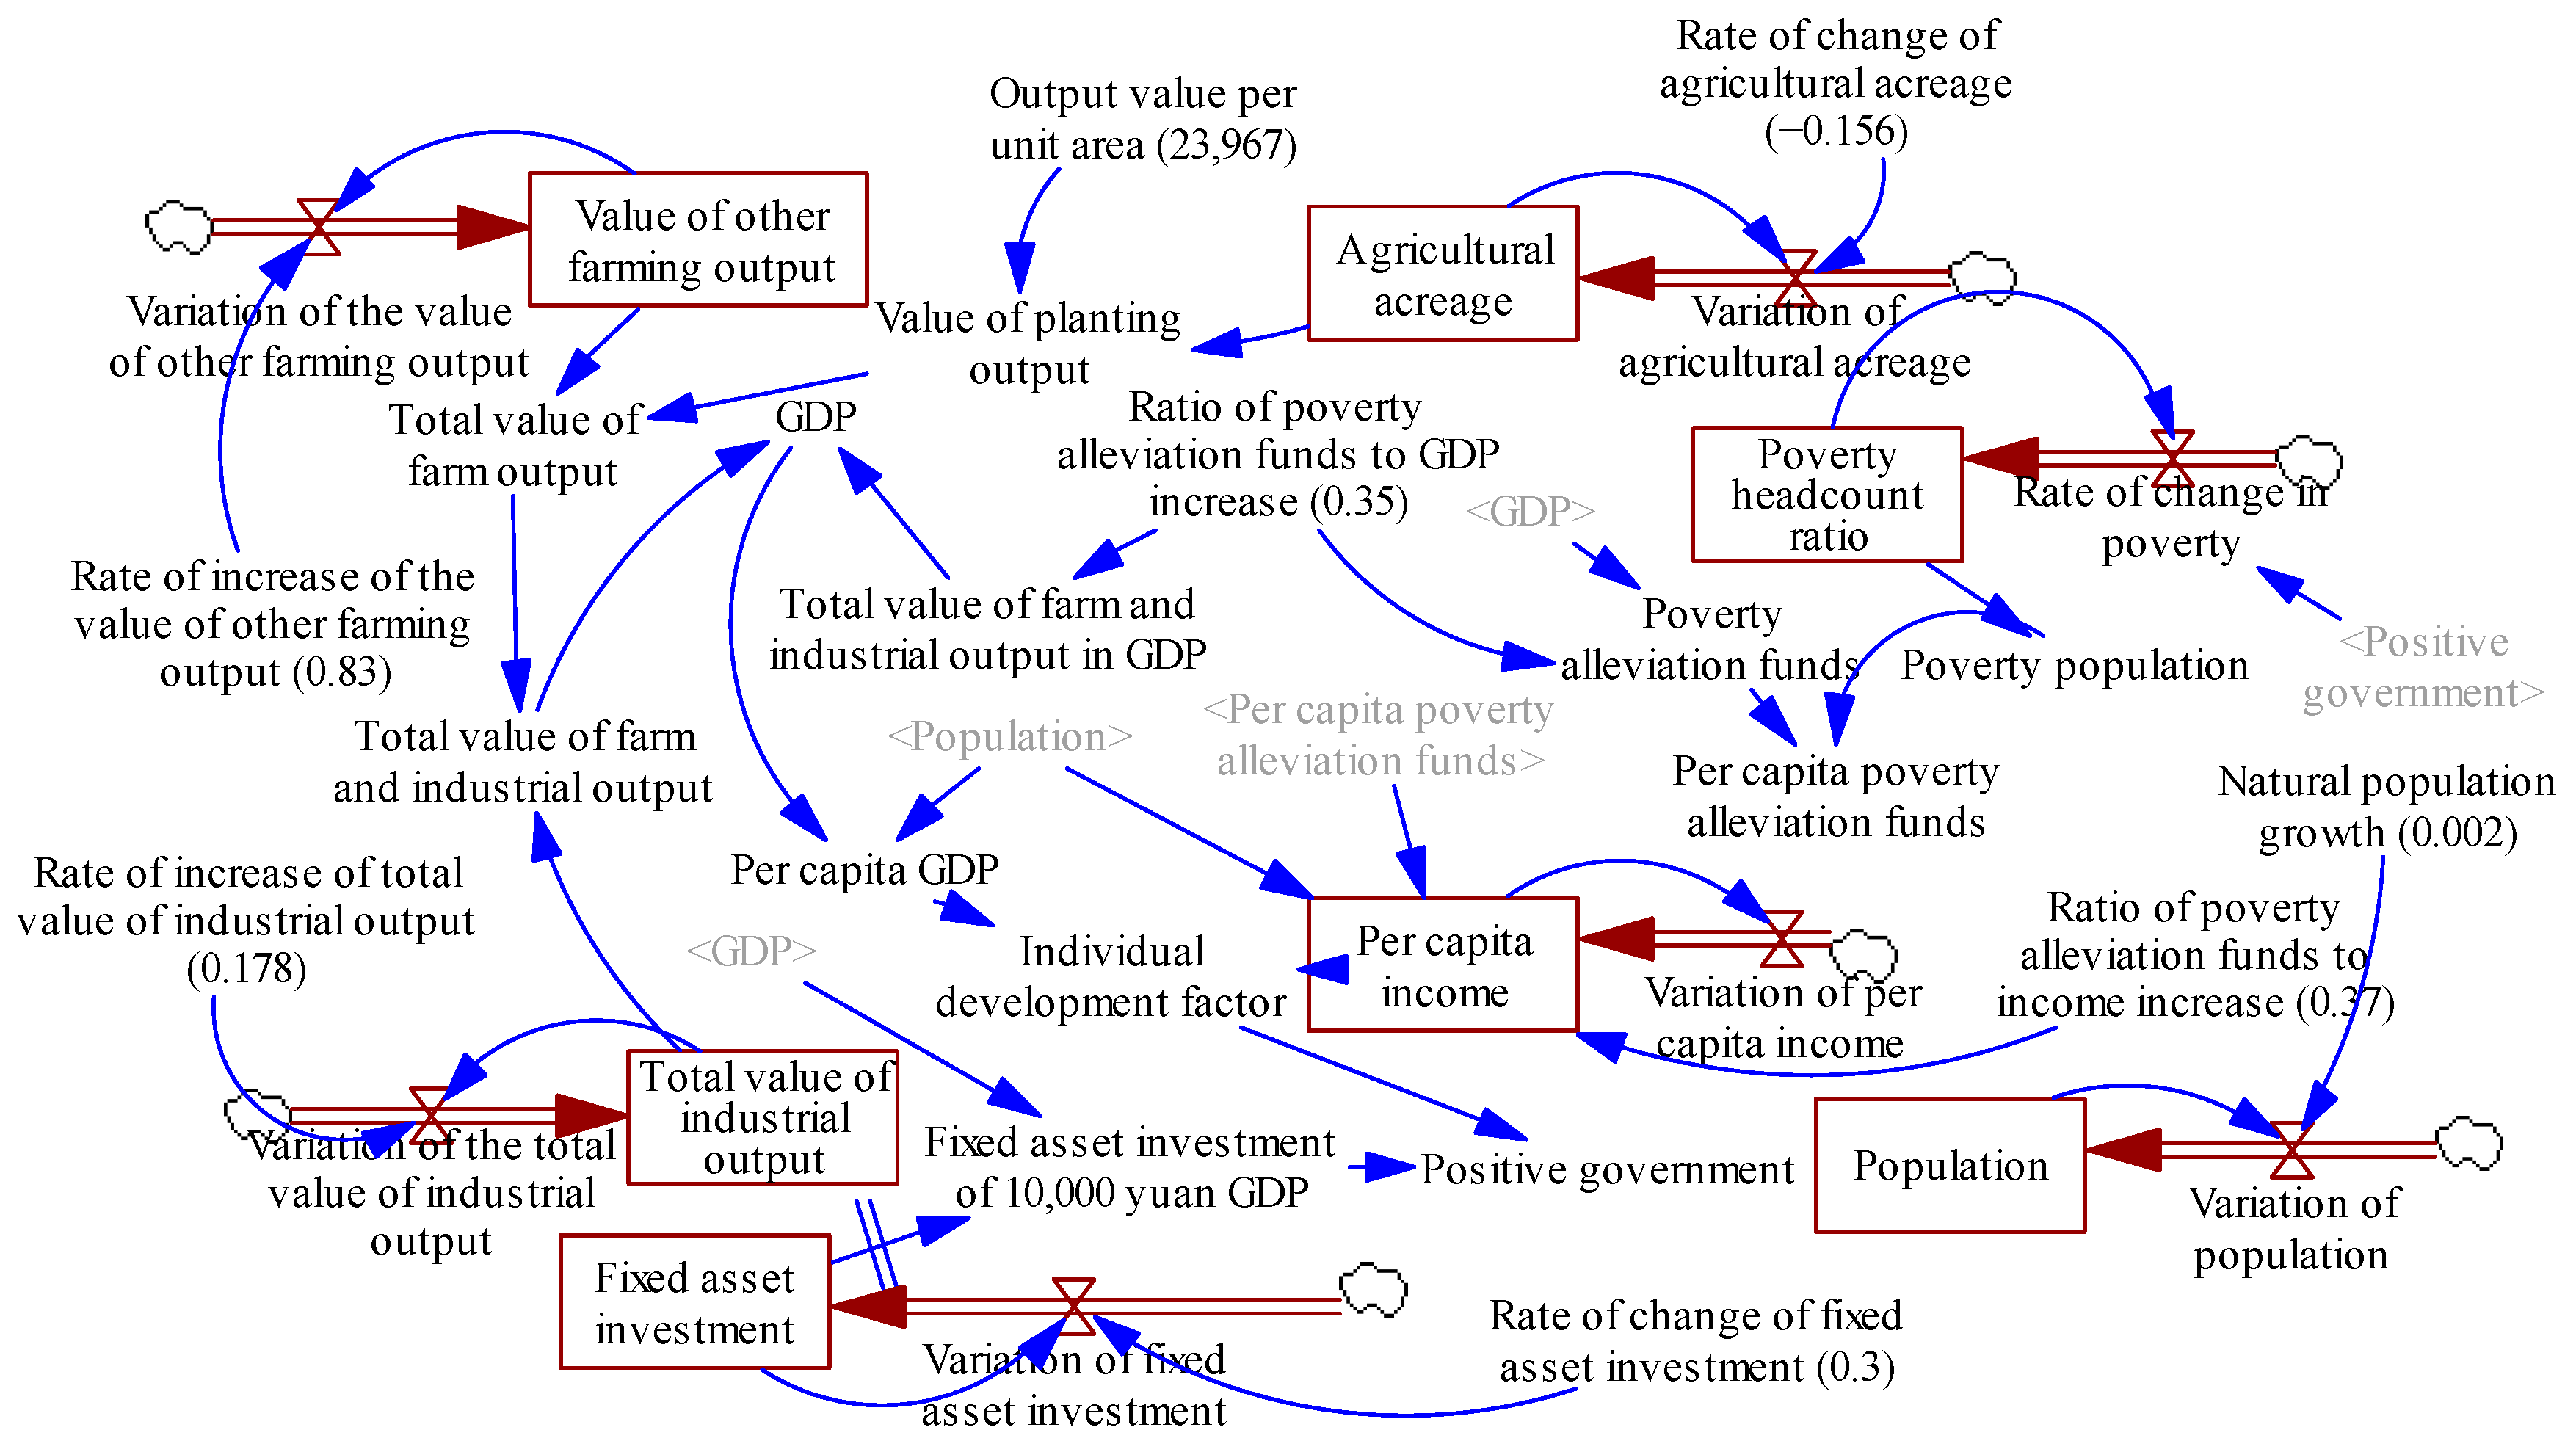
Specifically, the economy of Lvchun County is based on agriculture and industry. First, Lvchun County has rich agricultural resources, including grain cultivation and other types of agricultural output, such as forestry, animal husbandry, and fishery. Second, the outgoing labor force from Lvchun County is less than 10,000 workers per year. Since most of the labor force consists of farmers, and more than 90% of the county is rural, the outgoing labor force factor is excluded from the analysis. Third, the population of Lvchun County increased by about 30,000 people during 2014–2019, with an average annual population increase of 3750 people. The growth is slow, so only the natural growth rate is included, disregarding the birth and death rates. Finally, VENSIM software is used to construct the SD model (
Figure 1). The year 2014 was used as the base year of simulation, the TIME STEP was set to 1 year, the INITIAL TIME selected was 2014, and the FINAL TIME was 2035. The variables were defined by relevant research conclusions, arithmetic mean, development trend, or regression method (
Table 1). With these parameters, we conducted a simulation of the sustainable development of Lvchun County in 2020–2035 after poverty alleviation.
In
Figure 1, the single blue arrow indicates the relationship between two variables, and the direction of the arrow indicates the direction of the relationship. The red arrow in the double line indicates the rate variable, which means that the variable is the one with the amount of change. In
Table 1, INTEG is a common functional expression defined for the variables in the SD model and refers to the meaning of integration. It indicates the automatic accumulation or cumulative summation of the independent variables in parentheses.
3.3.3. Model Test
A structural test is conducted to judge whether the model accurately reflects the actual state by comparing the simulated values of key variables with historical data [
48,
53]. First, we chosen four variables, namely GDP, FAI, agricultural acreage, and per capita income. The main reason is that, on the one hand, all of these variables are rate variables and have an amount of change. On the other hand, all have real historical values that can be compared and tested with the simulated values in this paper. Afterwards, we tested the errors by comparing the errors between the historical and simulated values from 2014 to 2018. We found that the average errors between the historical and simulation values of the four variables were 0.028, 0.077, 0.1, and 0.023, respectively, and the average error rate was below 10% (
Table 2), indicating that the model fits well.
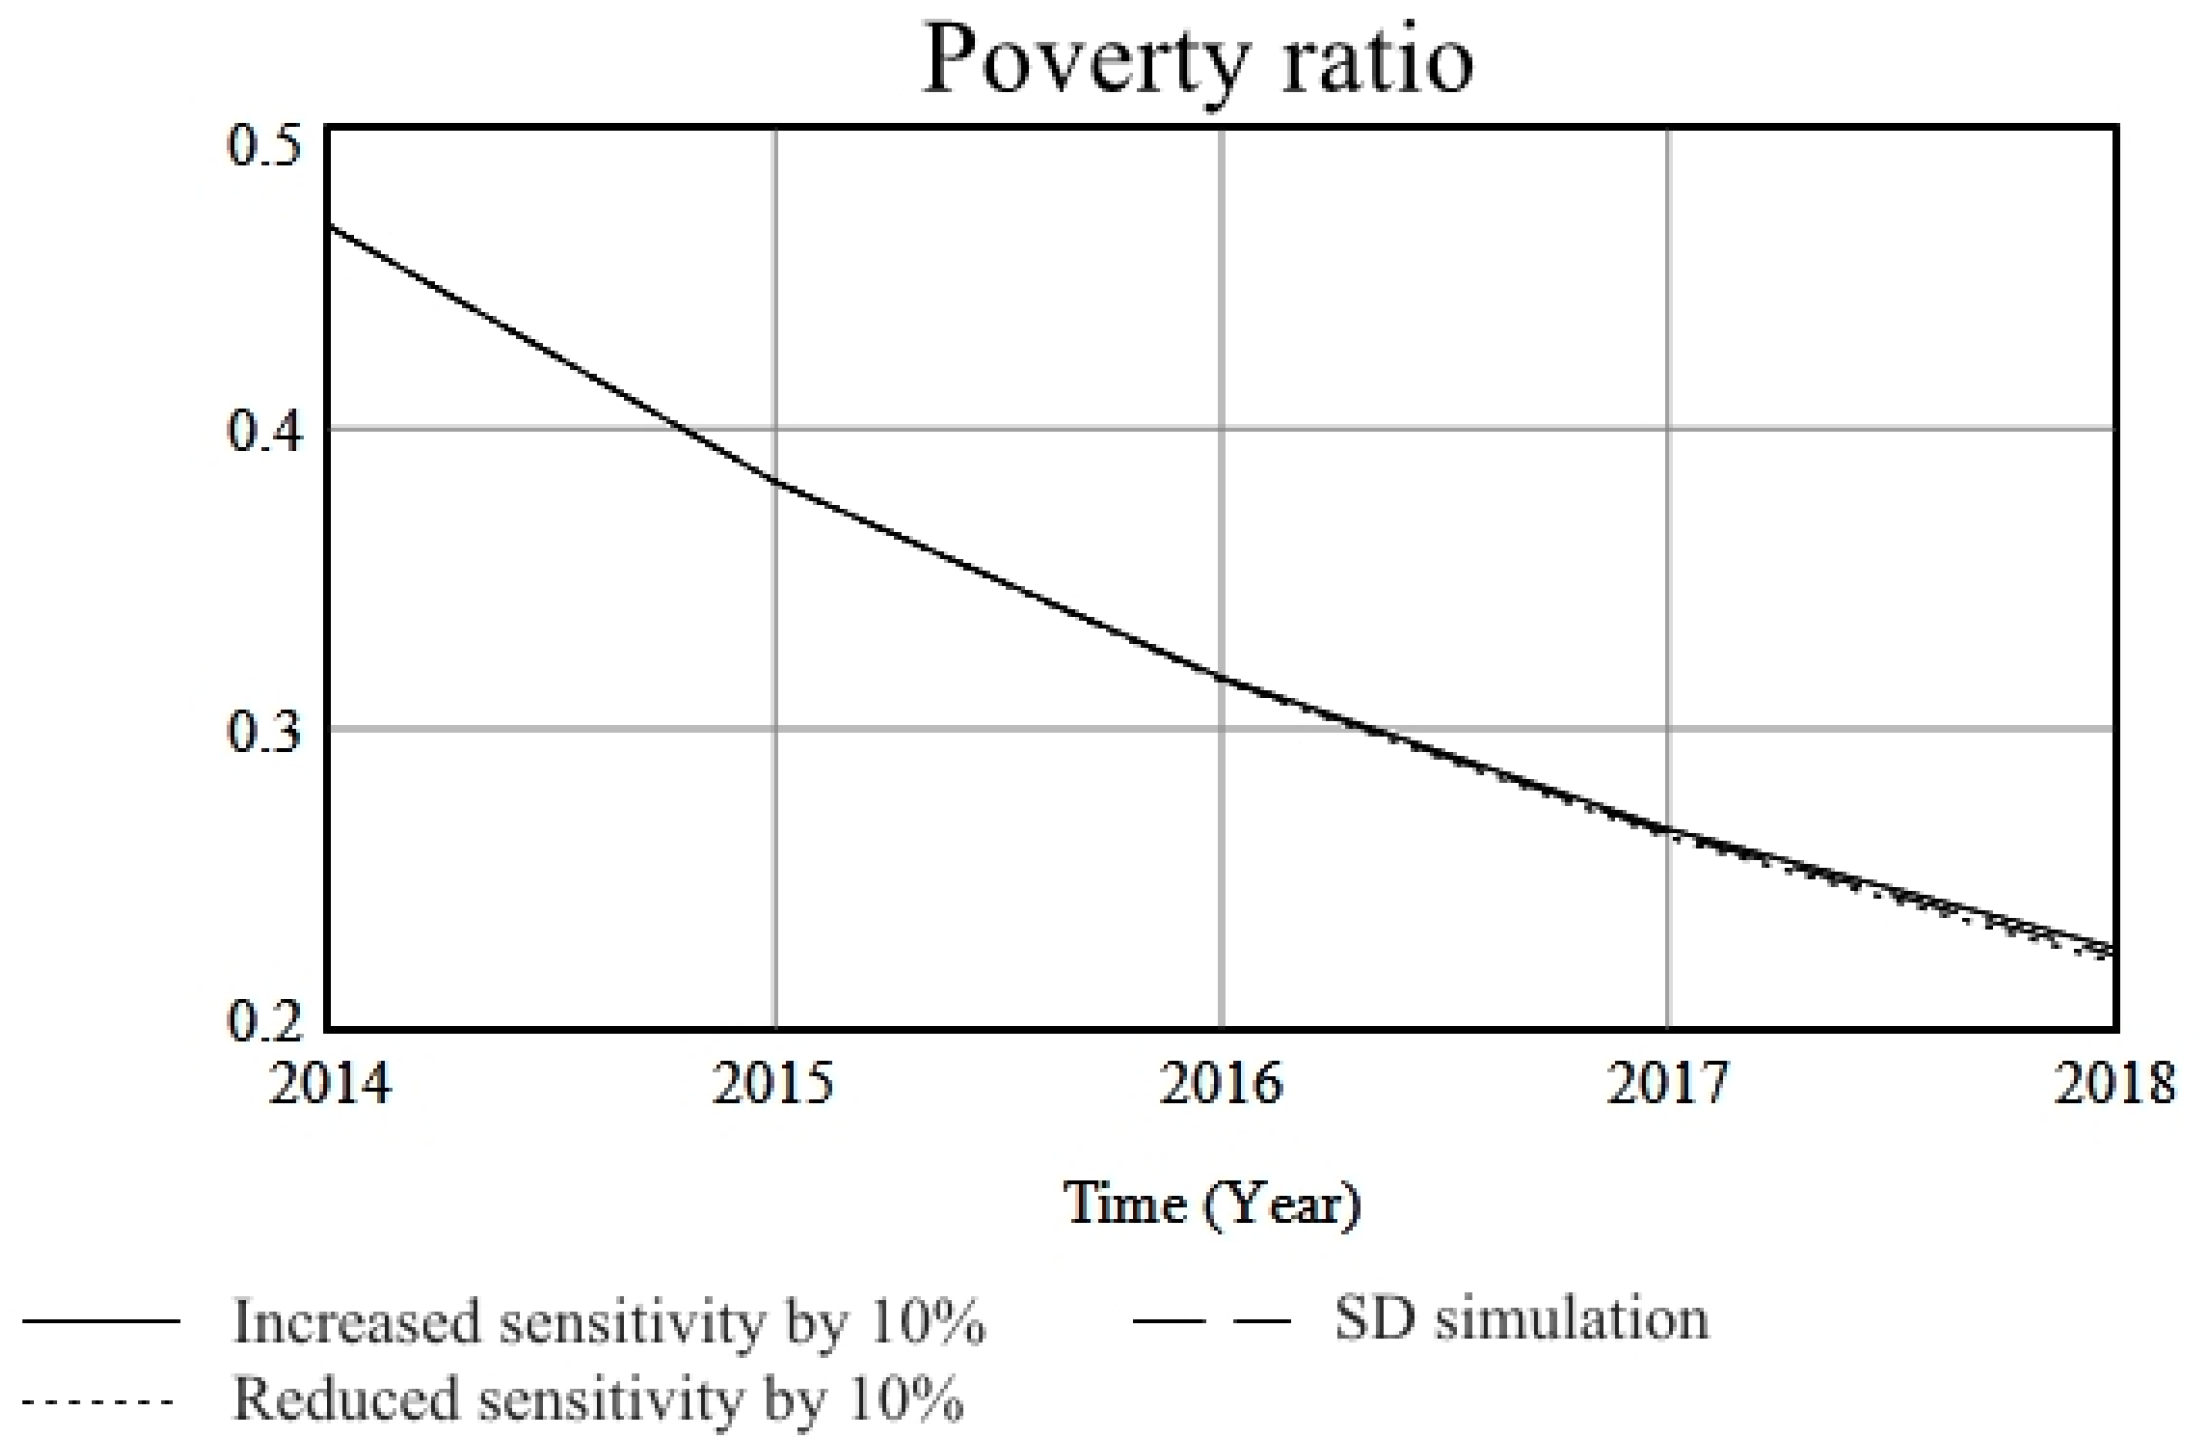
The sensitivity test is an assessment of confidence in the stability of the model. The commonly used structural analysis evaluates the reliability and accuracy of the SD model by increasing or decreasing the parameters of multiple variables by 10% per year [
48,
53]. A good model is insensitive to changes in variable parameters. We increase and decrease the parameters of the variables in the model (i.e., variations in the value of other farming output, the total value of industrial output, fixed asset investment, and per capita income) by 10% from 2014 to 2018 to investigate whether these adjustments will cause significant fluctuations in the incidence of poverty. If the fluctuations are large, the model sensitivity is poor, and the model is unstable. The results show that the error of poverty incidence in the SD model is within 0.01 when the model variable parameters are increased and decreased by 10%, indicating that changes in the variable parameters do not have a significant effect on the poverty incidence in the SD model, and its variation is minimal. As a result, the model has credibility and stability (
Figure 2).
Therefore, through the above structural and sensitivity tests, it can be seen that the SD model of Lvchun County under the paired assistance approach constructed in this paper has good stability and effectiveness, and can be used to simulate and predict the actual conditions.
4. Design of Simulation Scenarios
The SD simulation presented here is based on the following questions: What will happen to the economic development, industrial structure, individual income, and other factors in Lvchun County after the external funding for the alleviation of poverty provided by the paired assistance approach is reduced, discontinued, or the poverty alleviation tasks are completed? Will there be a return to poverty? By adjusting variable parameters in a multi-scenario simulation, we explore a suitable pathway for sustainable development of Lvchun County after poverty alleviation.
4.1. Simulation Situation 1: Poverty Alleviation Funding Suspended
After poverty alleviation in Lvchun County, the first questions to consider are whether there will be a return to poverty after the suspension of external funding, and whether the economic impact of external funding in Lvchun County is only temporary. Therefore, we set the model parameters for the scenario of poverty alleviation fund interruption in Lvchun County (Scenario 1) as follows: the variable of the contribution of external funding to GDP is set to 0, the INITIAL TIME is set to 2019, the agricultural acreage is set to 2.71, the value of other farming output is set to 103,849, the value of additional farming output is set to 194,500, the fixed asset investment is set to 724,300, the per capita income is set to 8532, and the population is set to 24.67. This simulation scenario is designed to study whether Lvchun County is stable coming out of the poverty alleviation phase, and whether it achieves sustainable development after the elimination of external alleviation funds.
4.2. Multi-Scenario Simulation of Different Development Models
Here, we examine another scenario in which Lvchun County’s poverty alleviation funding is not directly interrupted, but rather explored for sustainable development based on existing counterpart poverty alleviation measures. Thus, what is the sustainable development model for Lvchun County after it is lifted out of poverty? To answer this question, we designed a multi-scenario development model combining the two aspects for simulation and comparison.
We continue with the premise of the cessation of poverty alleviation funding, save Scenario 1 as the “natural development model”, and use it as the baseline model. Then, we design the “primary industry leading model”, “secondary industry leading model”, and “tertiary industry leading model” according to China’s National Economic Industry Classification (GB/T 4754-2011). These models focus on developing a single industry in Lvchun County to analyze whether a single industry could promote the sustainable development of Lvchun County after poverty alleviation. The above model design is based on the reality of Lvchun County’s long agricultural history and rich industrial base. Moreover, the tertiary industry of Lvchun County is mostly concentrated in the service industries of agriculture, forestry, animal husbandry, and non-fishery, whose economic benefits are not significant, but can be regarded as possible future industrial trends in Lvchun County.
In addition, the Chinese government has adopted rural revitalization policies and proposed the development of the integration of three industries, emphasizing the deep integration of agricultural production, agricultural product processing, agricultural product markets, and service industries [
16]. Accordingly, we designed the “integrated model of three industries”.
Under the paired assistance approach, such external funding will not be interrupted immediately following poverty alleviation, and a good cooperative relationship has been formed between the importing and exporting regions. Therefore, we consider the scenario where the continuous external funding is reduced so that the poverty-stricken areas gradually pursue their own economic development and reduce their dependence on external support. Thus, we designed this model as a “collaborative development model” of the sending and receiving areas (i.e., the supporting and poverty-stricken areas) under paired assistance approach.
Overall, we designed six models for the development of Lvchun County following poverty alleviation. Depending on each model, the parameters were adjusted for the variation in agricultural acreage, the value of other farming output, the total value of industrial output, the contribution of external funding to GDP, and fixed asset investment (
Table 3). We compared and analyzed the models’ simulations to assess the development of Lvchun County during the 15 years following poverty alleviation.
5. Simulation Results and Analysis
5.1. Poverty Alleviation Is Stable after the Interruption of Poverty Alleviation Funds
We performed the simulation analysis under the model design of Scenario 1. The results (
Figure 3) show no rebound in poverty incidence in Lvchun County after the suspension of external funding under paired assistance. This indicates that poverty alleviation in Lvchun County can be considered a long-term outcome. In addition, the Scenario 1 simulation results show that the incidence of poverty in Lvchun County in 2019 was below 3%, which is consistent with the actual poverty alleviation outcomes in Lvchun County.
5.2. Disruptions in Poverty Alleviation Funding Can Lead to a Failure to Achieve Sustainable Development
Furthermore, is the economy and society of Lvchun County in Scenario 1 sustainable after poverty alleviation? The simulation results of the main variables are not optimistic (
Figure 4). In particular, we note the following:
Under Scenario 1, the GDP of Lvchun County shows an extensive “boom” trend. However, this growth trend is extensive and does not meet the requirements of sustainable development. On the one hand, the total value of farm output includes the value of planting output based on traditional grain farming and the value of all other farming output. The traditional grain farming production tended to return to recovery, while the agricultural output in forestry, livestock and fishery declines, indicating that paired assistance measure to purchase or strongly support the development of the region’s special agriculture was abruptly suspended, which resulted in a decline in production and productivity in the region. The low yield of traditional agricultural production cannot support the rapid development of agriculture. On the other hand, in the industrial field, the contribution of fixed asset investment to GDP (GDP/FAI) was extremely high in Scenario 1, thus indicating that GDP growth depends on the economic benefits brought about by fixed asset investment, which also increases industrial input in the secondary and construction industries. The increase in industrial output will inevitably release pollutants and increase ecological pressure. In reality, the central economic pillar of Lvchun County comes from industrial investment and the production of cement and electricity, which is consistent with our research.
Combined with the above two aspects, after the suspension of external funding under paired assistance, the total value of the farm output of Lvchun County has shrunk, and the traditional agricultural industry has not rebounded. The development of local GDP relies excessively on industrial development, and more resources are devoted to industrial production, which makes the GDP of Lvchun County appear to have an extensive economic “boom”.
In Scenario 1, the economic development of Lvchun County did not promote social friendliness or increase individual income. On the one hand, although the contribution of fixed asset investment to GDP (GDP/FAI) of Lvchun County in Scenario 1 maintains a downward trend, its initial base is relatively high, about 5 times the SD simulation result, which means that the economic and social development of Lvchun County in this scenario is derived from environmentally friendly resource-saving initiatives. On the other hand, although the total GDP of Lvchun County develops rapidly in Scenario 1, the per capita income shrinks by nearly 20% compared with the SD simulation results, and this gap will gradually expand. The growth rate of per capita income lags far behind the total economic development of Lvchun County, which is evidence of an unbalanced phenomenon between residents’ income and financial distribution, and a “rich financially with poor people” social development pattern.
Through the simulation and analysis of Scenario 1, Lvchun County has achieved poverty alleviation under paired assistance. However, when the poverty alleviation funding is interrupted, the economic growth of Lvchun County does not promote social development or an increase in individual incomes, which is unsustainable. Such unsustainable patterns carry the risk of a return to poverty. Therefore, it is necessary to further explore sustainable development in Lvchun County after poverty alleviation.
5.3. The Coordinated Development Model Should Be the Path That Needs to Be Chosen for Sustainable Development after Poverty Eradication
In Scenario 1, the development of Lvchun County is unsustainable after the disruption of poverty alleviation funds, although there is no risk of returning to poverty. Thus, we further use the Scenario 1 simulation and comparison of six different development models to pursue the best-suited sustainable development path for Lvchun County following poverty eradication assistance.
Comparison and analysis of scenario simulations of the six models (
Figure 5):
With the exception of the natural development model, all other models achieved GDP growth. In particular, the total GDP growth of the second- and third-leading industry modes and their integration modes is about twice that of the other two modes. The reason for this phenomenon is the benefits of scale adjustment in developing a single industry. In comparison, although the total GDP produced by the primary industry leading mode and the collaborative development mode is small, it shows an overall upward trend and roughly similar movements.
Second, in the per capita income variable, the collaborative development model shows a significant increase, while the other models exhibit little difference in their magnitude of change. The possible reason for this finding is that collaborative development can carry out economic activities based on existing cooperation; it is compatible with the original industrial and population structures of Lvchun County, and thus can maintain the continuous rise of per capita income. Other models highlight the role of industry; however, because of the significant proportion of the population engaged in agriculture, technical personnel shortage, and other population deficiencies in Lvchun County, individuals are easily “crowded out” by economic activities and unable to enjoy the benefits of economic growth.
Third, we note that the collaborative development model has significant advantages for the individual development factor (IDF). Only the individual development factor of this model is higher than that of the other models. This indicates that individuals can obtain more benefits from regional economic development under the cooperative development model, which is a feature of “co-prosperity” between local governments and individuals.
Fourth, in the variable of fixed asset investment of GDP, all models are lower than the change in natural development. Among them, collaborative development and the secondary industry leading mode are in the lowest position, thus indicating that these two modes can achieve resource conservation and environmental protection.
Therefore, through the simulation and comparison of six models, we find that the collaborative development model is a sustainable development path after poverty alleviation in Lvchun County under paired assistance approach. Therefore, under this model, when can Lvchun County achieve sustainable development? From the perspective of the contribution of fixed asset investment to GDP, the change in this variable steadily decreases as the year 2035 approaches, thus indicating that the social development of Lvchun County is becoming increasingly more socially and environmentally friendly. From the perspective of the individual development factor (IDF), the trend in this variable is overall higher than in other models, but gradually levels out in 2030, thus indicating that the individual benefits from local economic development tend to be stable and fair. Through a comprehensive analysis of the local economy and personal income, it can be seen that Lvchun County will enter the stage of sustainable development in 2030 when it can consolidate the achievement of poverty alleviation and eliminate the risk of returning to poverty.
6. Conclusions and Discussion
6.1. Conclusions
Although the influx of funding and resources via paired assistance can help poverty-stricken areas, poverty alleviation should not only achieve GDP growth, but also promote social and environmental friendliness and increase individual incomes. By selecting Lvchun County to carry out an SD simulation, we affirm that paired assistance reduces the incidence of poverty, and propose that the suspension of external funding increases the risk of returning to poverty in poverty-stricken areas. We designed six different simulation models for analysis and comparison, and concluded that only the collaborative development model of the importing and exporting regions under the paired assistance approach could promote the sustainable development of poverty-stricken areas following external intervention. Unlike the industrial development strategy that simply emphasizes the development of local resources in poverty-stricken areas, collaborative development emphasizes continuous foundational cooperation with input from external elements to form the driving force of economic development in poverty-stricken areas. Therefore, their development strategy should be adjusted from “industrial aid” to “external assistance, endogenous industry clusters, and overall promotion.”
6.2. Discussion
In their study on poverty traps and sustainable rural development, Haider et al. [
65] noted that the current understanding and research on poverty lacks consideration of social and environmental factors, and the relationships between them, leading to ineffective interventions in poverty governance. This study systematically explores the relationship between the social, economic, and demographic system elements of sustainable development in areas emerging from poverty. Therefore, its results can provide new ideas for intervening in poverty and achieving sustainable development.
From the study results, the collaborative development model can secure the sustainable economic growth of poverty-stricken regions after poverty alleviation under paired assistance. This conclusion emphasizes two fundamental issues. First, the economic and social foundation formed by external funding and resources can form the foundation for the subsequent development of poverty-stricken areas after poverty alleviation. Second, the resource endowment of the poverty-stricken regions is itself the main economic growth factor for their continued sustainable development. These two bases can better codify China’s poverty alleviation experience as a reference for other developing countries that require poverty alleviation.
In terms of the social, economic, and demographic systems, achieving sustainable development in areas emerging from poverty requires strengthening efforts in all three of these areas. In the economic subsystem, poverty-stricken areas should develop characteristic resources and environmentally friendly pillar industries based on the resource advantages and infrastructure built through paired assistance. In poverty alleviation, distinct agricultural and advantageous industries, cultural tourism, and other tertiary industries are the main economic growth factors for developing poverty-stricken areas. These are well evidenced in rural poverty eradication practices in both Kenya and China [
60,
66]. However, the adoption of different industrial structures should be optimized and adjusted according to the resource endowment and infrastructure development of poverty-stricken areas. In addition, the successful development model of the industrial system is formed with the gradual improvement in the economic and social foundation; thus, industrial adjustment and development should not be blindly pursued without such foundations. The development of remote, poverty-stricken areas are mainly dependent on agriculture as infrastructure is lagging, and the development of the tertiary industry is not mature [
54]. Therefore, in future sustainable development, we should pay attention to developing characteristic agricultural industries under resource advantages to form capital accumulation and drive the growth of other industries. When the industrial capital is sufficient, and the external environment is mature, the industrial structure will be further optimized and updated. In the social subsystem, the poverty-stricken regions have to maintain a state of equality and continuous cooperation with the developed regions. Collaborative development transforms the aid relationship between the importing and exporting regions in paired assistance into the “enclave economy” mode of cooperation. As early as 2017, China’s National Development and Reform Commission issued the “Guiding Opinions on Supporting the Development of the Enclave Economy”. The enclave economy is based on the cooperative relationship between the importing and exporting regions under paired assistance, which forms the industrial and social bases for the further collaborative development of poverty-stricken areas. The enclave economy emphasizes resource exchange and industrial linkages between regions [
67,
68], and it mainly serves as a social innovation platform for poverty alleviation [
69] where social enterprises supporting and intervening in poverty alleviation can import a large amount of financial, human, and technological support to affected areas. A good sustained cooperation model can form a significant local force for sustainable development in poor regions [
70,
71]. From the demographic subsystem perspective, increasing the labor force participation rate is an important factor for poverty alleviation and sustainable development [
72,
73,
74]. Creating more employment opportunities and cultivating high-skilled talents through complementary efforts of poverty alleviation and social cooperation is a human resource guarantee for sustainable development in poor areas and an important human resource to seek sustainable development in special industries.
6.3. Limitations
Due to the choice of research methods, there are some limitations in our research. First, the SD model is not used to find the optimal solution, but to optimize the behavior of the system by analyzing information and relations in the real world. Their applicability cannot be guaranteed due to differences in the research objects and system structure designs. Second, the uncertainty of the external environment cannot be addressed, for example, the uncertainty of the policy environment cannot be reflected in the simulation. These issues need further attention in future research on sustainable development in poverty-stricken areas.


