1. Introduction
China’s economy has undergone tremendous changes, with great achievements: compared to 1978, the gross national product increased nearly 309 times and the rural poverty rate went from 97.5% to total poverty eradication by 2020. However, the environmental costs behind economic development are also huge, including, for example, uneven urban and rural development, unbalanced regional development, growing urban diseases, and other phenomena of poor-quality economic development. High-quality development refers to quality-oriented development and steady progress to better meet people’s diverse multi-level and multi-faceted needs. In this process, it is necessary to improve the economic development model and foster new industrial changes. High-quality development needs to change the high-consumption, high-pollution economic growth mode and rely on technological innovation and talent to achieve economic advantages. Meanwhile, the pursuit of high-quality development includes not only the present stage of economic development but also sustainable development. Therefore, it is clear that high-quality development in China is the most important task in the future, which points out the direction of economic transformation and has far-reaching significance.
For more than 40 years, demographic dividends and cheap labor have brought economic advantages. However, with the irreversible trend of globalization, competition between countries or regions is becoming a competition between human capital. As a carrier of knowledge and skills, human capital has a far-reaching influence on the economy and society. The number of educated people, especially those with higher education, is increasing year by year, but the huge population base leads to a relatively low share of advanced human capital. With the advent of the era of the knowledge economy, talent has become the key to promoting sustainable economic development and effectively promoting social and economic development [
1]. At present, the population dividend is gradually declining, and the proportion of elderly people is 26.3%, ranking first in the world. How to avoid the middle-income trap and achieve smooth functioning of the economy is an urgent problem to be solved. In addition, the intensification of competition for talent internationally and the increasing competition in talent policies at home and abroad reflect the importance of human capital in this context [
2]. It is essential to turn a demographic dividend into a demographic capital dividend to continue to advance high-quality economic development.
This paper focuses on how to scientifically measure high-quality economic development, whether there are correlations between regions, whether human capital contributes to high-quality economic development, and whether there is consistency among regions. To address these questions based on scientifically measuring the level of high-quality economic development, this paper probes into the relationship between human capital and high-quality economic development. This will help characterize the features of China’s regional economic development and grasp its development direction and have important practical significance for making full use of the efficiency of human capital in advancing China’s economy.
2. Review of the Literature
The essence of high-quality economic development is a new development concept. Its most fundamental embodiment is people-centered, its core is talent-driven, and its main feature is to achieve a better life for people. Strengthening the effect of human capital and increasing output efficiency is the key to high-quality development. Economic development has always been a hot topic that experts and scholars are interested in. At first, the research focused on the quantity of economic development and often ignored aspects related to the quality. The approach of simply pursuing economic speed was subsequently questioned, and more researchers are focusing on the quality of economic development. When economic quantities reach a definite scale, the original economic mode cannot satisfy the needs of long-term economic development [
3].
Since the concept was introduced, high-quality economic development has become an academic hotspot, as it is highly compatible with the new economic normal. Scholars have different definitions of quality development, and there is still no unified definition. High-quality development is a balance between short-term and long-term interests, and it features sustainability [
4]. Song believes that high-quality development can increase people’s quality of life and better satisfy their desire for a better life [
5]. Hong and Ma argue that in the initial stage, rising unemployment is inevitable, and technological progress is the cornerstone for achieving high-quality development [
6]. Development involves a unification between economic quantity and quality. Both are important supports for economic development. Only by promoting each other and developing together can we achieve high-quality economic development. Economic quantity can ensure healthy economic development and can effectively measure economic development [
7]. Economic quality can guarantee steady and sustainable economic development [
8].
The existing literature on the estimation of economic development is mainly concentrated on indicators and methods. In terms of measurement indicators, some scholars measure economic quality development based on a single indicator. Fan et al. used labor productivity to measure economic quality development [
9]. Other scholars have argued that economic quality involves multiple dimensions. For example, Robert analyzed the quality of economic development in terms of three dimensions: environment, income, and religion [
10]; Shi and Ren measured the development of economic quality from two aspects: fundamentals of economic growth and social outcomes [
11]; Qi used a combination of scale, performance, structure, and other indicators to study economic quality [
12]; Frolov et al. constructed a system to evaluate the quality of regional economic growth by merging average productivity, growth rate, and development index [
13]; and Ou et al. used the five major concepts of innovation, coordination, green economy, openness, and sharing to explain the meaning of high-quality economic development [
14].
In terms of evaluation methods, Qiao and Shi used the entropy method and data envelopment analysis to measure economic development [
15]; Shi used the DEA–Malmquist index and the HP filter methods to decompose the potential [
16]; Wang et al. used the entropy method [
17]; and Sha and Li used PCA [
18].
Regarding the relationship between human capital and economic development, economic development is affected by many factors [
19], but human capital is particularly prominent. The effect of human capital is cumulative [
20]; the higher the level of human capital, the better the technological innovation, enhancing comprehensive high-quality economic development [
21]. Especially against the background of an aging population, human capital shows spillover effects and accelerates innovation and research [
22]. Cai found that when the distribution structure of human capital is uneven, it is detrimental to economic development [
23]. At the same time, it is influenced by individual characteristics and regional factors, the flow of which has a profound influence on the regional economy. Qiu used the OLG model to analyze whether the human capital stock can promote high-quality economic development [
24]. Based on CFPS data, Pan used the fixed effect model to analyze the relationship between human capital changes and economic development. The research found that the accumulation of human capital in education can help promote economic growth [
25]. Wang et al. used provincial panel data from 2010 to 2018 to establish a panel threshold model; the analysis found that innovative human capital has a significant threshold effect on green economic transformation [
26].
To summarize, the academic research related to high-quality economic development is very rich, but there is no consensus on the definition of economic development quality. A small amount of research starts from a single index or qualitative index, and comprehensive index research seldom considers the new economic situation in China. Studies adopt a single method, such as principal component or entropy weight, although this can only partially reflect subjective or objective index weights. However, the subjective weighting method is greatly influenced by external factors and lacks objectivity. Previous studies on the relationship between human capital and economic development mostly focused on the direct effect and a static framework; non-linear research usually took human capital as the threshold variable and studied the impact of the same level of human capital and economic development in stages but neglected the impact of human capital and different levels of economic development. At the same time, due to the influence of talent plunder, the siphon effect, and other factors, local economic development will be affected by the economy of neighboring regions, and the existing research rarely considers the spatial factor. Therefore, based on the comprehensive evaluation index system of China’s economic quality development, this paper uses the genetic algorithm–projection pursuit model to study the dynamic data of the economic quality development index from 2007 to 2020, which intuitively presents the spatial distribution variability of China’s economic development. On this basis, we built a spatial quantile regression model of human capital, spatial spillover, and high-quality economic development, which reveals the internal mechanism of the influence of human capital on high-quality economic development and puts forward corresponding countermeasures and suggestions.
3. Analysis of Theoretical Mechanisms
Human capital is the opposite of physical capital and is distinct from ordinary labor resources; it enables access to a wealth of knowledge and skills that can be accumulated over time. The development concepts of innovation, harmonization, green economy, openness, and sharing point out the direction for high-quality economic development, which cannot be separated from the strong support of human capital. The effect of human resources on economic development is mainly realized through the following five dimensions.
The first dimension is innovation. Differences in human resources are at the root of differences in regional innovation levels. The effect of human capital on regional innovation can be divided into innovation-driven effects and innovation-output effects [
27]. The advantage of human capital is that it can effectively contribute to the innovation process by tapping into a large amount of professional knowledge and skills through repeated internal and external trial and error. It can also scientifically grasp the orientation of innovation and constantly improve the efficiency of research and development [
28]. Specifically, human capital affects and promotes regional innovation by upgrading its structure and agglomeration. Human resources are divided into three levels: high, medium, and low. Based on the externality of human capital, the higher the level, the stronger the ability to change ideas and learn new things. Conflicts between ideas are more conducive to stimulating potentially innovative R&D and promoting the output of science and technology. In addition, the aggregation of human capital shortens physical distances and reduces information costs [
29]. This makes resource sharing more convenient and the allocation of innovation resources more efficient, thus effectively enhancing regional innovation capability.
Second is sharing. Sharing is a new economic mode that can achieve the best allocation of resources and more effective social governance. Although it disrupts traditional industry rules, in essence, it is a socioeconomic ecosystem that can achieve the matching of supply and demand at economies of scale. Therefore, human capital remains one of the key elements of the sharing economy. According to the theory of human capital, it has the properties of capital, and it creates value by integrating production factors such as land and labor. The owners of human capital have the right to share and distribute profits, thus realizing the benefit of sharing [
30].
Third is the green economy. Human capital is a reflection of the quality of the workforce and is the driving force behind green technology. Human capital affects the green economy by changing green production and consumption. On the one hand, green and clean energy are derived from the concept of sustainable development. Clean technology and environmental protection technology are developed based on human capital [
31]. Low-carbon initiatives provide technical support for the development of a green economy, leading the way in low consumption, low emissions, and low pollution, reducing environmental damage and pollution caused by production. At the same time, the green technology revolution brought about by human capital has improved production efficiency, reduced energy consumption for finished products, and created conditions for developing a green economy. In addition, human capital has a knowledge spillover effect. The widespread dissemination of ecological knowledge and the mass application of ecological skills transform consumption attitudes [
32]. Green consumption can be strongly promoted to win support among the people, so the market share of green and low-carbon products will be greatly increased, and then the green economy can be developed.
Fourth is the open economy. The specialization of human capital can not only improve labor efficiency but also rationally allocate resource elements and improve the technical content of products. High-value-added products meet the higher demands of consumers and are more easily recognized by consumers at home and abroad. The stronger the competitiveness among products, the better the export trade. The closer the connection between trade and the external economy, the deeper the integration of logistics, commerce, and industry, thus forming an open economy.
Fifth is the coordinated economy. According to neoclassical growth theory, controlling the endowment of human capital can lead to a certain amount of convergence in the economic development of various countries. If elements such as human capital endowments are consistent across countries or regions, their economic growth rates tend to converge [
33]. Conversely, a scarcity of human capital endowments is not conducive to regional economic convergence and will be detrimental to regional economies. Therefore, optimizing the structure of human capital can promote economic coordination [
34].
Based on the above analysis, the following assumption is put forward: human capital promotes high-quality economic development.
4. Measurement of High-Quality Development of the Regional Economy
4.1. The Logic of Measurement
A high-quality economy considers the needs of the present and future, material and spiritual life, economy and ecology, regional differences, and the sharing economy. In 2018, the Central Economic Work Conference created a blueprint for high-quality economic development arranged around eight key tasks, such as ecological civilization construction, and elaborated the working ideas of the system and the mechanism of high-quality economic development in China. Subsequently, considering the problems existing in China’s economic construction and according to the guiding spirit of the 19th National Congress report on high-quality economic development, the five aspects of innovation, green economy, openness, coordination, and sharing were summarized as the logical main lines. Specifically, they are described as follows.
Innovation: Innovation is the whole point of strengthening the core competitiveness of the economy in the new era and maintaining comprehensive global competitive technological advantages. Hua and Hu argue that there is a significant correlation between innovation and high economic quality [
35]. With limited human resources, the original demographic dividend cannot adapt to economic growth. It is necessary to improve the level of human resource elements and make full use of the innovation vitality of economic development. First, continuous innovation will improve the productivity of enterprises, reduce their production and operating costs, and enhance their competitiveness. Second, innovation can produce efficient products, which will help change people’s lives and promote their high-level consumption. Finally, good innovation management can help perfect the market economy system and accelerate steady economic development.
Green economy: Ecology is the basic condition for rural residents’ survival and development, and it is also the foundation for economic development. At the beginning of the reform and opening, the traditional development pattern, which is detrimental to the environment, urgently needs to be reconsidered. The combination of high investment, energy consumption, and pollution does not align with the goals of sustainable development. Therefore, the green economy model is the correct way to create ecological livability, industrial prosperity, and rich life. Taking the laws of nature and ecology as the criteria, we should raise residents’ awareness of ecological environmental protection, decrease the discharge of pollutants, and boost the greening of industrial links, thus ensuring the harmonious development of the population and nature and improving the sustainability of high-quality economic development.
Openness: Opening to the world is a major reason for China’s rapid economic development. In particular, entering the WTO has made the world know China again, and its products and services have gone global. First of all, foreign capital has been introduced as a result of opening up. Foreign investment plays a major role in China’s economy, and it makes up for the shortage of corporate capital. Second, opening to the outside world has brought advanced technology and equipment, and the development of technical exchanges will help strengthen the knowledge base of China’s technology. Finally, opening up will help Chinese enterprises go global and narrow the gap with enterprises around the world.
Coordination: The ultimate goal of socialism is to realize common prosperity and eliminate polarization. Under the correct leadership of the party, precise poverty alleviation work has been carried out in an all-around way and has been promoted in an orderly manner, and the numbers of poverty-stricken counties and poor people have gradually decreased. It is worth noting that due to historical and regional factors, economic development between regions is very different, and the development between provinces, provincial capitals, prefecture-level cities, and urban and rural areas of cities is not harmonious. Moreover, this difference is increasing, which is unfavorable for building a harmonious society. In the new situation, importance must be given to the notion of coordinated development to achieve regional integration and balanced development.
Sharing: Shared development is an essential requirement of society and puts people-centered thinking into practice. The sharing economy can achieve an accurate match between supply and demand by gathering and matching scattered funds and idle resources. First of all, resource sharing is supported by the idea of making full use of resources to absorb excess capacity. Second, under the concept of a sharing economy, innovation can develop quickly. By relying on the Internet, innovative business models and consumption methods have been introduced. Finally, public and social resources, such as education, medical care, and sanitation facilities, are heavily biased toward cities. This has led to the aggravation of social problems such as high housing prices, uneven distribution of medical resources, and urban diseases. Sharing high-quality resources with rural and backward areas will help solve problems in areas such as schools and hospitals.
4.2. Measurement System
Based on the logic of measuring regional economic quality development and taking into account the stability, comprehensiveness, and data availability of indicators, an evaluation system of regional economic quality development indicators was constructed, which was divided into 40 indicators in five aspects: innovation, green economy, opening, coordination, and sharing (
Table 1).
Innovation: The efficiency, innovation inputs, human and financial support, and innovation outputs of economic development were reviewed. Specifically, efficiency is measured by labor productivity and capital productivity; innovation investment is measured by innovation funds and investment of innovative personnel; human and financial support is measured by the proportion of people with senior professional titles and government support for science and technology; and innovation output is measured by the proportion of patents authorized, patent applications, and turnover of the technology market.
Green economy: The four dimensions of resource consumption, environmental pollution, green wealth, and environmental protection were considered. Specifically, resource consumption is measured in terms of energy consumption and electricity consumption per unit of GDP; environmental pollution is measured in terms of industrial wastewater emissions, industrial waste gas emissions, and industrial solid waste per unit of GDP; green wealth is measured by park green space, forest coverage, green space, and afforestation; and environmental protection is measured by the investment in environmental pollution control, urban sewage treatment capacity, industrial solid waste treatment, and harmless domestic waste treatment.
Openness: Two aspects were considered, the opening of foreign trade and the opening of foreign investment. Specifically, the openness of foreign trade is estimated by import and export trade, and the degree of openness of foreign investment is estimated by the amount of foreign direct investment and the number of foreign-invested enterprises.
Coordination: Four dimensions were considered: structural optimization, urban–rural coordination, regional disparities, and economic fluctuations. Specifically, structural optimization is measured by the rationalization and advancement of industrial structure; urban–rural coordination is measured by the gap between urban and rural residents’ income and urban–rural consumption levels; regional disparities are measured by economic shares; and economic fluctuations are measured by the urban unemployment rate, consumer prices, and ex-factory prices of industrial producers.
Sharing: Three dimensions were considered: aspirations for a better life, the density of social resources, and livelihood security. Specifically, the proportion of expenditure on education and health care is used to measure aspiration for a better life; road mileage, railway mileage, and the number of beds in health care institutions are used to measure the density of social resources; and the amount of urban workers’ basic pension insurance and the income and expenditure of urban workers’ funds are used to measure livelihood security.
4.3. Measurement Methods and Data Sources
4.3.1. Measurement Methods
The projection pursuit model has been widely applied in many areas. By using it, we can discover the structural features of high-dimensional data by projecting the data into a low-dimensional space. The model has high prediction accuracy, but it needs to obtain objective weights. Genetic algorithms are better able to derive optimizations for optimization problems than traditional optimization-seeking algorithms. Using a genetic algorithm to optimize the projection tracking model can overcome the shortcomings of both [
36]. In this paper, an accelerated genetic algorithm based on real number coding is built by using binary code [
37]. The advantages are simple encoding and decoding, high precision operators, etc., and the disadvantages of premature convergence and slow optimization speed are overcome. The specific process is as follows:
(1) Data standardization. The maximum and minimum normalization method is used to standardize the data;
(2) Establish the projection index function. Calculate the value of (a) according to the following formula;
In Equation (1),
a (·) is the unit length vector,
is the
jth evaluation factor of the
ith evaluation index,
is a one-dimensional projection value, n is the number of samples, and p is the number of evaluation index factors.
In Equation (2),
is the local density projected to and
is the standard deviation of the data.
In Equation (3),
R is the window radius of local density,
represents the distance between samples, and
is the unit step function.
In Equation (4), is the average value of the series .
(3) Optimize the projection index function. The best projection direction can solve the problem of the maximum value of the projection exponential function;
In Equation (5), is the calculated best projection value, and the weighted square sum of each projection value is 1.
(4) Priority arrangement. The projection values of each sample are calculated according to step (3), and the ranking of the projection values can be obtained after sorting.
4.3.2. Data Sources
Based on the availability and completeness of data, 30 provinces in China were used for the study. The research years were 2007 to 2020, and the data came from the Statistical Yearbook and other provincial yearbooks.
4.4. Results of Economic Quality Development Measurement
4.4.1. Measurement Results
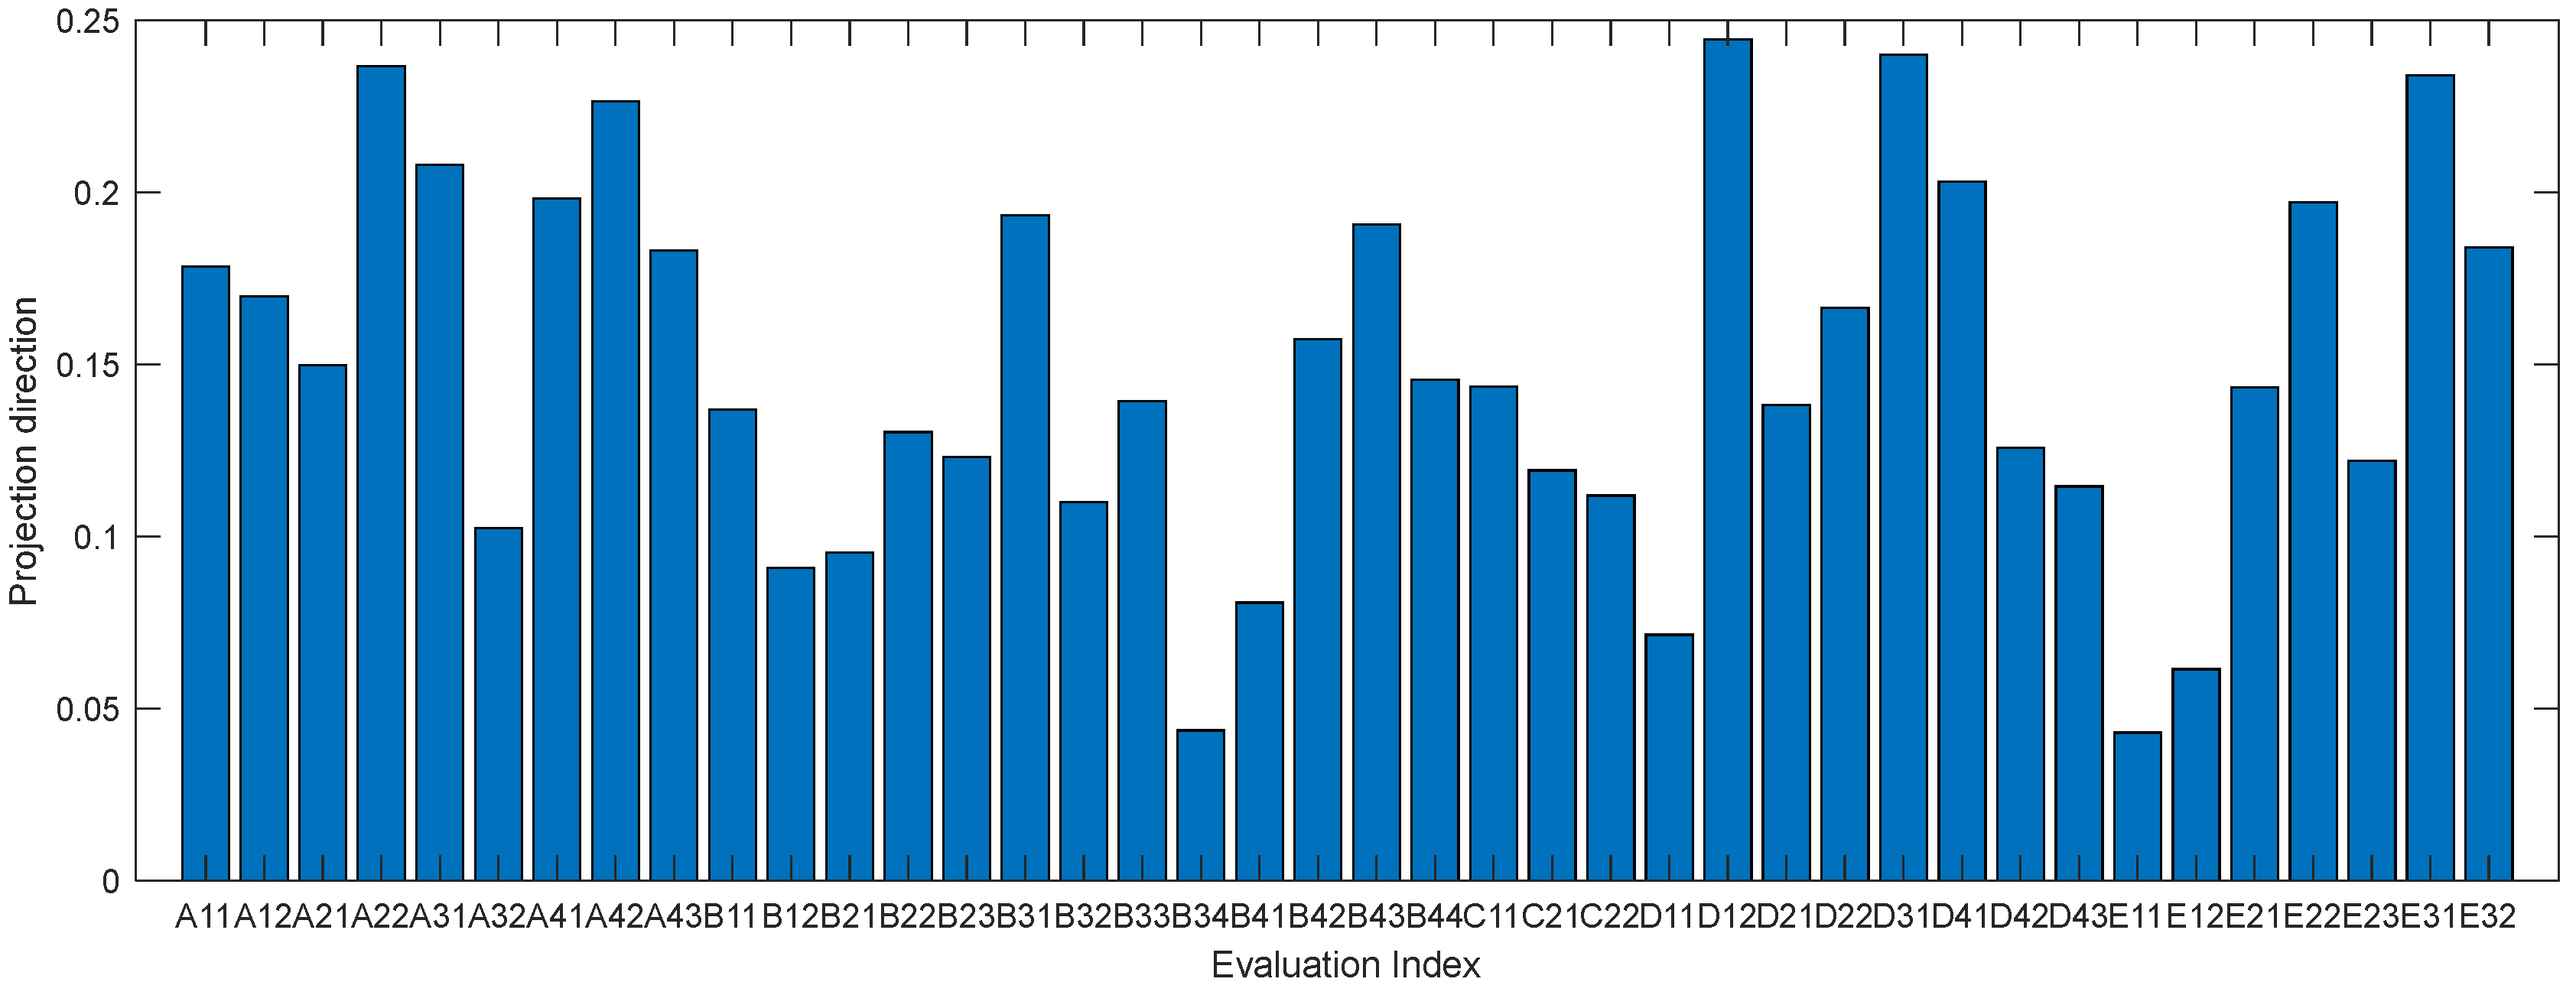
The collected data will be solved by the Real coding-based Accelerating Genetic Algorithm. Based on the above formula, The population size is set to 420; the number of excellent individuals is set to 20; and the acceleration times are 10, crossover probability Pc = 0.8, and mutation rate pc = 0.2. MATLAB 2020b was used to process the crossover probability Pc = 0.8 to obtain the best projection direction, and the individual projection directions were ranked (
Figure 1), which shows the impact of different evaluation indicators on high-quality economic development. The larger the forecast, the more important it is. From
Figure 1, it can be found that advanced industrial structure, economic share, investment of innovative personnel, number of old-age insurance participants, and patent applications rank as the top five, indicating that these indicators are the main factors affecting the development of regional economic quality in China.
Using the optimal projection direction as the optimization variable, the total index of economic quality development of 30 provinces from 2007 to 2020 was obtained, and the results are shown in
Table 2. The average value of China’s regional economic quality development rose from 1.6403 in 2007 to 2.5587 in 2020, showing an overall trend of year-on-year growth; vertically, Beijing and Shanghai ranked as the top two, with mean composite scores of 3.8395, 3.3696, 2.8727, 2.8599, and 2.7741, respectively. Between them, Beijing is the superior province. In terms of growth rate, Guizhou, Ningxia, Gansu, Anhui, and Shaanxi are the top five; Shandong, Tianjin, Beijing, Hainan, and Guangdong are slow in innovation growth.
4.4.2. Spatial Distribution
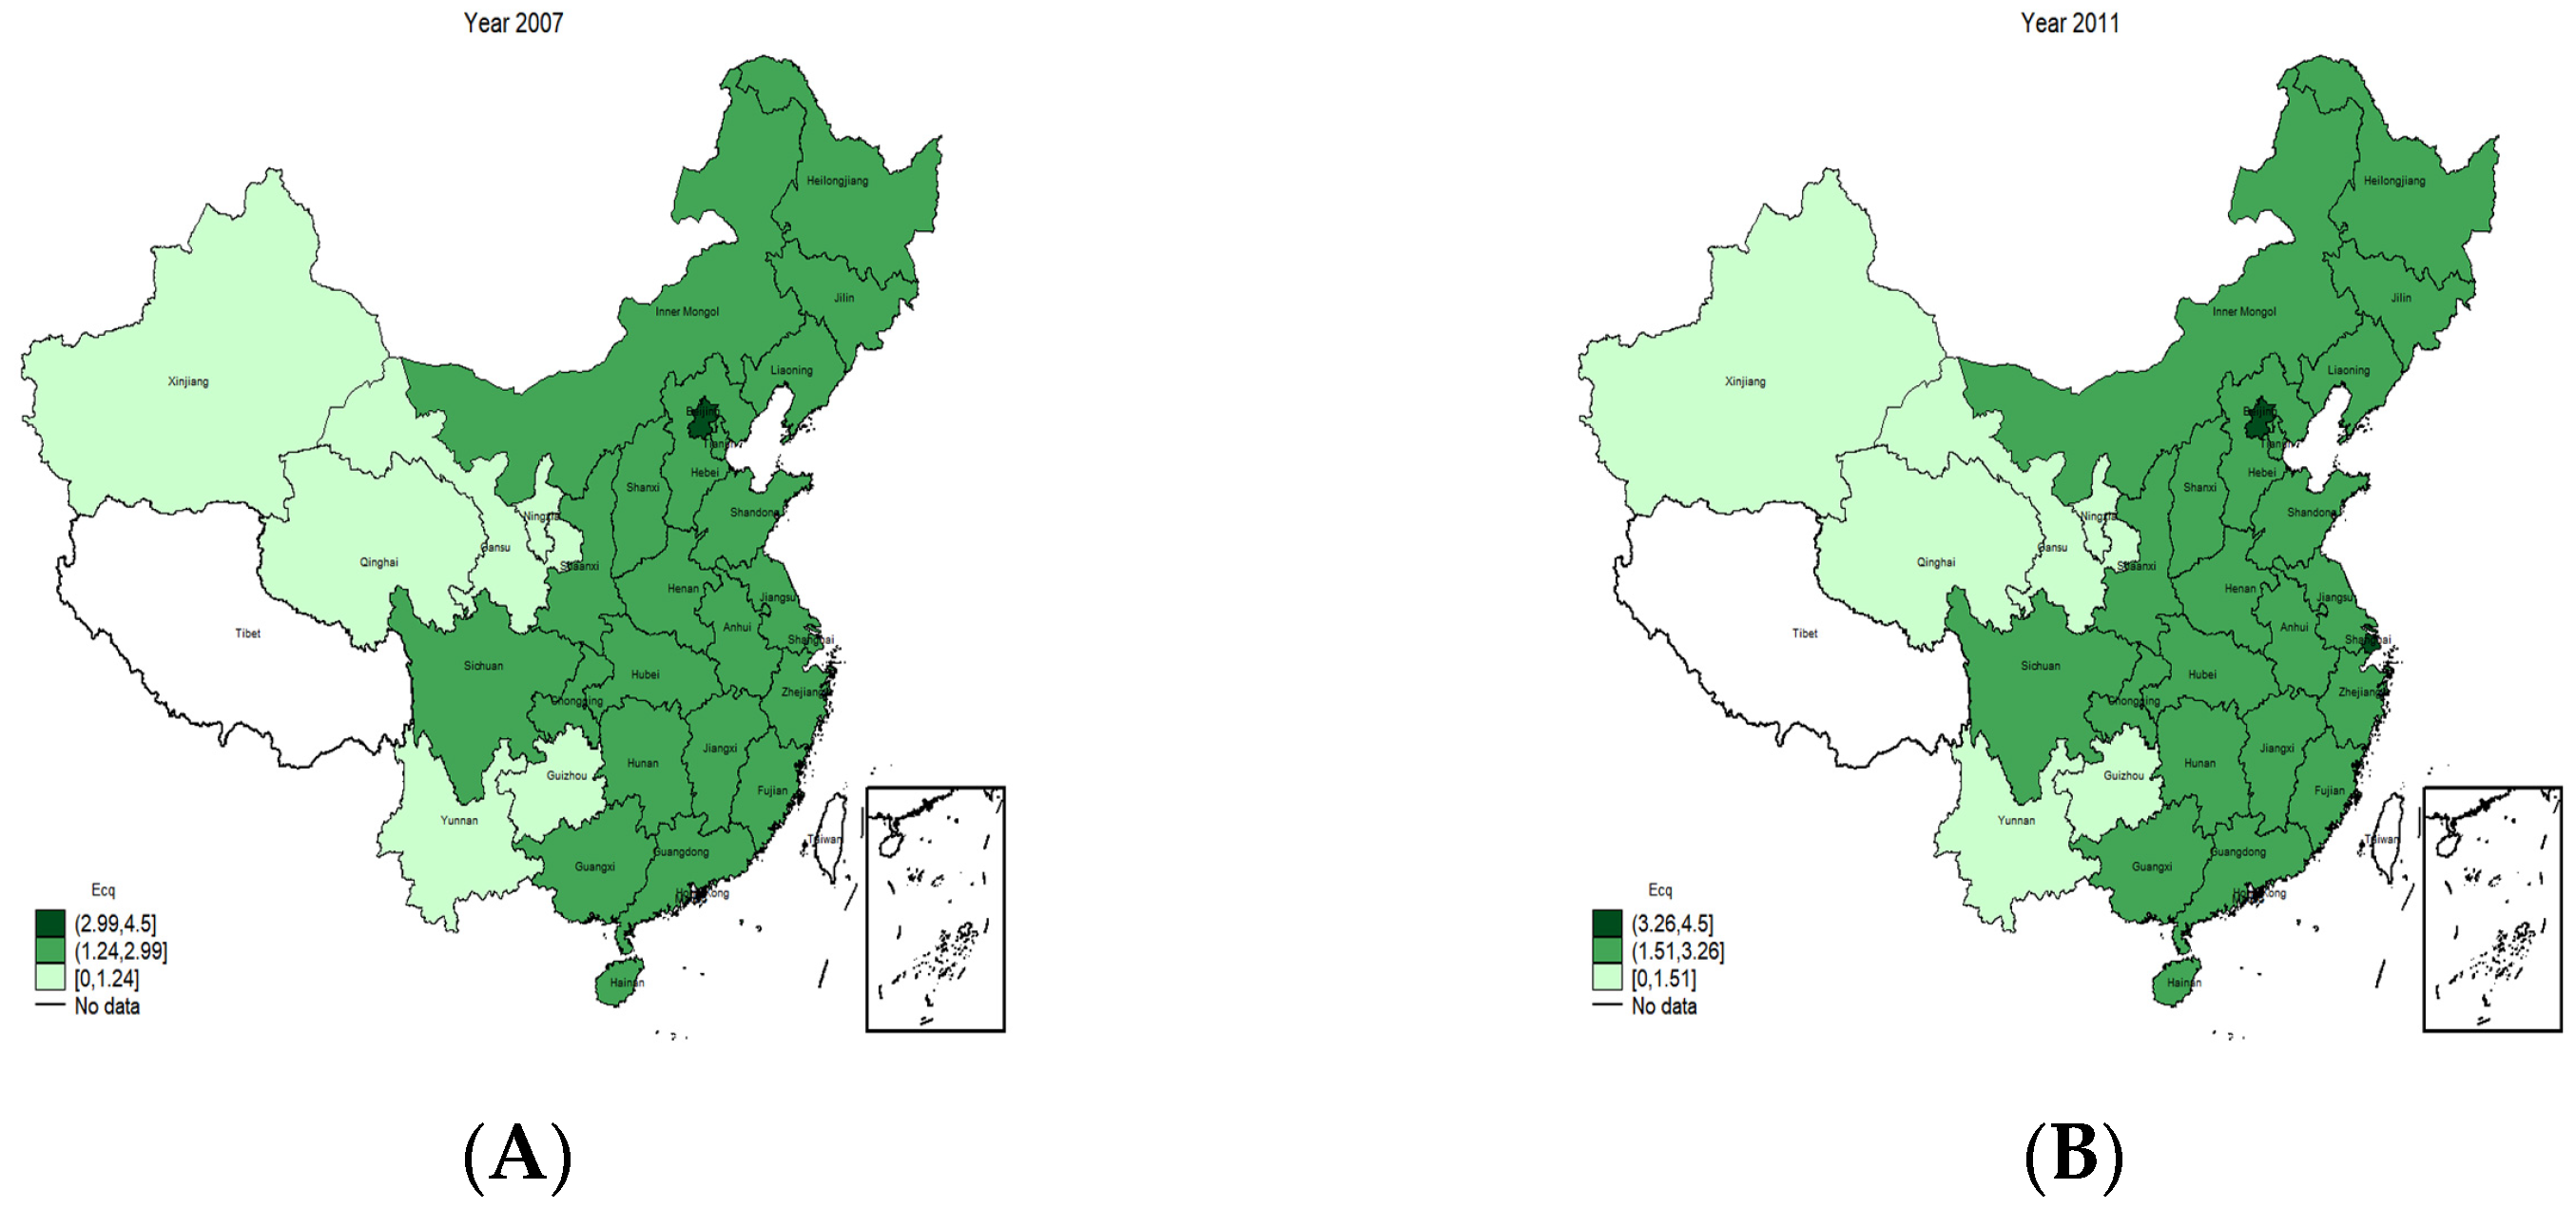
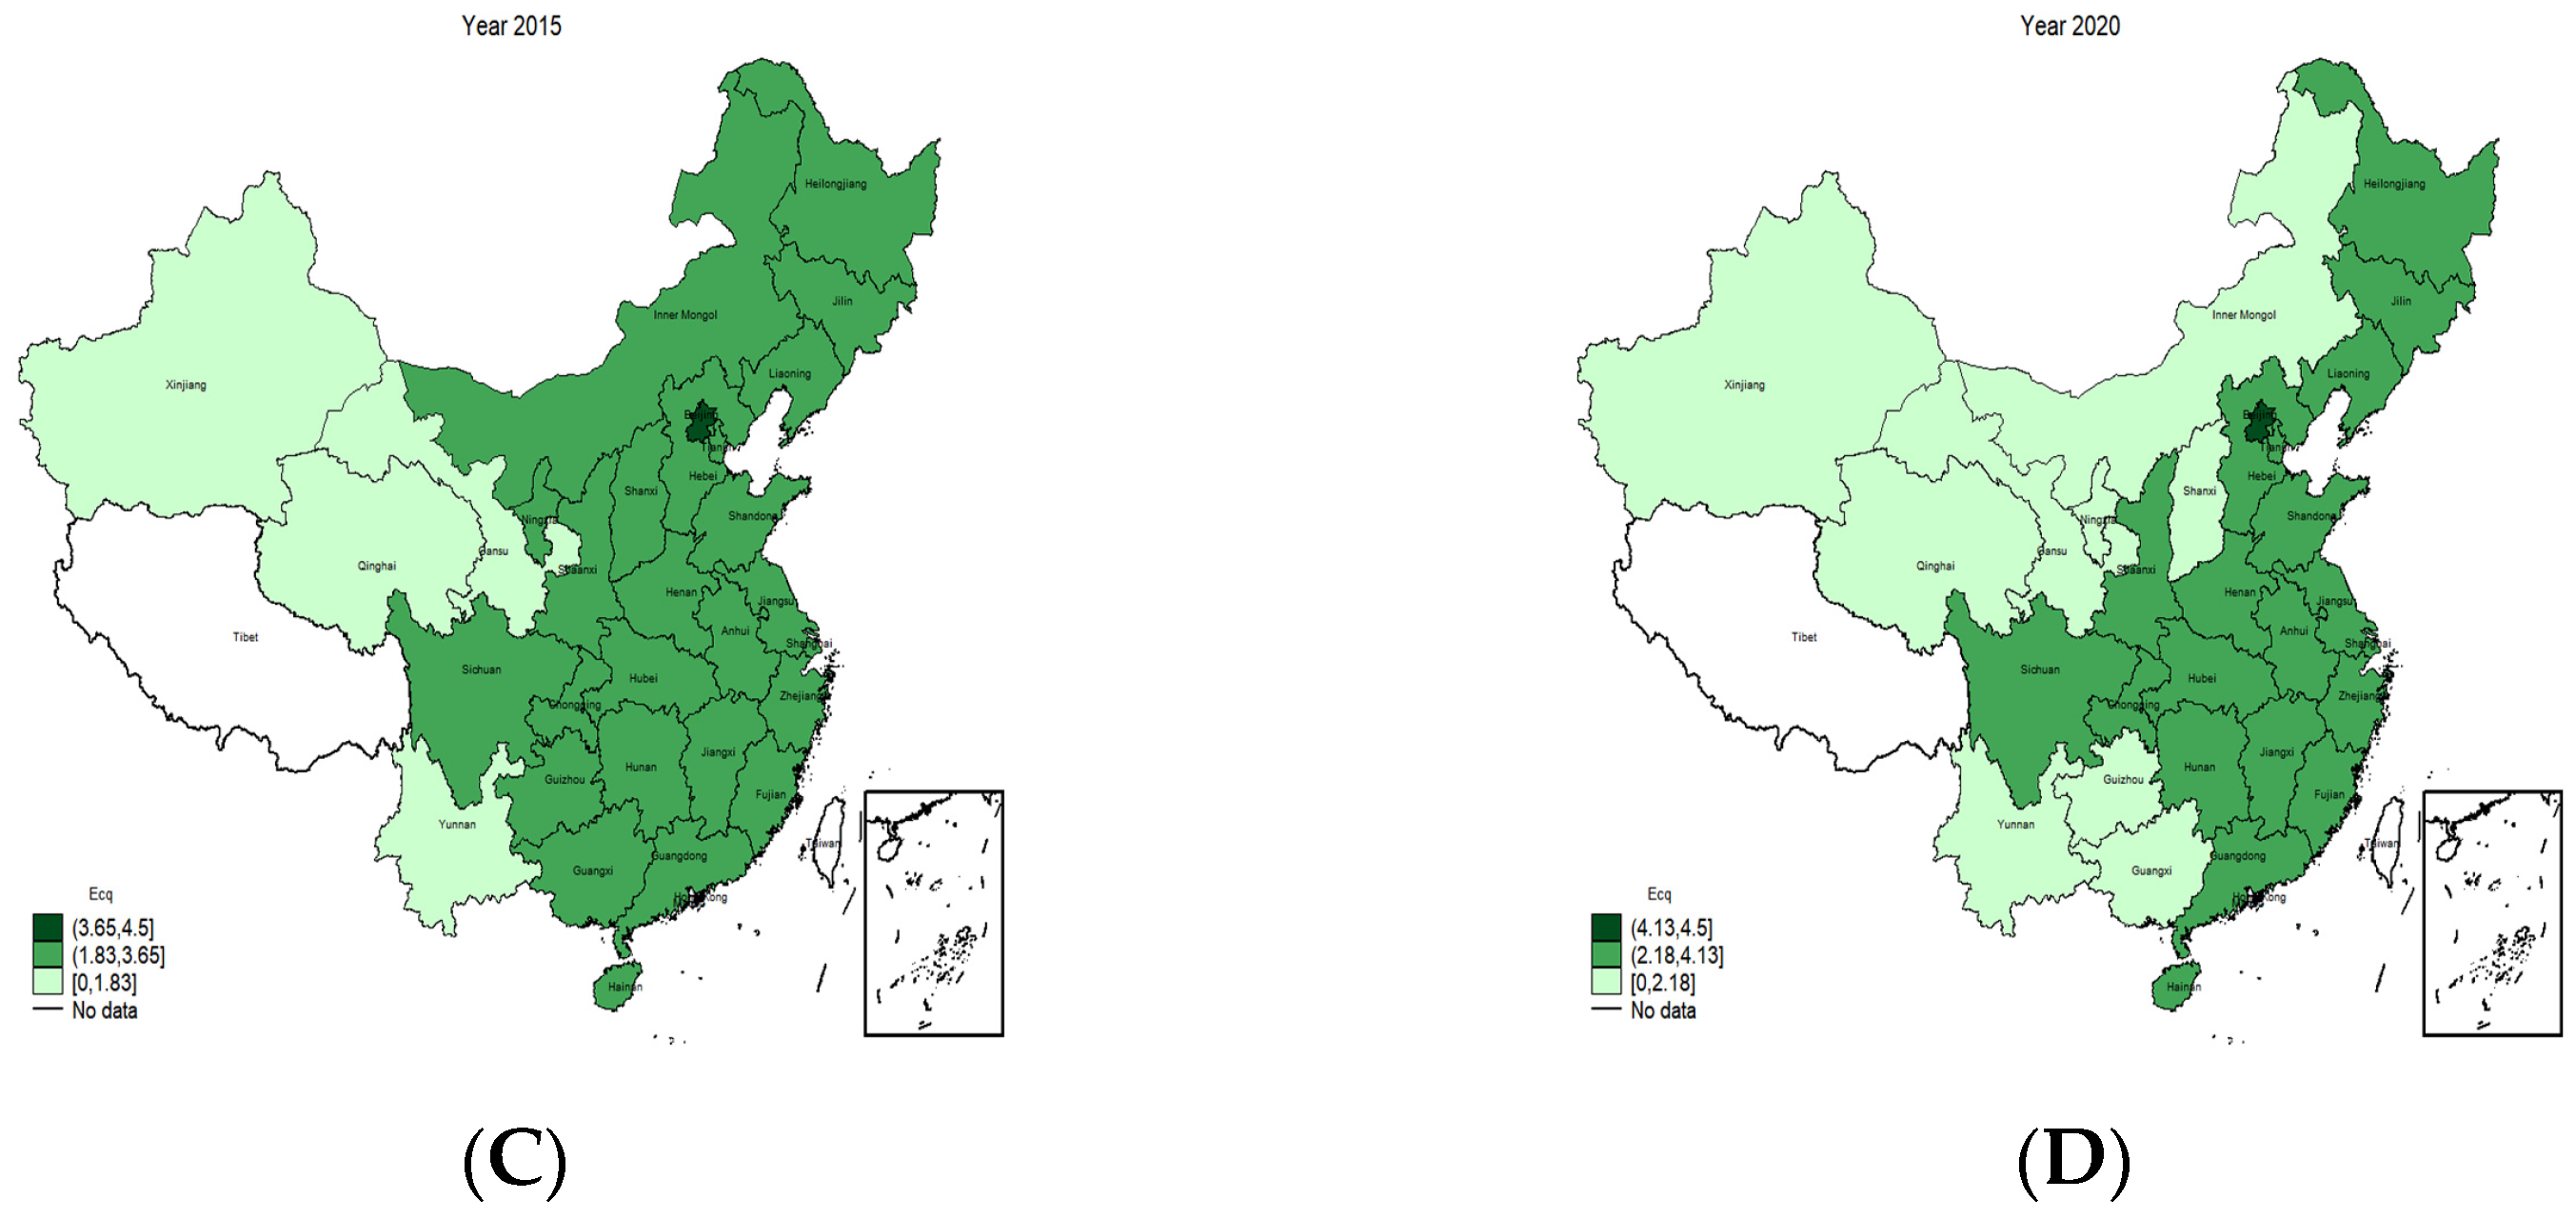
To show the spatial distribution characteristics more clearly, we used the comprehensive scores in 2007, 2011, 2015, and 2020 (see
Table 2), and imported the projection values into GIS to generate a spatial trilateral diagram. As shown in
Figure 2, the spatial and temporal distribution of regional economies in different periods was obtained, and the 30 provinces in China were divided into different economic development levels.
From
Figure 2, we can find that due to the influence of various factors, the spatial variability of regional economic development is obvious. The overall pattern of spatial variability is higher in the east, second highest in the middle, and lower in the west, especially in Qinghai, Xinjiang, and Gansu Provinces, which have been at a low level of economic development. Beijing, Tianjin, Zhejiang, Guangdong, and other provinces have higher positions. With the rise of central China and the intensive implementation of the Western development strategy, the quality of economic development in Guizhou, Ningxia, Gansu, and Anhui has improved even faster.
5. Empirical Analysis
5.1. Research Methods and Data Sources
5.1.1. Choice of Measurement Model
When the data conform to the empirical distribution of parameters, the traditional least squares method is suitable. However, when the data are more specific, it is unreasonable to use least squares estimation. Panel quantile regression is unaffected by outliers in the sample data. The regression curves differ in different quartiles. Traditional mean regression is generally considered to be regression in the 50% quantile, whereas quantile regression is an improvement on traditional regression.
In Equation (6), for variable Y, the function is . We define as the function of Y, where , is the infimum, and is the test function.
is an indicator function. The quantile regression linear model is:
In Equation (7), is the parameter corresponding to .
Given the vast territory and the large differences in the level of economic quality development between regions, a panel quantile regression model can better control inter-individual differences and mitigate endogeneity problems. Based on the characteristics of the panel quantile regression model, this paper focuses on exploring the role of human capital in regional economic quality development in different quantiles.
The basic model is constructed as follows:
In Equation (8), Ecqi,t is the level of economic quality development of each province in t, Xi,t is the variable that has an impact on economic quality development, is the time effect, and is a residual term.
Considering the spillover and diffusion effects of regional economic development, a spatial factor, that is, the spatial quantile regression model, is added to the above model to investigate the influence of human capital on regional economic development in different quantiles. The specific formula is:
In Formula (9), is the spatial autocorrelation coefficient; W is the spatial weight matrix; Hum is the core explanatory variable; Pgdp, Del, and Cz are control variables; and is an error item.
Regarding the selection of the spatial matrix, different economic variables are related in space, and spatial correlation is introduced to influence the research results. When the object of study is n regions, the spatial weight matrix W
n is a matrix of type n*n, represented as:
In Equation (10), Wij is the spatial relationship between region i and region j. There are various ways to set up the spatial matrix, the most common ones being the adjacency, geographical, and human capital matrix. In this paper, the adjacent matrix is used as the spatial weight matrix.
5.1.2. Selection of Variables
Explanatory variable: high-quality economy (Ecq). The connotations of high-quality economic development and the calculations are given in the previous section.
Human capital (
Hum): Economic growth can drive steady economic growth [
38]. Guo and Guo argue that human capital is the source of economic development [
39]. According to Wen et al. and Gao and Xue, the level of human capital was measured across regions. The specific measurement method is as follows: calculate the education years of the population and multiply it by the investment return coefficient of education. The education years of illiterate and semi-illiterate people are set as 0 years, 6 years for primary school, 9 years for junior high school, 12 years for senior high school and technical secondary school, and 15 years for junior college and above [
40,
41].
Economic development (Pgdp): this paper uses GDP per capita to estimate the level of economic development.
Transportation (Del): this paper uses regional freight traffic per population to estimate the level of transport.
Fiscal expenditure (Cz): this paper uses fiscal expenditure as a share of GDP to measure fiscal expenditure.
5.1.3. Data Sources
Data from 30 provinces from 2007 to 2020 were selected as samples. The data were mainly obtained from the China Statistical Yearbook and the statistical yearbooks of each province. Missing values were processed by data smoothing. Descriptive statistics are shown in
Table 3. Regional economic development levels vary greatly, with a maximum value of 4.454, a minimum value of 0.968, and standard deviation of 0.623 in 2007–2020, which is discrete to some extent.
5.2. Results of Spatial Correlation Analysis
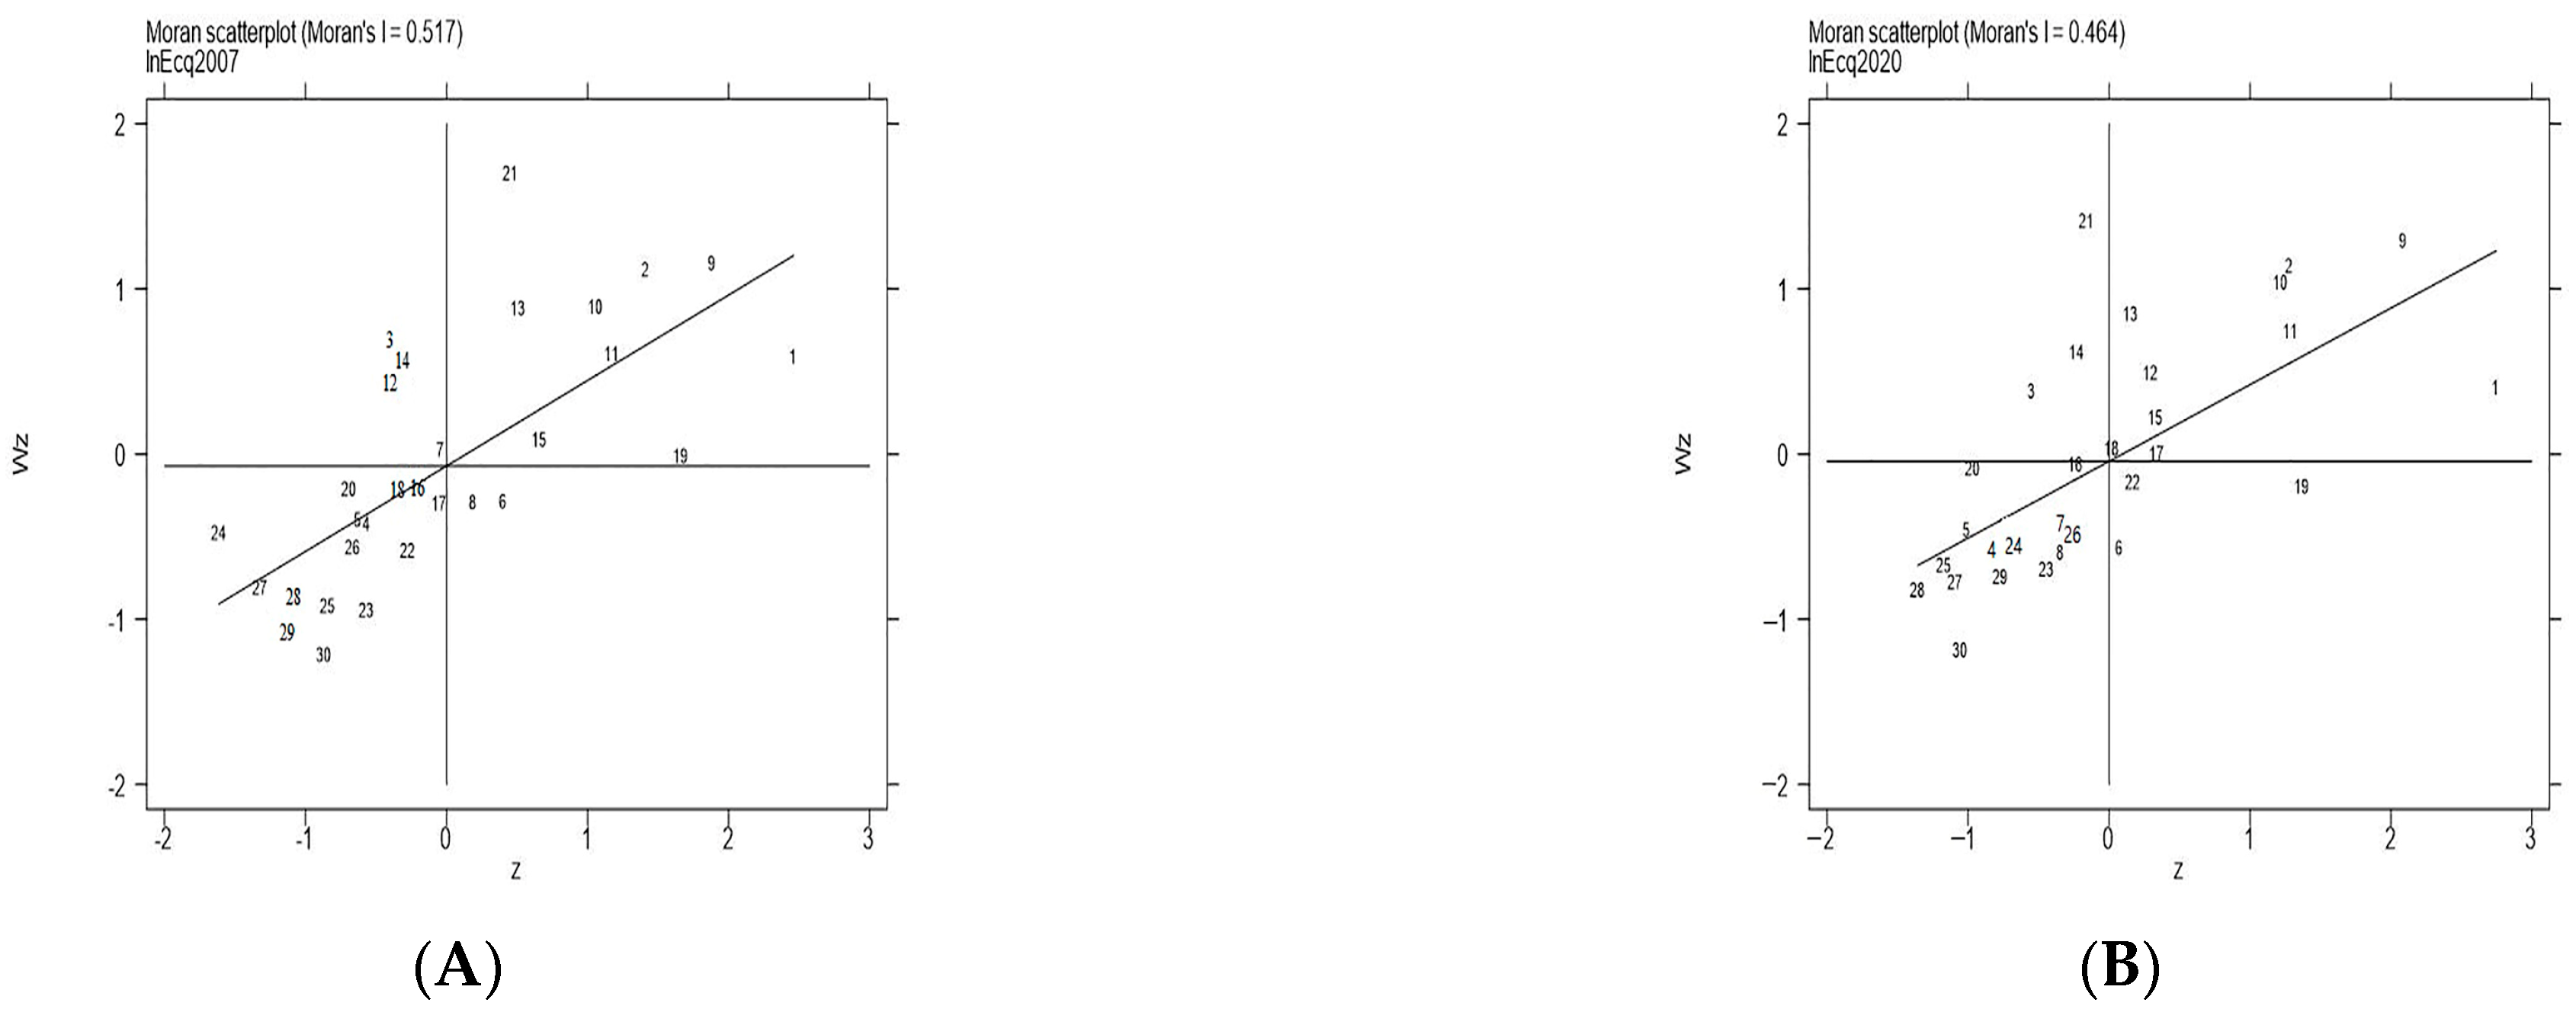
Spatial analysis of the economic quality development of target variables is the premise of using spatial econometric models. Moran’s I is used to determine the spatial correlation of high-quality economic development, and the spatial distribution of provinces can be shown by a Moran scatter plot. From
Table 4, we can find that the Moran’s I index of regional economic quality development between 2007 and 2020 was far greater than 0, and it passes the 1% (two-tailed) test, indicating a positive spatial correlation. When studying the elements that affect regional economic quality, we should consider the impact of space factors.
The Moran scatter plots (
Figure 3) show a strong spatial correlation between various provinces. Most of the correlation is located in the first or third quadrants, further verifying the results in
Table 4, indicating that high-quality economic development of neighboring provinces has a positive impact on a given province.
5.3. Estimation Results
Quantile points 0.1, 0.3, 0.5, 0.7, and 0.9 were selected, and the results are shown in
Table 5. In the spatial quantile regression model, the level of economic quality development, human capital, and financial support of neighboring provinces have a notable effect on the level of economic quality development in each province. The results are different at different quantile levels. The coefficient of traffic was not significant.
Considering the spatial correlation, the addition of the spatial weight matrix shows that the coefficients of the spatial lag terms of regional economic quality development are all positive. This indicates that high-quality economic development is spatially influenced by the neighboring provinces, i.e., it is raised or lowered accordingly. Specifically, when the high-quality economic level is 0.1, the spatial influence is relatively small. As the quantile rises from 0.3 to 0.5 and 0.7, the influence of neighboring provinces gradually rises and reaches the maximum at quantile 0.7; the influence then decreases at quantile 0.9. Human capital has a major positive effect on economic development. As the quantile increases, the influence of human capital presents a U-shaped trend of down and then up. The influence of human capital on high-quality economic development is high at quantile 0.1, with an estimated coefficient of 0.661. The effect of human capital on high-quality economic development declines slightly between quantiles 0.1 and 0.5, reaching a minimum at quantile 0.5. The influence of human capital continues to increase, reaching a maximum at quantile 0.9, which indicates that the role of human capital is greater in areas with high and low levels of high-quality economic development. Economic development ability has a major positive effect on the quality of economic development, that is, the stronger the economic development ability, the higher the quality in a given province. As the quantile changes, the influence of economic development ability on economic quality development presents an inverted U-shaped trend. At quantile 0.1, the influence of economic development ability is very small. As the quantile increases, the influence of economic development ability on economic quality development continues to increase, reaching a peak at quantile 0.5, where the influence is the greatest. As the quantile increases further, the regression coefficient of economic development ability decreases to 0.292 (quantile 0.9). The estimation coefficient of transportation for high-quality economic development is not significant. The effect of fiscal expenditure on the development of a high-quality economy has a restraining effect. However, it is not significant at quantile 0.7; that is, the higher the fiscal expenditure, the lower the inhibitory effect on high-quality economic development. When high-quality economic development is in quantiles 0.1 to 0.9, the restraining effect of fiscal expenditure gradually weakens.
To ensure the reliability of the results, we used alternative space weights to test the robustness. In this paper, the economic weight and comprehensive weight matrices of geography were used for analysis, which are not shown again due to space limitations. Comparing the results, it can be seen that the signs and trends of the core variables are identical to the results in
Table 5, except for relatively small differences in the magnitude of the influence coefficients, so the research results are reliable.
6. Discussion
According to the estimation results of the genetic algorithm–projection pursuit, Beijing, Shanghai, and Guangdong have the highest level of high-quality economic development, which is in line with the basic logic of high-quality economic development. The results show that there is an obvious upward trend in all provinces and cities. Although there has been a gradual deepening of economic reform in recent years and increasing government support for the environment and innovation, there is still room for improvement. This is basically consistent with the research conclusions of Ding et al. [
42].
From the analysis of the regression results, the spatial lag coefficient of high-quality economic development is positive. This shows that provinces with mid- to high-level development are most affected by neighboring provinces, showing an inverted U-shaped development pattern as a whole. The reason is that when the economic development quality of each province is low, the policies issued by government departments focus on regional development, and there is no time to integrate or coordinate development, so the impact on neighboring provinces is relatively low. Provinces with high-quality economic development will promote higher levels of economic and social development and will use their advantages to benefit from the resources of neighboring provinces, creating a “siphon” effect, which partially offsets the radiation-driven effect, and therefore has a lower impact on neighboring provinces [
43].
The influence of human capital on high-quality economic development shows a U-shaped trend of first decreasing and then increasing. The possible reason is that when each province has high-quality economic development, the higher technological advantage and employment environment will attract more capital and talent. The inflow of capital adds vitality to the labor market. As the backbone of high and mid-tier technology industries, human resources are scarce. Provinces with higher levels of economic development are more likely to take advantage of and release their first-mover advantage and increase their level of economic development [
44]. Human capital needs to be integrated with land, capital, and other resources in order to exert its maximum effect. In provinces with a low level of high-quality economic development, the development of human capital is lacking, while land and other resources are relatively abundant. This makes it easy for human capital to have a “catch-up” effect, allowing for greater resource conservation and efficient innovation. The match between human capital and other resources is even more confusing in areas with mid-quality economic development. On the one hand, there is a need to increase the dissemination of knowledge and popularize the concept of green consumption. On the other hand, it is also necessary to move away from the guidance of the GDP-only concept and coordinate the various resource elements.
Economic development has a significant positive impact on high-quality economic development. This is basically consistent with reality. This may be because economic construction is the basis for other constructions. Areas with low- to mid-level economic development still need strong support. However, in areas with high-quality economic development, economic quantity is not the focus of attention at present; the goal is to pay attention to environmental health, high innovation, and social harmony. In areas with low-quality economic development, although their economic development is the key point, it is seriously scattered due to a weak foundation, and their support for green transformation and other development is limited. In areas with medium-quality economic development, industrial development has begun to take shape. While undertaking industrial transfer, they have overcome the difficulty of a weak economic foundation and played a role in economic development. Therefore, the impact is greater.
The estimated coefficient of transportation for high-quality economic development is not significant. On the one hand, this has something to do with the construction of the current quality development system. China’s high-quality economic development is in its infancy and has not yet been matched with an efficient green transport mechanism; therefore, it is not effectively promoted. In addition, the rapid development of trade and commerce has promoted the prosperity of transportation. However, at present, the transportation mode and management systems are unreasonable, far exceeding the environmental carrying capacity. Furthermore, real low-carbon transportation has not yet been realized, which would not only benefit residents’ lives but also reduce environmental noise. To cope with the cost pressure caused by oil prices and other factors, some transport companies will not choose to invest more money in equipment and clean transport.
Financial expenditure has a significant inhibiting effect on high-quality economic development. This may be because areas with high-quality economic development have large populations. Fiscal expenditure requires substantial financial resources to provide public transportation and other services and to improve the daily lives of the population, overshadowing innovation and education expenditure, which is not conducive to high-quality economic development [
45]. Especially in places with a low level of high-quality economic development, some government officials prefer the economic sector, which can lead to a squeezing effect [
46]. With the improvement of high-quality economic development, local government officials will no longer be confined to the economic field, and the restraining factors will decrease.
7. Conclusions and Insights
High-quality economic development is a significant strategic state plan. In this article, we attempted to construct an evaluation system based on the existing literature. This system is not limited to economic growth but should also reflect the characteristics of livability and resources. With 40 indicators in five dimensions (green economy, innovation, sharing, coordination, and openness), we used a GA-PP model to estimate the economic quality development index from 2007 to 2020. We also analyzed the differences and evolution of high-quality economic development in three regions of China and discussed the role of human capital. We concluded that five indicators are the main factors that affect the regional economic development level of China: advanced industrial structure, economic share, investment of innovative personnel, amount of participation in endowment insurance, and the number of patent applications. Between 2007 and 2020, the spatial distribution of regional economic development levels shows a significant positive correlation that tended to be smooth, with values ranging from 0.427 to 0.517. The spatial effect of regional economic quality development was significant. The level of local economic development had a positive influence on nearby areas. The spatial effect of regional high-quality economic development was significant, and the local level of high-quality economic development had a positive influence on nearby neighborhoods, showing an inverted U-shaped curve as the level increased. Similarly, the influence of human capital on regional high-quality economic development also showed a significant U-shaped curve. The relationship between economic development level and high-quality economic development showed an inverted U-shaped curve. The restraining effect of fiscal expenditure on high-quality economic development gradually decreased. We believe that the following three aspects should be strengthened.
First of all, there is a need to increase investment in human resources, optimize the structure of human resources, and balance the gap in human capital among regions. There is a need to match the talent in various regions with high-quality economic development and implement an effective link between talent and local social development. It is necessary to tighten the mobility of regional human capital. The eastern region should not only undertake the cultivation of innovative human capital, but also expand to the midwest, break the population barriers brought by industry and household registration, and solve the problem of accurate matching of talent supply and demand. At the same time, it is necessary not only to highlight the importance of human resources but also to make the most of people’s talents and adapt to local conditions. The introduction of highly applicable talents in suitable fields and positions is conducive to the development of regions and industries.
Second, the industrial structure and other developments that have a great influence on the high-quality development of the economy should be increased. Relevant government departments should guide residents to improve their awareness of environmental preservation and creative promotion at enterprises, universities, and research institutes. We need to pay attention to inter-regional exchanges and cooperation for high-quality economic development, strengthen inter-regional alliances, and develop a reasonable regional integration layout, thus realizing the complementary advantages of regional talent and scientific and technological resources.
Finally, transportation plays a significant part in promoting the inter-regional trade of products and converting old and new energy sources. The government should strengthen the adjustment of the transportation structure, improve railway freight transportation capacity, and reform the taxation of the transportation industry. Government departments should control vehicle owners through administrative orders for pollution control and issue licenses for vehicles that meet pollution standards to improve vehicle emissions. The speed of human capital accumulation has increased. Expanded enrollment has been implemented, but the proportion of highly educated workers in the labor force is still far lower than in Europe and the United States. It is necessary to further expand higher education institutions. Colleges should handle the balance between running schools on a large scale and running schools with characteristics according to their advantages and orientation. The government should reduce the proportion of fiscal financing and encourage and guide social capital to invest in economic and social construction. When strengthening infrastructure construction in poor areas, new financing channels should be actively explored. The government should increase the investment efficiency of funds, change the financial management mode, and use special funds for special purposes so that limited funds can play the greatest role.
This paper studied the impact mechanism of human capital on the high-quality development of China’s economy, using 30 provinces in China for empirical analysis. The limit of the study is that it used macro data instead of micro data for empirical analysis, the empirical analysis was carried out using provincial panel data rather than micro data, and it focused on the overall impact of human capital on high-quality economic development rather than the impact of each dimension. In future research, we will collect micro data and research the impact of human capital on the five dimensions of green economy, sharing, openness, coordination, and innovation so as to optimize the research results.


