1. Introduction
Capital mobility has emphasized the importance of tax competitiveness, meaning that economies have the freedom to participate in the market struggle and to adjust tax policies for the sake of attracting foreign direct investment (FDI). In the case of the European Union (EU), which is characterized by a single market, capital mobility has created many challenges in the field of tax policy. In past two decades, within the EU, there have been various attempts to coordinate some aspects of business taxation (both tax rates and tax bases), including EU institution proposals for the introduction of a single EU corporate tax. Although there is still a tendency to coordinate tax systems in order to avoid harmful tax competition, EU member states have retained the right to fiscal sovereignty, since their attitudes about whether or not to pursue further corporate tax coordination are divided. Namely, member states have jealously retained most taxing powers within their hands and conceded only limited prerogatives at the European level [
1]. Therefore, governments have the opportunity to compete with each other for foreign capital inflow. Among all the EU economies, tax competition between the old and new EU economies exists; namely, emerging EU economies are tempted to offer corporate taxes that are low [
2]. Attracting FDI generates a “race to the bottom” in capital income taxation, since tax rates are competed down to zero [
3], creating tax competition as an opposite trend to tax coordination [
4].
Hence, in order to attract FDI, policy makers create favorable tax systems. In order to ensure foreign capital inflow, policy makers choose the policy of tax reduction [
5] and particularly the policy of effective average tax rate (EATR) lowering. Namely, the EATR measures the difference in the before-tax and after-tax net present value of a real FDI profitability, meaning that differences in the EATR across countries affect the location of the FDI. Specific interest in this paper is oriented towards different tax strategies chosen by emerging EU economies in the periods before membership and after accession for EATR, since tax coordination is de jure expected in the EU; however, de facto there is evidence of tax competitiveness.
This paper empirically assesses the impact of changes in the EATR on the decision to localize FDI in the emerging EU economies (Bulgaria, Croatia, Cyprus, Czech Republic, Estonia, Hungary, Latvia, Lithuania, Malta, Poland, Romania, Slovakia, Slovenia) using available empirical data in the period 1998–2021. Namely, the paper analyses tax competitiveness existence in the emerging EU economies, through the empirical estimation of the EATR reduction and the effects on FDI inflow. Various authors have dealt with this relationship with the statutory (corporate income tax) rate; however, some have just authenticated the impact of the EATR on the decision to allocate investment in emerging EU economies [
6,
7,
8]. Since the EATR is not the only factor that determines investors, it is important to consider the global crisis effects because investment priorities were radically changed after the outbreak of the global financial crisis in 2008 (Zaubir et al., 2020), as well as other determinants of FDI in emerging EU economies such as the business environment [
9,
10,
11]. Therefore, the goal of this paper is twofold: (a) to empirically assess the long-run relationship between the EATR and FDI and the heterogeneity adjustments of 13 emerging EU economies in the period 1998–2021 and in the post-accession period (2004–2021); (b) to estimate key determinants of FDI along with the EATR (macroeconomic variables, corruption and competition index, the effects of the global crisis). These goals are analyzed in the framework of cross-sectional dependent, non-stationary, heterogeneous panels, using the Pooled Mean Group (PMG) estimator to reveal the long-run relationship between the EATR and FDI and heterogeneous error-correction parameters, while other determinants are identified in a robust model estimated by the Panel-corrected standard errors (PCSE) estimator. To the best of our knowledge, these specific econometric estimators have not been used in the literature on the effects of the EATR on FDI. Therefore, the main hypotheses of this paper are:
Hypothesis (H1): A long-run relationship between FDI inflow and EATR exists in emerging EU economies, with heterogeneous adjustments towards the long-run relationship in the period 1998–2021.
Hypothesis (H2): The speed of adjustment to the long-run relationship between FDI inflow and EATR is faster in emerging EU economies for the period 2004–2021, namely, after joining the EU in 2004.
Hypothesis (H3): Effective average tax rates influence negatively on FDI, while GDP per capita, the corruption index and the effects of the global crisis are significant for decisions on investment allocation in the emerging EU economies.
The results of this paper indicate that emerging EU economies used tax competition in the period 1998–2021, since the homogeneous long-run relationship is significant between the EATR and FDI, while the adjustment parameters are heterogeneous, but higher in the post-accession period (2004–2021). Namely, accession to the EU contributed faster adjustments towards the long-run relationship in the majority of the emerging EU economies. This finding of tax competitiveness contrary to the expected coordination may contribute to future strategies for favorable tax systems in the EU economies. Namely, EU policymakers should reconsider whether downward pressures on the EATR in the emerging EU could be a possibility for tax coordination within the EU but at lower tax levels, defining a floor for tax competitiveness in the EU similar to the global minimum tax rate defined by the OECD [
12].
The paper is structured as follows. After the Introduction section,
Section 2 reviews the existing evidence in the empirical literature.
Section 3 deals with competitive tax systems and FDI in the emerging EU economies.
Section 4 presents the methodology and data, while
Section 5 discusses estimation results. The final section outlines the concluding remarks.
2. Literature Review
This paper draws on the literature based on the competitive tax policies in emerging EU economies. Many economic policy makers have emphasized the importance of tax policies as a key factor for the smooth functioning of an economy [
13]. Every tax system should be based on the trade-off between efficiency and equality, and therefore tax systems differ in nature and form. Devereux et al. [
14] pointed out that capital mobility enables the redirection of investments from economies with higher tax rates to economies with lower ones. That is in accordance with Desaia et al. [
15], who pointed out that taxes influence companies’ decisions about the location, establishment and expansion of their businesses. Thus, tax policy is a significant factor that can be a generator or negative factor for FDI inflow [
16]. That is in line with the assumption that higher tax rates reduce profits for investors [
17], enlarging labor costs firstly and then taxing profits. Taking into consideration all of the above, the important factors for tax systems could be summarized as: (i) globalization, (ii) the specificities of EU economies, (iii) the EATR and (iv) the effects on FDI inflow.
An important aspect of the analysis of changes in tax rates is globalization, as it induces reforms of tax systems [
18] with the aim of achieving tax competitiveness in a market struggle. Namely, Hong et al. [
19] pointed out that if the tax system burdens taxpayers too much, it will inevitably lead to tax avoidance schemes, while Stewart [
20] confirmed from the example of Ireland that lowering corporate income tax rates can attract a significant amount of FDI to the country, and thus achieve an economic boom. As Keightley et al. [
21] pointed out in their research, one way to achieve tax competitiveness without compromising public revenues is to lower corporate tax rates while expanding the tax base [
22].
Papers that deal with the tax position within the EU were analyzed, since the tax systems of EU economies are of great importance for the paper. Member states retained fiscal sovereignty; regardless of this however, tax coordination has been insisted on for many years, in order to eliminate harmful tax competition between member states. According to Baldwin and Krugman [
23], the failure of tax coordination can be explained by the fact that it cannot suit all economies equally. In fact, if harmonization occurs, it will harm at least one economy, given that in core countries the EU elasticity of investment movements in relation to tax changes is lower than in peripheral countries [
24]. Thus, according to Sørensen [
25], the tax coordination of EU countries should remain at the level of reducing the cost of tax liabilities, tax administration and improving the ability of governments to maintain a redistributive welfare state. That is in line with Wasserfallen [
26], who indicated that after the central and eastern European countries’ accession, the prospects of tax policy coordination starkly decreased. However, Glavaški et al. [
27] emphasized the importance of strengthening the fiscal framework, stimulating the coordination between national and supranational fiscal arrangements.
A series of papers also underlines the impact of effective average tax rates. Bénassy-Quéré et al. [
28] claimed that following statutory tax rates, investors/capital owners could be misled. Although the statutory tax rate is decreased, the tax burden can be unchanged [
29] Thus, Auerbach [
6] emphasized the effective tax rate role in understanding FDI location decisions. Egger et al. [
8], in their empirical study, confirmed that unilateral effective tax rates significantly affect the production and location decisions of multinational firms. That is in line with Barrios et al. [
7], who stressed that the effective tax rate is more suitable for investment decisions since it reflects tax incentives. In October 2021, the international community of 136 economies agreed a landmark deal involving a two-pillar solution to address the tax challenges arising from the globalization process in the context of the EATR. The two pillars introduce domestic rules that establish a global minimum effective corporate tax rate of 15% for large multinational enterprises (MNEs), which is characterized as a floor for tax competitiveness [
12].
The growing importance of multinational corporations and FDI allocation have far-reaching consequences for national tax policies [
30]. Higher transnational capital mobility exerts a downward pressure on corporate tax rates [
31]. In an effort to attract new investors and retain existing producers, governments use corporate tax rates as a policy tool for investment attraction, resulting in inter-state tax competition [
29]. Tax competitiveness motivates capital owners on resource allocation [
14], since one of the key determinants for multinational companies’ decisions about the location and expansion of businesses is taxes [
15]. Foreign direct investment has become the largest source of external finance, surpassing official development assistance [
32]. Hence, in order to attract FDI, policy makers create favorable tax systems. Tax incentives are commonly used by emerging and developing countries, with some variation across sectors and regions. In this paper, the focus is on emerging EU economies, where Hunady et al. [
33] noted that FDI is recognized as a main generator of economic growth [
34,
35,
36]. The inflow of foreign capital and the presence of multinational companies plays a crucial role in the successful transition of these countries [
37,
38]. Namely, FDI affects rises in employment, competition, technology transfer, a better position on the international market and a rise in exports and foreign currency inflow [
39,
40]. After the financial crisis, the global economic environment changed [
41]; however, other business environment factors such as the corruption index significantly influence investment decisions [
11]. The idea of this paper is to fill the gap that exists in the literature regarding the EATR impact on FDI localization decisions in emerging EU economies using Pooled Mean Group Estimator and the Panel-corrected standard errors estimator, given the obvious scarcity of scientific papers dealing with this topic before and after the accession of the emerging EU economies to the EU.
3. Competitive Tax Strategies and FDI
Tax reforms in the EU are motivated by concerns about equity and efficiency and by the idea of deeper integration in the field of tax policy, and more broadly in the context of fiscal unification. The subtlety of this question is related to the tax structures of interconnected member states, which certainly affect their competitiveness. Tax rates i.e., the tax burden, can be a crucial factor for the foreign investment afflux/reflux, and consequently the level of employment [
16]. Therefore, if tax rates are increased, investor profits are reduced [
17], due to increasing labor costs and reduced net income. Thus, tax evasion is inevitable [
19].
The national governments of emerging EU economies [
18], in order to achieve tax competitiveness, have been particularly active in reforming their tax systems. Corporate income tax accentuates as the most important tax form, since lower rates make the country more attractive for investment. According to Keightley et al. [
21], tax competition can be attained without public revenue decrease, by lowering corporate income tax rates while expanding the tax base [
22]. However, that can be misleading since low statutory rates can be offset by a broader definition of taxable income [
28].
Accordingly, there is a significant difference between the statutory tax rate and effective tax rate. Corporate income tax rates (statutory) are widely used, although even defining this rate is less straightforward than might be expected [
14]. The effective rate represents what corporations actually pay after deductions, tax credits, write-offs and foreign income allocations [
6,
29]. The incentives generated by the tax system depend on the form of the investment project, including the type of asset purchased and the way it is financed [
14], meaning, effective tax rates correctly reflect tax incentives, and are better candidates to gauge the impact of the taxation of FDI decisions by firms [
7,
28].
Achieving tax competitiveness has created certain problems within the EU, especially due to the shortcomings of the unfinished EU project [
27]. Namely, corporate tax rates and the EATR ‘race to bottom’ have triggered various issues within the single market considering four freedoms. Different tax rates within the single market lead to the “migration” of capital from member states with higher tax rates to member states with lower rates, significantly affecting economic growth and the unemployment rate. For that reason, the European Commission has put forward ambitious plans for a Common Consolidated Corporate Tax Base (CCCTB) within the EU [
42]. This EU initiative involves a common tax base, aimed at eliminating mismatches between national systems that aggressive tax planners often exploit, and consolidating reporting at the level of a multinational group, aimed at reducing the administrative burden. Namely, EU tax coordination includes both corporate and EATR [
15,
24], since uncoordinated national tax regimes give rise to strategic tax planning often operated by multinationals in order to minimize their overall tax liabilities. However, the tax harmonization perspective is questionable since low-tax countries oppose the pooling of tax authority because, for them, European tax intervention is associated with higher costs, while high-tax countries support tax harmonization [
26]. Thus, room for capital mobility is still left. This is in line with Baldwin et al. [
23], who stressed that tax coordination cannot suit all economies equally. There is a valid fear that, if it occurs, tax coordination will harm at least one economy, due to the diverse investment elasticities between peripheral states and core states [
24]. This can be confirmed by empirical data analysis based on corporate income tax rates in selected EU economies, and potential effects on investment’s localization decisions.
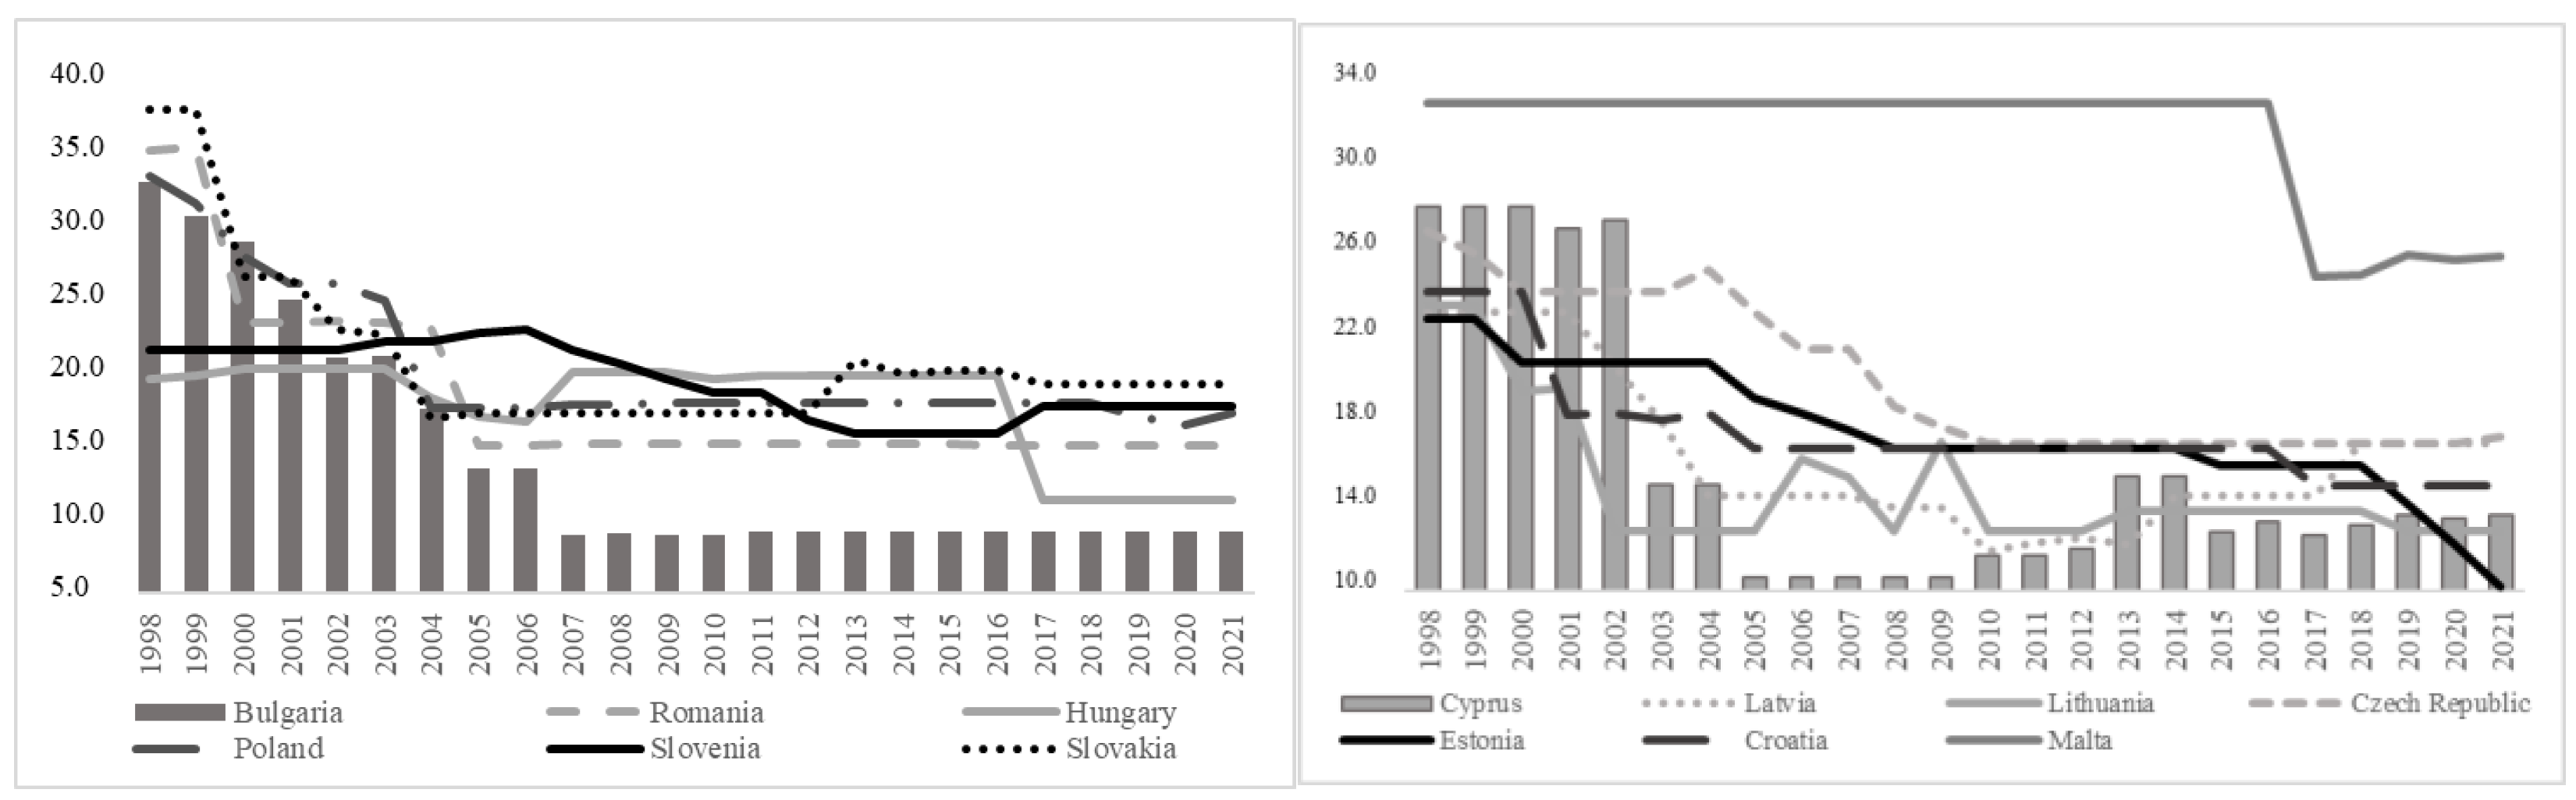
The tendencies of lowering the EATR in the period 1998–2021 in all the analyzed emerging EU economies are unquestionable (
Figure 1). Moreover, almost all emerging economies after their accession to the EU in 2004 lowered the EATR (
Figure 1). Although the accession year for Romania and Bulgaria was 2007, and for Croatia 2013, the lowering of the EATR occurred in 2004 as well. Slovakia significantly decreased the EATR from 1998 to 2004, from 36.7% to 16.5%, slightly increasing it after 2013. Lithuania significantly changed the EATR even before membership in 2002; however, after two years of membership the EATR was raised. Hungary also recorded an EATR increase in 2007, from 16.7% to 19.5%, maintaining that rate until 2017, when the EATR notably dropped, from 19.3% to 11.1%. After lowering the EATR in 2005 from 34% in 1998 to 14.7%, Romania has had quite an unchangeable EATR (around 14.8%). Furthermore, Malta’s EATR did not change until 2017, and even after the reduction the EATR was the highest compared to other emerging EU economies (24.4%).
On the other hand, FDI movements recorded more fluctuations in comparison to changes in the EATR in the emerging EU economies. The majority of the emerging EU economies were countries of former socialist systems (Soviet Union and Yugoslavia). The economic organization of those systems implied that decisions on investments, production and allocation were based on a planned economy. New socio-political circumstances have conditioned the transition of emerging economies towards a market economy, in which a laissez faire system applies. The transformation from state or social property to private property has been primary. Namely, privatization enables the inflow of foreign capital, which in emerging EU economies is recognized as an essential driver of economic growth and development [
33,
34]. Thus, the entry of multinational companies into the market has significantly contributed to the successful transformation of the system [
37]. Furthermore, in addition to capital, FDI in the emerging EU economies brought new technology and knowledge as well [
35], which enabled a significant increase in labor productivity, and thus an economic boom [
40,
43].
Moreover, the investment priorities were radically changed after the outbreak of the global financial crisis in 2008 [
41]. Accordingly, it is imperative to identify the factors that determine investment location. A competitive EATR was recognized as a stimulator for FDI influx, often leading economic policymakers to cut tax rates. Besides the EATR, the attractiveness of the host country as an investment location is notably determined by the business environment [
10,
11].
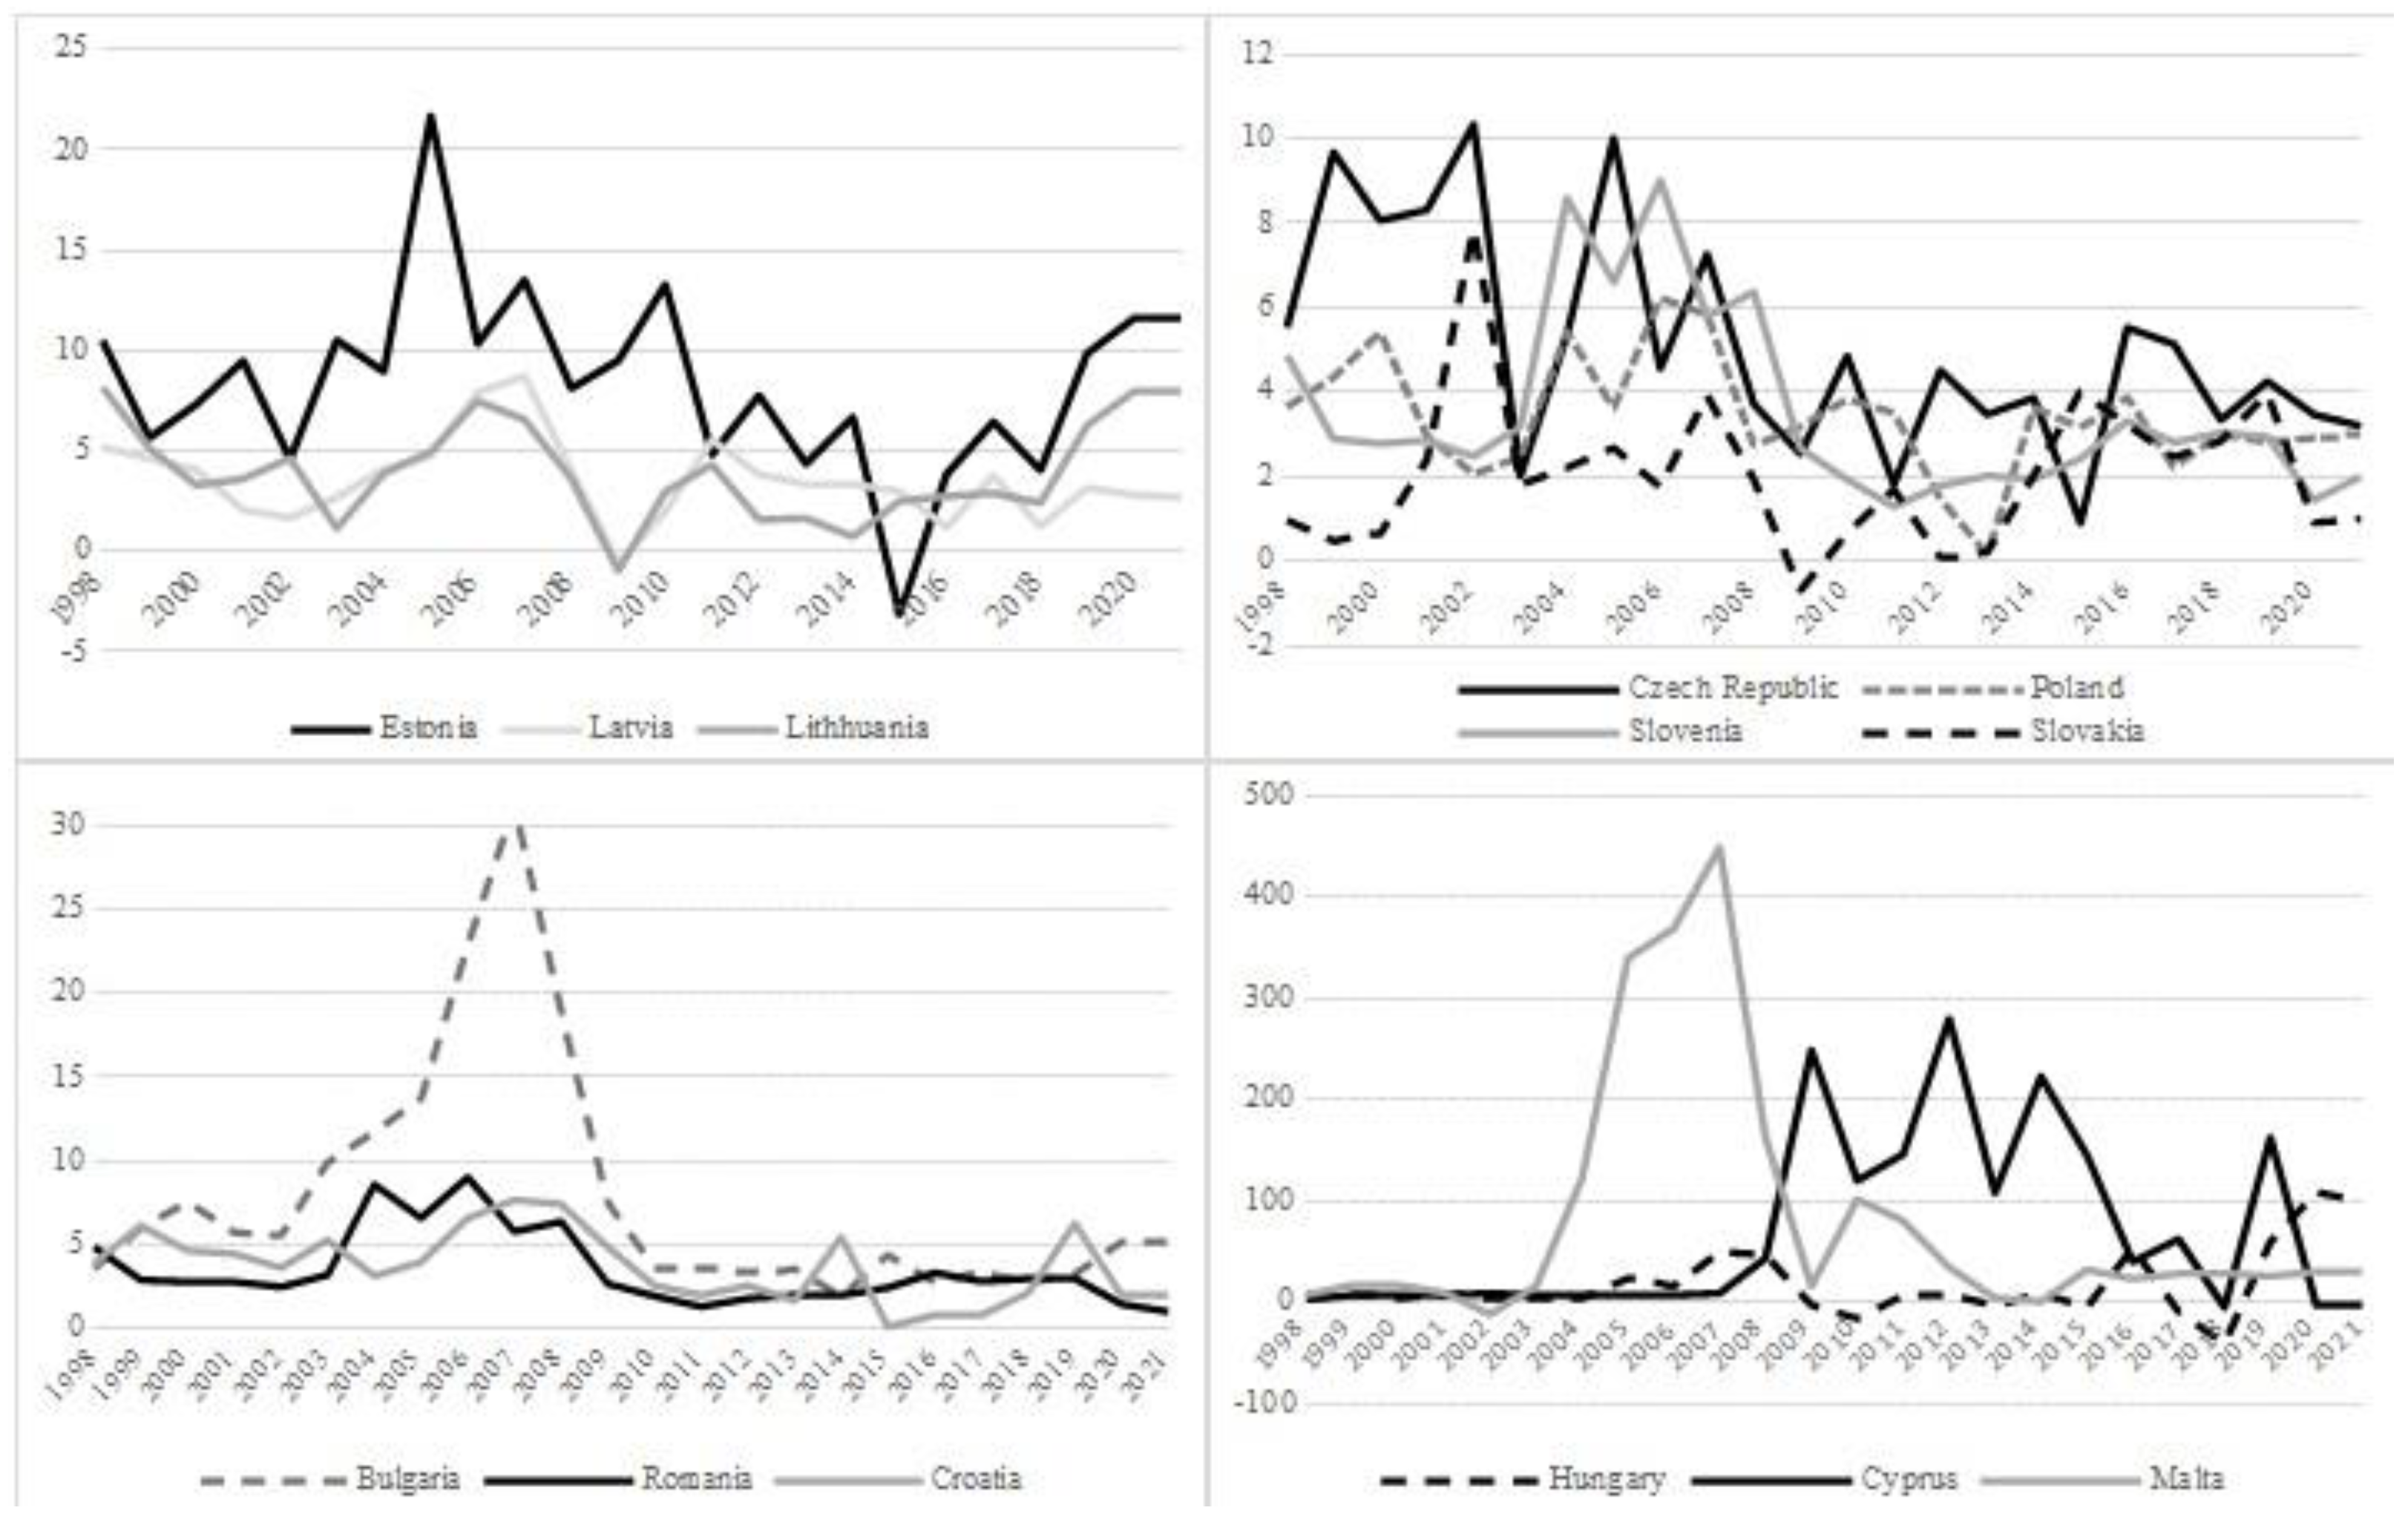
From the beginning of the observed period until 2003, Bulgaria, the Czech Republic, Estonia, Croatia, Latvia, Lithuania, Poland, Slovenia, Slovakia and Romania recorded a positive trend in foreign capital inflow (
Figure 2). Right before accession to the EU, the Czech Republic, Slovakia and Lithuania had a drastic drop in their FDI share to GDP, while a notable FDI inflow was recorded in Estonia in their first year of joining (with around 20% of FDI share to GDP). A significant decline in FDI in relation to GDP in the observed emerging EU economies was recorded after the outbreak of the global financial crisis. Consequently, the further growth of FDI inflows did not ensure the pre-crisis share of FDI to GDP. On the contrary, Hungary, Malta and Cyprus, from the beginning of the observation period until 2002, experienced a similar and almost negligible FDI inflow. After 2002, the situation changed drastically for Malta’s economy, since a greater FDI inflow occurred until 2007. In Cyprus, more notable inflows appeared after 2008; therefore, the movement of FDI in Cyprus is opposite to other countries. The investment trend was variable until 2017, when a significant decline was recorded.
Consequently, the descriptive analysis points to causality in the movement of investments towards the EATR, since the positive trend of FDI inflow is recorded in the period of the EATR lowering. The subject of the econometric analysis in the continuation of the paper will be the evaluation of this relationship using the panel model.
5. Discussion of Results
5.1. Pooled Mean Group vs. Mean Group Estimator Results
The procedure performed in order to obtain the long-run relationship and short-run dynamic estimates between the FDI inflow and the EATR (Hypotheses (H1) and (H2)) consists of the following empirical steps. Since that sample included the period 1998–2021 for the 13 emerging EU economies, firstly, cross-sectional dependence (CSD) in the panel is tested. The results of the Pesaran CD test are presented in
Table 1 (panel a)—
Table 1,
Table 2,
Table 3 and
Table 4 simultaneously represent analysis related to Hypothesis (H1) (for the period 1998–2021) and Hypothesis (H2) (for the period 2004–2021)—and imply that the null hypothesis of cross-section independency has to be rejected for the variables efec and fdi. Detected dependence is expected due to the strong institutional framework in EU economies and common policies. Although the sample covers a longer period of time and preparation phase for membership, the majority of the analyzed economies became members of the EU in 2004 (2004 for the Czech Republic, Cyprus, Estonia, Hungary, Latvia, Lithuania, Malta, Poland, Slovakia and Slovenia, 2007 for Bulgaria and Romania and 2013 for Croatia). Cross-section dependence is therefore expected, since the institutional design of the EU includes the common market, common agricultural policy, customs union, tax harmonization and finally monetary union for some of the emerging EU economies, which inevitably leads to connections, spill-over effects and dependencies between EU countries [
51].
Due to the test results of CSD, the second generation panel unit root test is used—the Pesaran CIPS test (2007), which allows for CSD. The results of the Pesaran CIPS test for variables in the level and at the first difference in the model with the constant are shown in
Table 1 (panel b). The panel unit root tests fail to reject the null hypothesis of the non-stationarity of the variable at the 5% significance level, meaning that the variables fdi and efec are non-stationary in the levels. Therefore, in the next step, the stationarity of first differences is tested, and the results show that all variables are stationary in first differences.
The next step in the procedure implies cointegration analysis. Since both variables are integrated at order 1, the Westerlund cointegration test is implemented because it allows the existence of CSD in the model. The null hypothesis of no cointegration, against the alternative hypothesis, cointegration existence between non-stationary variables, is estimated. The results based on the Westerlund test show that the null hypothesis of no cointegration has to be rejected, meaning that FDI and the EATR are cointegrated (
Table 1, panel c).
The estimated homogeneous coefficients obtained using the PMG estimator are given in
Table 2. It is observed that a significant long-run relationship exists between the FDI inflow and the EATR dynamic (0.8826) in the period 1998–2021. The homogeneous estimates confirm the long-run relationship, since the error-correction parameter is significant and negative, showing the speed of adjustments towards the long-run equilibrium. It is concluded that each year 51.97% of the EATR dynamic is corrected towards the equilibrium. A similar result is provided by the MG estimator in the context of the error-correction parameter, although the long-run equilibrium is not significant in the MG model. However, the PMG model is detected as efficient using the Hausman test, and therefore the dynamic of the heterogeneous adjustment coefficient is analyzed using the PMG estimator heterogeneous coefficient (
Table 3).
The estimated homogeneous coefficients obtained using the PMG estimator are given in
Table 2. It is observed that there exists a significant long-run relationship between FDI inflow and EATR dynamics (0.8826) in the period 1998–2021. The homogeneous estimates confirm the long-run relationship, since the error-correction parameter is significant and negative, showing the speed of the adjustments towards the long-run equilibrium. It is concluded that each year 51.97% of EATR dynamics is corrected towards the equilibrium. A similar result is provided by the MG estimator in the context of the error-correction parameter, although the long-run equilibrium is not significant in the MG model. However, the PMG model is detected as efficient using the Hausman test, and therefore the dynamic of the heterogeneous adjustment coefficient is analyzed using the PMG estimator heterogeneous coefficient (
Table 3).
The main advantage of heterogeneous panels is estimates of each emerging EU economy in the context of error-correction parameters. The error-correction term, indicating correction towards long-run equilibrium, is significantly negative in Bulgaria, the Czech Republic, Estonia, Croatia, Latvia, Lithuania, Malta, Poland, Slovenia and Slovakia. The highest coefficient is detected in the Czech Republic, meaning over-correction, since the value is higher than 1. Therefore, the speed of adjustment towards equilibrium is highest in Estonia, meaning that this small open economy using tax competition in the context of the EATR has succeeded in attracting FDI, converging towards equilibrium. On the other hand, the error-correction parameter is not significant in Cyprus, Hungary and Romania. The reason in the case of Cyprus can be found in the extremely high FDI inflow in the period from 2009 to 2015, achieving values of FDI inflow of 280% of GDP, which can not only be related to the lowering of the EATR. The high fluctuation of FDI inflows in Hungary parallel to the constant lowering of the EATR did not lead to a long-run relationship.
We could conclude that on average in the emerging EU economies, a long-run equilibrium relationship exists between the EATR and FDI, while adjustments towards equilibrium are heterogeneous in the context of speed and existence, namely in Cyprus, Hungary and Romania; that kind of adjustment is not confirmed.
Hypothesis (H2) is oriented towards the assumption that the speed of the adjustment to a long-run relationship between FDI inflow and the EATR is faster in emerging EU economies for the period 2004–2021 due to joining the EU. We repeated the whole procedure of estimation for the subsample of the 13 emerging EU economies for the period 2004–2021: (i) the results of the Pesaran CD test showed the existence of CSD in the subsample for the variables
fdi’ and
efec’ (
Table 1, panel a); (ii) the Pesaran CIPS test indicated stationarity in first differences for variables (
Table 1, panel b); (iii) Westerlund cointegration confirmed cointegration between
fdi’ and
efec’ (
Table 1, panel c); (iv) using the PMG and MG estimates, the Hausman test showed that the preferred specification is PMG (
Table 2). According to the results of the homogeneous coefficients, the long-run relationship between the variables
fdi’ and
efec’ is significant, while the average (homogeneous) error-correction parameter is higher in comparison to the whole sample; namely, the average speed of adjustment is 0.5745 for the period 2004–2021, while it is 0.5127 for the period 1998–2021 (
Table 2). This result indicates that accession to the EU contributed to a faster achievement of the equilibrium relationship between FDI inflow and the EATR in the emerging EU economies. More precisely,
Table 3 shows the dynamic of adjustment speed in each emerging EU economy. It is obvious that in almost all the economies higher values for the error-correction parameter are estimated. In Slovakia, the biggest increase in the error-correction parameter is noted, from 55.45% of adjustment in one year for the sample 1998–2021, to 77.94% in one year after joining the EU. On the other hand, in Malta and Lithuania the decrease in the error-correction parameter is identified after accession, while in Cyprus, Hungary and Romania the error-correction parameters are still insignificant.
5.2. Robustness Check
A robustness check of the results was undertaken using changed methods of estimation. We used the Dynamic Fixed Effects (DFE) model, since that method is appropriate for the analyzed sample. Although the DFE estimator restricts the coefficients of the cointegrating vector to be equal across all the panels, for example the PMG estimator, the DFE model also restricts the speed of the adjustment coefficient to be equal [
44].
Similar to the results of the PMG estimation, according to the homogeneous parameters in the DFE model, the error-correction parameters are significant and negative showing adjustments towards long-run equilibrium. Once again, in both samples the error corrections estimated by DFE are significant, but in the period 2004–2021 are higher (
Table 4). Although the same dynamic of adjustment is noted, the magnitude of the adjustments is slightly lower in the model estimated by the DFE estimator in comparison to PMG (42.03% against 51.97% in the period 1998–2021, while 48.02% against 57.45% in the period 2004–2021). Moreover, between the PMG and DFE estimators, the Hausman test indicates that PMG is preferred over the DFE model.
The robustness check using the DFE method of estimation showed that in the homogeneous part of the model the same relationship was significant, with the same sign and similar influence for the average of emerging EU economies. Hence, we could claim that the results are stable in both samples across different estimators.
5.3. FDI Inflow Determinants—Panel-Corrected Standard Error (PCSE) Estimator Results
In the previous analysis, we concluded that the variable FDI inflow (fdi and fdi’) and EATR (efec and efec’) are nonstationary and cointegrated, and that the sample is heterogeneous, containing cross-section dependence. In this part of the paper, the focus of the analysis is on the potential determinants of FDI in the period 2004–2021 for 13 emerging EU economies; therefore, the properties of those new variables in the analysis need to be checked. The same procedure is implemented in order to find out whether those variables are stationary and whether cross-section dependence exists in the data.
The results of the Pesaran CD test are presented in
Table A2 (Appendix, panel a), which shows that the null hypothesis of cross-section independency has to be rejected in all variables. In the next step, the Pesaran CIPS panel unit root tests fail to reject the null hypothesis at a 5% significance level (
Table A2, panel b), meaning that all the variables are non-stationary. In the next step, the stationarity of first differences is tested, and the results show that the variables are stationary in first differences with optimal lag length 1 (Akaike information criteria).
Due to the detected problem of the nonstationarity of variables and cross-section dependence in the variables, classical panel methods are limited. However, Beck and Katz [
50] recommended the use of the Panel-corrected standard errors (PCSE) estimator, which allows for heteroskedastisity, autocorrelation and contemporaneous correlation across panels. Due to the detected problems of autocorrelation (Wooldridge test, BFN-DW, Baltagi-Li), heterokcedasticity (Wald test) and cross-section dependence (Pesaran CD test), a robust estimator, the PCSE estimator, is implemented based on Equation (4). The problem of nonstationarity is solved using the transformation of all the variables in terms of first differences (we add prefix “d” in order to emphasize the first difference of the variable).
Table 5 represents only the significant variables in the model: the EATR, GDP per capita, business environment variables and dummy variables representing outliers. It is expected that the reduction of the EATR provides FDI inflow, which is confirmed in the PSCE model with the negative sign and significant variable
defec. Otherwise, an increase in the EATR would mean a reduction in the FDI inflow. The GDP per capita effects FDI positively; namely, an increase in variable
dgdp promotes FDI inflow. Moreover, the business environmental variable “corruption” is significant in the model, showing a positive relationship with the FDI inflow; namely, each increase in the corruption index in the emerging EU economies increases the FDI inflow. On the other hand, the variables related to interest rates (short-run or long-run) are not significant in the model, as well as variables representing the level of competition. Namely, competition is already obtained in the model by the EATR, and therefore the variable competition index is not significant.
The extremely high FDI inflow in the period 2004–2008 is captured by the dummy variable for Malta, while the dummy variable for Hungary captures outliers in the years 2015 and 2016 in the context of an intensive reduction of the EATR. The variables
dummy_H and
dummy_M are significant in the model, showing that the reduction of taxes influenced inversely on FDI. Negative FDI inflow in Hungary is detected in 2015 and 2016, and further, Hungarian policymakers reacted with a sharp corporate tax reduction in 2017 from 19% to 9%, and consequently on the EATR. Although constant lowering of the EATR in Hungary is present, a high fluctuation of FDI inflows was identified, and therefore did not lead to a long-run relationship in PMG (
Table 3) and represents an outlier in the PSCE model (
Table 5). Similar to the case of Cyprus in the PMG model with an extremely high FDI inflow in the period 2009–2015, the increase in Malta’s FDI in the period 2004–2008 could not be related only and dominantly to the EATR reduction.
The findings represented in
Table 5 might be interpreted as an acceptance of Hypothesis (H3) that the negative link between the EATR and FDI inflows is significant, and that variable EATR, GDP per capita, corruption index and the effects of global crisis are significant for decisions on investment allocation in the emerging EU economies.
6. Conclusions
Changes in the EATR and their impacts on FDI influx have been an important topic of debate amongst academics and policymakers, since there are divided opinions as to whether or not to pursue further corporate tax coordination against harmful competitiveness in the EU. This research contributes to the literature that analyzes the impacts of EATR changes on FDI localization by focusing on the emerging EU economies that typically have lower corporate tax rates and EATR in comparison to developed EU countries. The main findings of the paper can be summarized as follows: (i) The results of the dynamic panel models (PMG estimator) based on thirteen emerging EU economies for the period 1998–2021 show that a significant long-run relationship between EATR dynamics and FDI inflow exists [
8]. Thus, speed of adjustment towards equilibrium is heterogeneous; in Estonia it is the highest, meaning that this small open economy using tax competition to lower the EATR has succeeded in attracting FDI, converging towards equilibrium. On the other hand, in Cyprus, Hungary and Romania that kind of adjustment is not confirmed. (ii) Using the PMG estimator for the period 2004–2021, it is confirmed that accession to the EU contributed to the faster achievement of an equilibrium relationship between the EATR and FDI influx in almost all the emerging EU economies due to easier capital, labor, goods and services movement between members [
2]. Namely, Slovakia noticed the biggest increase in adjustment in one year after joining the EU compared to the sample 1998–2021, while Malta and Lithuania experienced the opposite result. Additionally, the long-run relationships in Cyprus, Hungary and Romania are insignificant. (iii) The Dynamic Fixed Effects (DFE) model is implemented as a robustness check since that method restricts the coefficients of the cointegrating vector to be equal across all panels, as well as restricting the speed of the adjustment coefficient to be equal. The DFE model confirmed the conclusions based on the PMG model, since the results show there are adjustments towards long-run equilibrium. However, the Hausman test indicated that PMG is preferred over the DFE model. (iv) Significant variables were also included in the PCSE model (EATR, GDP per capita, interest rates, business environment variables and dummy variables representing outliers). The PSCE model confirmed that a decrease in EATR generates FDI inflow, while GDP per capita effects FDI positively. Moreover, FDI inflow is positively influenced by the ‘corruption index’ as a business environmental variable since an increasing corruption index in emerging EU economies increases FDI inflow. Two dummy variables show that the reduction of taxes influenced FDI inversely. Namely, although in Hungary EATR cuts are present, a high fluctuation of FDI inflows is identified, and therefore a long-run relationship in PMG is not detected, representing an outlier in the PSCE model. The results for Cyprus and Malta could not be related only and dominantly to EATR reduction.
To sum up, the empirical analyses in the paper showed that tax competition in the emerging EU economies exists and is oriented towards FDI inflow. The downward pressures of the EATR were present during the period 1998–2021, meaning a race to a bottom, and moving away from tax coordination with the developed EU economies. Despite attempts by EU institutions to reduce harmful tax competition within the EU, most of the emerging EU economies have achieved considerable success by implementing the mentioned policy. Therefore, it is necessary for EU policymakers: (i) to further reconsider the harmfulness/advantages of tax competition in comparison to tax coordination, given that tax coordination can also negatively affect economies with lower tax rates [
24], while success in FDI attraction is confirmed in this paper; (ii) to examine whether downward pressures and the lowering EATR tendency in the observed period could be characterized as a possibility for tax coordination within the EU but at lower tax levels, in order to prevent a further race to a bottom defining a floor for tax competitiveness in the EU.


