Article

Techno-Economic Analysis of Photovoltaic Hydrogen Production Considering Technological Progress Uncertainty

1
College of Business, Nanjing University, Nanjing 210093, China
2
School of Public Finance and Taxation, Zhejiang University of Finance and Economics, Hangzhou 310018, China
3
International Joint Laboratory of Green and Low Carbon Development, Nanjing 211167, China
4
Nanjing Institute of Technology, Nanjing 211167, China
*
Author to whom correspondence should be addressed.
Sustainability 2023, 15(4), 3580; https://doi.org/10.3390/su15043580
Submission received: 23 December 2022 / Revised: 26 January 2023 / Accepted: 13 February 2023 / Published: 15 February 2023

Abstract

:
The application of photovoltaic (PV) power to split water and produce hydrogen not only reduces carbon emissions in the process of hydrogen production but also helps decarbonize the transportation, chemical, and metallurgical industries through P2X technology. A techno-economic model must be established to predict the economics of integrated PV–hydrogen technology at key time points in the future based on the characteristics, variability, and uncertainties of this technology. In this study, we extracted the comprehensive technical factors (including PV tracking system coefficient, PV conversion efficiency, electrolyzer efficiency, and electrolyzer degradation coefficient) of an integrated PV–hydrogen system. Then, we constructed a PV hydrogen production techno-economic (PVH2) model. We used the levelized cost of hydrogen production (LCOH) method to estimate the cost of each major equipment item during the project lifetime. We combined the PVH2 and learning curve models to determine the cost trend of integrated PV–hydrogen technology. We developed a two-dimensional Monte Carlo approach to predict the variation interval of LCOH for PV–hydrogen projects in 2030 and 2050, which described the current technology variability with variable parameters and the uncertainty in the technology advancement with uncertain parameters. The results showed that the most critical factors influencing LCOH are PV conversion efficiency and the capital cost of the electrolyzer. The LCOH of PV to hydrogen in China will drop to CNY 18–32/kg by 2030 and CNY 8–18/kg by 2050. The combination of a learning curve model and a Monte Carlo method is an effective tool to describe the current variability in hydrogen production technologies and the uncertainty in technological progress.

1. Introduction

Facing the increasingly serious environmental problems caused by the excessive emission of greenhouse gases in the world, China is striving to achieve carbon peaking by 2030 and carbon neutrality by 2060. The hydrogen produced by the electrolysis of water from photovoltaic power can be used as both a clean energy medium and an industrial raw material; through P2X technology, it can help the transportation, chemical, and metallurgical industries achieve decarbonization. Although the cost of PV hydrogen production is not yet competitive with that of traditional hydrogen production technology, with the development of PV and electrolyzer technology, the accumulation of learning experience, and the expansion of production scale, PV hydrogen production may gain cost advantages in the future and become one of the main avenues through which China’s carbon emission reduction targets will be achieved. Therefore, the following issues are of practical importance: identifying the characteristics of PV hydrogen production-related technologies, fully considering the variability in existing technologies and the uncertainties of technological progress and establishing a techno-economic model to predict the economics of PV hydrogen production projects at key time points in the future.
Solar energy has strong development prospects because it is clean and renewable [1]. Solar energy can be used in various ways, one of which is to generate photovoltaic power. Hydrogen is an advantageous clean energy source. As a result, numerous academics and research institutes worldwide are becoming interested in the generation of hydrogen energy powered by PV [2]. The system structure of photovoltaic hydrogen production is shown in Figure 1.
Future technological advances in PV–hydrogen production systems, such as perovskite solar cells (PSCs) and noble metal-free cocatalysts for enhanced photocatalytic H2 production [3,4,5], will play an important role in further reducing the levelized cost of PV hydrogen production. However, technological progress is uncertain, and we do not know how PV and electrolytic water hydrogen production technologies will develop in the future. Therefore, in this study, we introduced the concept of learning rate to predict the contribution of future technological advances to the reduction in the levelized cost of hydrogen production powered by PV systems using historical data from recent years.
The economics of photovoltaic hydrogen production systems have been extensively studied by many scholars. Norouzi (2022) reviewed many different methods of hydrogen production, including from fossil fuels and from renewable energy sources, reviewing and ranking these methods in terms of different aspects such as economic, social, environmental, energy, and sustainability of external energy. Based on the advantages and disadvantages of various hydrogen production methods, solar electrolysis, as a small-scale hydrogen production method, and thermochemical methods, for large-scale hydrogen production, were identified as the preferred methods [6]. Gondal (2018) estimated the potential of producing hydrogen from various established technologies from renewable resources in Pakistan and concluded that solar PV has an annual generation potential of 2.8 million tons of hydrogen, second only to biomass in terms of annual hydrogen production [7].
Grimm et al. (2020) conducted a techno-economic analysis of two solar-assisted hydrogen production technologies: a photoelectrochemical (PEC) system and its major competitor, a photovoltaic system connected to a conventional water electrolyzer (PV-E system). The LCOH of the off-grid PV-E system was USD 6.22/kg (H2), whereas the LCOH of the PEC system was much higher, at USD 8.43/kg (H2) [8]. Hosseini et al. (2020) discussed the ability of three electrolysis systems (i.e., alkaline water electrolysis (ALK), polymer electrolyte membrane electrolysis (PEM), and solid oxide electrolysis (SOEC)) to produce hydrogen coupled with solar systems and the advantages and disadvantages of each. They found that ALK was the most mature for integration with concentrated photovoltaic (CPV) systems [9].
Fereidooni et al. (2018) studied the economic feasibility and annual performance of a 20 kW photovoltaic power station located in Yazd City, Iran, and found, through both experimental studies and simulations, that the region is capable of generating electricity for hydrogen production [10]. Maggio et al. (2020) performed a techno-economic-financial evaluation of a system to be located in Messina (Italy) to produce green hydrogen to be sold as a feedstock for industries and research centers; they found that investment to construct a small-scale PV-based hydrogen production plant can be remunerative [11]. Peláez-Peláez et al. (2021) proposed constructing a hybrid PV fuel cell-based system with hydrogen as the energy carrier and performed a techno-economic evaluation of the system, concluding that although the cost of this system was relatively high at present, it would be technically feasible and, in the next few years, would also be economically viable [12]. Kalbasi et al. (2021) studied the exact potential of solar hydrogen production in Iran at different stations and clarified the suitability of using PV for hydrogen production in different regions of the country; the findings can help energy policy makers to create a strategic framework and roadmap for solar hydrogen production in Iran [13].
Qolipour et al. (2018) studied the technical-economic feasibility of establishing a hybrid PV–wind power plant to produce electricity and hydrogen using HOMER software for the Hendijan area in the southwest of Iran; they confirmed that the establishment of a hybrid plant in the area under study is possible [14]. Gökçek et al. (2018) conducted a techno-economic analysis of a hydrogen refueling station powered by two types of hybrid renewable energy generation systems (wind–photovoltaic-battery and wind–battery systems) to be installed in Gökçeada Island, Turkey. The analysis was performed using HOMER software to assess the feasibility of the hydrogen refueling station to refuel 25 vehicles per day throughout the year. Based on the results of the analysis, the levelized hydrogen costs for hydrogen refueling stations powered by hybrid wind–photovoltaic–battery systems and wind–battery systems were 8.92 and 11.08 USD/kg, respectively [15].
The key influences on the economics of PV–hydrogen production projects are a common concern of scholars. Longden et al. (2021) investigated the marginal impact of electricity costs, electrolyzer capital costs, and capacity utilization factors on the cost of hydrogen production and showed that electrolyzer units should share a site with renewable energy parks to use electricity that would otherwise be curtailed; when they operate during periods of low or negative grid prices, separate green hydrogen operations are commercially viable as renewable generation and electrolysis units continue to be curtailed [16]. Ahshan et al. (2021) evaluated the economic feasibility of using existing solar resources in the Sultanate for hydrogen production and conducted a sensitivity analysis, the results of which showed that electricity and capital costs were the most important factors influencing the future cost of green hydrogen production [17]. Yates et al. (2020) used the levelized cost of hydrogen (LCOH) to demonstrate the considerable potential of producing green hydrogen using off-grid photovoltaics, and identified system size, capital costs, and electrolyzer efficiency as the three most important drivers of LCOH using a Monte Carlo approach [18].
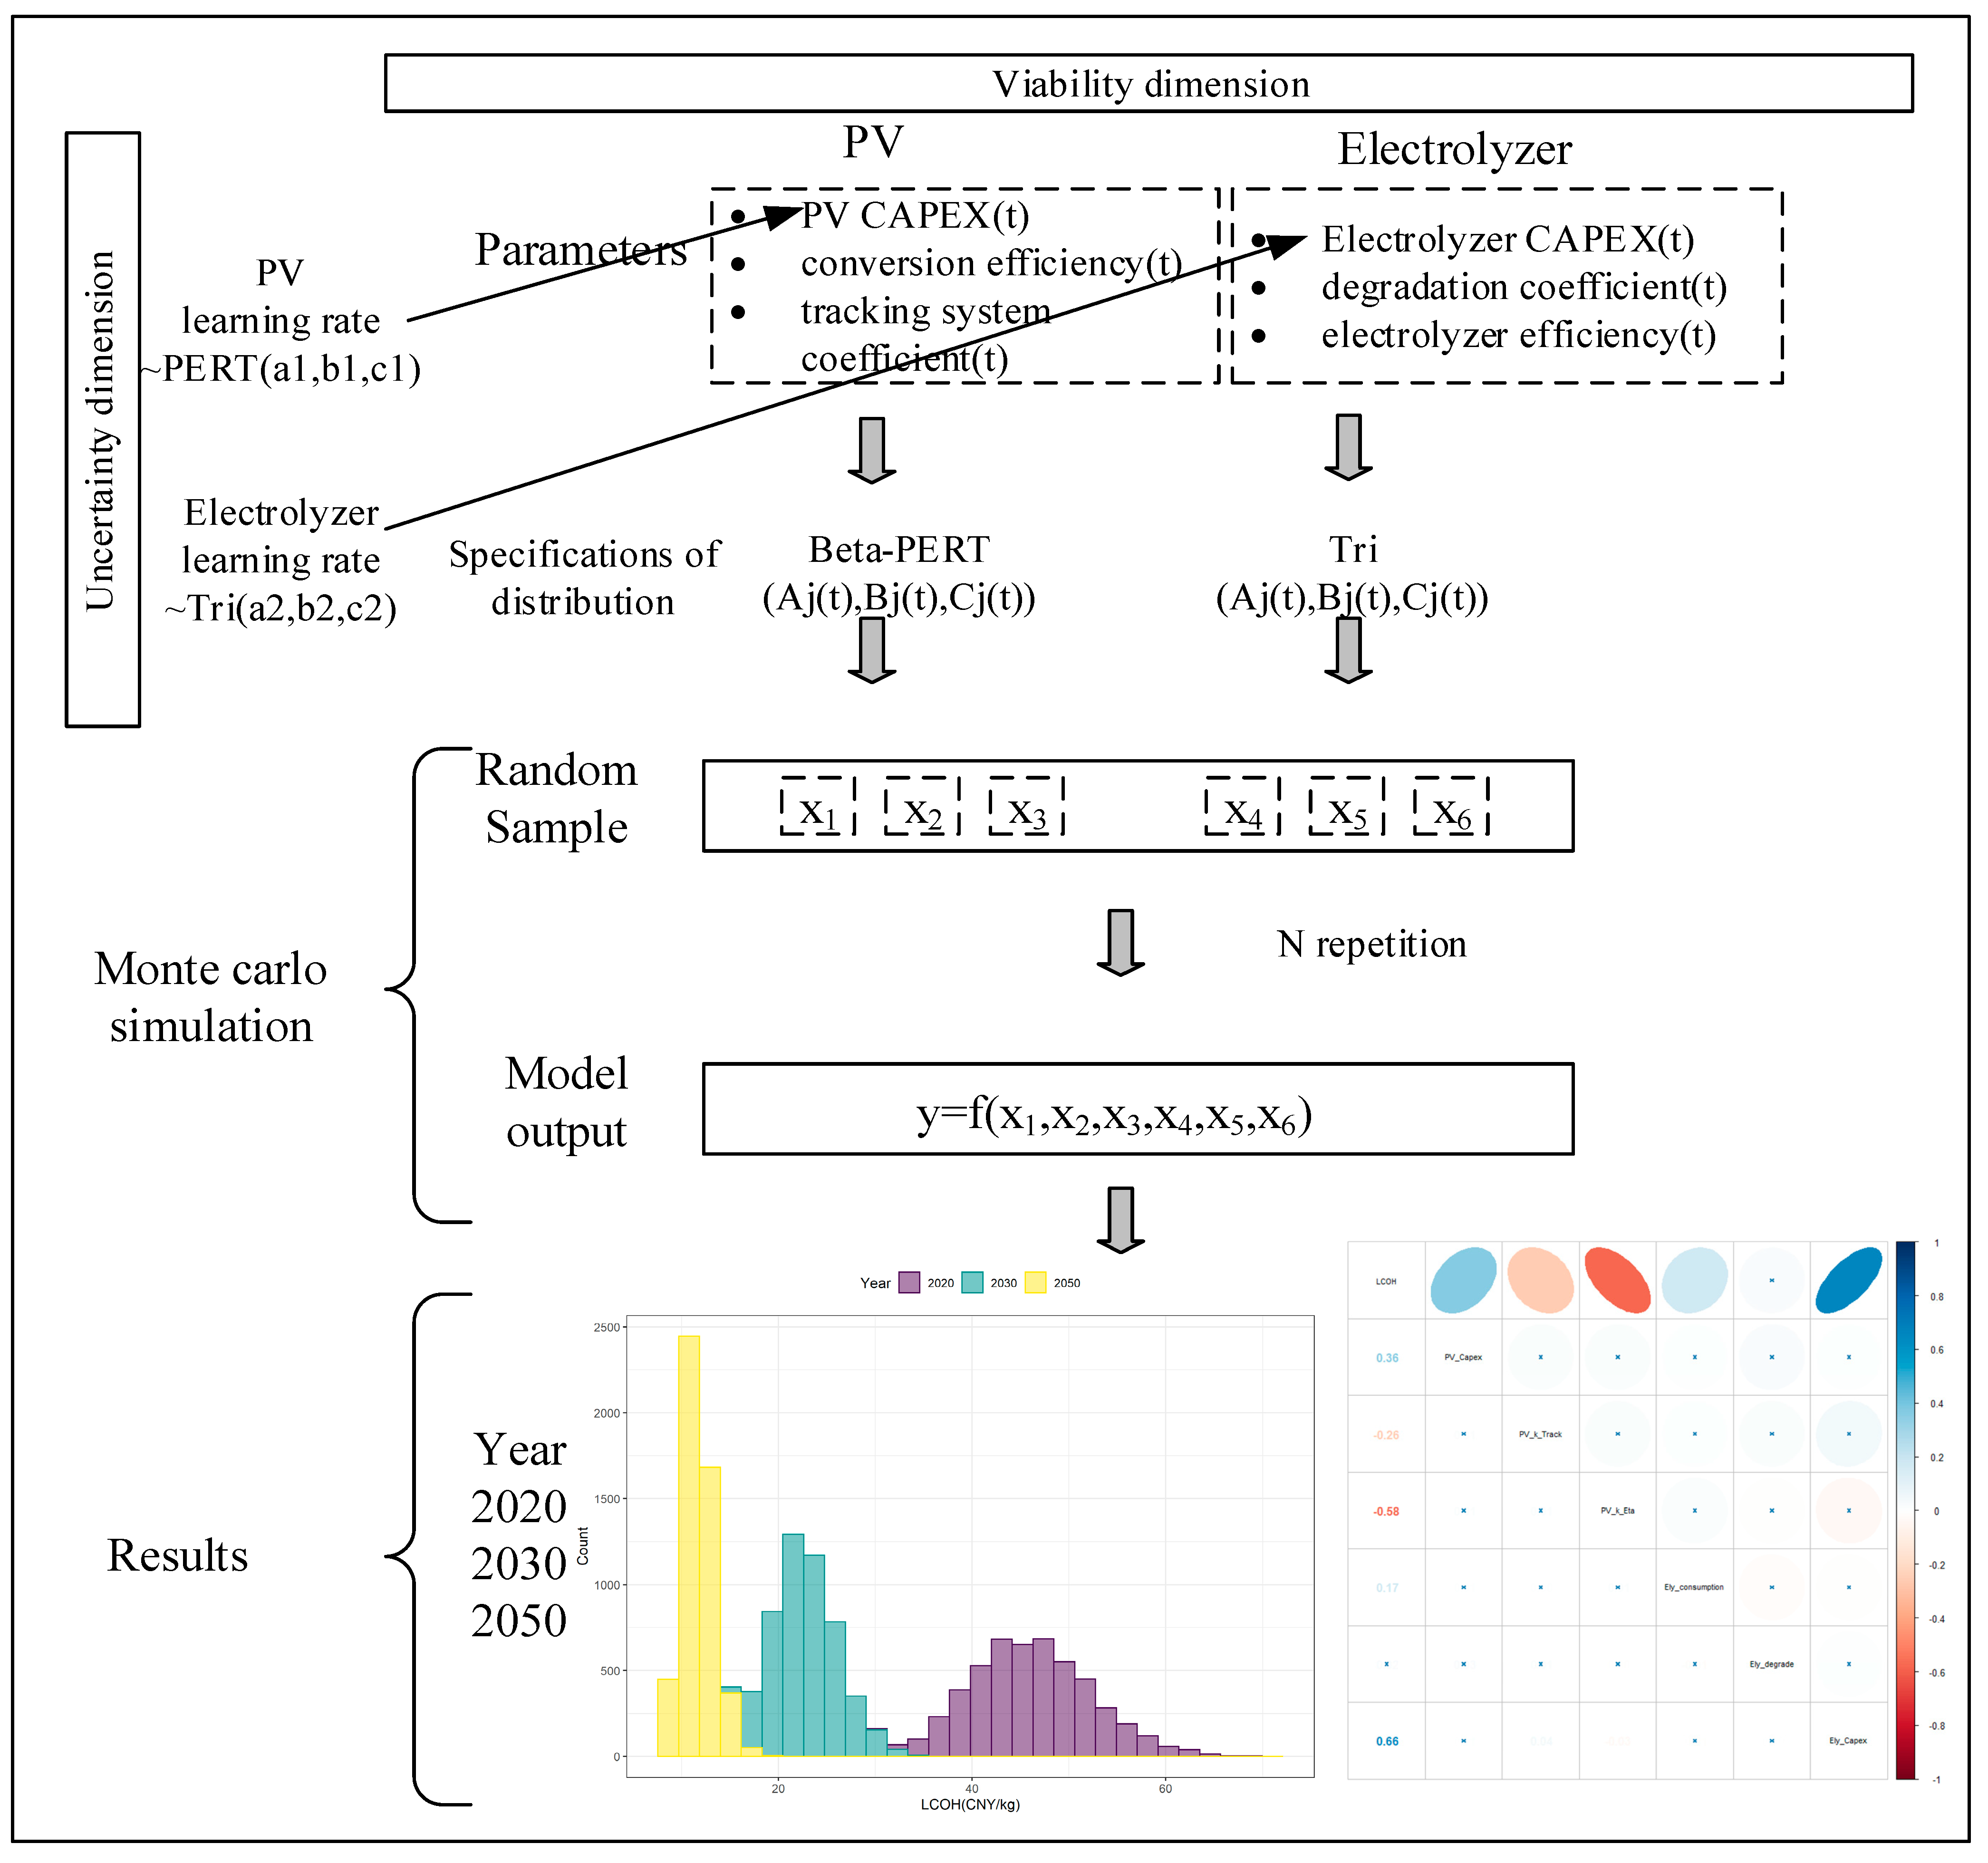
As the risks and uncertainties faced by real engineering projects that can affect the economics of the project are numerous, the Monte Carlo method is a tool commonly used for project uncertainty analysis. For complicated problems, Monte Carlo simulation generates random outcomes for probabilistic factors to imitate the randomness inherent in the original problem. As such, a solution to a rather complex problem can be inferred from the behavior of these random outcomes. Furthermore, in systems or processes where experimental testing is either impractically expensive or impossible, this methodological approach is widely used to examine hypothetical scenarios and perform what-if analysis [19]. Heck et al. (2016) calculated the levelized cost of electricity (LCOE) of seven generating technologies using a Monte Carlo method and investigated how location-based capacity factors (CFs) affect the LCOE of renewable technologies [20]. Geissman and Ponta (2017) used a Monte Carlo simulation approach to determine the LCOE of a nuclear and gas project and examined the effects of external expenses such as carbon intensity and tax on LCOE density functions [21]. Yates et al. (2020) created a Monte Carlo-based model to pinpoint the main causes of LCOH in five distinct off-grid standalone solar systems around the world [18]. Benalcazar and Komorowska (2022) established a Monte Carlo-based model to investigate the underlying economic and technical factors that impact the success of the Polish green hydrogen strategy, characterizing the local meteorological conditions of Polish NUTS-2 regions and comparing the levelized cost of hydrogen in such regions in 2020, 2030, and 2050 [22].
Advancements in technology and experience will lead to the reduction in project costs. The learning curve model is a tool commonly used to study this phenomenon. Santhakumar (2021) argued that internalizing technological change in energy system models substantially impacts the cost of climate policy actions based on the sources of learning used to describe technological processes [23]. To more accurately describe the technological change process, Kouvaritakis (2000) first proposed two-factor learning curves (2FCs). By using research and development (R&D) expenditures as a representative of the stock of knowledge as a second source of learning, a policy variable was introduced to the learning curve model [24]. Grubb (2002) stated that technological change should be modeled as a result of the interactions of other interrelated processes, such as government-funded R&D, private technology investment, and economy-of-scale effects [25].
In summary, by analyzing the existing studies, we found that the use of renewable energy to produce hydrogen is not only technically but also economically feasible, and has considerable potential in the future. However, many factors, including technological advancement and uncertainty, may affect the economy of specific PV–hydrogen projects at a certain time and place. By studying the different photovoltaic technologies and the methods of calculating power generation introduced by various scholars, and understanding the principles, characteristics, advantages, and disadvantages of different electrolysis technologies, we constructed a model of PV–hydrogen production systems in this study. Furthermore, to the best of our knowledge, researchers have not additionally considered the effects of project variability in the present and the uncertainty of future technological improvement on the economics of future projects. If we cannot distinguish between the variability of the parameters due to the differences in the level of technology and the price of services of the construction units in a particular season of a particular project at a particular location, and the uncertainty of the decrease in the cost of capital due to the technological progress and the accumulation of learning experience, effectively judging the trend in future project cost changes would be difficult. Using the traditional Monte Carlo method to set the optimistic values of important parameters as future possibilities does not describe the dynamic characteristics of project cost changes with technological progress; however, using learning curves only to portray the relationship between technological progress and cost decline cannot accurately describe the diversity and complexity of each key parameter in each time cross-section. Therefore, we need to establish an integrated framework that considers the diversity of cross-sectional parameters and the uncertainty in technological progress and the learning process to reasonably estimate the economics of engineering projects at key time points in the future, which can serve as a basis for policy makers and managers to judge the trend in the economic feasibility of the technology.
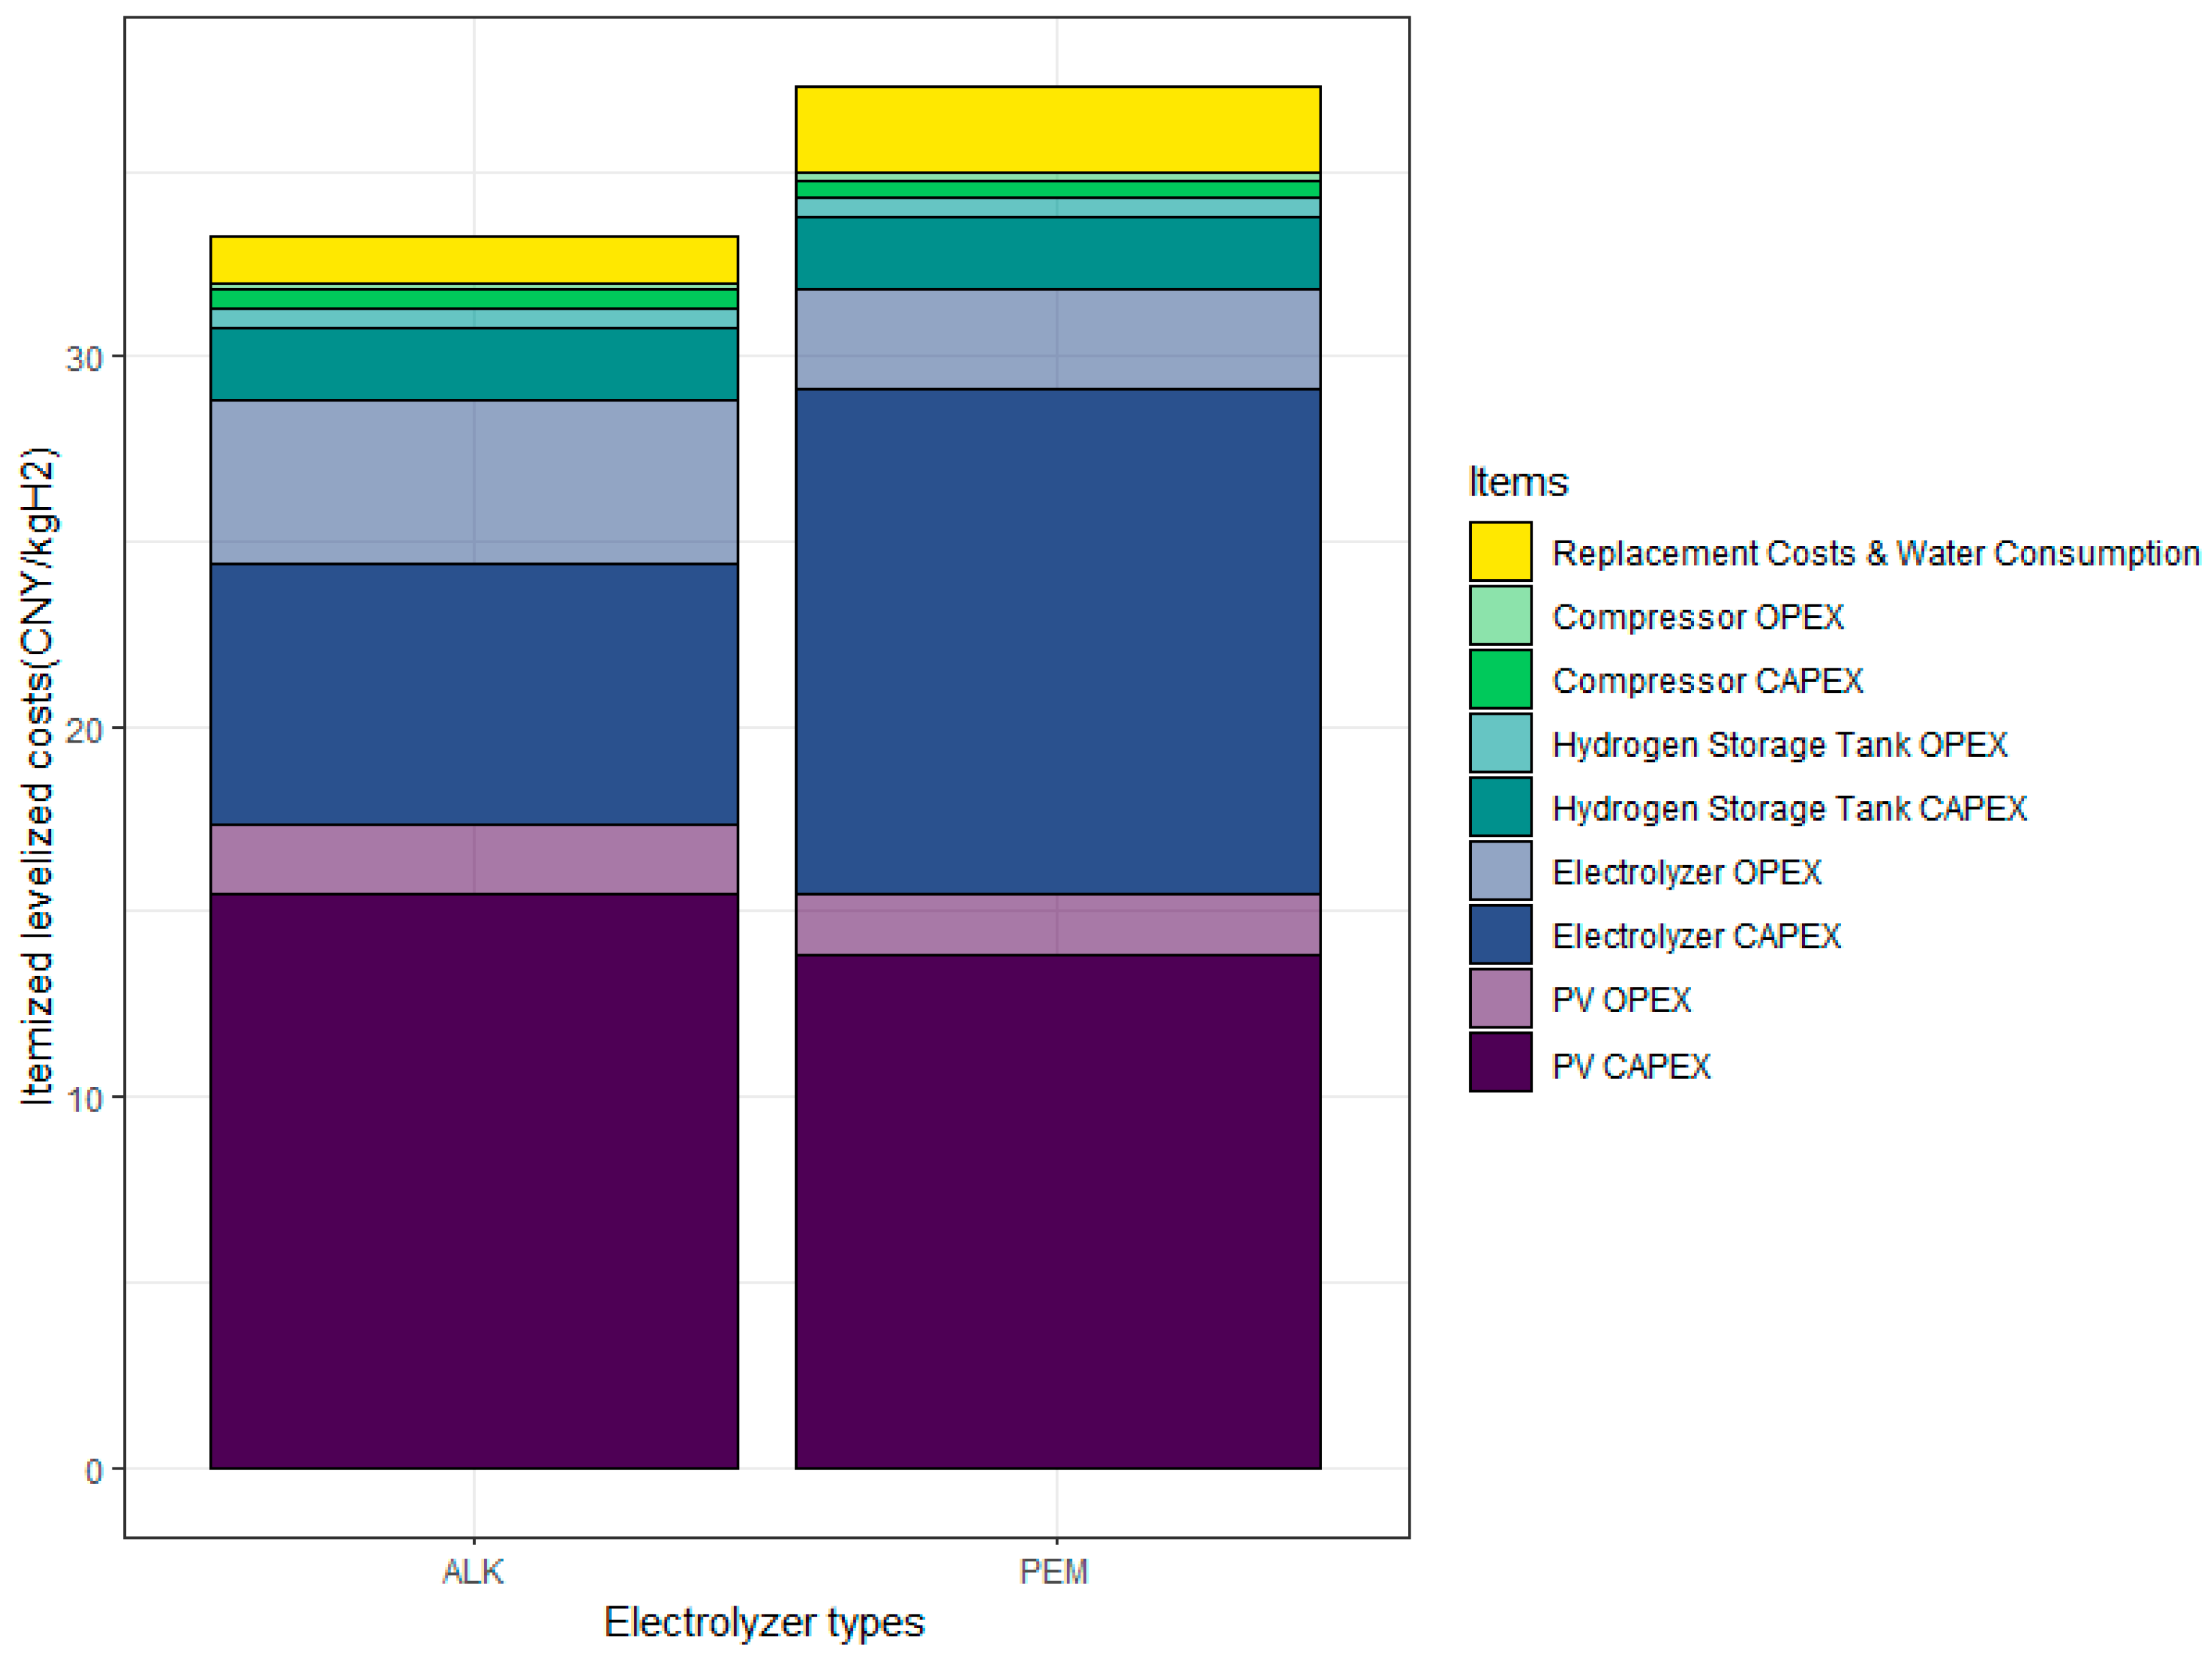
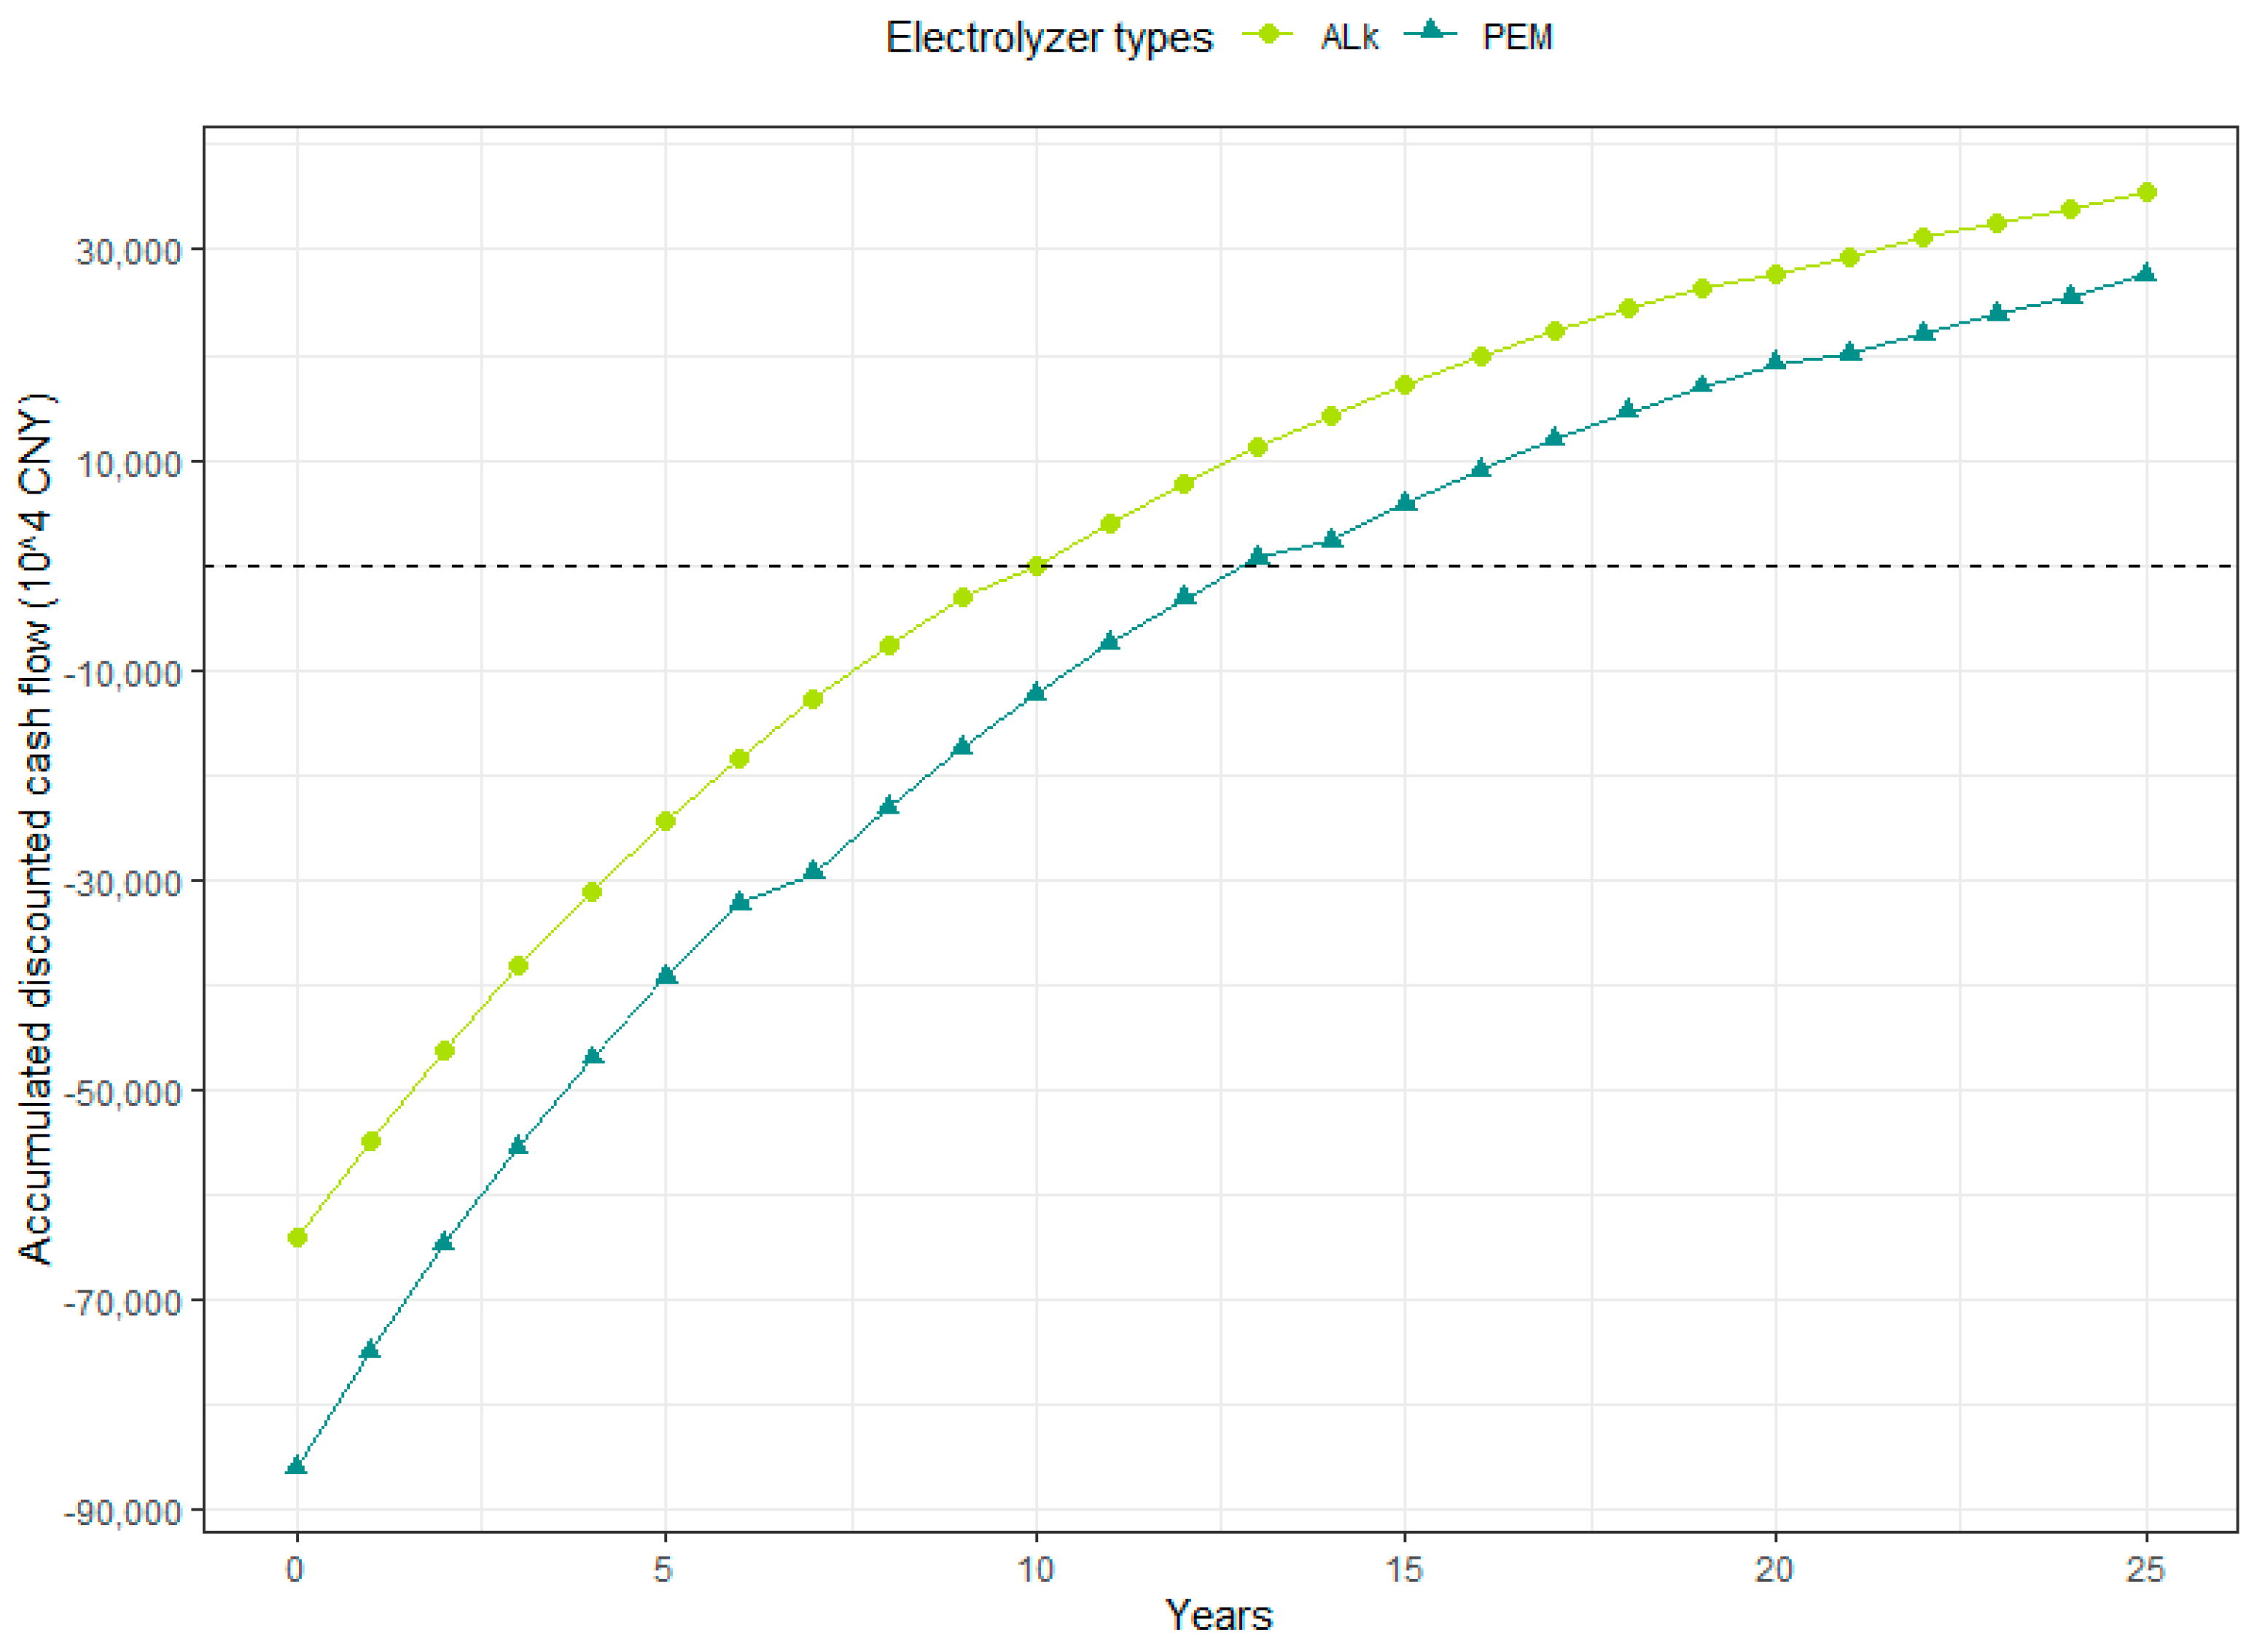
With the present study, we attempted to fill this gap and contribute to the literature in four dimensions. First, we developed a novel integrated approach that integrates learning curve and Monte Carlo methods to explore the impact of the current technological diversity and the deterministic and stochastic nature of the intrinsic link between technological progress and cost reduction on future project economics. Yates et al. do use the traditional Monte Carlo method to explore the main causes of LCOH in five distinct off-grid solar systems around the word; however, they did not consider integrating a mathematical model to portray the impact of technological progress and experience accumulation on project cost reduction, but only took the future values of economic and technical parameters as optimistic values of parameter distribution, so their model does not have the ability to predict the project cost at future points in time; other scholars use learning curves to study the relationship of cost reduction and technology advancement, but they hardly take into account the variability and diversity of costs of individual projects in the same time cross-section at the same time, so they can only obtain a point estimate that does not reflect the variability of future project costs. Our model takes both aspects into account, and we can obtain interval estimates of cost variability at future points in time that are closer to reality. Second, we identified key technical parameters that characterize the technological progress of PV hydrogen production systems: PV conversion efficiency, tracking technology coefficient, PV learning rate and electrolyzer degradation rate, hydrogen production efficiency, electrolyzer learning rate. While Yates et al. focus on the differences in the cost of hydrogen production in different locations around the world, and identify that system size, capital costs, and electrolyzer efficiency are the three most important drivers for LCOH, our study focuses on key technical parameters related to technology advancement that affect LCOH and finds that PV conversion efficiency and electrolyzer capital cost have the most critical impact on the LCOH of PV–hydrogen projects. This result is a reminder that although the technological development of hydrogen production from electrolytic water will effectively reduce the cost of hydrogen production, the increase in photovoltaic conversion efficiency brought by emerging photovoltaic materials such as perovskite cells will significantly reduce the cost of PV-hydrogen production. Third, we found that although PEM hydrogen production is a promising technology, the cost of PEM hydrogen production is still higher than that of ALK hydrogen production in China. Fourth, the findings provide invaluable insight for researchers and policymakers on the future trajectories of PV-powered hydrogen production cost in China, which will help the regional development of a green hydrogen economy and with meeting China’s carbon neutrality target for 2060.
The remainder of this paper is organized as follows: Section 2 presents the system description and components, describes a combination of the two-dimensional Monte Carlo approach and the learning curve approach employed in this study, and the model used to examine the economic performance of PV–hydrogen projects in China. In Section 3, the characteristics of a PV–hydrogen project in China, main assumptions, and data sources are described. In Section 4, we present and compare the results of the different future scenarios. Finally, Section 5 concludes the paper.

2. Materials and Methods

2.1. PVH2 Model

2.1.1. PV

Many factors affect PV power generation, mainly solar radiation, sunshine hours, system efficiency, solar panel tilt angle, wind speed, temperature, and humidity. Among them, the most important factor affecting PV power generation is solar radiation. In addition, various methods can be used to calculate PV power generation, and all of them are related to solar radiation. In this study, we developed a modified version of the standard method.
Based on the solar resource status of the area in which the PV plant is located, we performed the calculation after considering many factors such as PV plant system design, PV square arrangement, and environmental conditions. The formula for calculating the annual power generation of a PV power plant is shown in Equation (1) [26].
E P = H A × P E S × C × K
where E P is the annual power generation, kWh; H A is the total horizontal solar radiation, kWh/m2; P is the installed PV capacity, kW; E S is the irradiance under standard conditions, taking the constant 1 kWh/m2; C is the tilted surface radiation coefficient, generally taking the value of 1.05 to 1.15; K is the comprehensive efficiency coefficient. K is affected by a variety of factors, including inverter efficiency, collector line loss, step-up transformer loss, light use rate, PV module surface pollution correction factor, etc. In general, the value of K is 75% to 85%.
Traditional PV power plants use fixed mounting technology to set an optimal tilt angle based on local solar irradiation to obtain the maximum solar radiation and thus increase power generation. Currently, a tracking system to adjust the solar panel orientation is the best choice for PV power plants to reduce power generation costs and improve overall efficiency. Tracking systems can be divided into dual-axis, flat single-axis, and oblique single-axis systems according to the adjustment angle of the bracket. The earliest dual-axis tracking method on the market, which tracks both east–west and north–south directions, can increase power generation by more than 30% compared with fixed brackets. However, due to its large footprint and two independent power actuators, the system requires a large number of motors, which is expensive and has a high failure rate. Therefore, the power stations gradually started to adopt single-axis tracking systems, abandoning the north–south tracking and only tracking east–west. Especially in linked single-axis tracking systems, compared with independent single-axis tracking, the use of synchronous linkage technology requires more components driven by a single system and fewer motors, which reduces costs and improves reliability. At present, the linked flat single-axis tracking system products are mature and their performance is stable, so these systems are ready for large-scale use. In large PV projects, the use of linked flat single-axis tracking systems can increase power generation by 10–25% and reduce the cost of electricity by more than 10% compared with the fixed type.
The conversion efficiency of photovoltaic cells is also an important factor affecting photovoltaic power generation. Currently, many countries are conducting research and development, attempting to increase PV conversion efficiency as quickly as possible, especially using perovskite solar cells. In 2009, Tsutomu Miyasaka first used perovskite solar photovoltaic cells to generate electricity, and the electrical energy conversion efficiency was only 3.8%. Ten years later, in 2019, the electrical energy conversion efficiency of erovskite solar cells had been increased to 25%. By November 2021, Helmholtz Zentrum Berlin (HZB) had developed a perovskite tandem cell with a conversion efficiency of 29.8%, setting the record for perovskite cells and exceeding the efficiency limits of crystalline silicon technologies such as heterojunction and tunnel oxide passivated carrier selective contacts (TOPCon). The theoretical efficiency limit of crystalline silicon solar cells, perovskite single-layer cells, crystalline silicon/perovskite double-node stacked layer cells, and three-node layer cells is 29.43%, 31%, 35%, and over 45%, respectively [27].
Therefore, we introduced the tracking system coefficient T r and PV conversion efficiency coefficient η 1 to consider the effects of these two technologies on PV power generation. We set the values of T r to 1 to 1.25 and η 1 to 0.89 to 1.39. The modified power generation equation is shown in Equation (2).
E P = H A × P E S × C × T r × η 1 × K

2.1.2. Electrolyzer

Considering the degradation of electrolyzers, we introduced the parameter of the annual multiplier of the power consumption of the cell to show the effect of the degradation of the cell on its power [18]. Its calculation formula is shown in Equation (3).
D ( n ) = ( 1 + d ) ( n 1 )
where D ( n ) is the annual multiplier of power consumption of the electrolyzer; d is the degradation factor of the electrolyzer; and n is the number of years.
Then, the formula for calculating the power consumption of electrolytic water for hydrogen production is:
E c _ h = m i n [ E p _ h , E R × D ( n ) ]
where E c _ h is the hourly power consumption of the electrolyzer, kWh; E p _ h is the hourly power generation of the PV plant, kWh; E R is the rated power of the electrolyzer, kWh. There are two main ways to calculate the hourly power production E p _ h of a site-specific PV plant. One way is to calculate the hourly power production based on meteorological data (including irradiance, temperature, wind speed, etc.) for a typical meteorological year. The other method is to use the historical data of power generation from the existing PV plants at the site with a sampling period of 10 or 15 min, and aggregate them into hourly power generation. The former approach has been adopted by many scholars, the professional PV plant design software PVsyst, and hybrid power system modeling software HOMER. Yates gives all the specific formulas in the xlm file in the supporting material of his paper. We also use the former approach but did not use Yates’ formulas because of the difficulty in obtaining the data items required for its collection. Instead, we used the PV design aid software Meteonorm to calculate the hourly irradiance by inputting the latitude, longitude, tilt, and azimuth of the site, and then used Equation (2) to approximate the hourly power production of the PV plant. It can be calculated by replacing H A in Equation (2) with the hourly horizontal irradiation.
The electrolyzer capacity factor K E C is introduced, and its calculation formula is shown in Equation (5) [18].
K E C = E c _ h E R × D ( n )
The minimum capacity of the electrolyzer is assumed to be K m i n . The hourly hydrogen production of an electrolyzer, Q H 2 _ h , is calculated by Equation (6) [18].
Q H 2 _ h = { E c _ h × η 2 D ( n ) ,   i f   K E C > K m i n     0       ,   i f   K E C K m i n
where η 2 is the conversion efficiency of the electrolyzer, kg/kWh. Once the hourly hydrogen production is known, the annual hydrogen production can be obtained by addition.
The common electrolyzers are alkaline (ALK), proton exchange membrane (PEM), and solid oxide (SOEC) electrolyzers. The ALK electrolyzers have the longest stack life and the highest production rate, but they have the lowest electrolysis efficiency of approximately 70% and the highest energy consumption. The PEM electrolyzers have the shortest cold start time and the highest purity of hydrogen output, but their production rate is low. The SOEC electrolyzers have the highest efficiency and low energy consumption, but they have the shortest stack life so they need frequent replacement, and the technology is not yet mature. In this study, we focused on PEM electrolyzer technology for PV–hydrogen production facilities due to its high flexibility, efficiency, and compact design [28].

2.1.3. Factors Affecting Technological Advancement of PV-Powered Hydrogen Production

The economics of PV–hydrogen projects can be affected by a variety of technological advancement factors, which can be analyzed in terms of both PV power and electrolytic conversion of water to hydrogen.
In PV power plants, the PV power generation module mainly includes a PV array, an inverter, an irradiation tracking device, a controller, a sink box, and a power distribution device. The maximum efficiency of the inverter can reach 99%; the controller, sink box, and distribution device technology are also matured; the technology to improve the size is limited. At present, increasing the efficiency of PV module conversion has been the key research focus of various countries and enterprises. In addition, PV tracking technology has rapidly developed in recent years, from fixed brackets to dual-axis tracking systems, and to more economical single-axis tracking system; PV power generation is gradually improving. With the increase in PV cumulative installed capacity, these advances in PV technology will lead to the decrease in the capital cost of PV units, which will directly affect the cost of investing in PV hydrogen production projects, and therefore the economic benefits of these products.
For electrolytic hydrogen production modules, the electrolytic water hydrogen production system mainly includes an electrolyzer, a hydrogen storage tank, a compressor, a power distribution device, and an auxiliary control system. The main technical innovations have focused on electrolyzers, with the current research hotspot being PEM electrolyzers. This technology is characterized by high current density, low energy consumption, high hydrogen production pressure, adaptability to the fluctuations in renewable energy generation, compact size, and providing the basic conditions for industrialization and scale development. The hydrogen conversion efficiency of the electrolyzer directly affects the amount of hydrogen produced. The degradation rate of the electrolyzer is related to how quickly the hydrogen production performance decreases and how many times the stack is replaced during the life of the project. As with PV, the unit capital cost of an electrolyzer decreases as the cumulative installed capacity increases.
Therefore, we focused on the impact of six factors, including PV conversion efficiency, tracking technology, learning rate, electrolyzer hydrogen production efficiency, degradation rate, and learning rate, on the economics of PV hydrogen production systems.

2.2. Study Hypothesis

We set different values for parameters such as the stack replacement cycle, energy consumption, degradation rate, and operating interval according to the technical performance of the two electrolyzers. The assumptions commonly associated with the economic benefit analysis of PV–hydrogen projects are shown in Table 1.

2.3. Economic Indicators of PV–Hydrogen Production Systems

2.3.1. LCOH

We used the levelized cost of hydrogen production (LCOH) in this study to assess the economics of hydrogen production. The LCOH is the total life-cycle cost of a PV–hydrogen production project divided by the total life-cycle hydrogen production, which includes the initial investment, operation, and maintenance costs, and considers the time value of money and the influence of the salvage value of fixed assets. The LCOH is calculated as:
L C O H = C A P E X V R ( 1 + r ) T + n = 1 T A n + E n + C R ( 1 + r ) n n = 1 T Y n ( 1 + r ) n
where CAPEX is the initial investment, V R is the salvage value of fixed assets, A n is the operating cost in year n, E n is the energy consumption cost in year n, C R is the electrolyzer replacement cost, Y n is the hydrogen production volume in year n , T is the project life cycle, and r is the discount rate, which is generally taken as the benchmark rate of return [32].

2.3.2. Net Present Value (NPV) and Internal Rate of Return (IRR)

The net present value is the difference between the cash inflows and outflows of an investment project. An investment is feasible only if the revenue of the investment project is greater than or at least equal to its cost, i.e., the NPV is greater than zero. The NPV of a PV–hydrogen project is calculated as shown in Equation (8) [32]:
N P V = n = 1 T B n C n ( 1 + r ) n
where N P V is the net present value; T is the project life cycle; B n is the cash inflow in year n ; C n is the cash outflow in year n ; and r is the discount rate.
The internal rate of return is also an important economic evaluation index, which is defined as the discount rate when the N P V is equal to 0. The formula for calculating the I R R of internal rate of return is shown in Equation (9) [32].
n = 1 T B n C n ( 1 + I R R ) n = 0
If the internal rate of return is greater than the benchmark rate of return, the program is feasible; the higher the internal rate of return, the better the program.
The payback period can be divided into static and dynamic payback periods. The static payback period refers to the time required to recover the entire investment with the net income of the project without considering the time value of money. The dynamic payback period considers the time value of money, and the payback period is calculated after discounting the net cash flow of each year into the present value at the benchmark rate of return. The dynamic payback period is the year in which the cumulative present value of net cash flow is equal to zero, and its calculation formula is shown in Equation (10) [32].
T d = t 1 + | n = 1 t 1 B n C n ( 1 + r ) n | B t C t ( 1 + r ) t
where T d is the dynamic payback period and t is the year when the cumulative N P V is greater than zero for the first time.

2.4. Uncertainties in PV–Hydrogen Production Systems

The economics of PV–hydrogen projects can be affected by a variety of technological advancement factors, which can be analyzed in terms of both PV power and the electrolytic conversion of water to hydrogen.
PV–hydrogen projects are inherently subject to a number of uncertainties, especially as certain technologies have not yet achieved large-scale application, which can affect the economics of the project. Uncertainties regarding future technological advances mainly include the possibility of future performance improvements or further cost reductions for some key technologies. Therefore, the uncertainties in the relatively small amount of detailed data that can be obtained about the technologies are currently large. To illustrate the potential impact of these uncertainties, in the next study, we identified the uncertainty indicators to be considered in the project, and we analyzed sensitivity to determine the extent of their impact on the economic benefits.
In this study, based on existing studies, we considered the uncertainties of technological progress, and the relevant factors are summarized in Table 2.

2.4.1. Learning Curve

Uncertainty in technological progress largely stems from people not having a clear understanding of the stage of technological development. We do not know how the conversion efficiency of PV solar panels will be improved and how the electrolyzer hydrogen production technology will develop in the future. However, these predictions can be performed by constructing learning curve models to derive the future decreasing trend in PV unit installed cost as well as electrolytic water hydrogen production cost. Therefore, learning curve models can be used to predict the future trend in technological progress in response to the uncertainty of technological progress.
The learning curve model, also known as an experience curve, means that the cost per unit of a product decreases in proportion to its cumulative output. At present, the learning curve model has been used to predict the future trend in unit investment cost of PV technology [33]. Combined with the characteristics of the PV–hydrogen production industry, we constructed a learning curve model for power generation/hydrogen production equipment, whose calculation formulae are shown in Equations (11)–(13) [34,35].
C c a p e x ( t ) = C 0 ( X ( t ) X 0 ) β
L r = 1 2 β
P r = 2 β
where C c a p e x ( t ) is the unit investment cost of the power generation/hydrogen production equipment in period t , CNY/kW; C 0 is the unit investment cost of the technology in the base year, CNY/kW; X ( t ) is the cumulative installed capacity of the technology in period t , kW; X 0 is the cumulative installed capacity of the technology in the base year, kW; β is the learning index; L r is the learning rate; P r is the technological progress rate.
Using experience as the only source of learning, this is a one-factor learning curve model. To more accurately describe the technological progress process, Castrejon-Campos proposed a two-factor learning curve that uses the stock of knowledge as a second source of learning [36]. Knowledge stock involves the depreciation of old knowledge and the creation of new knowledge, and includes policy factors, R&D investment, and the time lag of R&D effects. Because relevant domestic R&D data are not publicly available, and the cumulative installed capacity representing experience is available from industry reports, we used single-factor learning curves to investigate the technological progress and future unit cost predictions for PV and electrolyzers, separately.

2.4.2. Monte Carlo Method

The Monte Carlo method was proposed by John von Neumann and is a computational method that uses random sampling statistics to estimate the results. In Monte Carlo sampling, samples are obtained for the selected parameters of the scenario, which vary according to a given probability distribution and therefore require a decision with risk. In Monte Carlo analysis, all parameters are independent, which means that the distribution of one variable does not affect the value of another variable, which is the nature of independent random variables [33].
In Monte Carlo analysis, the parameter selection and parameter distribution assumptions are performed first. The parameter distributions that can be chosen are uniform, triangular, and beta-PERT distributions. Uniform distribution is the simplest distribution that samples a series of estimates; in this model, the minimum and maximum values must be set, each of which is equally likely to be sampled. For the triangular and PERT distributions, in addition to the minimum and maximum values, a most likely value needs to be set, and the most likely value is emphasized. A triangular distribution is similar to a triangle, with the most likely value located at the apex of the triangle. The PERT distribution provides a close fit to the normal or log-normal distribution because it constructs a smooth curve with more emphasis on the values around the most likely values. If sure about the range of parameters set, PERT distribution can be chosen; if unsure, triangular distribution can be chosen.

2.4.3. Method Integrating Learning Curve and Monte Carlo Simulation

Our method integrating learning curves and Monte Carlo simulation involves several steps that can be summarized as follows:
Step 1.
Identify the key components that may seriously affect the economics of PV–hydrogen projects.
Step 2.
Construct learning curve models for these key components and fit learning rate parameters based on historical data, such as cumulative installed capacity and unit capital cost.
Step 3.
Use learning curve models to predict future unit capital costs of these components and determine the statistical distribution of unit capital costs at certain future time points.
Step 4.
Identify the statistical distributions for model parameters that represent the viability or uncertainty of technologies.
Step 5.
At every selected future point in time, N random samples are generated from each probability distribution function.
Step 6.
Compute model results based on every possible combination of input variables.
Step 7.
Statistically analyze model outputs and approximations of probability density functions.
The integrated process of learning curves and Monte Carlo simulation for the economic analysis of PV–hydrogen production projects is shown in Figure 2. Note that we drew upon Benalcazar’s idea, but considered the trend in project capital cost changes with technological progress at different time points. Especially when industry managers have detailed production targets for key components such as PV modules and PEM cells, this integrated approach allows them to predict the cost of such technical projects when production targets are met.

3. Simulation Case

China’s total solar radiation resources are abundant, and the overall distribution is characterized by being higher on the plateau than on the plain, and higher in the dry western area than in the humid eastern area.
According to the China National Energy Administration, China’s total solar radiation resources can be classified into four classes: most abundant, very abundant, more abundant, and average. The specific classification is shown in Table 3.

3.1. Data Collection

After analyzing the photovoltaic industry and the abundance of solar energy resources in each city in Jiangsu Province, we considered the building of a 100 MW off-grid photovoltaic power plant in Suqian city in Jiangsu Province, which will use all the electricity generated by PV for the electrolysis of hydrogen. Using Meteonorm 8.0 software, we obtained the local monthly average solar irradiation data as shown in Table 4. As shown in Table 4, the average annual horizontal solar radiation of the project is 1350 kWh/m2, indicating a relatively abundant area in terms of total solar radiation according to Table 3.

3.2. System Parameter Assumptions

The parameter assumptions in the PV–hydrogen project were divided into financial and technical assumptions, and the main technical and financial assumption data are shown in Table 5 and Table 6, respectively.

4. Results and Discussion

4.1. Economic Benefit

4.1.1. Hydrogen Production

As shown in Figure 3, ALK electrolyzers are already a mature commercial product with a long replacement cycle of twice in 25 years, whereas PEM technology is still in the early stage of commercial development, with a shorter replacement cycle of three times in the same period. Because PEM electrolyzers have a wider working range and a smaller capacity to match PV power generation, but consume less electricity for hydrogen production, they can produce substantially more hydrogen per year than ALK electrolyzers.

4.1.2. Economic Benefits of PV–Hydrogen Systems

1.
LCOH
The levelized cost of hydrogen (LCOH) can be divided into the following major parts: the initial investment and operating costs of the PV module, the initial investment and operating costs of the electrolytic hydrogen production module, and the water consumption and stack replacement costs. The specific parameters for calculating the costs are shown in Table 7.
  • Photovoltaic power module cost
The initial investment cost of PV power plants is the cost of PV power plant construction, including the equipment procurement, installation engineering, construction engineering, and other costs. In the simulation case in this study, according to the unit cost of a 100 MW installed PV power plant, the equipment procurement cost is CNY 298 million, the installation engineering cost is CNY 32 million, the construction engineering cost is CNY 46 million, and other costs are CNY 20 million. In summary, the total initial investment cost of the photovoltaic power plant is CNY 396 million. The specific values are shown in Table 8.
In terms of the operation and maintenance costs of PV power plants, according to the China Photovoltaic Industry Association, the unit operation cost of the PV power plant was approximately 0.045 CNY/W in 2021, so the operation cost of this project is approximately 4.5 million CNY/year.
  • Cost of electrolysis hydrogen production module
    The electrolysis hydrogen production module involves the initial investment costs of the electrolyzer, compressor, and hydrogen storage tank; the annual operation cost; and the replacement cost of the electrolyzer stack and the annual water consumption cost.
    (a)
    Initial investment and operating costs of the electrolyzer: The installed capacity of the proposed PV plant is 100 MW, so it needs to be equipped with an ALK electrolyzer with a 90.9 MW installed capacity or a PEM electrolyzer with a 62.5 MW installed capacity. The initial investment cost of the electrolyzer can be calculated by calculating the costs of the ALK electrolyzer at 2010 CNY/kW and of the PEM electrolyzer at 6298 CNY/kW. The annual operating cost of the electrolyzer can be obtained by multiplying the installed capacity of the electrolyzer with the unit operating cost of about 17 CNY/kW [18].
    (b)
    Initial investment and operating costs of the compressor: To improve the economy of hydrogen storage and transportation, hydrogen gas must be compressed. The investment cost of the hydrogen compressor equipment for a volume flow rate of 300 m3/h is CNY 320,000, and then the cost of hydrogen compression for other volume flows can be obtained according to the power law given in Equation (14). The operating cost of the compressor is set at 3.2% of the initial investment cost [38].
    C c o m p r e s s i o n = 320000 × ( V H 2 300 ) 0.6
    where C c o m p r e s s i o n is the investment cost of hydrogen compression, CNY; V H 2 denotes the hydrogen flow rate, m3/h.
    (c)
    Initial investment and operating costs of hydrogen storage tank: The cost of a hydrogen storage tank mainly depends on its capacity; the case minimum and maximum storage capacities are 10,000 and 108,000 kg of hydrogen, respectively. The formula for calculating the investment cost of a hydrogen storage tank is shown in Equation (15), and its operating cost is shown in Equation (16) [38].
    C s t o r e = U C s t o r e × M a s s s t o r e
    O C s t o r e = U O M s t o r e × M a s s s t o r e
    where C s t o r e is the investment cost of hydrogen storage tank, CNY; U C s t o r e is the capital cost of medium pressure hydrogen storage, set to 350 CNY/kg; M a s s s t o r e indicates the mass of hydrogen in the storage tank, kg; O C s t o r e is the annual operating cost of hydrogen storage tank, CNY; U O M s t o r e is the unit hydrogen storage operating cost, set to 0.075 CNY/kg.
    (d)
    The water consumption cost C w = P w × Q w × Q H 2 _ year , where P w is the price per unit of water used in hydrogen production, here taken as 4.1 CNY/m3 [37]; Q w is the water consumption in hydrogen production, here taken as 0.009 m3/kg [37]; Q H 2 _ year is the annual hydrogen production of the electrolyzer. The cost of water consumption for each year of the electrolyzer during its life cycle can be calculated after considering each datum.
    (e)
    Stack replacement cost: In prior studies, researchers calculated the stack replacement time according to the number of hours of electrolyzer operation; others set the stack replacement time according to the number of years. We used the latter in this study. Assuming a replacement cycle of ten years for an ALK electrolyzer and seven years for a PEM electrolyzer [30], two and three stack replacements are required for ALK and PEM electrolyzers, respectively, during the project life cycle. Taking the stack replacement cost as 15% of the initial investment cost of the electrolyzer [30], the replacement cost of both electrolyzers can be obtained.
    (f)
    Salvage value of fixed assets: For this project, the PV salvage value is 3% of the initial PV investment cost, and that of the electrolyzer is 10% of the initial investment cost. The salvage value of fixed assets is the only value that can be calculated as income in the levelized hydrogen production cost, which can reduce the cost.
Based on the above data, the levelized cost of hydrogen production for the PV + ALK electrolyzer and PV + PEM electrolyzer projects is approximately 33.2 and 37.3 CNY/kg, respectively. The breakdown of each cost component in the levelized cost of hydrogen production is shown in Figure 4.
Figure 4 shows that the capital expenditure for the PVs and electrolyzer accounts for the largest share, nearly 70%, of the overall hydrogen production levelization cost. In contrast, the operating expenditure for the compressor CAPEX and hydrogen storage tank accounts for a smaller share of the hydrogen production levelization cost. The PV CAPEX of the PEM electrolyzer project is smaller than that of the ALK electrolyzer project because the ALK electrolyzer is basically localized and less expensive, whereas the key materials and technologies for the PEM electrolyzer still need to be imported and are more expensive.
2.
NPV and IRR
Over the lifetime of the project, the cumulative NPVs of the two electrolyzers, ALK and PEM, for hydrogen production are markedly different, as shown in Figure 5. The cumulative NPV of the project using an ALK electrolyzer is consistently larger than that of the project using a PEM electrolyzer, and the dynamic payback period is shorter.
The economic indicators, such as NPV, IRR, and payback period, of the project are shown in Table 9.
Table 9 shows that the final economic index results of the PV + ALK electrolyzer project are widely different from those of the PV + PEM electrolyzer project. In brief, both projects are feasible because their NPVs are greater than zero, their IRRs are above the benchmark rate of return of 8%, and their dynamic payback periods are less than the project life of 25 years. Overall, the PV + ALK electrolyzer project is more economical because it has a larger NPV, a larger IRR, and a shorter dynamic payback period.

4.2. Uncertainty Analysis

4.2.1. Sensitivity of Five Factors Affecting NPVs

In this study, we selected five factors, namely discount rate, PEM electrolyzer capital expenditure, hydrogen price, PV capital expenditure, and PV conversion efficiency, for sensitivity analysis of the impact of project NPV. The base values of each factor are shown in Table 10. When each factor changes by ±5% or ±10%, the resulting variation in the project NPV is as shown in Table 11.
Table 11 shows that among the five factors, hydrogen price and PV conversion efficiency move in the same direction as NPV, whereas discount rate, electrolyzer capital expenditure, and PV capital expenditure all move in the opposite direction as NPV. Among them, changes in hydrogen price have the most notable impact on NPV, as a 10% change in hydrogen price can lead to a change of nearly 50% in NPV; PV conversion efficiency has the same impact on NPV as hydrogen price. The impact of PV capital expenditure on NPV is the least important:, when it changes by 10%, the change in NPV is approximately 14%. The impact of the electrolyzer on NPV is comparable to that of PV capital expenditure: when the discount rate changes by 10%, the NPV changes by 26% to 29%.
The results of the analysis showed that an increase in the price of hydrogen will increase the revenue and thus the NPV, so increasing the price of hydrogen will most effectively increase the economic benefits of the project. The increase in PV conversion efficiency will directly increase the power generation and the hydrogen output, thus having a substantial impact on NPV. When considering the time value of money, the higher the discount rate, the lower the value of the income later in the project when discounted to present value, so the discount rate inversely moves with the NPV. Additionally, the decrease in capital cost per unit of PV and electrolyzer will lead to an increase in NPV, and the decrease in the capital cost of the electrolyzer will more strongly affect NPV than PV.
In summary, the sensitivity of these five factors on NPV in descending order is: hydrogen price, PV conversion efficiency, discount rate, electrolyzer unit investment cost, and PV unit investment cost.

4.2.2. Projection of Future Levelized Cost of PV-Powered Hydrogen Production

The uncertainty in the technological progress of both PV and electrolyzer hydrogen production is an important factor affecting the future cost of PV hydrogen production, which will, in turn, affect its economic efficiency. Based on the learning curve, the trend in the unit installed cost of PVs and electrolyzers can be seen as the cumulative installed capacity increases of PVs and electrolyzers.
The installed cost and cumulative installed capacity of PV in China in recent years are shown in Figure 6.
Figure 6 shows that the cumulative installed capacity of photovoltaic power generation in China in recent years has been steadily trending upward and exceeded 300 GW in 2021, reaching seven times the cumulative installed capacity in 2015. With the development of science and technology, the quality of photovoltaic components continues to increase, and the cost is decreasing, resulting in PV unit investment costs declining year over year, with a larger decline before 2018. This decline tended to level off in the later years as the difficulty of technological progress increased.
The learning index (i.e., regression coefficient) of PVs was calculated based on the linear relationship that exists between the log unit installed cost and the log cumulative PV installed capacity using the least squares method of linear regression for parameter estimation, which we used, in turn, to calculate the learning rate of PV in China from 2015–2021 as approximately 25.6%. The fitted line of the learning index is shown in Figure 7, and the regression results are shown in Table 12.
In these results, the R-squared indicates the goodness of fit, which refers to the degree of fit of the regression equation to the sample. A higher value indicates a better fit, indicating that the model can well explain the variability in the dependent variable. The R-squared value in Table 12 is 0.9839, which indicates a good fit. The p-value of the F-test < 0.001, indicating that the independent variable has a significant effect on the dependent variable.
Because the installed capacity and unit cost data of electrolyzer systems in China are not publicly available, we directly applied the study data from the International Renewable Energy Agency (IRENA), where the learning rate of the PEM electrolyzer is approximately 18%. After obtaining the learning rate of PV and electrolyzer technology in China, and then based on the cumulative installed capacity of PVs and electrolyzers in China in the next few years, we forecasted the trend in the future investment cost. The forecast of our cumulative installed PV and electrolyzer capacity in the next few decades is shown in Table 13.
Therefore, based on the known data, we predicted the future investment cost trends for PV and electrolyzers in China from 2020–2050, as shown in Figure 8.
Figure 8 shows that with a PV learning rate of 25.6%, the future PV unit installed cost will continue to decline to approximately 2301 CNY/kW in 2030 and 1371 CNY/kW in 2050, which is a 67% decrease from 2020. With a learning rate of 18%, the unit installed cost of electrolyzers will substantially decline until 2030, and will even be lower than that of PVs, after which the downward trend tends to level off. By 2030, the unit installed cost of electrolyzers will drop to approximately 1866 CNY/kW, which is 70% lower than that in 2020, so the production of green hydrogen from electrolyzers will rapidly develop in this decade. By 2050, the unit installed cost of an electrolyzer will drop to 1230 CNY/kW, which is only 20% of the cost in 2020.
Under China’s double carbon target, the development of renewable energy will be further encouraged in the future. As shown by the photovoltaics + electrolyzers clean green hydrogen production model, its future installed scale will continue to expand and the unit installed cost will continue to reduce, which will stimulate the transformation and upgrading of energy, leading to clean energy carbon emission reduction.
Based on the previous analysis, we selected six technical parameters that can reflect the characteristics of technological progress: PV tracking system coefficient, PV conversion efficiency, PV learning rate, electrolyzer degradation rate, electrolyzer hydrogen production efficiency, and electrolyzer learning rate. We then investigated the impact of each technology factor on the LCOH through Monte Carlo simulation. Among them, the impact of the project economics of PV learning rate and electrolyzer learning rate is reflected by the decrease in the unit capital cost of the equipment due to the learning process that accompanies the production practice process. The actual values of these parameters in 2020 and the projected values in 2030 and 2050 were compiled from industry reports, national industry standards, and technical parameters of major equipment published in journal articles. We use the pessimistic, most likely, and optimistic values of each parameter at the same time point to portray the variability in the degree of technological mastery of different companies in different spaces. In particular, we derived the pessimistic values of PV conversion efficiency from Chinese national standards. The most likely values of PV learning rate were calculated above, we derived the pessimistic values from Wang (2022), and the optimistic values from IRENA. We obtained the PV unit capital cost from the China Photovoltaic Industry Association (CPIA); we obtained the PEM electrolyzer degradation rate and hydrogen production efficiency from Yates (2020), the electrolyzer learning rate from IRENA, and the unit capital cost of electrolyzers from the China Hydrogen Energy Development Report 2020. Each specific value is shown in Table 14, demonstrating the impact on the levelized hydrogen production cost after future technological advances.
We selected distribution form for each technical parameter in the Monte Carlo simulation based on the inherent characteristics of the technical parameter and our familiarity with that technical parameter. The two distributions commonly used in the uncertainty analysis of projects are the triangular and beta-PERT distributions. The former is suitable for scenarios where the most probable value of the distribution is less certain, whereas the latter is more often used in cases where the most probable value of the distribution is more certain. Because PV technology is more mature and the related industry data are more complete, whereas the electrolytic water-to-hydrogen technology, especially PEM electrolyzer technology, is still in the early stage of commercial development and no publicly available multisource mutually verified data are available, we set the technical parameters of the PV module to obey the beta-PERT distribution and the technical parameters of the electrolyzer module to obey the triangular distribution.
Based on the distribution characteristics of the technical parameters, 5000 stochastic simulations were conducted for the 2020, 2030, and 2050 scenarios. We formed 5000 stochastic combinations of the technical parameters for each scenario, and we calculated the LCOH of the project based on the stochastic combinations of the parameters. Finally, the statistical characteristics of the LCOH of the PV hydrogen project in 2030 and 2050, the itemized cost components, and the correlation with different technical parameters were studied. The specific results of the simulations are shown in Figure 9.
Figure 9 shows the LCOH results are more widely distributed in 2020, at approximately 30–65 CNY/kgH2, and will lead to further cost reductions as technology advances. By 2030, the LCOH will drop to approximately 18–32 CNY/kgH2; and by 2050, the LCOH results are more concentrated and may drop below 10 CNY/kgH2, at approximately 8–18 CNY/kgH2. We investigated the degree of influence of these six technical parameters on LCOH in 2030 and 2050, as shown in Figure 10.
Figure 10 shows that the impact of the unit capital cost of an electrolyzer on the LCOH is the largest and positively correlated in different periods, followed by that of the PV conversion coefficient, which is negatively correlated with LCOH. The higher the conversion efficiency, the lower the LCOH. The change in the degradation factor of the electrolyzer always has a nonsignificant effect on the LCOH. Over time, the effect of the PV unit capital cost on LCOH becomes increasingly significant, while the effect of electrolyzer power consumption becomes less and less significant.
In addition, we decomposed the composition of LCOH in different periods into nine major parts, including each capital expenditure, operating expenditure, and power stack replacement and water consumption costs, as shown in Figure 11.
Figure 11 shows the capital expenditure for PV and electrolyzers consistently accounts for the largest share of the LCOH over time, while the operating expenditure for compressors is the smallest. The proportion of the stack replacement and water consumption costs continually decrease, while that of the hydrogen storage tank capital cost continually increases in the LCOH over time.
We investigated the extent of the impact on LCOH after different technological advances by applying a combined Monte Carlo–learning curve simulation method. Overall, the capital cost of PVs and electrolyzers is the most important aspect constituting the LCOH, and reductions in their costs will more strongly impact the decrease in LCOH. In the future, with the advancement of various technologies in PV–hydrogen projects, the LCOH will further drop.
We compared our projection results with the similar studies in the literature. Xu calculated the LCOH of hydrogen production from electrolytic water in a 100 MW PV plant in 2022 as approximately 36 CNY/kg, and used the learning curve model to predict that, with technological progress, the LCOH would drop from 36 CNY/kg in 2022 to approximately 16 CNY/kg in 2030 [39]. Wang studied the future cost trend of hydrogen production in China based on learning curve and predicted that the cost of hydrogen production from PV + PEM electrolytic water would drop to CNY 25/kg by 2030; after 2050, the cost of hydrogen production from PV + PEM electrolytic water will drop to CNY 12/kg. Wei predicted that the cost of hydrogen production from renewable energy electrolytic water would be as low as 11.63 CNY/kgH2 by 2050 [40]. These scholars’ estimates are within the estimation interval of our model, CNY 16–32/kg in 2030 and CNY 8–18/kg in 2050, which may validate the reasonableness of our model.

5. Conclusions

In this study, by establishing a model to study the economic efficiency of PV hydrogen production considering the differences in hydrogen production electrolyzer technology, we applied LCOH analysis to calculate the cost of each major component during the project life and interpreted the project economics using relevant financial indicators: net present value, internal rate of return, and dynamic payback period. We collated and identified the technological advancement factors of PV–hydrogen production projects, and we estimated the PV learning rate using the least squares method. We constructed a 100 MW PV–hydrogen production project in a city in Jiangsu Province as a simulation case, and we analyzed the hydrogen yield and economic benefits of the projects. We also considered five influencing factors (PV capital expenditure, PV conversion efficiency, electrolyzer capital expenditure, discount rate, and hydrogen price) in a sensitivity analysis. We established a learning curve–Monte Carlo method using learning curves with hyperparameters to describe the decreasing trend in the future investment costs for PV and electrolyzer technologies; we used a Monte Carlo random distribution to investigate the variability and uncertainty of the impact of different technical parameters on the LCOH of a PV–hydrogen system. In summary, our main conclusions are as follows:
  • At present, hydrogen production using ALK electrolyzers still has a cost advantage over that using PEM electrolyzers. In the simulation case in this study, the LCOH for the PV + ALK electrolyzer and PV + PEM electrolyzer project is 33.2 and 37.3 CNY/kg, respectively. Among the levelized costs of each component, the initial investment costs of the PV plant and electrolyzer account for a larger proportion of the LCOH, and their cost changes most strongly impact the LCOH.
  • Among the five factors (PV capital expenditure, electrolyzer capital expenditure, PV conversion efficiency, hydrogen price, and discount rate) that may affect the NPV of PV–hydrogen projects, changes in the price of hydrogen have the most notable effect. A 10% change in the hydrogen price may lead to a change of nearly 50% in NPV. Changes in PV unit investment costs have the least impact on NPV, with a 10% change in NPV resulting in a 14% change in NPV. The sensitivity of NPV to these five factors in descending order is: hydrogen price, PV conversion efficiency, discount rate, electrolyzer unit investment cost, and PV unit investment cost.
  • We proposed a two-dimensional Monte Carlo approach to predict the variation interval in LCOH of PV–hydrogen projects in 2030 and 2050, which describes the current technology variability with variable parameters and the uncertainty of the technology advancement with uncertain parameters. The combination of the learning curve model and the Monte Carlo method provided an effective tool to study the impact of future technological advances on project economics using historical data, the distribution of characteristic parameters of the technology, as well as the inherent laws and uncertainties of the learning process.
  • We found that among the six parameters reflecting the uncertainty in technological progress, i.e., PV tracking system coefficient, PV conversion efficiency, electrolyzer efficiency, electrolyzer degradation coefficient, and PV and electrolyzer capital cost, PV conversion efficiency and electrolyzer capital cost have the most critical impact on the LCOH of PV–hydrogen projects. Combined with the learning curve model, we predicted the LCOH of PVs in hydrogen production to decrease from 30–65 CNY/kg in 2020 to approximately 16–32 CNY/kg in 2030; by 2050, the LCOH may drop below 10 CNY/kg to approximately 8–18 CNY/kg. The decomposition of LCOH in 2020, 2030, and 2050 revealed that, of the capital expenditures, those of PVs and electrolyzers always account for the largest share of the LCOH, while the operating expenditures of compressors account for the smallest share. The share of stack replacement and water consumption costs continually decreases in the LCOH over time, while that of hydrogen storage tank capital costs continually increases in the LCOH.
In this study, we focused on the green production of hydrogen energy and its economics, but we did not make assumptions about the transportation and application of hydrogen energy. We suggest that the infrastructure construction for hydrogen production should be strengthened and clean energy hydrogen production projects should be developed according to local conditions, especially in the solar energy-rich areas in western China such as Qinghai, Tibet, and Xinjiang. We should explore a wide range of hydrogen energy applications, reduce coal and pollutant emissions, and accelerate the replacement of green hydrogen with gray hydrogen to achieve the double carbon goal in China as soon as possible.

Author Contributions

Conceptualization, Y.Q.; Software, Y.Q.; Formal analysis, X.H.; Investigation, X.H.; Resources, X.H.; Data curation, Q.W.; Writing—original draft, Z.Z.; Writing—review & editing, Z.Z.; Funding acquisition, Q.W. All authors have read and agreed to the published version of the manuscript.

Funding

The project was supported by National Natural Science Foundation of China (No. 72171102, 42171245), the Open Research Fund of NJIT Research Center, The Key Laboratory of Carbon Neutrality and Territory Optimization, Ministry of Natural Resources (No. CNT202203), the Open Research Fund of Jiangsu Collaborative Innovation Center for Smart Distribution Network, Nanjing Institute of Technology (No. XTCX202212).

Institutional Review Board Statement

Not applicable.

Informed Consent Statement

Not applicable.

Data Availability Statement

Not applicable.

Conflicts of Interest

The authors declare no conflict of interest.

Nomenclature

Abbreviations
2FCsTwo-factor learning curves
ACAlternating current
ALKAlkaline
CAPEXCapital expenditures
CFCapacity factors
CNYChinese Yuan
CPIAChina Photovoltaic Industry Association
DCDirect current
HZBHelmholtz Zentrum Berlin
IRRInternal Rate of Return
IRENAInternational Renewable Energy Agency
LCOHLevelized cost of hydrogen
LCOELevelized cost of electricity
NPVNet Present Value
P2XPower to X
PEMProton exchange membrane
PSCPerovskite solar cell
PVPhotovoltaic
PVH2Photovoltaic hydrogen production
R&DResearch and development
SOECSolid oxide electrolyzers
TOPConTunnel oxide passivated carrier selective contacts
Symbols
βLearning index
η 1 PV conversion efficiency coefficient
η 2 Conversion efficiency of the electrolyzer, (kg/kWh)
A n Operating cost in year n
B n Cash inflow in year n
CTilted surface radiation coefficient
C 0 The unit investment cost of the technology in the base year, (CNY/kW)
C c a p e x ( t ) The unit investment cost of the power generation/hydrogen production equipment in period t, (CNY/kW)
C n Cash outflow in year n
C c o m p r e s s i o n Investment cost of hydrogen compression, (CNY)
C R Electrolyzer replacement cost
C s t o r e Investment cost of hydrogen storage tank, (CNY)
dDegradation factor of the electrolyzer
D ( n ) Annual multiplier of power consumption of the electrolyzer
E P Annual power generation, (kWh)
E S Irradiance under standard conditions, (kWh/m2)
E c _ h Hourly power consumption of the electrolyzer, (kWh)
E p _ h Hourly power generation of the PV plant, (kWh)
E R Rated power of the electrolyzer, (kWh)
E n Energy consumption cost in year n
H A Hourly total horizontal solar radiation, (kWh/m2)
KComprehensive efficiency coefficient
K m i n The minimum capacity of the electrolyzer
K E C The electrolyzer capacity factor
L r Learning rate
M a s s s t o r e The mass of hydrogen in the storage tank, (kg)
nNumber of years
O C s t o r e The annual operating cost of hydrogen storage tank, (CNY)
PInstall PV capacity, (kW)
P r Technological progress rate
P w The price per unit of water used in hydrogen production, (CNY/m3)
Q H 2 _ h Hourly hydrogen production of the electrolyzer, (kg)
Q H 2 _ y e a r Annual hydrogen production of the electrolyzer, (kg)
Q w The water consumption in hydrogen production, (m3/kg)
rDiscount rate
t The year when the cumulative NPV is greater than zero for the first time
TThe project life cycle
T r The tracking system coefficient
T d Dynamic payback period
U C s t o r e The capital cost of medium pressure hydrogen storage, (CNY/kg)
U O M s t o r e The unit hydrogen storage operating cost, (CNY/kg)
V H 2 Hydrogen flow rate, (m3/h)
V R Salvage value of fixed assets
X ( t ) The cumulative installed capacity of the technology in period t, (kW)
X 0 The cumulative installed capacity of the technology in the base year, (kW)
Y n Hydrogen production volume in year n

References

  1. Wang, X.; Yang, C.; Huang, M.; Ma, X. Multi-objective optimization of a gas turbine-based CCHP combined with solar and compressed air energy storage system. Energy Convers. Manag. 2018, 164, 93–101. [Google Scholar] [CrossRef]
  2. Pein, M.; Neumann, N.C.; Venstrom, L.J.; Vieten, J.; Roeb, M.; Sattler, C. Two-step thermochemical electrolysis: An approach for green hydrogen production. Int. J. Hydrogen Energy 2021, 46, 24909–24918. [Google Scholar] [CrossRef]
  3. Liao, Y.-W.; Yang, J.; Wang, G.-H.; Wang, J.; Wang, K.; Yan, S.-D. Hierarchical porous NiO as a noble-metal-free cocatalyst for enhanced photocatalytic H2 production of nitrogen-deficient g-C3N4. Rare Met. 2021, 41, 396–405. [Google Scholar] [CrossRef]
  4. Wang, X.; Gong, J.; Dong, Y.; An, S.; Zhang, X.; Tian, J. Energy band engineering of hydroxyethyl group grafted on the edge of 3D g-C3N4 nanotubes for enhanced photocatalytic H2 production. Mater. Today Phys. 2022, 27, 100806. [Google Scholar] [CrossRef]
  5. Guo, Y.; Liang, Z.; Xue, Y.; Wang, X.; Zhang, X.; Tian, J. A cation exchange strategy to construct Rod-shell CdS/Cu2S nanostructures for broad spectrum photocatalytic hydrogen production. J. Colloid Interface Sci. 2021, 608, 158–163. [Google Scholar] [CrossRef]
  6. Norouzi, N. Hydrogen production in the light of sustainability: A comparative study on the hydrogen production technologies using the sustainability index assessment method. Nucl. Eng. Technol. 2021, 54, 1288–1294. [Google Scholar] [CrossRef]
  7. Gondal, I.A.; Masood, S.A.; Khan, R. Green hydrogen production potential for developing a hydrogen economy in Pakistan. Int. J. Hydrogen Energy 2018, 43, 6011–6039. [Google Scholar] [CrossRef]
  8. Grimm, A.; de Jong, W.A.; Kramer, G.J. Renewable hydrogen production: A techno-economic comparison of photoelectrochemical cells and photovoltaic-electrolysis. Int. J. Hydrogen Energy 2020, 45, 22545–22555. [Google Scholar] [CrossRef]
  9. Hosseini, S.E.; Wahid, M.A. Hydrogen from solar energy, a clean energy carrier from a sustainable source of energy. Int. J. Energy Res. 2019, 44, 4110–4131. [Google Scholar] [CrossRef]
  10. Fereidooni, M.; Mostafaeipour, A.; Kalantar, V.; Goudarzi, H. A comprehensive evaluation of hydrogen production from photovoltaic power station. Renew. Sustain. Energy Rev. 2018, 82, 415–423. [Google Scholar] [CrossRef]
  11. Nicita, A.; Maggio, G.; Andaloro, A.; Squadrito, G. Green hydrogen as feedstock: Financial analysis of a photovoltaic-powered electrolysis plant. Int. J. Hydrogen Energy 2020, 45, 11395–11408. [Google Scholar] [CrossRef]
  12. Peláez-Peláez, S.; Colmenar-Santos, A.; Pérez-Molina, C.; Rosales, A.-E.; Rosales-Asensio, E. Techno-economic analysis of a heat and power combination system based on hybrid photovoltaic-fuel cell systems using hydrogen as an energy vector. Energy 2021, 224, 120110. [Google Scholar] [CrossRef]
  13. Kalbasi, R.; Jahangiri, M.; Tahmasebi, A. Comprehensive Investigation of Solar-Based Hydrogen and Electricity Production in Iran. Int. J. Photoenergy 2021, 2021, 6627491. [Google Scholar] [CrossRef]
  14. Qolipour, M.; Mostafaeipour, A.; Tousi, O.M. Techno-economic feasibility of a photovoltaic-wind power plant construction for electric and hydrogen production: A case study. Renew. Sustain. Energy Rev. 2017, 78, 113–123. [Google Scholar] [CrossRef]
  15. Gökçek, M.; Kale, C. Optimal design of a Hydrogen Refuelling Station (HRFS) powered by Hybrid Power System. Energy Convers. Manag. 2018, 161, 215–224. [Google Scholar] [CrossRef]
  16. Longden, T.; Jotzo, F.; Löschel, A. Conditions for low cost green hydrogen production: Mapping cost competitiveness with reduced-form marginal effect relationships. Zero-Carbon Energy Asia-Pac. 2021, 7, 5–21. [Google Scholar]
  17. Ahshan, R. Potential and Economic Analysis of Solar-to-Hydrogen Production in the Sultanate of Oman. Sustainability 2021, 13, 9516. [Google Scholar] [CrossRef]
  18. Yates, J.; Daiyan, R.; Patterson, R.; Egan, R.; Amal, R.; Ho-Baille, A.; Chang, N.L. Techno-economic Analysis of Hydrogen Electrolysis from Off-Grid Stand-Alone Photovoltaics Incorporating Uncertainty Analysis. Cell Rep. Phys. Sci. 2020, 1, 100209. [Google Scholar] [CrossRef]
  19. Brandimarte, P. Handbook in Monte Carlo Simulation: Applications in Financial Engineering, Risk Management, and Economics; John Wiley & Sons: Hoboken, NJ, USA, 2014. [Google Scholar]
  20. Heck, N.; Smith, C.; Hittinger, E. A Monte Carlo approach to integrating uncertainty into the levelized cost of electricity. Electr. J. 2016, 29, 21–30. [Google Scholar] [CrossRef]
  21. Geissmann, T.; Ponta, O. A probabilistic approach to the computation of the levelized cost of electricity. Energy 2017, 124, 372–381. [Google Scholar] [CrossRef]
  22. Benalcazar, P.; Komorowska, A. Prospects of green hydrogen in Poland: A techno-economic analysis using a Monte Carlo approach. Int. J. Hydrogen Energy 2021, 47, 5779–5796. [Google Scholar] [CrossRef]
  23. Santhakumar, S.; Meerman, H.; Faaij, A. Improving the analytical framework for quantifying technological progress in energy technologies. Renew. Sustain. Energy Rev. 2021, 145, 111084. [Google Scholar] [CrossRef]
  24. Kouvaritakis, N.; Soria, A.; Isoard, S. Modelling energy technology dynamics: Methodology for adaptive expectations models with learning by doing and learning by searching. Int. J. Glob. Energy Issues 2000, 14, 104–115. [Google Scholar] [CrossRef]
  25. Grubb, M.; Köhler, J.; Anderson, D. Induced Technical Change in Energy and Environmental Modeling: Analytic Approaches and Policy Implications. Annu. Rev. Energy Environ. 2002, 27, 271–308. [Google Scholar] [CrossRef]
  26. Zhang, H.C.; Yang, S.; Luo, Y.; Zhu, R.; Wang, L.; Shen, D.; Zhou, C. Research on the calculation method of photovoltaic power generation capacity of photovoltaic power plants. Sol. Energy 2016, 08, 42–45. (In Chinese) [Google Scholar] [CrossRef]
  27. O’Neill, S. Perovskite Pushes Solar Cells to Record Efficiency. Engineering 2021, 7, 1037–1040. [Google Scholar] [CrossRef]
  28. Marshall, A.; Børresen, B.; Hagen, G.; Tsypkin, M.; Tunold, R. Hydrogen production by advanced proton exchange membrane (PEM) water electrolysers—Reduced energy consumption by improved electrocatalysis. Energy 2007, 32, 431–436. [Google Scholar] [CrossRef]
  29. Guo, X.Y.; Li, X.M.; Xu, Z.; He, G.Z.; Miao, P. Cost analysis of hydrogen production by electrolysis of renewable energy. Energy Storage Sci. Technol. 2020, 9, 688–695. (In Chinese) [Google Scholar] [CrossRef]
  30. Deng, T.Y.; He, G.L.; Miao, P. Cost analysis of hydrogen production from water electrolysis in different application scenarios. Energy Chem. Ind. 2020, 41, 1–5. (In Chinese) [Google Scholar] [CrossRef]
  31. Pan, G.S.; Gu, W.; Zhang, H.Y.; Qiu, Y. Electricity and hydrogen energy system towards accomodation of high proportion of renewable energy. Autom. Electr. Power Syst. 2020, 44, 1–10. (In Chinese) [Google Scholar] [CrossRef]
  32. Yang, M.; Wang, S.S.; Li, D.Y.; Su, X.; Sun, Y.; Jia, Y.P. Cost-benefit analysis of centralized photovoltaic power generation considering environmental benefit under the life cycle. J. Northeast. Electr. Power Univ. 2018, 38, 21–28. (In Chinese) [Google Scholar]
  33. Zhang, L.; Ye, B.; Yin, C.X.; Yu, B.; Liu, H. Economy and development prospects analysis of wind power hydrogen production. Northeast. Electr. Power Technol. 2020, 41, 5–9. (In Chinese) [Google Scholar] [CrossRef]
  34. Li, P.Y.; Sun, S. Analysis of cost of the photovoltaic industry in northwest China based on learning curve. Energy Conserv. Technol. 2017, 35, 469–474. (In Chinese) [Google Scholar] [CrossRef]
  35. Wang, Y.Z.; Ou, X.M.; Zhou, S. Future cost trend of hydrogen production in China based on learning curve. Clim. Chang. Res. 2022, 18, 283–293. (In Chinese) [Google Scholar]
  36. Castrejon-Campos, O.; Aye, L.; Hui, F.K.P. Effects of learning curve models on onshore wind and solar PV cost developments in the USA. Renew. Sustain. Energy Rev. 2022, 160, 112278. [Google Scholar] [CrossRef]
  37. Xu, J.; Ding, X.; Gong, Y.L.; He, G.Z.; Hu, T. Economic analysis of hydrogen production plant with water electrolysis. Energy Storage Sci. Technol. 2022, 11, 2374–2385. (In Chinese) [Google Scholar] [CrossRef]
  38. Yan, Y.; Zhang, H.; Liao, Q.; Liang, Y.; Yan, J. Roadmap to hybrid offshore system with hydrogen and power co-generation. Energy Convers. Manag. 2021, 247, 114690. [Google Scholar] [CrossRef]
  39. Xu, C.B.; Zhang, W.Z.; Li, X.Y.; Lv, X.Y. Economic analysis and stress test of off-grid photovoltaic hydrogen production projects. Mod. Electr. Power 2022, 38, 1–9. (In Chinese) [Google Scholar] [CrossRef]
  40. Liu, W.; Wan, Y.M.; Xiong, Y.L.; Tao, Z.J.; Zhu, Y.B. Key technology of water electrolysis and levelized cost of hydrogen analysis under carbon neutral vision. Trans. China Electrotech. Soc. 2022, 37, 2888–2896. (In Chinese) [Google Scholar] [CrossRef]
Figure 1. Structure diagram of PV hydrogen production system.
Sustainability 15 03580 g001
Figure 2. Integrated process of learning curves and Monte Carlo simulation.
Sustainability 15 03580 g002
Figure 3. Year-by-year hydrogen production from ALK and PEM electrolyzers.
Sustainability 15 03580 g003
Figure 4. Levelized cost breakdown of the two projects.
Sustainability 15 03580 g004
Figure 5. Cumulative discounted cash flows of PV–hydrogen projects over life cycle.
Sustainability 15 03580 g005
Figure 6. China’s cumulative installed PV capacity (a) and unit installed cost (b), 2015–2021. Data source: China National Energy Administration.
Sustainability 15 03580 g006
Figure 7. Fitting line of learning index for PV, 2015–2021.
Sustainability 15 03580 g007
Figure 8. Projected future unit investment costs for PVs and electrolyzers.
Sustainability 15 03580 g008
Figure 9. LCOH distribution in 2020, 2030, and 2050 using learning curve–Monte Carlo simulation.
Sustainability 15 03580 g009
Figure 10. Degree of influence of six technical parameters on LCOH in (a) 2030 and (b) 2050 (Ely: electrolyzer; k_Track: tracking coefficient; k_Eta: conversion efficiency; consumption: electric consumption; degrade: degradation factor; CAPEX: unit capital cost).
Sustainability 15 03580 g010
Figure 11. Cost decomposition of LCOH in (a) 2030 and (b) 2050 (Ely: electrolyzer; Storage: hydrogen storage tank; StackRepCost: stack replacement cost; Comp: compressor; CAPE: unit capital cost; OPEX: operating costs).
Sustainability 15 03580 g011
Table 1. Assumptions related to PV–hydrogen projects.
ParameterValueUnit
Installed photovoltaic capacity100MW
System operation period25years
Stack replacement cycle (ALK) [29]10years
Stack replacement cycle (PEM) [30]7years
Energy consumption (ALK) [30]55kWh/kg
Energy consumption (PEM) [30]50kWh/kg
Electrolyzer degradation rate (ALK) [18]0.5%
Electrolyzer degradation rate (PEM) [18]1%
Allowable load interval (ALK) [31]10~110%
Allowable load interval (PEM) [31]0~160%
Table 2. Uncertainties considered in PV–hydrogen projects.
DimensionFactorDescription
Technology Technology learning rateReflects the trend in future technological progress
PV tracking technologyCan improve power generation
Photovoltaic energy conversion efficiencyAffects power generation
Electrolyzer power consumptionDirectly affects efficiency of hydrogen production
Degradation of electrolyzerLeads to a reduction in hydrogen production in later years
Market Initial investment costChanges in unit investment cost of PV and electrolyzer reflect technological progress
Operating CostsPV–hydrogen projects require maintenance and repair during operation
Hydrogen priceChanges impact final revenue
Economic Discount rateChanges create uncertainty in the net present value
DeflationDestabilizing factor that can impact costs
Table 3. China’s total solar radiation levels and regional distribution. Source: National Energy Administration.
LevelTotal Annual Amount (kWh/m2)Total Annual Amount (MJ/m2)Percentage of National Land Area (%)Major Areas
Most abundant≥1750≥6300~22.8Most of Tibet, western Sichuan, western Inner Mongolia, northwestern Qinghai
Very rich1400~17505040~6300~44.0Most of Xinjiang, central and western Inner Mongolia, eastern Tibet, most of Yunnan, southern Fujian, most of Hainan
More abundant1050~14003780~5040~29.8Northeastern Inner Mongolia, most of northeastern China, southern eastern China, most of eastern and central China, central Sichuan, eastern Yunnan
General<1050<3780~3.4Eastern Sichuan, most of Chongqing, north-central Guizhou, northwestern Hunan and southwestern Hubei
Table 4. Average monthly meteorological data of Suqian city from last 10 years.
MonthMonthly Average Horizontal Radiation (kWh/m2)Monthly Average Temperature (°C)Wind Speed (m/s)
January651.11.9
February784.22.2
March12010.22.5
April14016.42.5
May15521.92.3
June145262.3
July15427.92.1
August13926.91.9
September12222.51.7
October9516.81.7
November739.41.8
December6531.9
Full year135015.52.1
Table 5. Main technical parameters assumed in PV–hydrogen project.
SystemTechnical DataAssumed ValueUnit
Photovoltaic plantInstalled capacity100MW
System lifetime25years
Degradation factor0.005-
ElectrolyzerWater consumption cost [37]4.1CNY/m3
Stack replacement cycle (ALK) [29] 10years
Stack replacement cycle (PEM) [30]7years
Hydrogen production power consumption (ALK) [30]55kWh/kg
Hydrogen production power consumption (PEM) [30]50kWh/kg
Degradation factor (ALK) [18]0.5%
Degradation factor (PEM) [18]1%
Permissible load interval (ALK) [31]10~110%
Permissible load interval (PEM) [31]0~160%
Table 6. Key financial parameters assumed in PV–hydrogen project.
Financial ParameterValueUnit
Discount rate8%
Hydrogen price47CNY/kg
Table 7. Main cost parameters for PV–hydrogen projects.
System ModuleCost ClassificationBreakdownUnit CostUnit
Photovoltaic power generationInitial investment Equipment procurement2.98CNY/W
Installation work0.32CNY/W
Civil engineering0.46CNY/W
Other costs0.2CNY/W
Operating Unit operating cost0.045CNY/W
Hydrogen production by electrolysisInitial investment ALK electrolyzer2010CNY/kW
PEM electrolyzer6298CNY/kW
CompressorSee below/
Hydrogen storage tank350CNY/kgH2
Operating Electrolyzer17CNY/kW
Compressor3.2Percentage of equipment cost
Hydrogen storage tank0.075CNY/kg
OtherStack replacement15%Percentage of electrolyzer construction cost
Water price4.1CNY/ton
Table 8. Initial investment cost of a 20 MW PV plant in Suqian city.
BreakdownUnit Cost (CNY/W) Total   Cos t   ( 10 6 CNY ) Percentage of Total Investment
Equipment procurement2.9829875.2%
Installation works0.32328.1%
Construction0.464611.6%
Other costs0.2205.1%
Total initial investment3.96396100%
Data source: China Photovoltaic Industry Association (CPIA).
Table 9. Results of economic indicators of the two projects.
Project NPV   ( 10 4 CNY ) IRRDynamic Payback Period (Years)
PV + ALK35,619.7114.3%10.05
PV + PEM27,656.0311.7%12.82
Table 10. Base values of sensitivity analysis factors.
FactorDiscount RatePEM Electrolyzer CAPEX (CNY/kW)Hydrogen Price (CNY/kg)PV CAPEX
(CNY/kW)
PV Conversion Efficiency
Base Value8%629847396024%
Table 11. Variation in NPV with individual changes in each factor.
Change in Base ValueDiscount RatePEM Electrolyzer CAPEX Hydrogen Price PV CAPEXPV Conversion Efficiency
−10%28.7%16.4%−48.5%14.3%−45.5%
−5%13.9%8.2%−24.2%7.1%−22.7%
0%0.0%0.0%0.0%0.0%0.0%
5%−13.2%−8.2%24.2%−7.1%22.7%
10%−25.7%−16.4%48.5%−14.3%45.5%
Table 12. Learning curve regression results.
ParameterRegression Coefficient EstimateStandard Errorp-ValueF-Test ValueR-SquaredAdjusted R-Squared
Value0.426960.02228<0.001367.10.98390.9812
Table 13. Forecast of future installed PV and electrolyzer capacity [35].
Year2020203020402050
Cumulative installed capacity of photovoltaic (GW)250102523003450
Cumulative installed capacity of electrolyzer (GW)170200300
Table 14. Monte Carlo simulation parameter settings.
System ModuleTechnical DataYearPessimistic
Value
Most Likely
Value
Optimistic
Value
PhotovoltaicTracking system factor202011.11.25
203011.11.25
205011.11.25
Conversion efficiency202016%18%25%
203018%20%30%
205020%30%40%
Learning rate-14%25.6%34%
Unit capital cost (CNY/W)202033.54.5
PEM
electrolyzer
Degradation rate20201.0%0.7%0.5%
20300.5%0.3%0.1%
20500.3%0.1%0.05%
Hydrogen production efficiency (kWh/kgH2)2020595245
2030524845
2050484541
Learning rate-13%18%20%
Unit capital cost (CNY/W)20206812
Disclaimer/Publisher’s Note: The statements, opinions and data contained in all publications are solely those of the individual author(s) and contributor(s) and not of MDPI and/or the editor(s). MDPI and/or the editor(s) disclaim responsibility for any injury to people or property resulting from any ideas, methods, instructions or products referred to in the content.

