Article

Development and Application of a Purification Method for the Determination of Three EDCs Isotopes in Sediments and Water

1
School of Environmental Science and Engineering, Sun Yat-Sen University, Guangzhou 510006, China
2
Guangdong Provincial Key Laboratory of Environmental Pollution Control and Remediation Technology, Guangzhou 510006, China
3
POWERCHINA Huadong Engineering Corporation Limted, No.201 Gaojiao Road, Yuhang District, Hangzhou 311122, China
*
Author to whom correspondence should be addressed.
Sustainability 2023, 15(11), 8583; https://doi.org/10.3390/su15118583
Submission received: 15 May 2023 / Revised: 23 May 2023 / Accepted: 23 May 2023 / Published: 25 May 2023

Abstract

:
Compound-specific stable isotope analysis (CSIA) is an efficient method for source apportionment and the identification of the transformation process in organic compounds. However, most studies of CSIA are still limited to laboratory experiments. Few studies used have CSIA in an in situ environment due to the complexity of environmental samples. Therefore, a purification method for analyzing the carbon isotope ratios of three phenolic endocrine disrupting compounds (EDCs) (nonylphenols (NPs), octylphenol (OP), and bisphenol A(BPA)) in sediment and water samples was developed in this study. The silica gel column was used to isolate EDCs from complex matrices with multiple organic solvents. Gas chromatography/mass spectrometry was used to quantify the targeted EDCs and analyze the purity of the extracts in full-scan mode. The interfering peaks disappeared, the baseline was sharply reduced, and all the target compounds appeared as single peaks in the chromatogram after purification. Analyzing the standard samples with known isotope ratios showed that the purification treatment did not cause isotope fractionation. The isotopic difference before and after purification was less than 0.04. The method was successfully used to analyze the isotope composition of BPA, OP, and NPs in river water and sediments in the Guangzhou River, Pearl River Delta, South China. Sewage discharge significantly affected the carbon isotope values of BPA, OP and NPs in Guangzhou rivers, suggesting that sewage discharge is the main source of EDCs in the Guangzhou rivers. There is a significant correlation between the isotopic values and concentrations of OP and NPs in sediments, indicating that they may undergo chemical transformation.

1. Introduction

With the intensification of human activities, numerous pollutants are discharged into the environment, leading to the shortage of available clean water resources. Micropollutants, typically detected at low concentrations (ng/L to μg/L) [1], are receiving increasing attention. Bisphenol A (BPA), 4-t-octylphenol (OP), and nonylphenols (NPs), which are known as endocrine disrupting compounds (EDCs), have recently attracted increasing research interest due to their widespread distribution in the environment and potential risk to organisms. BPA is the raw material used for the synthesis of epoxy resin and polycarbonate, and approximately 2.2 million tons of BPA is globally produced every year [2]. OP and NPs originate from the degradation of alkylphenol ethoxylates (APEOs), which are a non-ionic surfactant widely used in a variety of fields. OP and NPs are more toxic and durable in the environment compared to APEOs [3]. Due to the numerous sources of EDCs, it is very difficult to identify the sources of EDCs in the environment, which is not conducive to water resource management and sustainable utilization.
Many studies have focused on the spatial distribution, seasonal variation and ecological risk of phenolic EDCs in rivers [4,5,6], estuaries [7,8], groundwater [9], and soils [9]. However, few studies have revealed the sources and environmental behavior of phenolic EDCs due to their complexity, and the information obtained from specific environments is often limited. It is difficult to analyze the sources and transformation processes of organic compounds in the environment solely based on concentration data because organic compounds may be diluted, volatilized, adsorbed, or degraded in the environment [10]. All of these processes lead to changes in the concentrations of compounds, thus altering the information on their sources. Furthermore, organic compounds may also have multiple environmental transformation processes, causing more analysis difficulties.
Compound-specific stable isotope analysis (CSIA) is an efficient method for source apportionment and identifying the transformation process of organic compounds. Usually, the compositional elements of organic compounds include C, H, O, N, Cl, etc. The isotope compositions of these elements in individual compounds can be measured using gas or liquid chromatography coupled with isotope ratio mass spectrometry. The most commonly analyzed elements included carbon (13C/12C) [11], hydrogen (2H/1H) [12,13], and nitrogen (15N/14N) [14]. The isotope compositions of an organic compound are determined by the isotope compositions of their raw materials and their formation conditions and processes [15,16]. Once an organic compound is used for manufacturing purposes, its isotope composition is determined, and only the cleavage or formation of chemical bonds can significantly change its isotope composition [16]. In the degradation of organic compounds, lighter isotopes usually have faster reaction rates than heavier isotopes, resulting in the enrichment of heavier isotopes in residual fractions, while physical processes such as dilution, adsorption, and volatilization usually do not lead to isotope fractionation. CSIA has been applied to evaluate the biotic or abiotic degradation of hexachlorocyclohexane (HCH) [17], pesticides [18,19], chlorinated hydrocarbons [20,21], and PBDEs [22,23]. However, not all reactions will cause isotope fractionation. In this case, CSIA can be used to trace the source of organic compounds. Xiong et al. found that no significant carbon isotopic fractionation was observed during the biodegradation of BPA in a microcosmic experiment and deemed CSIA suitable for identifying the environmental source of BPA [24]. CSIA was also used to trace the sources of polychlorinated biphenyls (PCBs) [15].
Despite the many advantages of CSIA, most related studies are still limited to laboratory experiments, and few studies consider the use of CSIA in an in situ environment. To our knowledge, no research applies CSIA to phenolic EDCs in environmental samples. The occurrence of very low (ng/L or μg/L) concentrations of micropollutants and matrix effects are the two major analytical challenges that need to be addressed to extend CSIA approaches to micropollutants [1,25]. Commonly, CSIA relies on GC to separate target compounds from the matrix before transforming them into CO2, H2, N2, etc. (Figure 1). However, environmental samples are more complex, may contain many unknown compounds, and may co-elute with the target compounds and influence isotope ratio analysis. To meet instrumental measurement requirements and ensure the accuracy and precision of the results, CSIA needs no less than 10 ng C per injection. Since the volume of each injection is between 1 and 2 μL, it means that the concentrations of target compounds need to be larger than 10 mg/L. For most emerging pollutants, their environmental concentrations are mostly in ng/L or μg/L. It is necessary to extract the target compounds from the environmental medium. Some common extraction methods, such as solid-phase extraction (SPE), are used to extract impurities with targets and affect CSIA. Therefore, extracts must be purified before analysis. Typical purification procedures used for the separation of EDCs in environmental samples include gel permeation chromatography and silica gel separation [8,26]. However, these purification methods are normally designed for quantification analysis and do not meet CSIA measurement requirements. To the best of our knowledge, no purification methods used for the CSIA of EDCs have been developed.
In this study, an effective silica gel chromatographic purification and separation method for BPA, OP, and NPs in river water and sediments for CSIA was developed. We selected a suitable solvent that could separate the target compounds from the complex matrix. The influence of the whole purification process on isotope fractionation was analyzed. Finally, the method was used to analyze the isotope composition of BPA, OP, and NPs in river water and sediments in the Guangzhou River, Pearl River Delta, South China.

2. Materials and Methods

2.1. Chemicals and Materials

BPA, OP, and NPs (purity > 97%) were obtained from Sigma-Aldrich (St. Louis, MO, USA). HPLC-grade methanol, n-hexane (HEX), dichloromethane (DCM), and acetone were obtained from Anpel (Shanghai, China). N, O-bis (trimethylsilyl) trifluoroacetamide (BSTFA) containing 1% trimethylchlorosilane (TMCS) was purchased from Aladdin (Shanghai, China). The SPE cartridges (CNW HLB, 500 mg, 6 mL) were purchased from Anpel (China). Anhydrous sodium sulfate and silica gel (300–400 mesh) were obtained from the Guangzhou Chemical Reagent Factory and Qingdao Oceanic Chemical Factory, respectively. Glass fiber filters (GF/F) were obtained from Whatman (Maidstone, UK).
Before use, silica gel was baked at 120 °C for 12 h, and sodium sulfate was baked at 450 °C for 4 h. Two types of silica gel column were used. Silica gel column 1 (i.d. 1.5 cm, length 10 cm) was filled with 1.5 g anhydrous sodium sulfate, 1 g silica gel, and 1.5 g anhydrous sodium sulfate from bottom to top, respectively. Silica gel column 2 (i.d. 1.5 cm, length 20 cm) was filled with 1.5 g anhydrous sodium sulfate, 5.5 g silica gel, and 1.5 g anhydrous sodium sulfate from bottom to top, respectively. The silica gel column was rinsed with 30 mL acetone and 30 mL HEX in sequence before use.

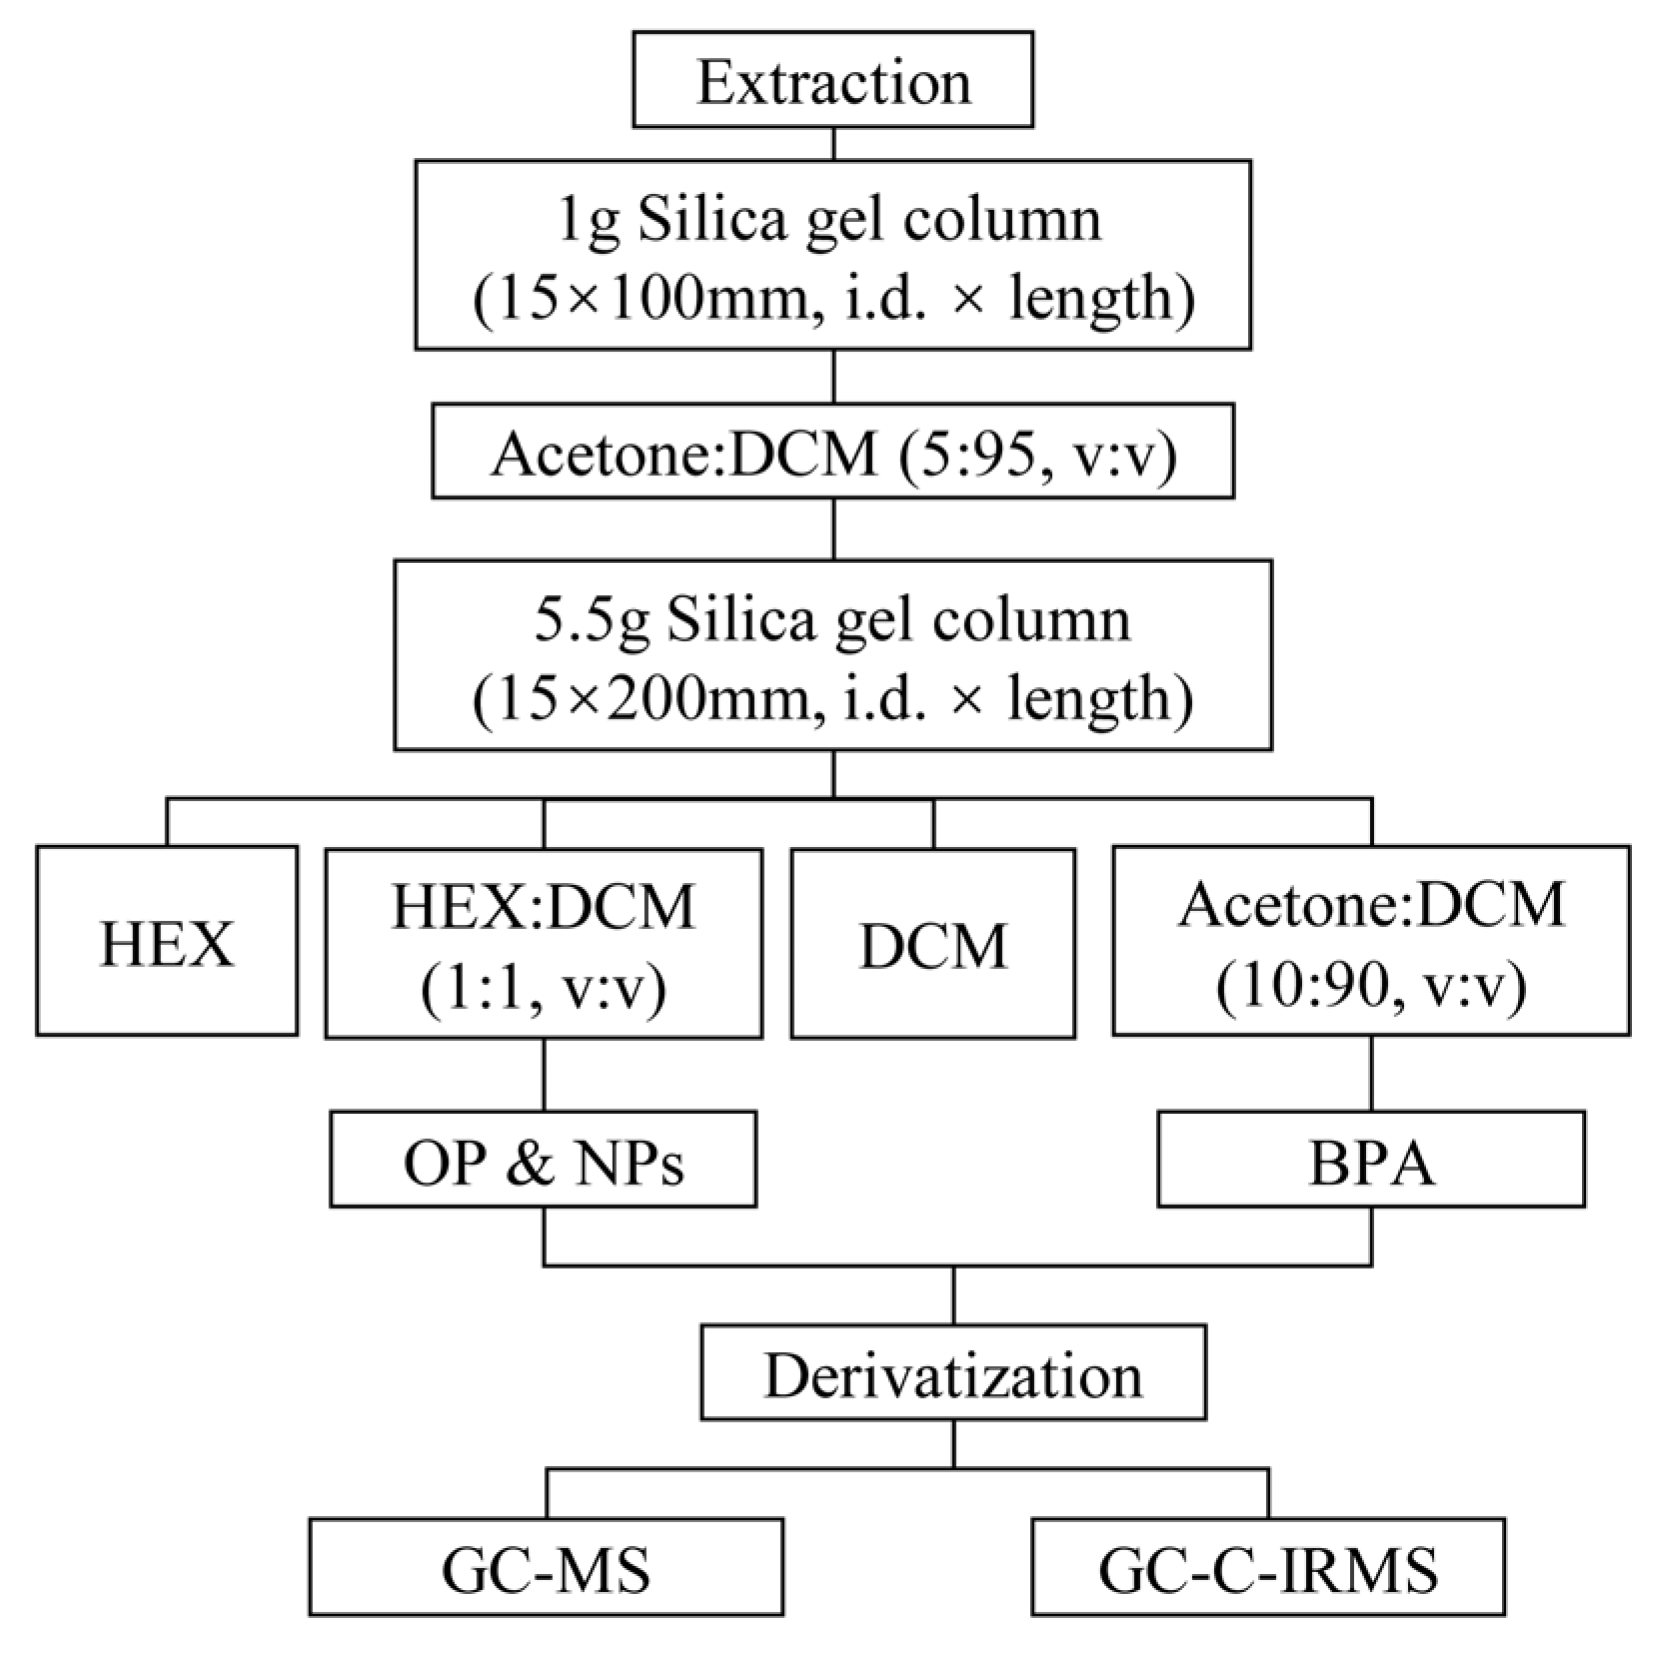
2.2. Sample Extraction and Purification

The procedure to extract and purify EDCs from sediments and water samples for CSIA is listed as follows (Figure 2).
Step 1: Extraction. For sediment samples, 20 g of air-dried sediment was placed in a 40 mL glass bottle. Next, 20 mL of methanol was added, sonicated for 20 min, centrifuged at 3000 rpm, and then supernatants were collected. The extraction was performed five times. Then, all extracts were collected and concentrated to near dryness under a N2 stream.
For water samples, an HLB cartridge was used to extract the target compounds from water. Glass fiber filters were used to filter a total of 10 L of river water samples. The HLB cartridge was pre-conditioned with 10 mL of methanol and 10 mL of pure water. The filtered water was acidified to pH 2 with 1 M HCl before being fed through the HLB cartridge at a flow rate of 5 to 10 mL/min. The cartridge was then dried under N2, washed with 10 mL of pure water, eluted with 10 mL of methanol under gravity, and the eluent was collected. Under a moderate stream of N2, the eluent was concentrated until dry.
Step 2: Pre-purification. The extracts were placed on the top of column 1 after being redissolved in no more than 3 mL of dichloromethane. The extracts were then eluted using 15 mL of DCM/acetone (9:1, v/v). The eluent was collected and concentrated to near dryness under a mild N2 stream.
Step 3: Purification and separation. The eluent collected in Step 2 was redissolved with less than 3 mL DCM and transferred to silica gel column 2. Silica gel column 2 was then successively eluted with the following solvents: 50 mL HEX, 100 mL HEX/DCM (1:1, v/v), 50 mL DCM, and 150 mL HEX/acetone (9:1, v/v). The elution rate was maintained at approximately 1 mL/min, and the eluent was collected in every 10 mL of solution. OP and NPs were eluted using HEX/DCM (1:1, v/v), and BPA was eluted using HEX/acetone (9:1, v/v).
Step 4: Derivatization. The eluent was blown to dryness under a N2 stream in a 300 μL glass vial, spiked with 80 μL HEX and 20 μL BSTFA, and then reacted at 65 °C for 1 h.

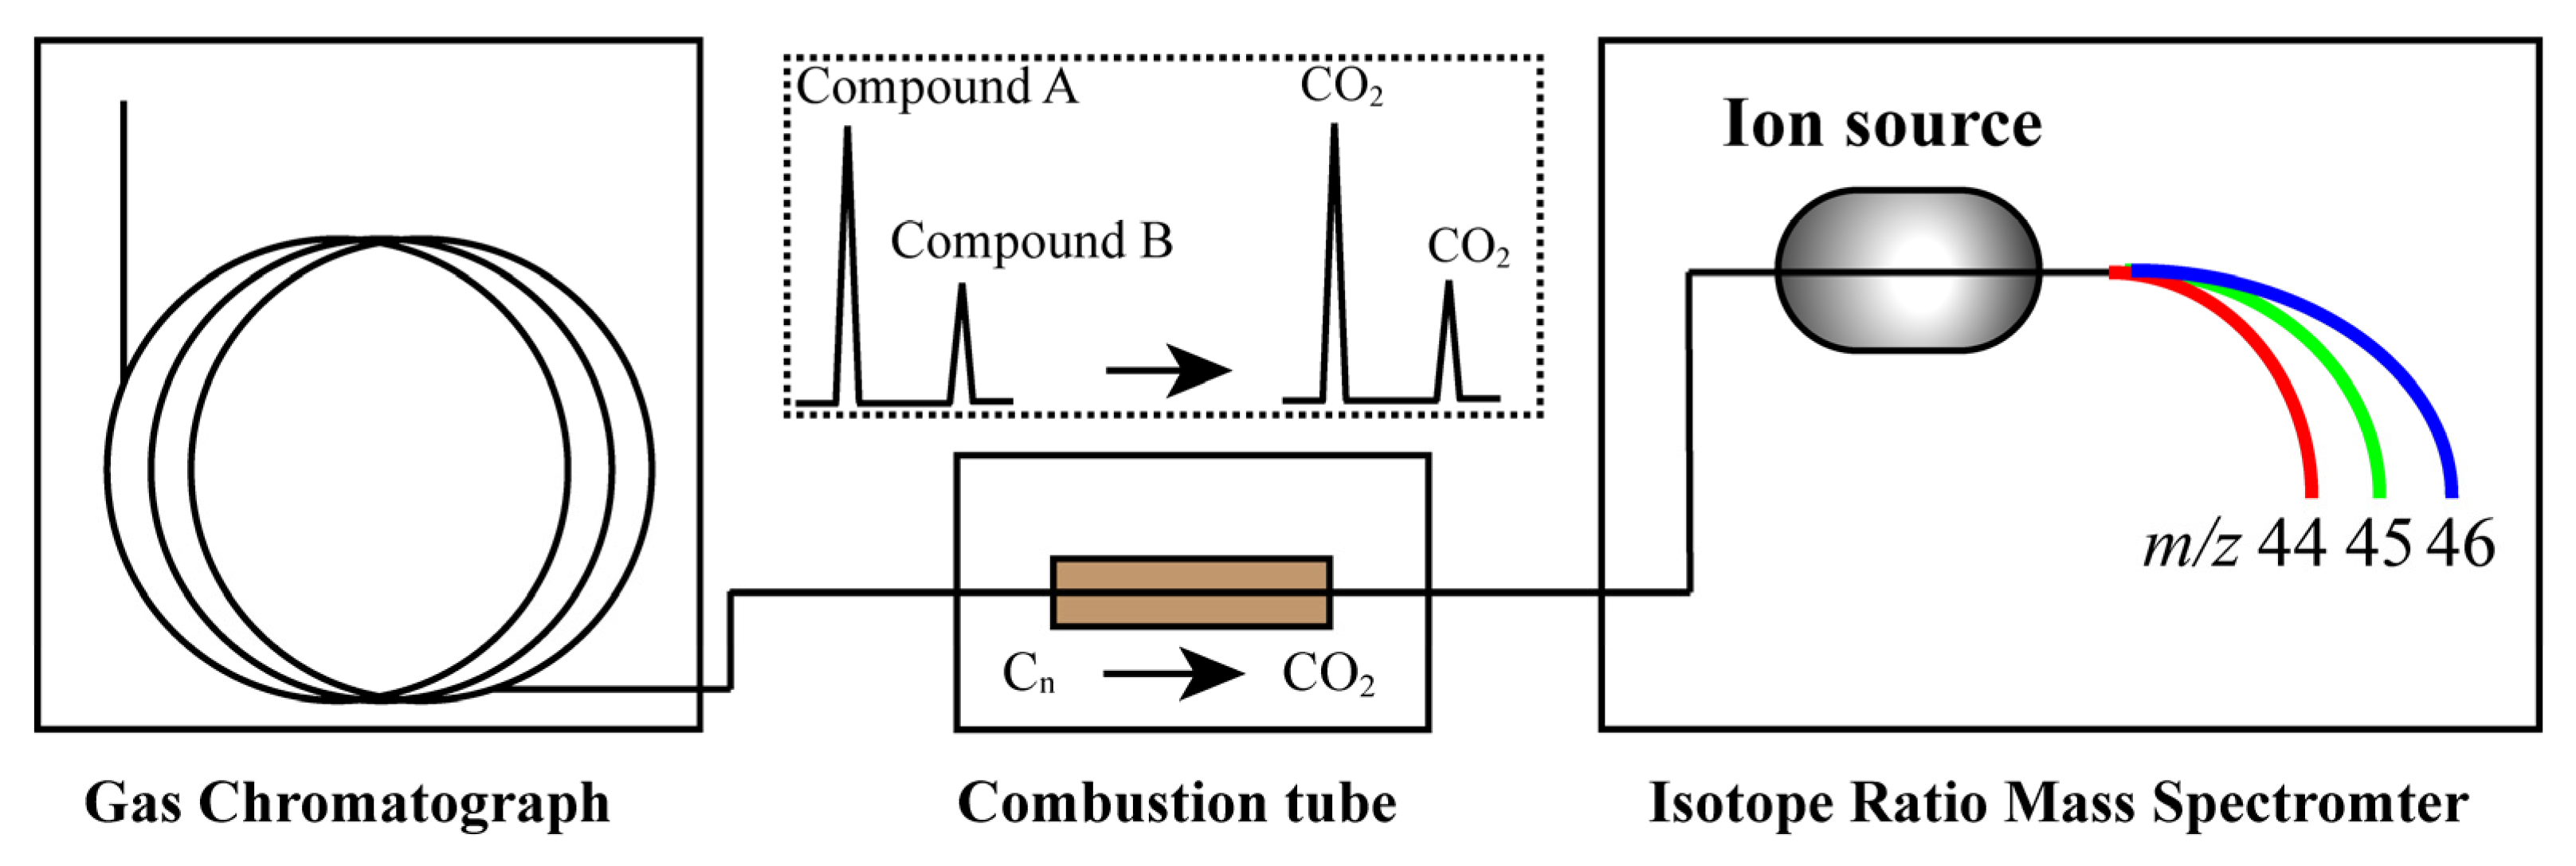
2.3. Instrumental Analysis

The qualitative and quantitative analyses of BPA, OP, and NPs were conducted using gas chromatography/mass spectrometry (GC/MS QP-2010 Ultra, Shimadzu, Kyoto, Japan). A DB-5 ms column (30 m × 0.25 μm × 0.25 mm) was used. Helium was used as the carrier gas with a rate of 1.2 mL/min. The temperature of the injection port, interface, and ion source were set at 250 °C, 280 °C and 200 °C, respectively. The initial oven temperature was 100 °C and held for 2 min. It was then increased to 250 °C at 5 °C/min, followed by an increase to 280 °C at 3 °C/min, where the temperature was maintained for 1 min. Full-scan mode (from 50 to 400 m/z) was employed to quantify and analyze the purity of BPA, OP, and NPs. The purity of BPA and OP was confirmed by comparing the similarity with the mass spectrum in the standard spectrum library (NIST14), and the purity of the NPs was confirmed by comparing the similarity with the mass spectrum of standard compounds.
Compound-specific carbon isotope analysis was conducted using gas chromatography (Trace 1310, Thermo Fisher, Waltham, MA, USA) coupled to an isotope ratio mass spectrometer (Delta V Advantage, Thermo Fisher) via a combustion interface (GC ISO LINK II, Thermo Fisher). The gas chromatographic column was DP-5 ms (30 m × 0.25 μm × 0.25 mm i.d.). Helium was used as the carrier gas with a rate of 1.2 mL/min, and the inlet temperature was set at 250 °C. The oven temperature was maintained at 100 °C for 2 min, increased to 250 °C at 5 °C/min, and finally, increased to 280 °C at 3 °C/min, where the temperature was maintained for 1 min. The combustion tube temperature was set at 1000 °C. The carbon isotope results are represented in delta δ notation:
δ13C = ((Rsample/Rstandard) − 1) × 1000
where Rsample and Rstandard are the 13C/12C ratios of the sample and reference standard Vienna Pee Dee Belemnite (VPDB), respectively.
The δ13C values of the underivatized BPA, OP, NPs, and the BSTFA reagent were determined using EA/IRMS. Each standard compound was analyzed at least 10 times, and the final 6 results were obtained. Previous research showed that the derivatization process does not cause isotopic fractionation [27]. Due to the introduction of new carbon atoms, the isotope ratios of underivatized EDCs (δ13CEDCs) and derivatized EDCs (δ13C′EDCs) was as follows:
δ13C′EDCs = fEDCs δ13CEDCs + fBSTFA δ13CBSTFA
where fEDCs is the proportion of EDC carbon atoms and fBSTFA is the proportion of carbon atoms in the trimethylsilyl (TMS) group to the total number of carbon atoms in the derived products, respectively. In this study, the fEDCs values of OP, NP, and BPA were 14/17, 5/6, and 5/7, respectively, and the corresponding fBSTFA values were 3/17, 1/6, and 2/7, respectively.

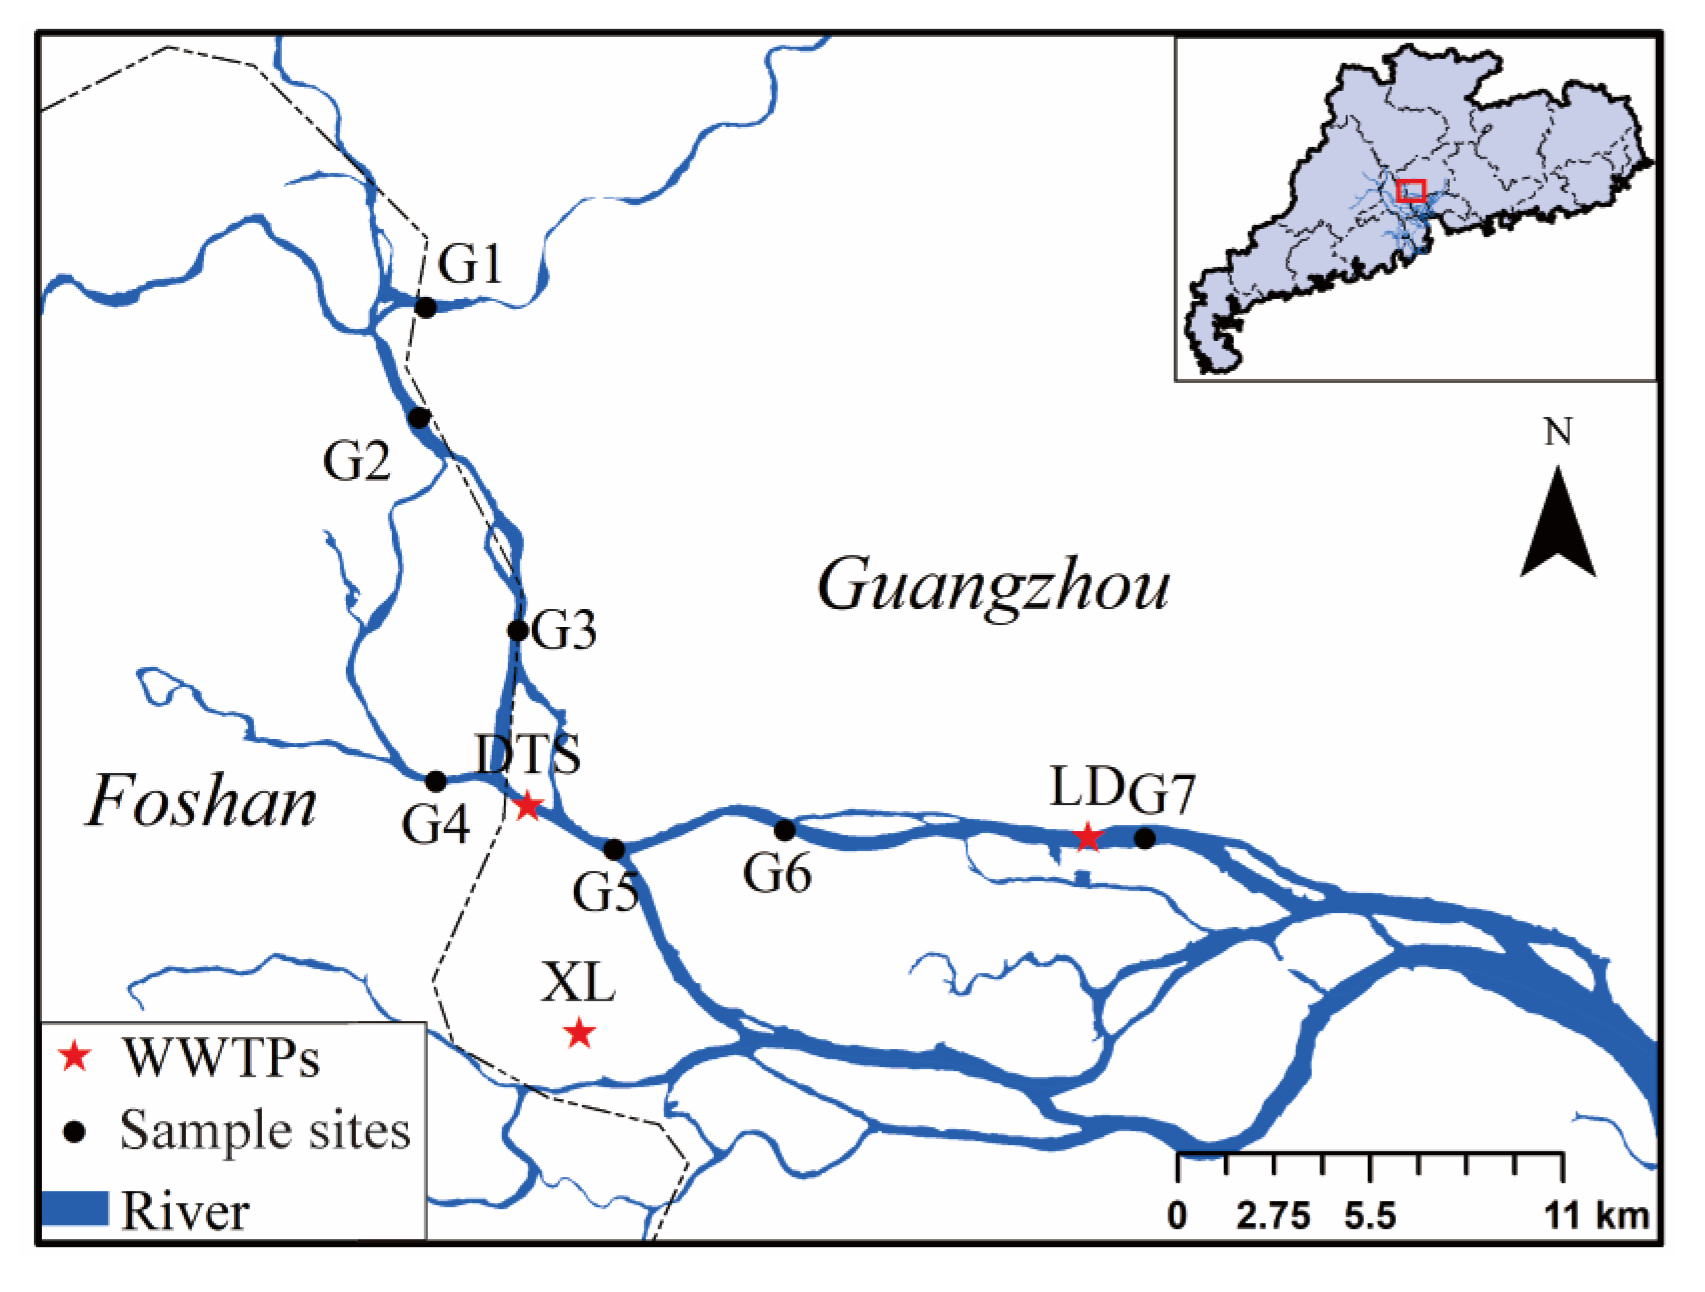
2.4. Study Region and Sample Collection

The Guangzhou River flows through the city of Guangzhou, which is the most highly developed city in South China. In September 2022, river water samples were collected from 7 sites in the Guangzhou River (from G1 to G7, see Figure 3). Effluents from three municipal wastewater treatment plants (WWTPs) (i.e., DTS, XL, and LD) were also collected. During sampling, 10 L of surface river water was collected in a glass bottle at each sampling site. About 100 g of sediment was collected from the riverbed using a stainless grab at sites G1, G2, G4, G5, and G7 and stored in polypropylene bags. The water and sediment samples were stored at 4 °C, returned to the laboratory and stored at 4 °C and −20 °C before analysis, respectively. The extraction of all water and sediment samples was completed within 7 days and instrumental analysis was conducted over 30 days.

3. Results and Discussion

3.1. The Accuracy and Precision of CSIA

Before the analysis of EDCs using GC/MS or GC/C/IRMS, samples were derivatized using BSTFA. The hydrogen atoms of the OH group were replaced by the TMS group. It is proven that the derivatization process does not cause isotopic fractionation [24]. Due to the introduction of new carbon atoms, the δ13C value determined using GC-C-IRMS was the isotope value of the derivative, and the isotope values of the original compound could be calculated using Equation (2). The underivatized derivatives and calculated δ13C values of the EDCs’ standards and BSTFA are shown in Table 1. The δ13C values of OP, NP, and BPA derivatives were −26.80‰, −29.04‰, and −28.91‰, respectively, with the standard deviation (SD) ranging from 0.30‰ to 0.47‰ (Table 1). Compared with the results obtained using hydroxy derivatization, the SD in this study is slightly larger than that in previous studies (ranging from 0.16‰ to 0.24‰) [24]. However, the values in our results are smaller than those in other CSIA results (ranging from 0.05‰ to 0.78‰) [28], and the relative standard deviation (RSD) is still less than 2%, indicating that the results are still reliable. The accuracy of the GC/C/IRMS system can be accessed by determining the difference between the calculated and underivatized δ13C values (∆δ13C). In this study, the ∆δ13C ranged from 0.12‰ to 0.28‰ (Table 1), which was within the reasonable analysis error range.

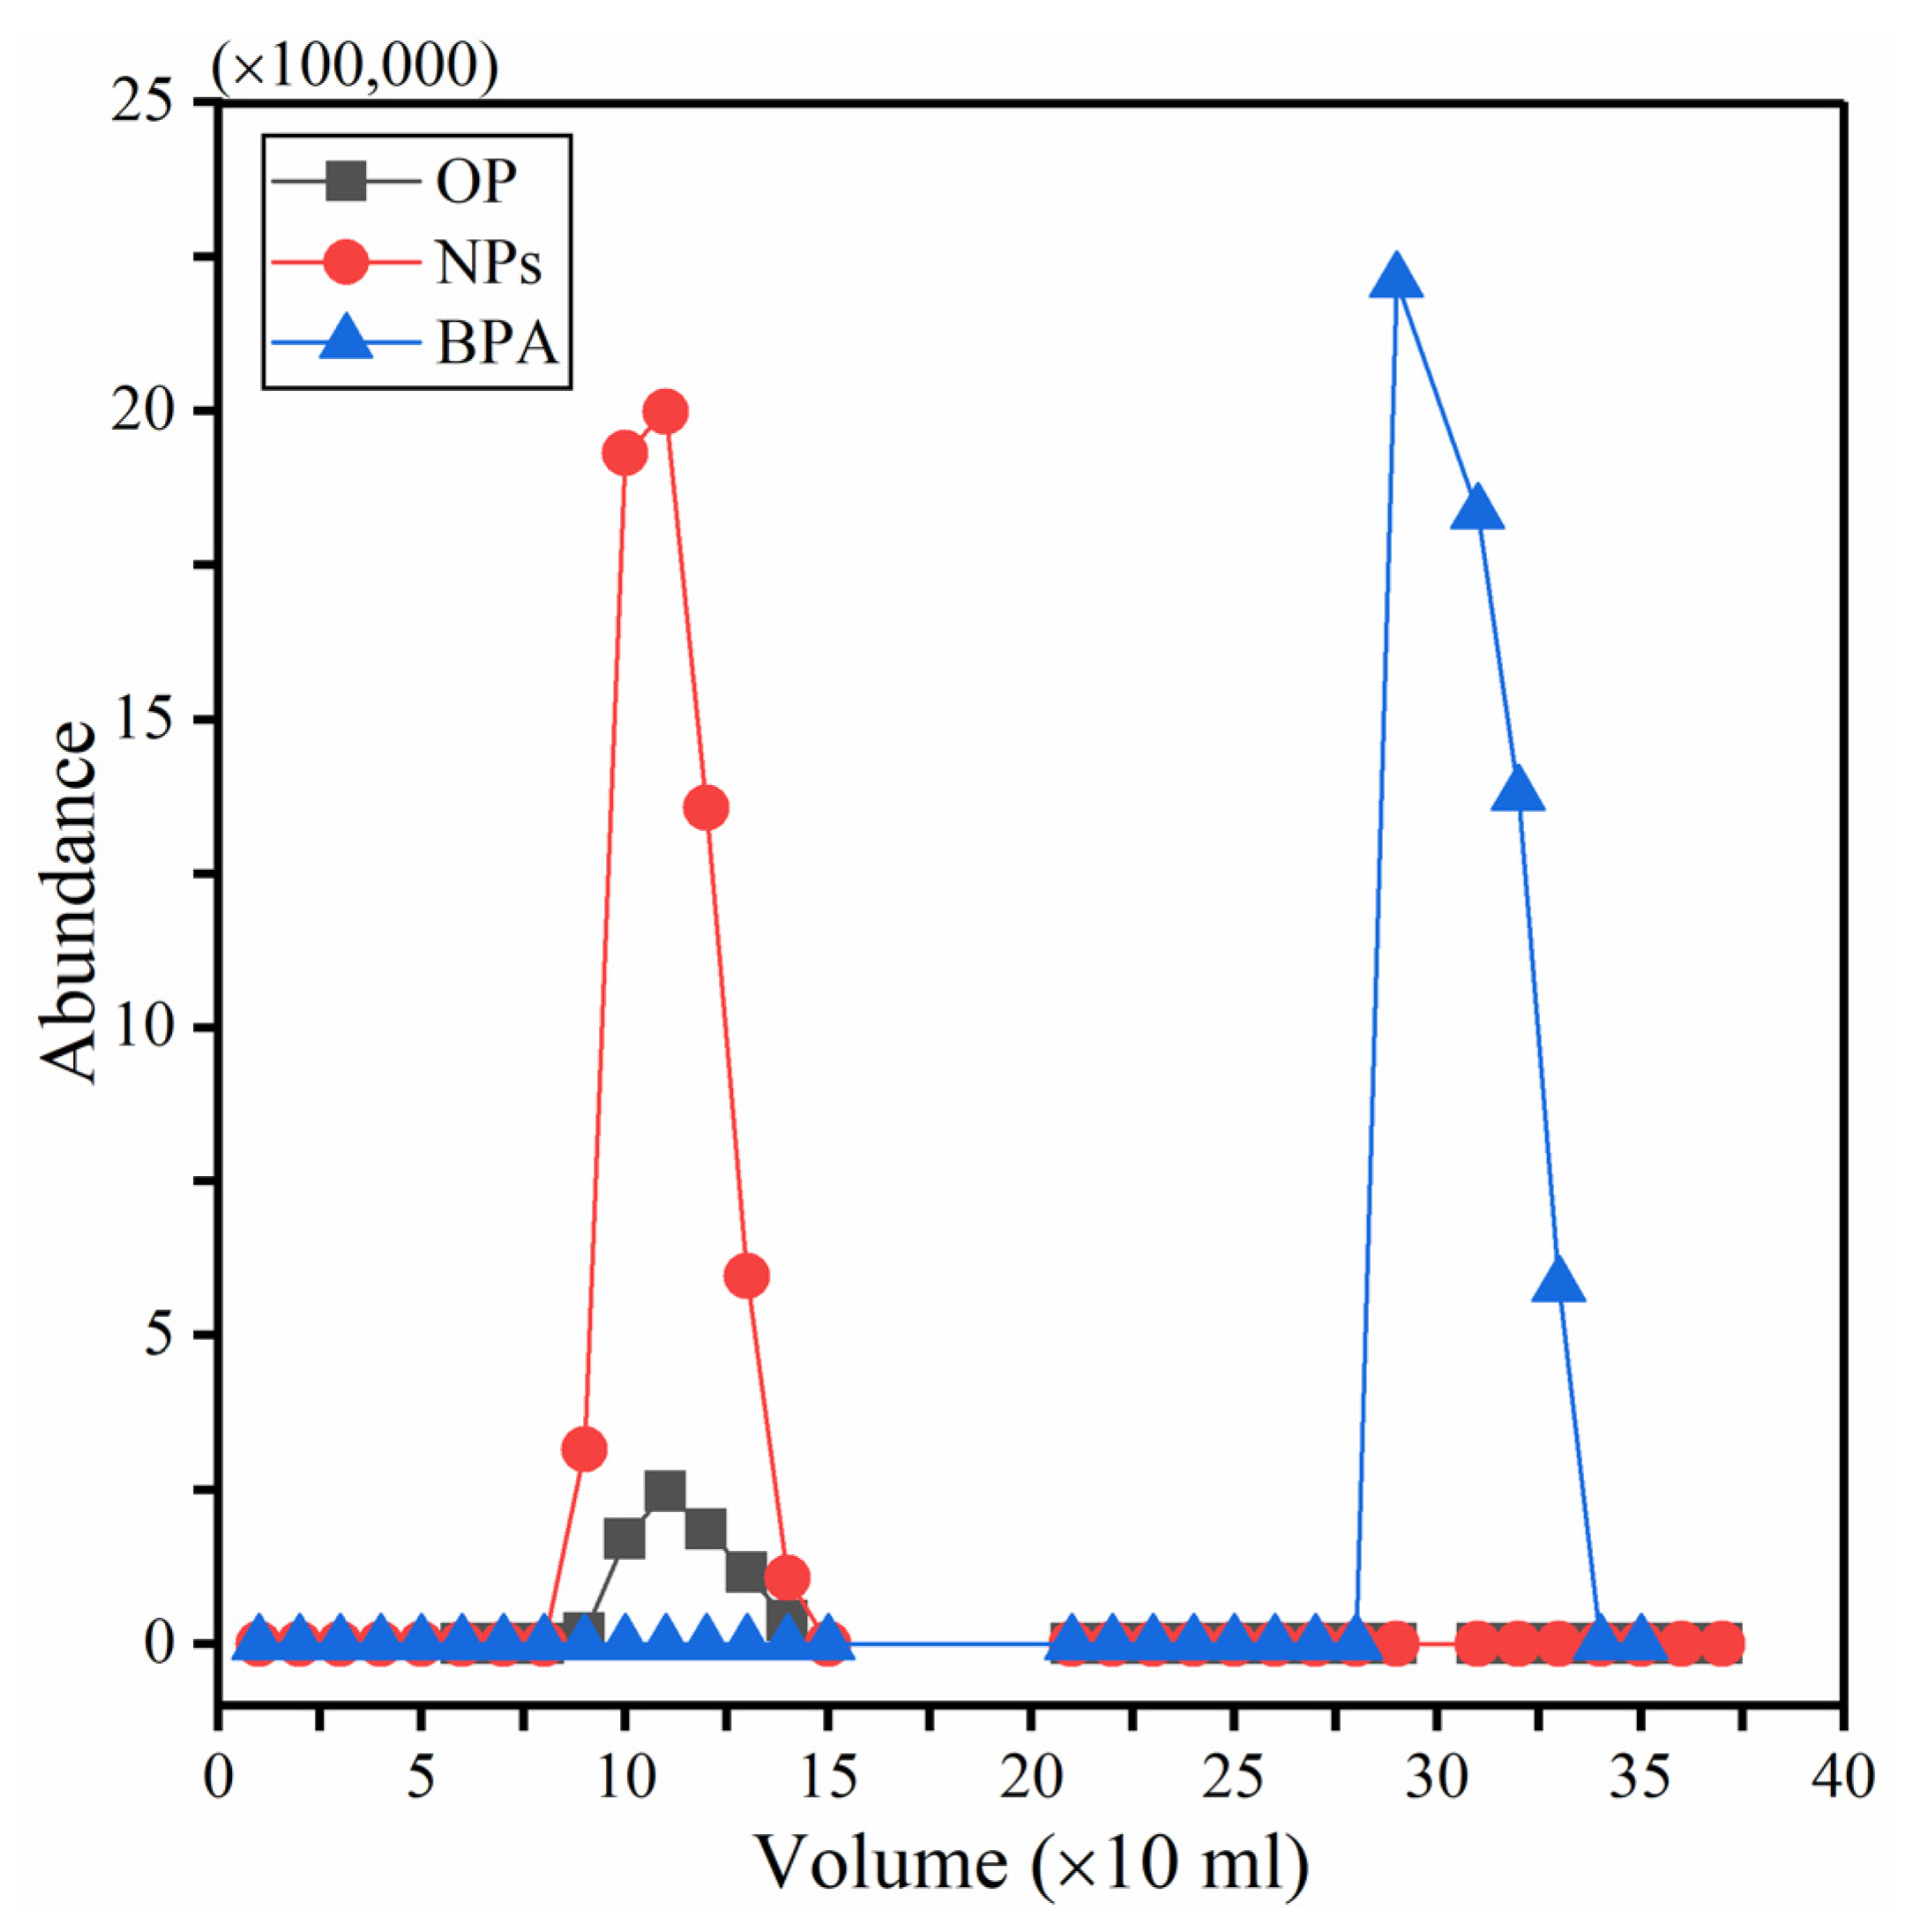
3.2. Purification Procedures

The extract was initially purified with silica gel column 1 to remove insoluble matters and some impurities. This purification method is commonly used for the quantitative analysis of EDC concentration in soil or sediment. An appropriate eluent ensures that the target substance is eluted while most of the impurities are retained on the column. A mixture of acetone and DCM (5:95) was used. After purification in Step 2, the sample was able to meet the quantitative analysis requirement of EDCs by GCMS. However, as shown in Figure S1a no target compounds were identified using the chromatogram. The full-scan results showed that there were still many interfering peaks, and the baseline was very high, which affected the determination of isotopes.
The eluent was then further purified using silica gel column 2. Column 2 separates compounds on the basis of their different penetrating velocity values due to their polarity when eluted with organic solvents. The key point of this step is to find the proper solvent. After many tests, four organic solvents were used to elute the column. Firstly, 50 mL of HEX was used for elution, and the analysis of the eluent showed that the EDCs were not eluted (Figure 4). Secondly, the silica column 2 was eluted with 100 mL HEX/DCM (1:1, v/v). The results showed that the OP and NPs were eluted out between the 3rd and 8th 10 mL HEX /DCM fractions (Figure 4). To remove most of the interference matrixes, only the 4th to 6th fractions of 10 mL eluent were collected (named eluent A). Then, 50 mL of DCM was used, and no target compounds were eluted out in this fraction. Finally, 150 mL HEX/acetone (9:1, v/v) was used, and the BPA was eluted out in the 7th to 14th 10 mL HEX/acetone fractions (Figure 4), and the 7th to 9th 10 mL fractions were collected (named eluent B).
Figure S1 shows the results of the eluents A and B analyzed using GC/MS in full-scan mode. After the purification of silica gel column 2, the interfering peaks disappeared, and the baseline was sharply reduced. All target substances appeared as single peaks in the chromatogram. The similarity of the mass spectrum between the target substance and the standard substance was more than 93%, indicating that the main component of the corresponding peak was the target substance (Figure S2).

3.3. Isotope Fractionation in the Purification Procedures

To evaluate whether isotope fractionation occurs in the whole process, 100 μL of the standard samples with known concentrations (20 mg/L) and isotopic compositions (Table 1) were used in the purification procedures. Table 2 shows the recoveries and δ13C values before and after the purification procedures of the target substances. The average recoveries of OP, NPs, and BPA were 89.01%, 84.55%, and 84.60%, respectively. The δ13C values of OP, NPs, and BPA after the purification procedures were −27.39 ± 0.19‰, −29.93 ± 0.16‰, and −30.52 ± 0.20‰, respectively. Compared with the isotope value before treatment, the ∆δ13C values ranged from 0.01‰ to 0.04‰, indicating that the purification procedures did not cause isotope fractionation.

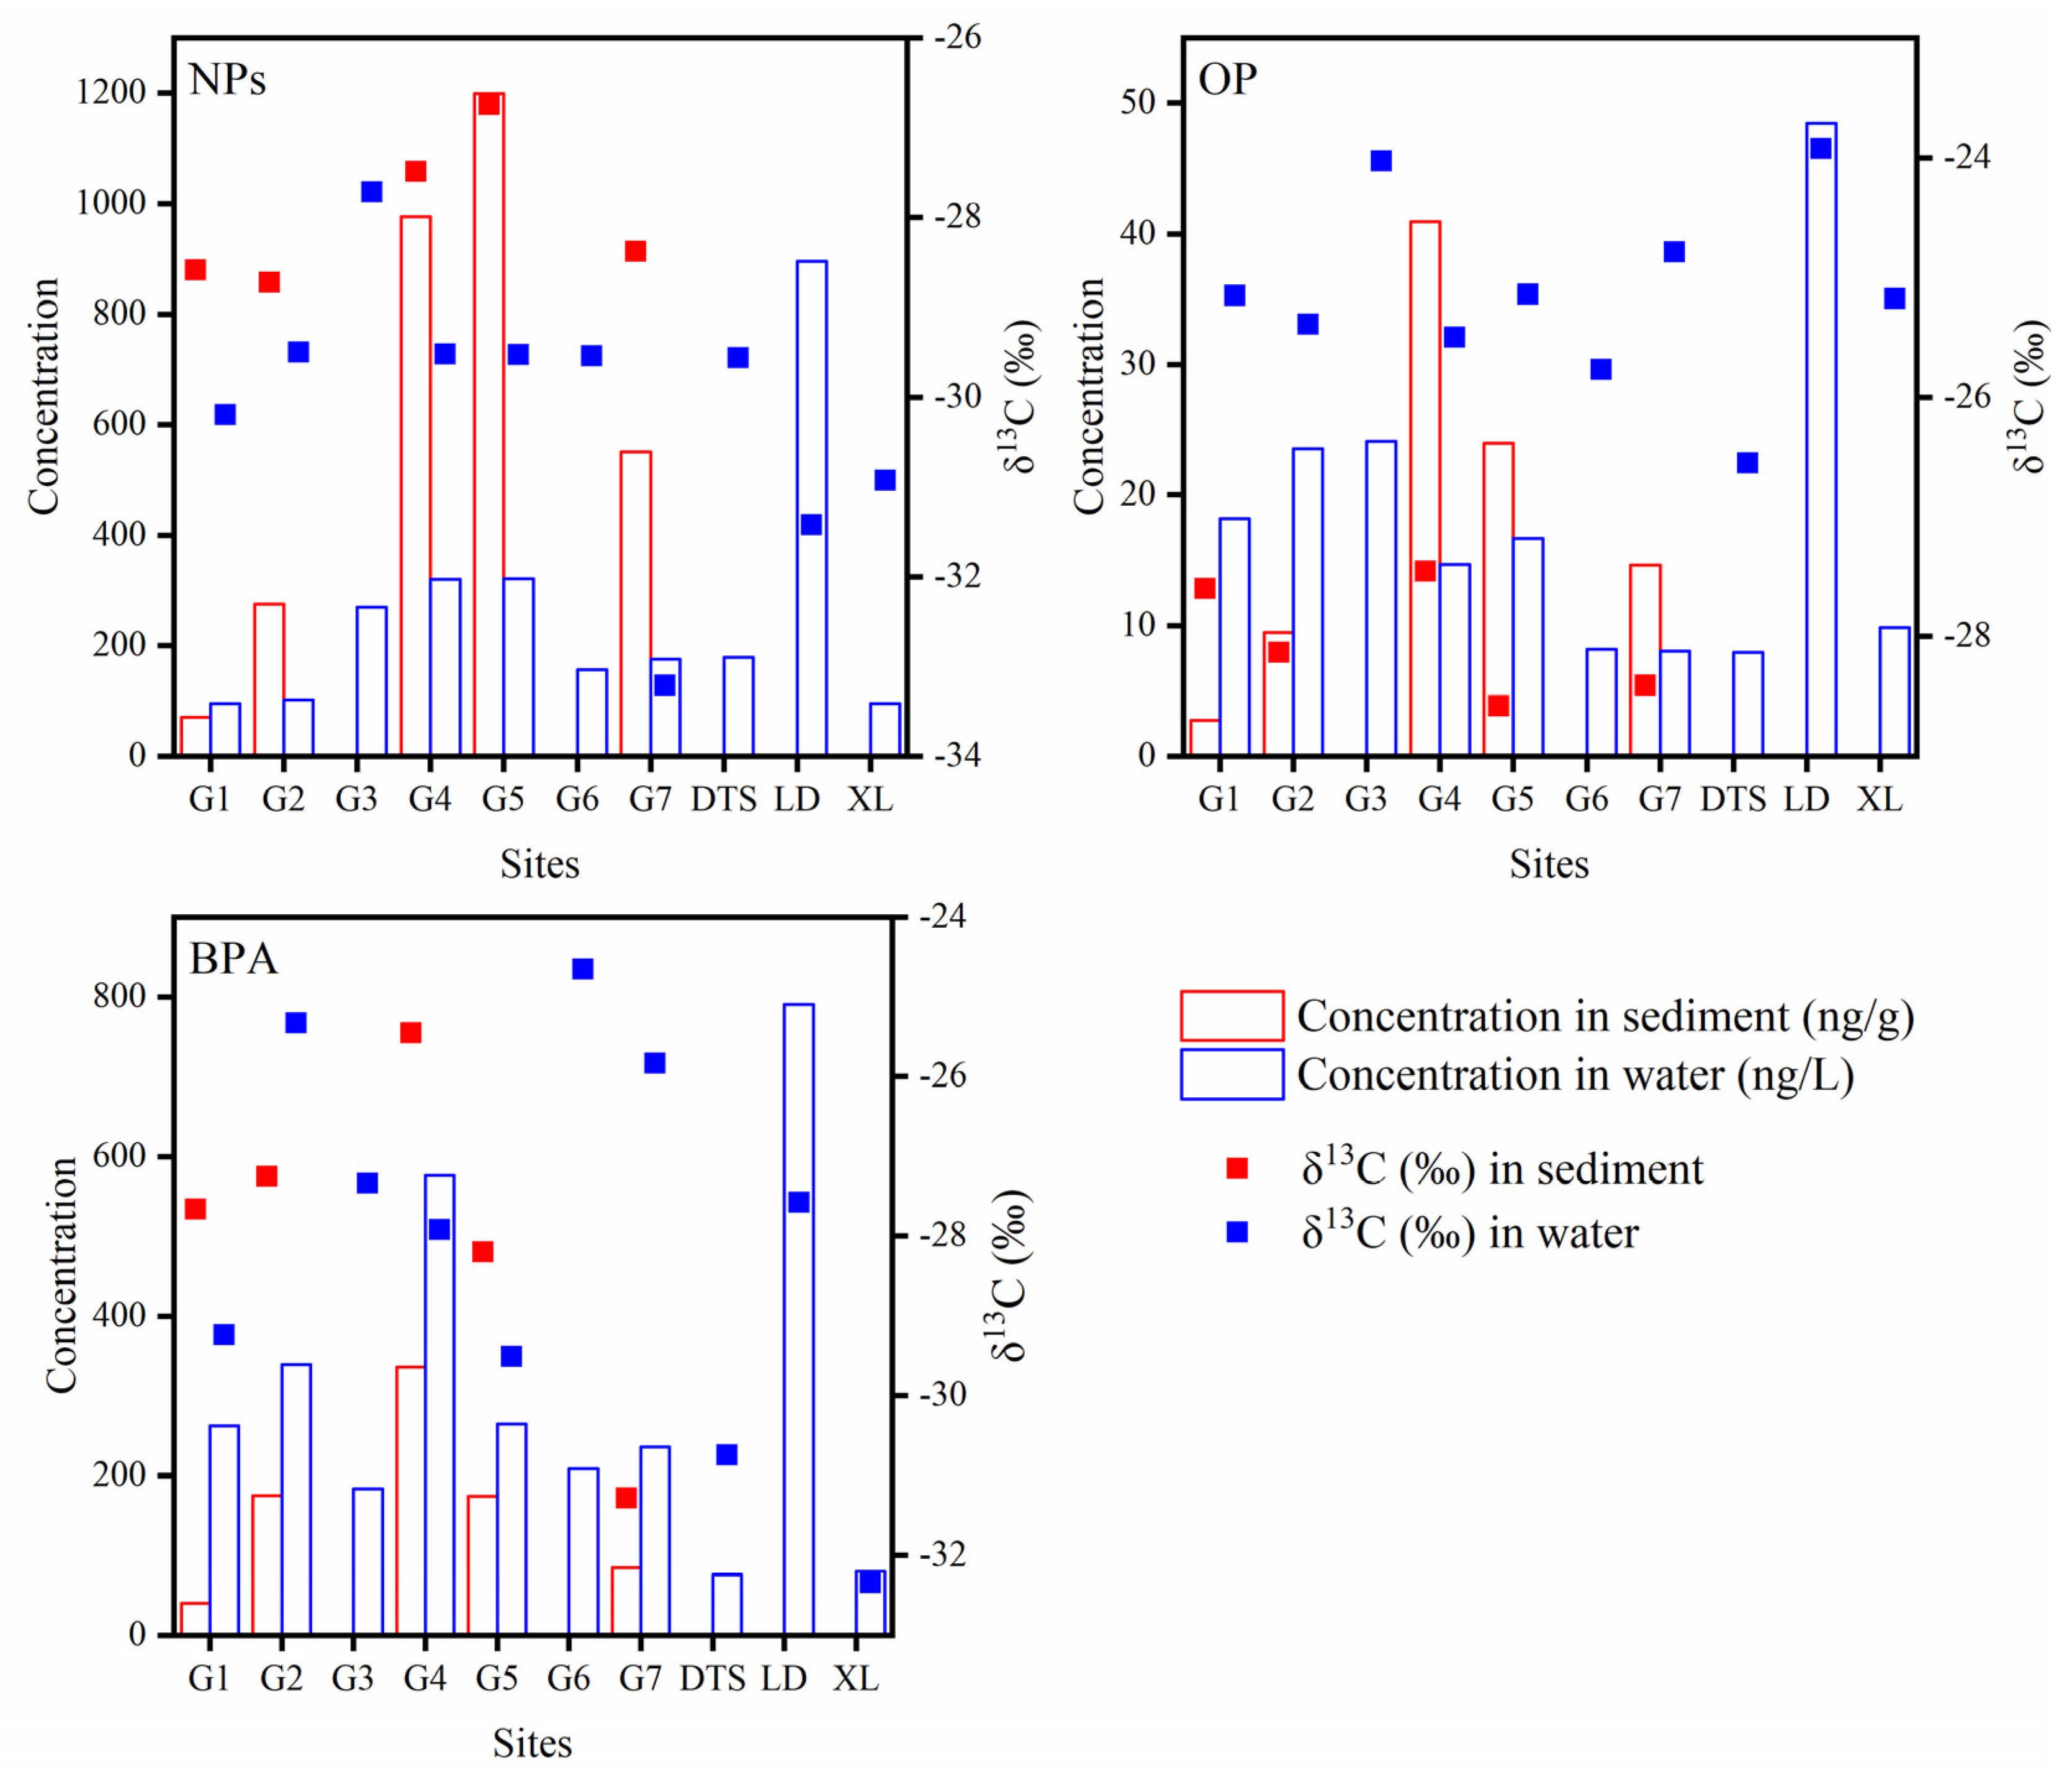
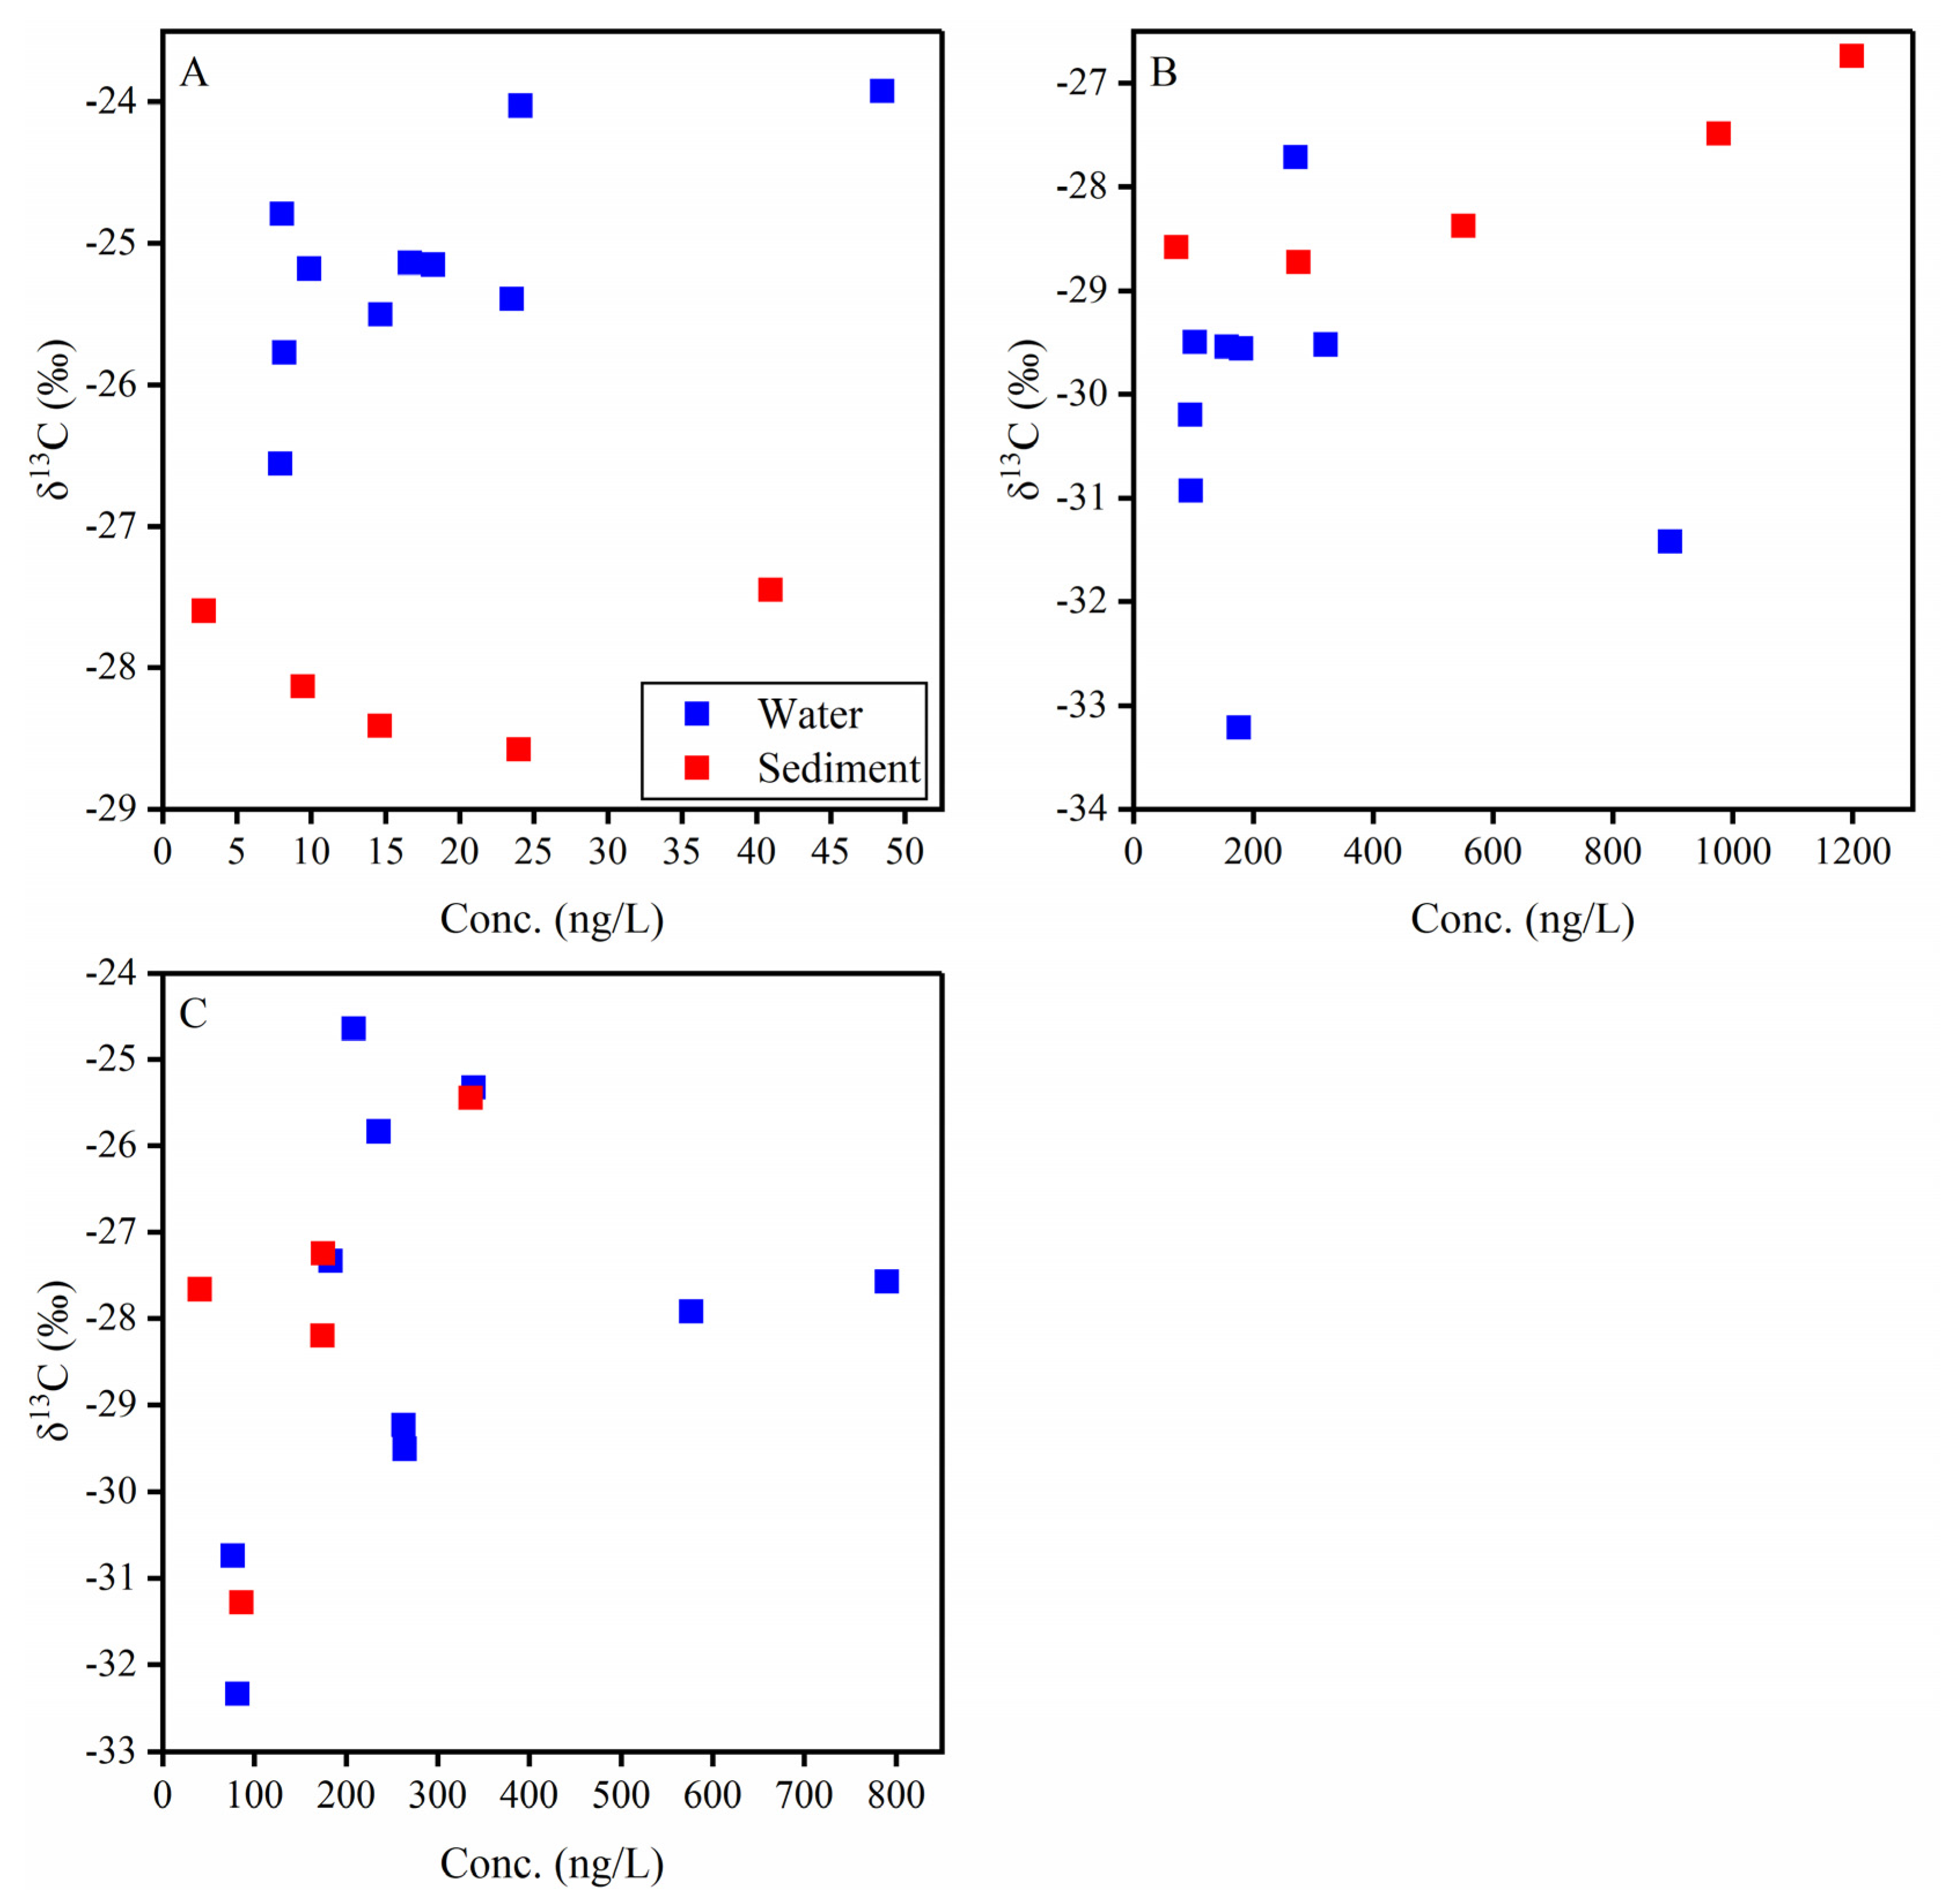
3.4. Environmental Application

The method was used to analyze the water and sediment samples collected from the Guangzhou River (Figure 3). In the previous study, high-level BPA and NPs (up to 10 μg/L) were reported in the river water and sediments in this region [29]. The concentrations and δ13C (‰) values are shown in Figure 5. The concentrations of BPA, OP, and NPs in the three WWTPs’ effluent ranged from 76.5 to 790.2 ng/L, 7.9 to 48.5 ng/L, and 95.9 to 895.5 ng/L, respectively. The δ13C values of BPA, OP, and NPs in the three WWTPs’ effluent ranged from −32.34‰ to −27.58‰, −26.55‰ to −23.93‰, and −31.42‰ to −29.56‰, respectively. The concentrations of NPs in the river water in the Guangzhou River ranged from 95.0 to 321.1 ng/L with δ13C values between −33.22‰ and −27.72‰. The concentrations of NPs in sediments ranged from 71.2 to 1198.6 ng/g. The δ13C values of the NPs in sediments ranged from −28.73‰ to −26.74‰ and were larger than those for water. The δ13C values of OP ranged from −28.58‰ to −27.45‰ and −25.77‰ to −24.03‰ in the sediments and river water, respectively. The δ13C values of BPA ranged from −31.28‰ to −25.45‰ and −29.51‰ to −24.65‰ in sediments and river water, respectively.
CSIA plays an important role in studying the sources of pollutants. Previous studies used CSIA to analyze the sources of PAHs [30] and PCBs [15] in sediments. In this study, CSIA was also used to study the sources of phenolic EDCs. As shown in Figure 5, NPs’ concentrations and δ13C values sharply increased at G3, indicating that there is an external pollutant source in the river section from G2 to G3, and this source should have a large δ13C value. Similar phenomena were observed for BPA and OP. For BPA, from G2 to G4, the increase in concentration and the decrease in isotope ratio indicated that a source with a lighter isotope ratio is discharged into river. However, further investigation and analysis are needed to clarify the specific sources of these pollutants.
The drainage of WWTPs has always been considered an important source of pollutants in rivers. This was also reflected in the isotope data. LD treatment plants discharge high concentrations of wastewater containing BPA, OP, and NPs into the river between G6 and G7, causing the concentrations of BPA and NPs to slightly increase at G7. Lower δ13C values of BPA in the effluents also decreased the δ13C values at G7. However, the δ13C values of NPs decreased to a very low value at G7, indicating that there may be other sources or processes leading to the decrease in the NPs’ δ13C values, aside from the drainage of the sewage treatment plant. In addition, although the effluent from the WWTP did not change the concentration of OP in G7, its isotope ratio was increased in the sewage plant.
As the degradation process advances, the isotope ratio of the residual will gradually increase. Many researchers have used this characteristic to study the change in isotope ratios in the process of the biotic or abiotic degradation of compounds [12,13,22,23]. In this study, after ignoring the value of site G4, the concentration of OP in the sediment had a significant negative correlation with the carbon isotope value (p < 0.05) (Figure 6A), indicating that the OP in the sediment may have been degraded and caused carbon isotope fractionation. There was a significant positive correlation between the concentration of NPs and carbon isotopes (p < 0.05) (Figure 6B). One potential reason is the degradation of the precursor compounds of NPs. One of the most significant sources of NPs in the environment is the degradation of nonylphenol ethoxylates (NPEOs). In the degradation process of NPEOs, the lighter isotopes react first; therefore, the isotope ratio of generated NPs is relatively low at the beginning. As the reaction proceeds, the isotope ratio of NPs slowly increases, and NPs slowly accumulate, causing a positive correlation between the concentration of NPs and carbon isotopes. BPA has no significant correlation between the concentration and carbon isotopes in both water and sediments (Figure 6C). Xiong et al. found that no carbon isotopic fractionation was observed during the biodegradation of BPA. A microcosmic study [24] indicated that it is difficult to use carbon isotopes to determine whether BPA is reactive.
CSIA has become a widely used method to identify the source and degradation pathway of organic compounds [17,18,20,21,31]. However, due to the lower sensitivity of GC-C-IRMS, the application of CSIA mainly focuses on some traditional contaminated organic compounds, such as halogenated compounds, nitro compounds, and BTEX [10,21,32]. The environmental concentration of these substances can reach mg/L and can be extracted and separated from environmental media through simple procedures, such as solid-phase microextraction. These methods may not necessarily be applicable to the CSIA of polar organic micropollutants, such as pesticides, drugs, and personal care products. It is necessary to process large volumes of samples through SPE to obtain the quality of analytes required for isotope ratio mass spectrometry. The inherent low selectivity of SPE programs may lead to the co enrichment of unknown organic compounds, thereby affecting accurate isotope ratio measurements. Therefore, the external purification process is indispensable. Due to the lack of a CSIA method that complies with EDCs, this study drew on the CSIA analysis process of PBDE [28], fully considering the physical and chemical properties of OP, NPs, and BPA, and developed a separation method mainly based on silica gel chromatography. After exploration, a more suitable chromatographic material and eluting solvent were selected. Compared to the analysis method of PBDE, this study optimized the chromatographic materials, elution solvents, and elution volumes. This is the first reported compound-specific isotope value of OP, NPs, and BPA in river environments. Our research is of great significance in studying the sources and transformations of OP, NPs, and BPA in river environments, which contributes to the management and sustainable utilization of river water resources.

4. Conclusions

A sample purification method was developed to measure the carbon isotopes of three phenolic EDCs (i.e., NPs, OP, and BPA) in sediment and water samples. The silica gel column was used to separate compounds with multiple organic solvents on the basis of their different penetrating velocity due to the polarity created when they were eluted with organic solvents. After treatment, the purity of the sample meets the requirements for isotopic determination. Finally, the method was successfully used to analyze the isotope composition of BPA, OP, and NPs in the river water and sediments samples in the Guangzhou River, Pearl River Delta, South China. Sewage discharge significantly affected the carbon isotope values of BPA, OP, and NPs in the Guangzhou rivers, suggesting that sewage discharge is the main source of EDCs in Guangzhou rivers. There is a significant correlation between the isotopic values and concentrations of OP and NP in sediments, indicating that there may be a transformation process. This is the first reported compound-specific isotope value of OP, NPs, and BPA in river environments. Our research is of great significance in studying the sources and transformations of OP, NPs, and BPA in river environments, which contributes to the management and sustainable utilization of river water resources.

Supplementary Materials

The following supporting information can be downloaded at: https://www.mdpi.com/article/10.3390/su15118583/s1, Figure S1. Full scan GC/MS chromatograms of samples after each clean-up step: (a) step 2; (b) step 3 eluent A; (c) step 3 eluent B; Figure S2. Mass spectrogram of BPA (a), NPs (c), and OP (e) versus standards (b,d,f).

Author Contributions

Conceptualization, Z.P.; Methodology, Y.C.; Investigation, R.W. and J.W. All authors have read and agreed to the published version of the manuscript.

Funding

This study was supported by the National Key Research and Development Program of China (No. 2019YFC1805300).

Institutional Review Board Statement

Not applicable.

Informed Consent Statement

Not applicable.

Data Availability Statement

Data available on request. The data presented in this study are available on request from the corresponding author.

Conflicts of Interest

The authors declare no conflict of interest.

References

  1. Won, E.J.; Yun, H.Y.; Lee, D.H.; Shin, K.H. Application of Compound-Specific Isotope Analysis in Environmental Forensic and Strategic Management Avenue for Pesticide Residues. Molecules 2021, 26, 4412. [Google Scholar] [CrossRef]
  2. Petrie, B.; Lopardo, L.; Proctor, K.; Youdan, J.; Barden, R.; Kasprzyk-Hordern, B. Assessment of bisphenol-A in the urban water cycle. Sci. Total Environ. 2019, 650, 900–907. [Google Scholar] [CrossRef] [PubMed]
  3. Giger, W.; Brunner, P.H.; Schaffner, C. 4-Nonylphenol in sewage sludge: Accumulation of toxic metabolites from nonionic surfactants. Science 1984, 225, 623–625. [Google Scholar] [CrossRef]
  4. Pignotti, E.; Dinelli, E. Distribution and partition of endocrine disrupting compounds in water and sediment: Case study of the Romagna area (North Italy). J. Geochem. Explor. 2018, 195, 66–77. [Google Scholar] [CrossRef]
  5. Nie, M.; Yan, C.; Dong, W.; Liu, M.; Zhou, J.; Yang, Y. Occurrence, distribution and risk assessment of estrogens in surface water, suspended particulate matter, and sediments of the Yangtze Estuary. Chemosphere 2015, 127, 109–116. [Google Scholar] [CrossRef] [PubMed]
  6. Luo, Z.; Tu, Y.; Li, H.; Qiu, B.; Liu, Y.; Yang, Z. Endocrine-disrupting compounds in the Xiangjiang River of China: Spatio-temporal distribution, source apportionment, and risk assessment. Ecotoxicol. Environ. Saf. 2019, 167, 476–484. [Google Scholar] [CrossRef] [PubMed]
  7. Chen, R.; Yin, P.; Zhao, L.; Yu, Q.; Hong, A.; Duan, S. Spatial-temporal distribution and potential ecological risk assessment of nonylphenol and octylphenol in riverine outlets of Pearl River Delta, China. J. Environ. Sci. 2014, 26, 2340–2347. [Google Scholar] [CrossRef]
  8. Pintado-Herrera, M.G.; Wang, C.; Lu, J.; Chang, Y.P.; Chen, W.; Li, X.; Lara-Martin, P.A. Distribution, mass inventories, and ecological risk assessment of legacy and emerging contaminants in sediments from the Pearl River Estuary in China. J. Hazard. Mater. 2017, 323, 128–138. [Google Scholar] [CrossRef]
  9. Saha, S.; Narayanan, N.; Singh, N.; Gupta, S. Occurrence of endocrine disrupting chemicals (EDCs) in river water, ground water and agricultural soils of India. Int. J. Environ. Sci. Technol. 2022, 19, 11459–11474. [Google Scholar] [CrossRef]
  10. Hofstetter, T.B.; Bolotin, J.; Skarpeli-Liati, M.; Wijker, R.; Kurt, Z.; Nishino, S.F.; Spain, J.C. Tracking transformation processes of organic micropollutants in aquatic environments using multi-element isotope fractionation analysis. Appl. Geochem. 2011, 26, S334–S336. [Google Scholar] [CrossRef]
  11. Liu, X.; Li, W.; Kummel, S.; Merbach, I.; Sood, U.; Gupta, V.; Lal, R.; Richnow, H.H. Soil from a Hexachlorocyclohexane Contaminated Field Site Inoculates Wheat in a Pot Experiment to Facilitate the Microbial Transformation of beta-Hexachlorocyclohexane Examined by Compound-Specific Isotope Analysis. Environ. Sci. Technol. 2021, 55, 13812–13821. [Google Scholar] [CrossRef] [PubMed]
  12. Wu, L.; Suchana, S.; Flick, R.; Kummel, S.; Richnow, H.; Passeport, E. Carbon, hydrogen and nitrogen stable isotope fractionation allow characterizing the reaction mechanisms of 1H-benzotriazole aqueous phototransformation. Water Res. 2021, 203, 117519. [Google Scholar] [CrossRef] [PubMed]
  13. Lian, S.; Wu, L.; Nikolausz, M.; Lechtenfeld, O.J.; Richnow, H.H. 2H and 13C isotope fractionation analysis of organophosphorus compounds for characterizing transformation reactions in biogas slurry: Potential for anaerobic treatment of contaminated biomass. Water Res. 2019, 163, 114882. [Google Scholar] [CrossRef] [PubMed]
  14. Isaji, Y.; Ogawa, N.O.; Takano, Y.; Ohkouchi, N. Quantification and Carbon and Nitrogen Isotopic Measurements of Heme B in Environmental Samples. Anal. Chem. 2020, 92, 11213–11222. [Google Scholar] [CrossRef] [PubMed]
  15. Huang, C.; Zeng, Y.; Luo, X.; Ren, Z.; Lu, Q.; Tian, Y.; Gao, S.; Wang, S.; Harrad, S.; Mai, B. Tracing the sources and microbial degradation of PCBs in field sediments by a multiple-line-of-evidence approach including compound-specific stable isotope analysis. Water Res. 2020, 182, 115977. [Google Scholar] [CrossRef]
  16. Hofstetter, T.B.; Schwarzenbach, R.P.; Bernasconi, S.M. Assessing transformation processes of organic compounds using stable isotope fractionation. Environ. Sci. Technol. 2008, 42, 7737–7743. [Google Scholar] [CrossRef]
  17. Bashir, S.; Hitzfeld, K.L.; Gehre, M.; Richnow, H.H.; Fischer, A. Evaluating degradation of hexachlorcyclohexane (HCH) isomers within a contaminated aquifer using compound-specific stable carbon isotope analysis (CSIA). Water Res. 2015, 71, 187–196. [Google Scholar] [CrossRef]
  18. Alvarez-Zaldivar, P.; Payraudeau, S.; Meite, F.; Masbou, J.; Imfeld, G. Pesticide degradation and export losses at the catchment scale: Insights from compound-specific isotope analysis (CSIA). Water Res. 2018, 139, 198–207. [Google Scholar] [CrossRef]
  19. Droz, B.; Drouin, G.; Maurer, L.; Villette, C.; Payraudeau, S.; Imfeld, G. Phase Transfer and Biodegradation of Pesticides in Water-Sediment Systems Explored by Compound-Specific Isotope Analysis and Conceptual Modeling. Environ. Sci. Technol. 2021, 55, 4720–4728. [Google Scholar] [CrossRef]
  20. Broholm, M.M.; Hunkeler, D.; Tuxen, N.; Jeannottat, S.; Scheutz, C. Stable carbon isotope analysis to distinguish biotic and abiotic degradation of 1,1,1-trichloroethane in groundwater sediments. Chemosphere 2014, 108, 265–273. [Google Scholar] [CrossRef]
  21. Hellal, J.; Joulian, C.; Urien, C.; Ferreira, S.; Denonfoux, J.; Hermon, L.; Vuilleumier, S.; Imfeld, G. Chlorinated ethene biodegradation and associated bacterial taxa in multi-polluted groundwater: Insights from biomolecular markers and stable isotope analysis. Sci. Total Environ. 2021, 763, 142950. [Google Scholar] [CrossRef]
  22. Ren, Z.; Zeng, Y.; Luo, X.; Huang, C.; Tian, Y.; Gao, S.; Mai, B. Observable carbon isotope fractionation in the photodegradation of polybrominated diphenyl ethers by simulated sunlight. Chemosphere 2021, 266, 128950. [Google Scholar] [CrossRef] [PubMed]
  23. Wang, G.; Jiang, N.; Liu, Y.; Wang, X.; Liu, Y.; Jiao, D.; Wang, H. Competitive microbial degradation among PBDE congeners in anaerobic wetland sediments: Implication by multiple-line evidences including compound-specific stable isotope analysis. J. Hazard. Mater. 2021, 412, 125233. [Google Scholar] [CrossRef] [PubMed]
  24. Xiong, J.; Li, G.; An, T. Development of methodology for the determination of carbon isotope ratios using gas chromatography/combustion/isotope ratio mass spectrometry and applications in the biodegradation of phenolic brominated flame retardants and their degradation products. Rapid Commun. Mass Spectrom. 2015, 29, 54–60. [Google Scholar] [CrossRef]
  25. Elsner, M.; Imfeld, G. Compound-specific isotope analysis (CSIA) of micropollutants in the environment—Current developments and future challenges. Curr. Opin. Biotechnol. 2016, 41, 60–72. [Google Scholar] [CrossRef]
  26. Gong, J.; Duan, D.; Yang, Y.; Ran, Y.; Chen, D. Seasonal variation and partitioning of endocrine disrupting chemicals in waters and sediments of the Pearl River system, South China. Environ. Pollut. 2016, 219, 735–741. [Google Scholar] [CrossRef]
  27. Irei, S.; Rudolph, J.; Huang, L. Compound-specific stable carbon isotope ratios of phenols and nitrophenols derivatized with N,O-bis(trimethylsilyl)trifluoroacetamide. Anal. Chim. Acta 2013, 786, 95–102. [Google Scholar] [CrossRef]
  28. Zeng, Y.H.; Luo, X.J.; Chen, H.S.; Chen, S.J.; Wu, J.P.; Mai, B.X. Method for the purification of polybrominated diphenyl ethers in sediment for compound-specific isotope analysis. Talanta 2013, 111, 93–97. [Google Scholar] [CrossRef] [PubMed]
  29. Gong, J.; Ran, Y.; Chen, D.; Yang, Y.; Ma, X. Occurrence and environmental risk of endocrine-disrupting chemicals in surface waters of the Pearl River, South China. Environ. Monit. Assess. 2009, 156, 199–210. [Google Scholar] [CrossRef] [PubMed]
  30. Kim, M.; Kennicutt, M.C., 2nd; Qian, Y. Source characterization using compound composition and stable carbon isotope ratio of PAHs in sediments from lakes, harbor, and shipping waterway. Sci. Total Environ. 2008, 389, 367–377. [Google Scholar] [CrossRef]
  31. Gafni, A.; Siebner, H.; Bernstein, A. Potential for co-metabolic oxidation of TCE and evidence for its occurrence in a large-scale aquifer survey. Water Res. 2020, 171, 115431. [Google Scholar] [CrossRef] [PubMed]
  32. Imfeld, G.; Kopinke, F.D.; Fischer, A.; Richnow, H.H. Carbon and hydrogen isotope fractionation of benzene and toluene during hydrophobic sorption in multistep batch experiments. Chemosphere 2014, 107, 454–461. [Google Scholar] [CrossRef] [PubMed]
Figure 1. Process and principle of CSIA.
Sustainability 15 08583 g001
Figure 2. Procedure for CSIA of OP, NPs, and BPA in sediment.
Sustainability 15 08583 g002
Figure 3. Map of the study region and sample sites.
Sustainability 15 08583 g003
Figure 4. The penetrating volume of OP, NPs, and BPA in Step 3.
Sustainability 15 08583 g004
Figure 5. Concentrations and δ13C values of NPs, OP, and BPA in Guangzhou River.
Sustainability 15 08583 g005
Figure 6. Plots of concentrations and δ13C values of OP (A), NPs (B), and BPA (C) in Guangzhou River.
Sustainability 15 08583 g006
Table 1. The δ13C values of EDCs and BSTFA and their derivatives versus δ13C values calculated via Equation (2).
Compoundsδ13C (‰)
Underivatized aDerivatized bCalculated c∆δ13C d
OP (n = 5)−27.43 ± 0.07−26.80 ± 0.30−27.15 ± 0.360.28
NPs (n = 5)−29.94 ± 0.08−29.04 ± 0.42−29.82 ± 0.510.12
BPA (n = 5)−30.53 ± 0.27−28.91 ± 0.47−30.41 ± 0.650.12
BSTFA (n = 5)−25.16 ± 0.27///
a Values determined by EA/IRMS. b Values determined by GC/C/IRMS. c Values calculated by Equation (2). d Calculated δ13C values minus underivatized δ13C values.
Table 2. Recoveries and δ13C values before and after the purification procedures.
δ13C (‰)
CompoundsRecoveries (%)BeforeAfter∆δ13C (‰)
OP (n = 3)89.01 ± 1.46−27.43 ± 0.07−27.39 ± 0.190.04
NP (n = 3)84.55 ± 1.05−29.94 ± 0.08−29.93 ± 0.160.01
BPA (n = 3)84.60 ± 1.83−30.53 ± 0.27−30.52 ± 0.200.01
Disclaimer/Publisher’s Note: The statements, opinions and data contained in all publications are solely those of the individual author(s) and contributor(s) and not of MDPI and/or the editor(s). MDPI and/or the editor(s) disclaim responsibility for any injury to people or property resulting from any ideas, methods, instructions or products referred to in the content.

