Article

Spatial–Temporal Patterns and Coupling Characteristics of Rural Elderly Care Institutions in China: Sustainable Human Settlements Perspective

1
School of Management, Shanghai University of Engineering Science, Shanghai 201620, China
2
College of Humanities, Donghua University, Shanghai 200051, China
3
School of Geographic Sciences, Nantong University, Nantong 226019, China
*
Author to whom correspondence should be addressed.
Sustainability 2023, 15(4), 3286; https://doi.org/10.3390/su15043286
Submission received: 23 December 2022 / Revised: 6 February 2023 / Accepted: 9 February 2023 / Published: 10 February 2023

Abstract

:
With rapid urbanization, more and more rural young adults are moving into towns and cities on a large scale, while the elderly are largely left behind in rural areas. The number of elderly people living alone, disabled and handicapped in rural areas is increasing, adding to the already weak rural elderly problem and increasing the pressure on the governance of rural elderly risks. The sustainable development of elderly care institutions is an important element in tackling the rural elderly problem and a key aspect of managing the rural elderly problem. The article uses data on rural aged-care institutions in 276 Chinese cities from 2010–2016 to construct comprehensive evaluation indicators for the development of rural aged-care institutions, and uses a combination of hierarchical analysis, composite score method, Theil index and coupling coordination model to reveal the spatial and temporal patterns and coupling characteristics of the development of rural aged-care institutions. The study concludes that: (1) From the time series change, the comprehensive score of rural elderly institutions shows a “fluctuating” change process, and there are significant differences in the development of each secondary indicator. (2) In terms of spatial and temporal patterns, the overall scores of rural elderly institutions, hard environment scores, soft environment scores and service recipients scores show a clear “gradient” in the east, middle and west. (3) In terms of regional differences, the Theil index for rural elderly care institutions is from high to low: Hard environment > service recipients > soft environment > overall score. From the decomposed Theil index, the intra-group differences of rural aged-care institutions are much larger than the inter-group differences, and the intra-group differences of the Theil index of the four major regions generally show a narrowing trend, with the intra-group differences of the eastern region being higher than those of the western region, those of the western region being higher than those of the central region, and those of the central region being higher than those of the northeastern region. (4) In terms of coupling coordination, the coupling degrees of the four major regions all exceed the low-level coupling stage index and are in the antagonistic stage or the grinding stage, and the coupling degrees of the four major regions are, in descending order, central region > eastern region > northeastern region > western region. The coupling coordination degree of the four major regions from high to low is: Eastern region > central region > northeastern region > western region. Based on the empirical analysis, the article proposes a model path for the sustainable development of rural elderly institutions in three aspects: Coordinated development, coupled development and sustainable development, in view of the unbalanced regional development of rural elderly institutions and the low degree of coupling and coordination between the soft and hard environments.

1. Introduction

The early arrival of the era of negative population growth in China means that the combination of fewer children and an aging population constitutes China’s biggest demographic fundamentals. The rapid decline in the birth rate, combined with aging, has led to an aging demographic structure in society as a whole. The 17 January 2023 saw the release of the latest population figures from the National Bureau of Statistics, showing that in 2022 China had 9.56 million births and 10.41 million deaths, with a population decline of 850,000 and a natural growth rate of −0.60 per thousand. This is the first time since 1962 that the country’s population has experienced negative growth, well before the end of the 14th Five-Year Plan or around 2028, as previously expected by relevant research institutions. The seventh national census shows that the population of China aged 60 and above was 264,018,766, accounting for 18.70 per cent, of which 19,063,528, or 13.50 per cent, were aged 65 and above. Compared to the sixth national census in 2010, the proportion of people aged 60 and above rose by 5.44 percentage points, and the proportion of people aged 65 and above rose by 4.63 percentage points [1], meaning that China is moving from mild to moderate aging. Along with the aging population comes the issue of health care for the elderly [2], whose demand for elderly care services is much higher than that of other age groups due to a significant increase in illness rates as a result of physiological decline, where the poor quality of China’s elderly care services is a reality, and the elderly are still full of worries when it comes to enjoying elderly care services, which in turn inhibits consumption of elderly care services [3]. Relatively speaking, the rural elderly problem is the biggest challenge in coping with the aging process [4]. With rapid urbanization, more and more young adults from rural areas are moving into towns and cities on a large scale, increasingly bringing their minor children with them, while the elderly are largely left behind in the countryside. The number of elderly people living alone, disabled and handicapped in rural areas is increasing, adding to the already weak rural elderly problem and increasing the pressure of rural elderly risk management. Compared to urban areas, rural elderly people live in scattered locations, lack both public resources and manpower for elderly care services, and generally have poorer health care conditions. Therefore, addressing the issue of rural old age is a top priority in the national strategy to actively address aging.
From the current status of research, existing studies are divided into four categories: In the first category, research has been conducted on the accessibility aspects of community care facilities [5,6,7,8,9,10,11,12,13,14,15]. The second category analyzes the spatial layout and spatial–temporal characteristics of elderly care institutions [16,17,18,19,20]. The third category is to investigate and analyze elderly institutions, and to develop an evaluation of the service quality of elderly institutions based on the subjective perspective of the elderly [21,22,23,24,25]. In the fourth category, countermeasures are proposed to the dilemmas faced by the development of aged-care institutions, especially the evaluation of the transformation and development of public-run aged-care institutions [26,27,28,29,30,31]. The first category of research has quantitatively analyzed the spatial accessibility of community aged-care facilities, providing a basis for the rural elderly to access aged-care institutions, but the shortcoming lies in the lack of a holistic and systematic view of the community habitat, taking the complete community as the object of analysis and only analyzing aged-care institutions. The second category of studies reveals the spatial distribution of elderly institutions in terms of spatial and temporal characteristics, and provides countermeasure suggestions for the spatial layout and optimization of elderly institutions, but almost all the literature focuses on the evaluation of urban elderly institutions, and lacks spatial and temporal analysis of rural elderly institutions. The third category of studies mainly obtains first-hand information through survey data, that is, actual interviews, reflecting the characteristics of elderly people’s demand for elderly care services in several community-based elderly care institutions, but due to the energy constraints of research teams, large-scale spatial analyses at the national level are still lacking, making it more difficult to reveal the needs of elderly people of different classes and incomes for elderly care services. The fourth category of research addresses the pains faced by the transformation and development of public aged-care institutions and proposes ways to reform them in order to improve their operational efficiency, enhance service quality and better meet the actual needs of the elderly. This type of research is one of the most important concerns of policy makers, however, due to the complexity of aged-care institution reform, countermeasure analysis often faces more practical challenges when applied to actual operation.
In summary, our study analyzes the current situation of rural retirement in China, reveals the current problems and then proposes governance responses from a sustainable development perspective. Specifically, the paper is divided into five parts. The first part is an introduction. It mainly analyzes the current characteristics and background of the development of elderly care institutions. The second part is a theoretical analysis. The reform and development of aged-care institutions are analyzed in terms of theories of habitat, the hard and soft environment of habitat and sustainability. The third part is data and methodology. Our analytical tools are introduced, including hierarchical analysis, the composite score method, the Theil index and the coupled coordination model, and the evaluation index system and weights for the study are identified and the data sources are explained. The fourth part is the results and analysis. The time series analysis of rural elderly institutions in China, the spatial pattern of the comprehensive score, the analysis of regional differences of rural elderly institutions and the analysis of coupling coordination degree of rural elderly institutions are analyzed, respectively, to comprehensively reveal the spatial and temporal patterns and coupling characteristics of the development of rural elderly institutions in China, and provide an empirical basis for the solution of the problem of sustainable rural elderly institutions’ development. The fifth part is the discussion and conclusion. The sixth part is the countermeasures and suggestions. This part proposes a path model for the sustainable development of rural elderly institutions and suggests countermeasures to optimize and improve the development of rural elderly institutions in three aspects: Coordinated development, coupled development and sustainable development.

2. Theoretical Analysis

The article will provide a theoretical analysis of rural institutions for the elderly from the perspectives of human settlement theory, human hard and soft settlement theory and sustainable development theory.

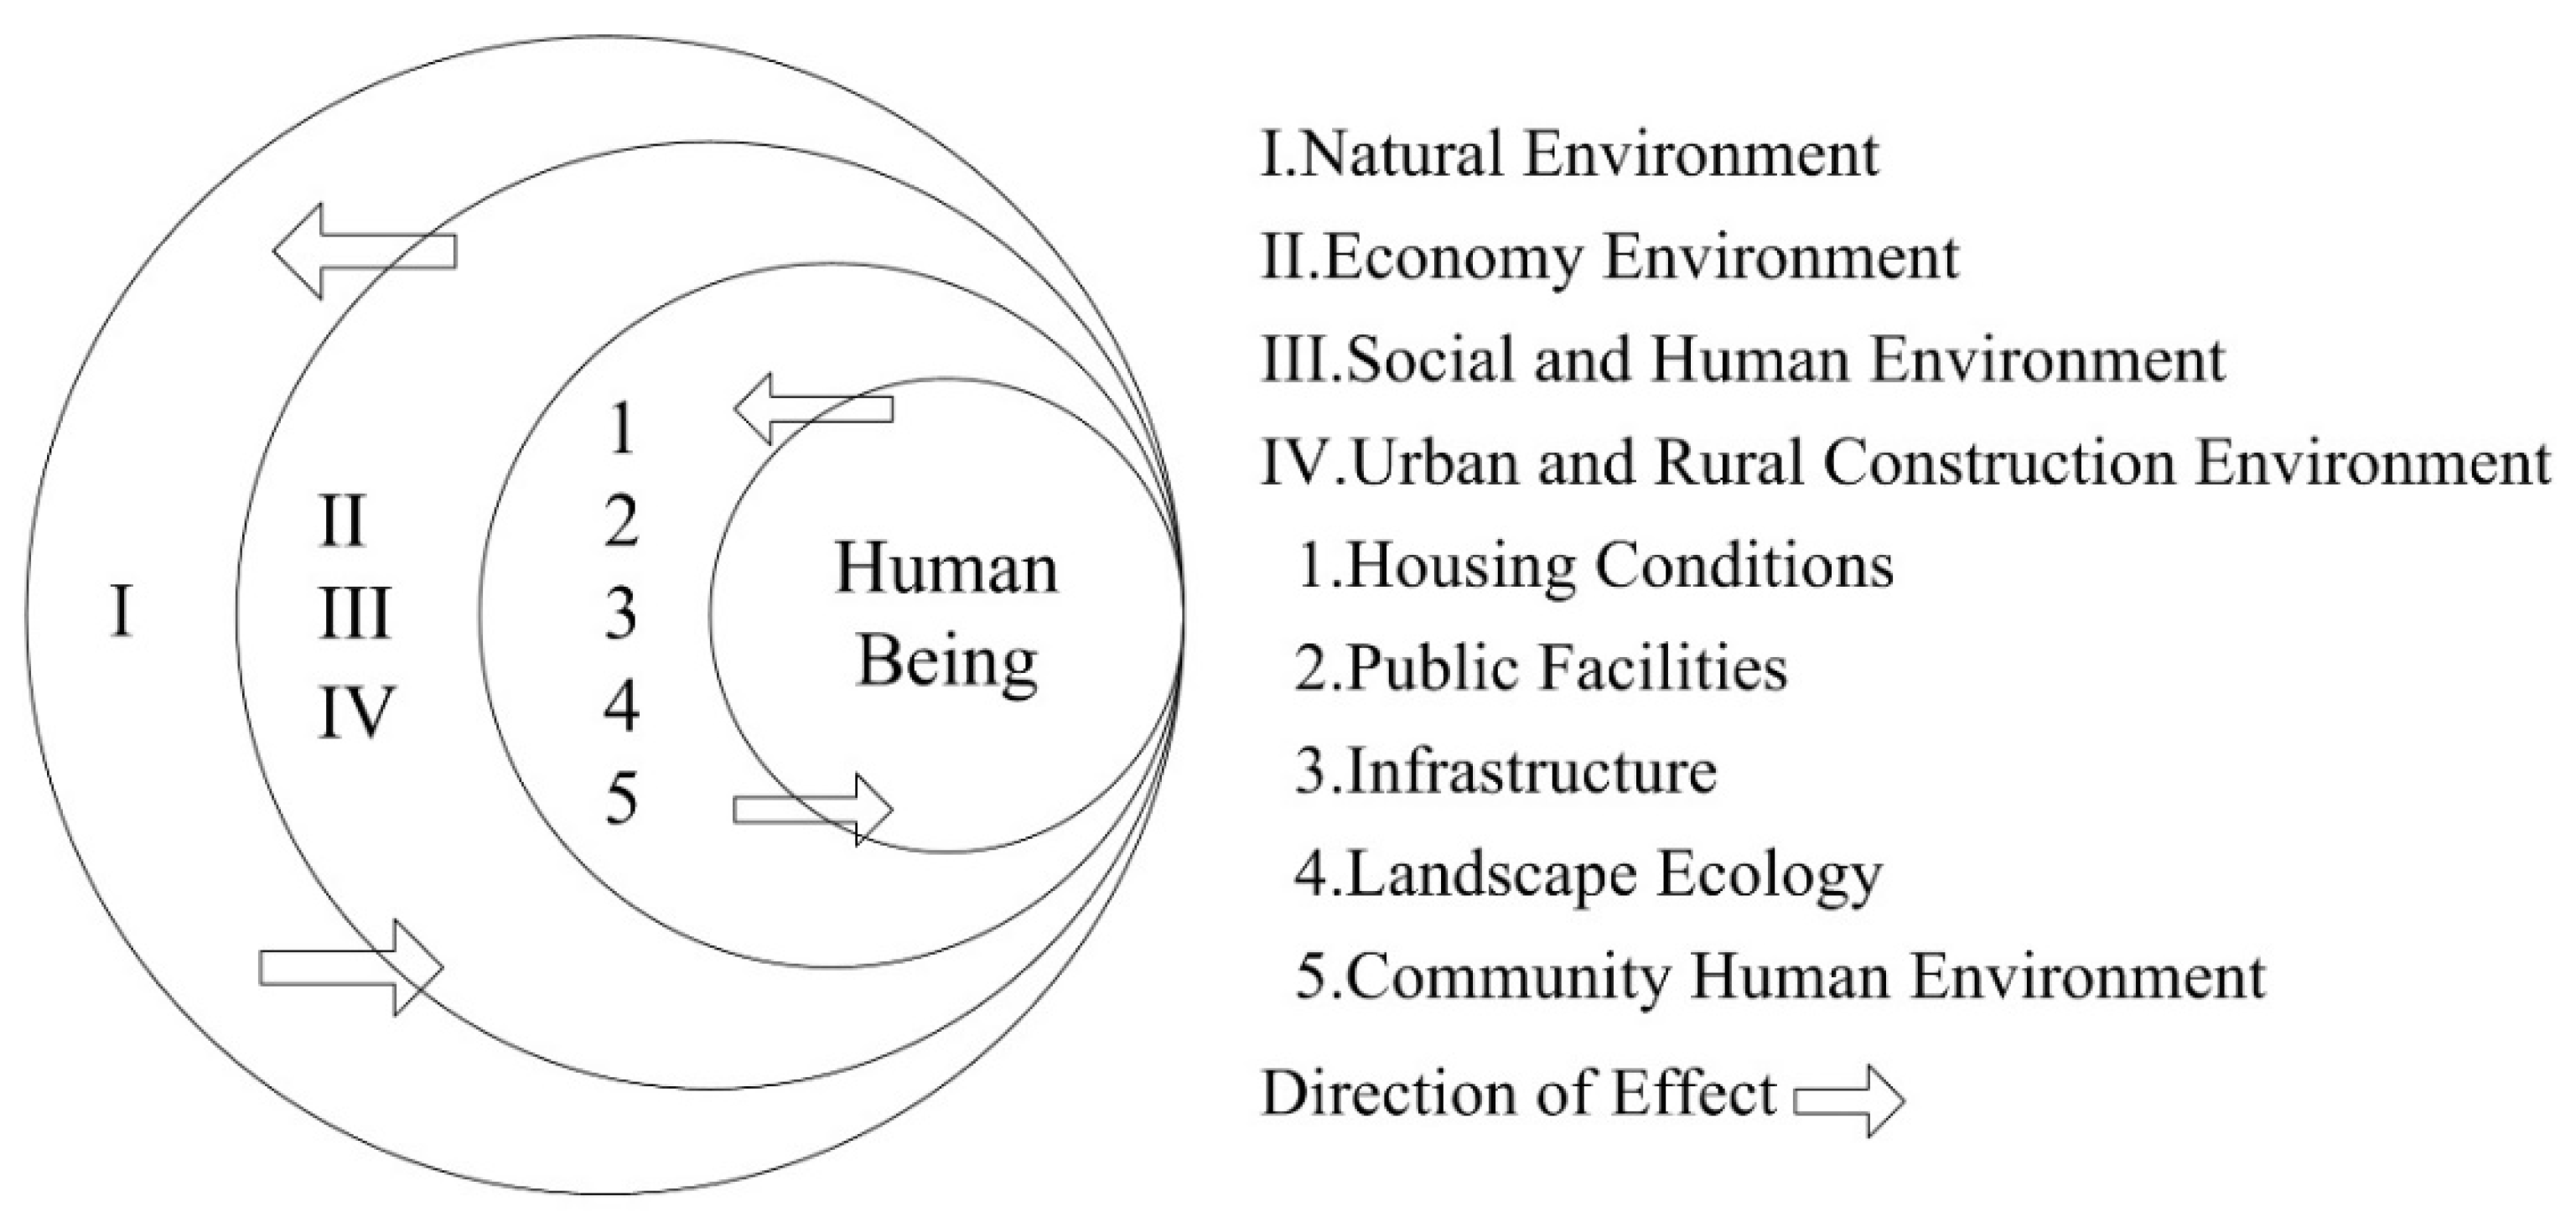
2.1. Theory of Human Settlement

Since its creation by the Greek architect C.A. Doxiadis in the 1950s, the science of human settlement has continued to attract the attention of scholars around the world. Human settlement consists of two parts: The content, that is, the individual human being and the society made up of human beings, and the container, that is, the physical settlement and its surroundings made up of natural or artificial elements. Human settlements are classified into 15 classes, ranging from the individual to the universal city [32,33,34,35].
In 1975, after the death of Doxiadis, the Athens Centre for the Study of Human Settlement gradually declined, but the fire has been passed on. Doxiadis advocated the study of human settlement and, in addition to Greece, Japan, India and China have continued activities. Chinese scholars led by Professor Wu Liangyong formed a unique Chinese school of the scientific study of the human habitat environment, the development of national policy and regional habitat optimization, having a profound impact. Wu Liangyong divided the habitat environment into five systems, namely, natural systems, human systems, social systems, housing systems and support systems. The scale of the habitat environment is split into global, regional, urban, community and architectural. The establishment of the habitat environment is also split into different levels, such as ecological, economic, technological, social and cultural views of the five principles, and China’s national conditions are deeply integrated, reflecting the needs of the times [36,37,38,39].
As an architectural system for the human environment, the sustainable development of rural institutions for the elderly requires a holistic and sustainable view, a human-centered perspective, a perspective that seeks the well-being of rural residents and the provision of quality services for the elderly in rural areas. The sustainable development of rural institutions is not just about the construction of physical space, but also about the synergy of social systems, support network systems and institutional environments to maximize the welfare of residents. The ecological, economic, technological, social and cultural perspectives of habitat are the guiding principles for building sustainable rural institutions for the elderly, which can be closely integrated with China’s national conditions and provide a certain model for the reform and development of institutions for the elderly worldwide.

2.2. Theory of Hard and Soft Human Settlement

The scientific connotation of the hard and soft human settlement environment was proposed by Chinese urban geographer Professor Ning Yumin, who pointed out that the hard habitat environment refers to the sum of all kinds of material facilities that serve and are used by urban residents and are carried by their behavioral activities; the soft habitat environment, the social environment of habitat, refers to the sum of all non-material things formed by residents in the use and function of the hard environment system. The hard environment is the carrier of the soft environment, and the livability of the soft environment is the value orientation of the hard environment. The optimization process of the urban habitat is in fact the coupling process of the hard and soft environment. With the rapid development of economy and society, many problems emerge in small towns in the process of rapid urbanization, which need to be solved urgently [40]. The outer ring of the system is the natural ecological environment, the middle ring is the economic environment, social and humanistic environment and urban and rural construction environment and the inner ring is the urban and rural construction environment subsystem, involving living conditions, public facilities, infrastructure, landscape ecological environment and community humanistic environment, with people as the core (Figure 1) [41]. People and the urban and rural built environment promote each other and are interactively coupled. The urban and rural construction environment is interactively coupled with the social and humanistic environment and the economic environment. The natural environment is interactively coupled with the internal subsystems, and is the base for sustaining human existence, reflecting the cosmic view of the unity of heaven and humans, and the natural view of harmony between humans and Earth.

2.3. Theory of Sustainability

The concept of sustainable development was formally introduced by the World Commission on Environment and Development in 1987 in the report “Our Common Future”. It refers to development that meets the needs of the present without jeopardizing the ability of future generations to meet their needs, and equity, sustainability and commonality are the three basic principles of sustainable development. The concept of sustainable development, with its integrated thinking on population, resources, environment and economic development, has played a seminal role in the formation and refinement of the theory of sustainable development. The Rio Declaration on Environment and Development, Agenda 21, the Millennium Ecosystem Assessment, the 2030 Agenda for Sustainable Development and other programmatic documents promote the practice of the concept of sustainable development. At the same time, ecological philosophical thinking elevates the theory of sustainable development to a philosophical level, using the worldview and methodology of ecological philosophy as a composite system [42]. The integration of sustainable thought, philosophy and practice advances the development of sustainable human settlements. As a typical habitat environment at the micro level, Chinese rural institutions for the elderly have undergone important changes in their development process. Due to historical factors, the marketization of China’s elderly care institutions started late and the marketization of elderly care was not high. In the early stages, China established a system of support for the five-guarantee households to provide food, clothing, housing and medical services for the “three have-nots”. With the aging of the population, China’s old-age care institutions have begun to transform from welfare institutions to market-based institutions, but the overall transformation has been slow [43], resulting in the service protection system of rural old-age care institutions lagging far behind the actual needs of the rural elderly. The reform of rural elderly institutions needs to balance equity and efficiency, supply and demand, economy and efficiency, and adhere to the people-centered concept to promote the sustainable development of rural elderly institutions.

3. Methods and Data

3.1. Methods

3.1.1. Analytic Hierarchy Process

In 1970, Saaty proposed the analytic hierarchy process (AHP), which is a systematic and hierarchical method of analysis that combines qualitative and quantitative aspects. The hierarchical analysis divides the evaluation objectives into an objective level (A), a criterion level (B) and a programmed level (C). The weight wi of each criterion on the objective is determined through a two-by-two comparison and is characterized by subjective weighting.
AHP usually uses the 1–9 scale method to judge the relative importance of each indicator in the system being evaluated, thus establishing a judgement matrix. Let the evaluation elements be X = x1, x2, …, xi, …, xn, where xij indicates the importance comparison result of xi relative to xj, using the 1–9 scale. Based on the meaning of xij taking the value scale, the Delphi method, that is, taking the average scoring of experts, is used to compare the elements of the evaluation element set X in a two-by-two manner, so as to obtain the judgment matrix P. The judgment matrix satisfies [44]:
P = Xn×n
The judgment matrix Xn×n includes xij = 1/xji. The eigenvector Mn×1 corresponding to the maximum eigenvalue max is measured using the equation PM = λmax, and the weights of each evaluation index are obtained using the normalized eigenvector M. The sum-product method was used to measure.
In order to judge the scientific validity of the weights obtained, the consistency indicator CI needs to be introduced to test the consistency of the judgement matrix.
C I = λ max n n 1
The larger the CI value of consistency, the greater the deviation of the judgment matrix from full consistency, the smaller the CI value, the better the consistency of the matrix and when the CI takes the value of 0, it indicates that the matrix has full consistency.
To test whether the judgement matrix has satisfactory consistency, the test coefficient CR needs to be defined.
C R = C I R I
If CR < 0.1, it means that the judgment matrix passes the consistency test, otherwise, the judgment matrix needs to be adjusted until it passes the consistency test, where random index (RI) is the random consistency index, and RI can be obtained by checking the table of average random consistency index. The table below shows the average random consistency index calculated from the 1–10th order matrix, and n indicates the number of evaluation indicators in the judgment matrix (Table 1).

3.1.2. Composite Score Method

To facilitate comparison of the characteristics and spatial and temporal differences in the development of rural elderly care institutions in China, this study measures the composite score of rural elderly care institution development. Due to the dimensional differences in the raw data, the data were dimensionless for each indicator [45,46,47,48,49], drawing on existing studies [50,51,52]. The formula for calculating the composite score is as follows:
{ d i j = x i j x i j min x i j max x i j min ( Positive   Indicator ) d i j = x i j max x i j x i j max x i j min ( Negative   Indicator )
Z = n = 1 h w i d i j = n = 1 m w i x i + n = 1 n w i y i + n = 1 l w i z i j
In the above equation, Z is the composite score, dij denotes the evaluation index of Chinese rural elderly institutions after dimensionless processing, xij denotes the original data of Chinese rural elderly institutions, xijmin and xijmax denote the minimum and maximum values of the original data, respectively. xi denotes the evaluation index of the hard environment of Chinese rural elderly institutions after dimensionless treatment, yi denotes the evaluation index of the soft environment of Chinese rural elderly institutions after dimensionless treatment and zi denotes the index of service recipients of Chinese rural elderly institutions after dimensionless treatment. wi is the weight measured by the hierarchical analysis method. h denotes the number of evaluation indicators of Chinese rural elderly institutions. m, n and l denote the number of hard environment evaluation indicators, the number of soft environment evaluation indicators and the number of service recipients’ evaluation indicators of rural elderly institutions in China, respectively.

3.1.3. Theil Index Measurement

The Theil index examines inequality and variability in terms of the concepts of information and entropy [53]; it decomposes overall variability into variability between parts and variability within parts, and has a wide range of applications for analyzing and decomposing variability. The composite entropy index examines variability between individuals in terms of the concepts of information and entropy, which is the expected value of the amount of information, that is, the expected amount of information. The closer the individuals are to each other, the smaller the composite entropy index will be [54].
G E = { i = 1 n p i [ ( y i / u ) c 1 ] , c 0 , 1 i = 1 n p i ( y i / u ) l g ( y i / u ) , c = 1 i = 1 n p i l g ( y i / u ) , c = 0
In the above equation, the parameter c is used to determine the sensitivity of the change in the exponent. In general, it determines the sensitivity of exponential change when c < 2. When c = 0,1, it is known as the Theil index.
The Theil index is widely used in empirical studies of overall spatial heterogeneity as well as spatial heterogeneity due to its property of dividing overall variation into within-group variation and between-group variation. Its calculation formula is
Theil = i = 1 n T i l n ( n T i ) = T W R + T B R
T W R = i = 1 n d b T i l n ( n d b T i T d b ) + i = 1 n d T i l n ( n d T i T d ) + i = 1 n z T i l n ( n z T i T z ) + i = 1 n x T i l n ( n x T i T x )
T B R = T d b l n ( T d b n n d b ) + T d l n ( T d n n d ) + T z l n ( T z n n z ) + T x l n ( T x n n x ) .
The Theil index can be further decomposed into intra-group differences and inter-group differences if the areas studied are divided into different groups according to a certain methodology.
In the above equation, Theil denotes the Theil index; n is the number of rural villages within the sample region; Twr is the variation within the four regional groups of northeast, east, central and west; Tbr is the variation between the four regional groups. ndb, nd, nz, nx are the number of rural villages within the northeast, east, central and west regions, respectively; Ti is the ratio of the measured indicators within the region to the national average; Tdb, Td, Tz and Tx are the ratio of measures to the national average for the northeast, east, central and west regions, respectively.
Our study includes a total of 276 rural areas in cities at the prefecture level and above. The northeast region includes rural areas in 33 cities in Liaoning, Jilin and Heilongjiang; the east region includes rural areas in 86 cities in Beijing, Tianjin, Hebei, Shanghai, Jiangsu, Zhejiang, Shandong, Fujian, Guangdong and Hainan. The central region includes rural areas in 77 cities in Shanxi, Henan, Anhui, Hubei, Hunan and Jiangxi; the west region includes rural areas in 80 cities in Inner Mongolia, Chongqing, Sichuan, Guangxi, Guizhou, Yunnan, Shaanxi, Gansu, Ningxia, Tibet, Qinghai and Xinjiang.

3.1.4. Coupling Coordination Model

Taking into account the actual situation of the subsystems of Chinese rural elderly institutions, the coupling coordination relationship between the systems of Chinese rural elderly institutions is measured by drawing on the coupling coordination degree model used in existing studies. The formula for measuring the coupling coordination degree is as follows.
C = { x i × y i × z i [ ( x i + y i + z i ) / 3 ] 3 } k
In the above equation, C is the coupling degree of the soft and hard environment systems of rural elderly care institutions in China, and the value range is [0, 1]. xi, yi and zi are the scores of hard environment, soft environment and service recipients of rural elderly care institutions, respectively. k is the adjustment coefficient, in practice, let k ≥ 2, and k is taken as 2 in this paper.
The coupling degree can describe the degree of interaction and mutual influence of the subsystems of rural elderly institutions, but it cannot reveal the level of coordinated development of the subsystems of rural elderly institutions. Therefore, the coupling coordination degree model needs to be further utilized to measure the degree of coordination between systems, with the following formula [55].
D = C × Z Z = α x i + β y j + γ z i
where D is the coupling coordination degree, C is the coupling degree and Z′ is the composite score value of rural elderly service institutions after re-assignment. α, β and γ are the coefficients to be determined. Considering the time characteristics of the study period, this study assigns the coefficients to be determined for the rural elderly service providers subsystem measured through the hierarchical analysis method.
The study classifies the coupling degree and coupling coordination of the subsystems of Chinese rural elderly institutions according to the given criteria of coupling degree and coupling coordination (Table 2).

3.2. Evaluation Indicators

We have divided the evaluation indicator system into a target tier (A), a criterion tier (B) and a program tier (C). The target layer (A) is the overall score of rural elderly institutions. The criterion layer (B), the secondary indicators, reveals the spatial and temporal characteristics of rural elderly institutions in terms of the hard environment of elderly institutions (B1), the soft environment of elderly institutions (B2) and the service recipients of elderly institutions (B3). Scenario layer (C) is the number of elderly institutions (C1), the floor area of elderly institutions (C2), the number of beds at the end of the year (C3), the number of employees at the end of the year (C4), the proportion of university education (C5), the proportion of employees under 35 years old (C6), the number of people in elderly institutions (C7), the proportion of self-financed persons (C8) and the proportion of semi-self-care individuals unable to take care of themselves (C9). Scheme layers C1–C3 are the subsystems of the hard environment B1 of elderly institutions, scheme layers C4–C6 are the subsystems of the soft environment B2 of elderly institutions and scheme layers C7–C9 are the subsystems of the service recipients B3 of elderly institutions.
Hard environment of aged-care institutions: The construction of the hard environment of rural aged-care institutions is revealed in terms of quantity and scale through three indicators: The number of aged-care institutions, the floor area of aged-care institutions and the number of beds in aged-care institutions at the end of the year.
Soft environment of aged-care institutions: The scale, education and age structure of professional nursing staff in rural aged-care institutions are revealed through the number of employees in aged-care institutions at the end of the year, that is, the number of nursing staff in aged-care institutions, as well as the proportion of nursing staff in aged-care institutions with higher education and the proportion of nursing staff aged 35 and below in aged-care institutions, reflecting the construction of the soft environment of rural aged-care institutions.
Service recipients of aged-care institutions: The number of people living in rural aged-care institutions, the proportion of self-funded persons living in rural aged-care institutions and the proportion of people living in rural aged-care institutions who are semi-self-care and unable to take care of themselves reveal the service recipients of rural aged-care institutions.

3.3. Data Sources

The data on the evaluation indicators of the development of urban and rural elderly institutions were all obtained from the China Civil Affairs Statistical Yearbook 2011–2017 compiled by the Ministry of Civil Affairs. In the process of data processing, there were missing data for the evaluation indicators of elderly care institutions in rural areas of some cities, so we mainly used the averaging method and trend extrapolation method to ensure the integrity and continuity of the data to the greatest extent.

3.4. Indicator Weights

Combined with the AHP method measurement process, the judgement matrix of the target level to the criterion level (primary indicators) is given [56]. Similarly, the secondary and tertiary indicators can also be derived from the judgment matrix. The weights of the hard environment (B1), soft environment (B2) and service recipients (B3) in the criterion layer (B) are 0.3347, 0.3333 and 0.3320, respectively, which are relatively similar, with the hard environment being slightly higher than the soft environment and the soft environment being slightly higher than the service recipients. The weights of the nine indicators in program level (C), including the number of elderly care institutions (C1), the floor area of elderly care institutions (C2), the number of beds at the end of the year (C3), the number of employees at the end of the year (C4), the proportion of university education (C5), the proportion of employees under 35 years old (C6), the number of people in elderly care institutions (C7), the proportion of self-financed persons (C8) and the proportion of people who are semi-self-care and unable to take care of themselves (C9), are in the range of 0.1079 ~ 0.1143. The results of the judgment matrix consistency test of the hierarchical analysis method showed that all the secondary and tertiary indicators involved in our study passed the judgment matrix consistency test (Table 3 and Table 4).

4. Analysis of the Results

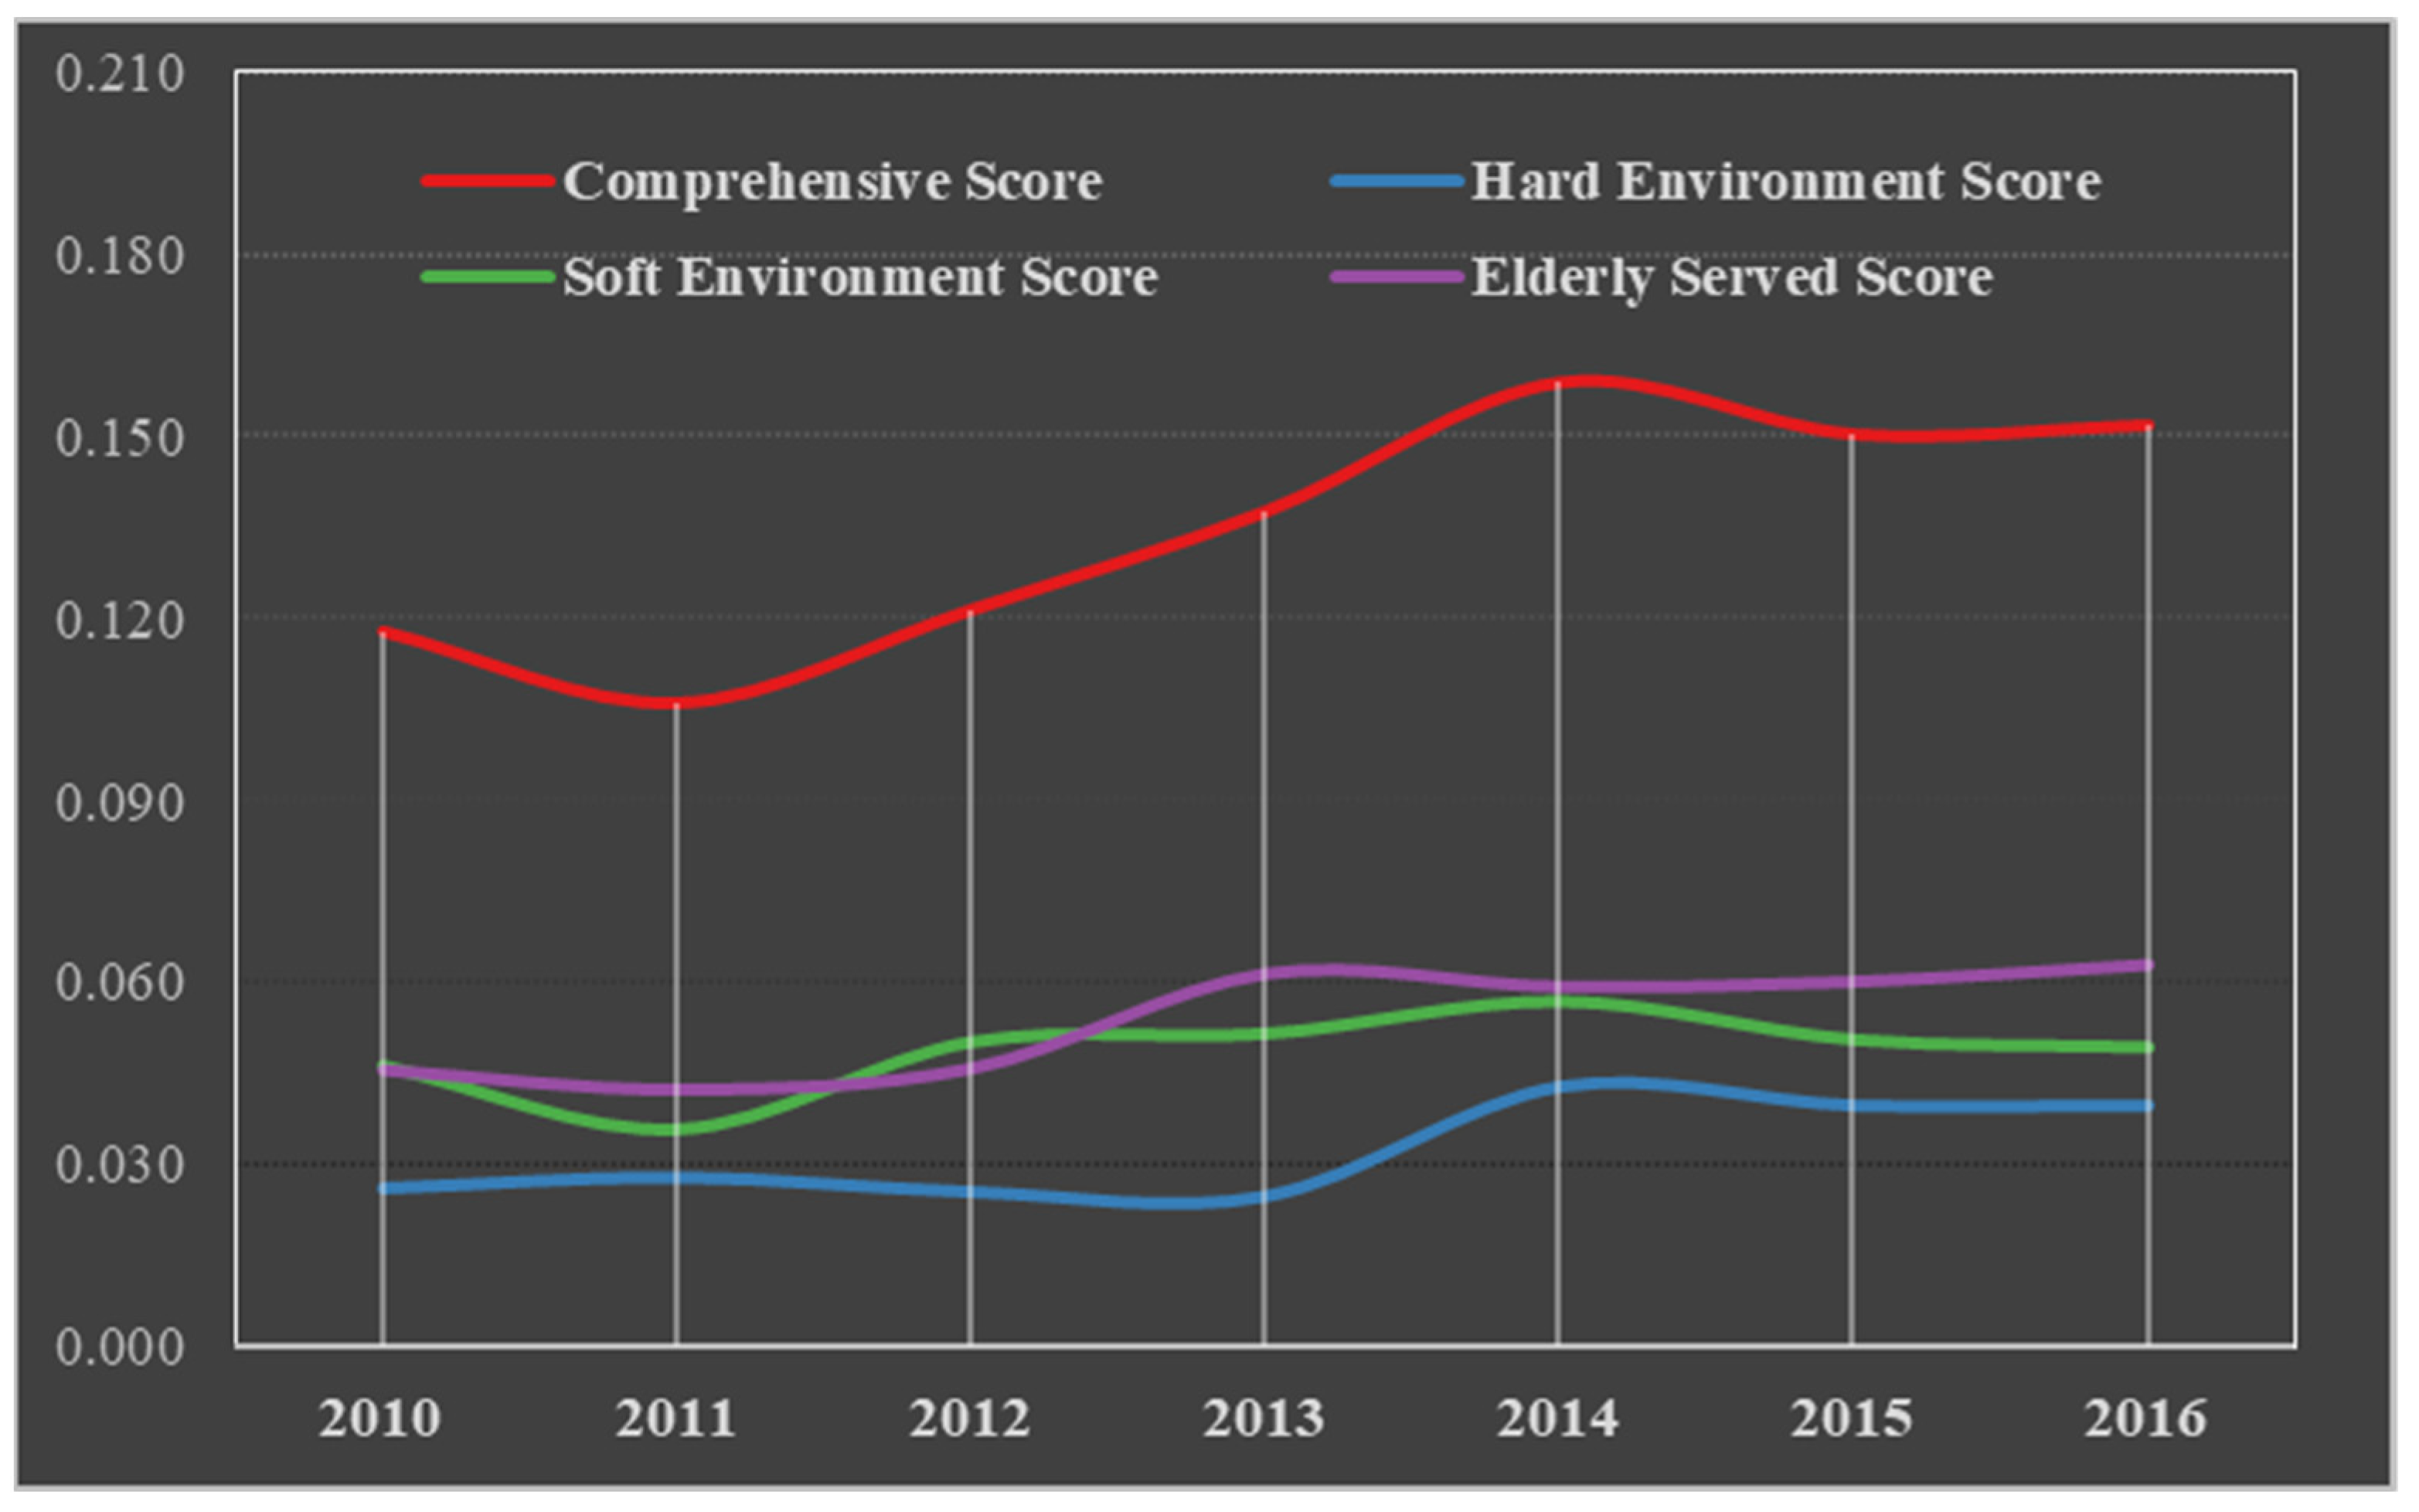
4.1. Time Series Variation Analysis of Rural Elderly Care Institutions in China

In terms of the mean indicators, the overall score for rural institutions shows a process of “fluctuation”, with significant differences in the development of the secondary indicators (Figure 2).
Firstly, the overall score of rural elderly care institutions shows a process of “fluctuation”. The average score of rural elderly institutions in China’s 276 prefecture-level cities and above declined from 0.188 in 2010 to 0.106 in 2011, then rose to 0.159 in 2014, then fell back to 0.150 in 2015 and finally rose to 0.152 in 2016. This is partly due to the large differences in the development of hard environment indicators across cities, as we will verify later in the regional differences analysis section. The mean hard environment indicator score fluctuated from 0.026 in 2010 to 0.040 in 2016, an increase of 1.53 times, the most significant increase of the three secondary indicators. Thirdly, the slower progress in the mean soft environment indicator score for rural elderly institutions is somewhat related to the narrowing of the differences in the development of soft environment indicators across municipalities, as well as the expansion or contraction of the total data for some of the soft environment tertiary indicators. The average soft environment indicator score fluctuated from 0.046 in 2010 to 0.049 in 2016, an increase of only 1.07 times. Fourthly, the mean volume indicator score for rural aged-care institutions is in the middle of the increase in the three secondary indicators. The fluctuating increase in the mean volume score for the service recipient indicator from 0.046 in 2010 to 0.063 in 2016, an increase of 1.38 times, is again somewhat associated with the expansion or contraction of the total data for some of the tertiary indicators for service recipients.

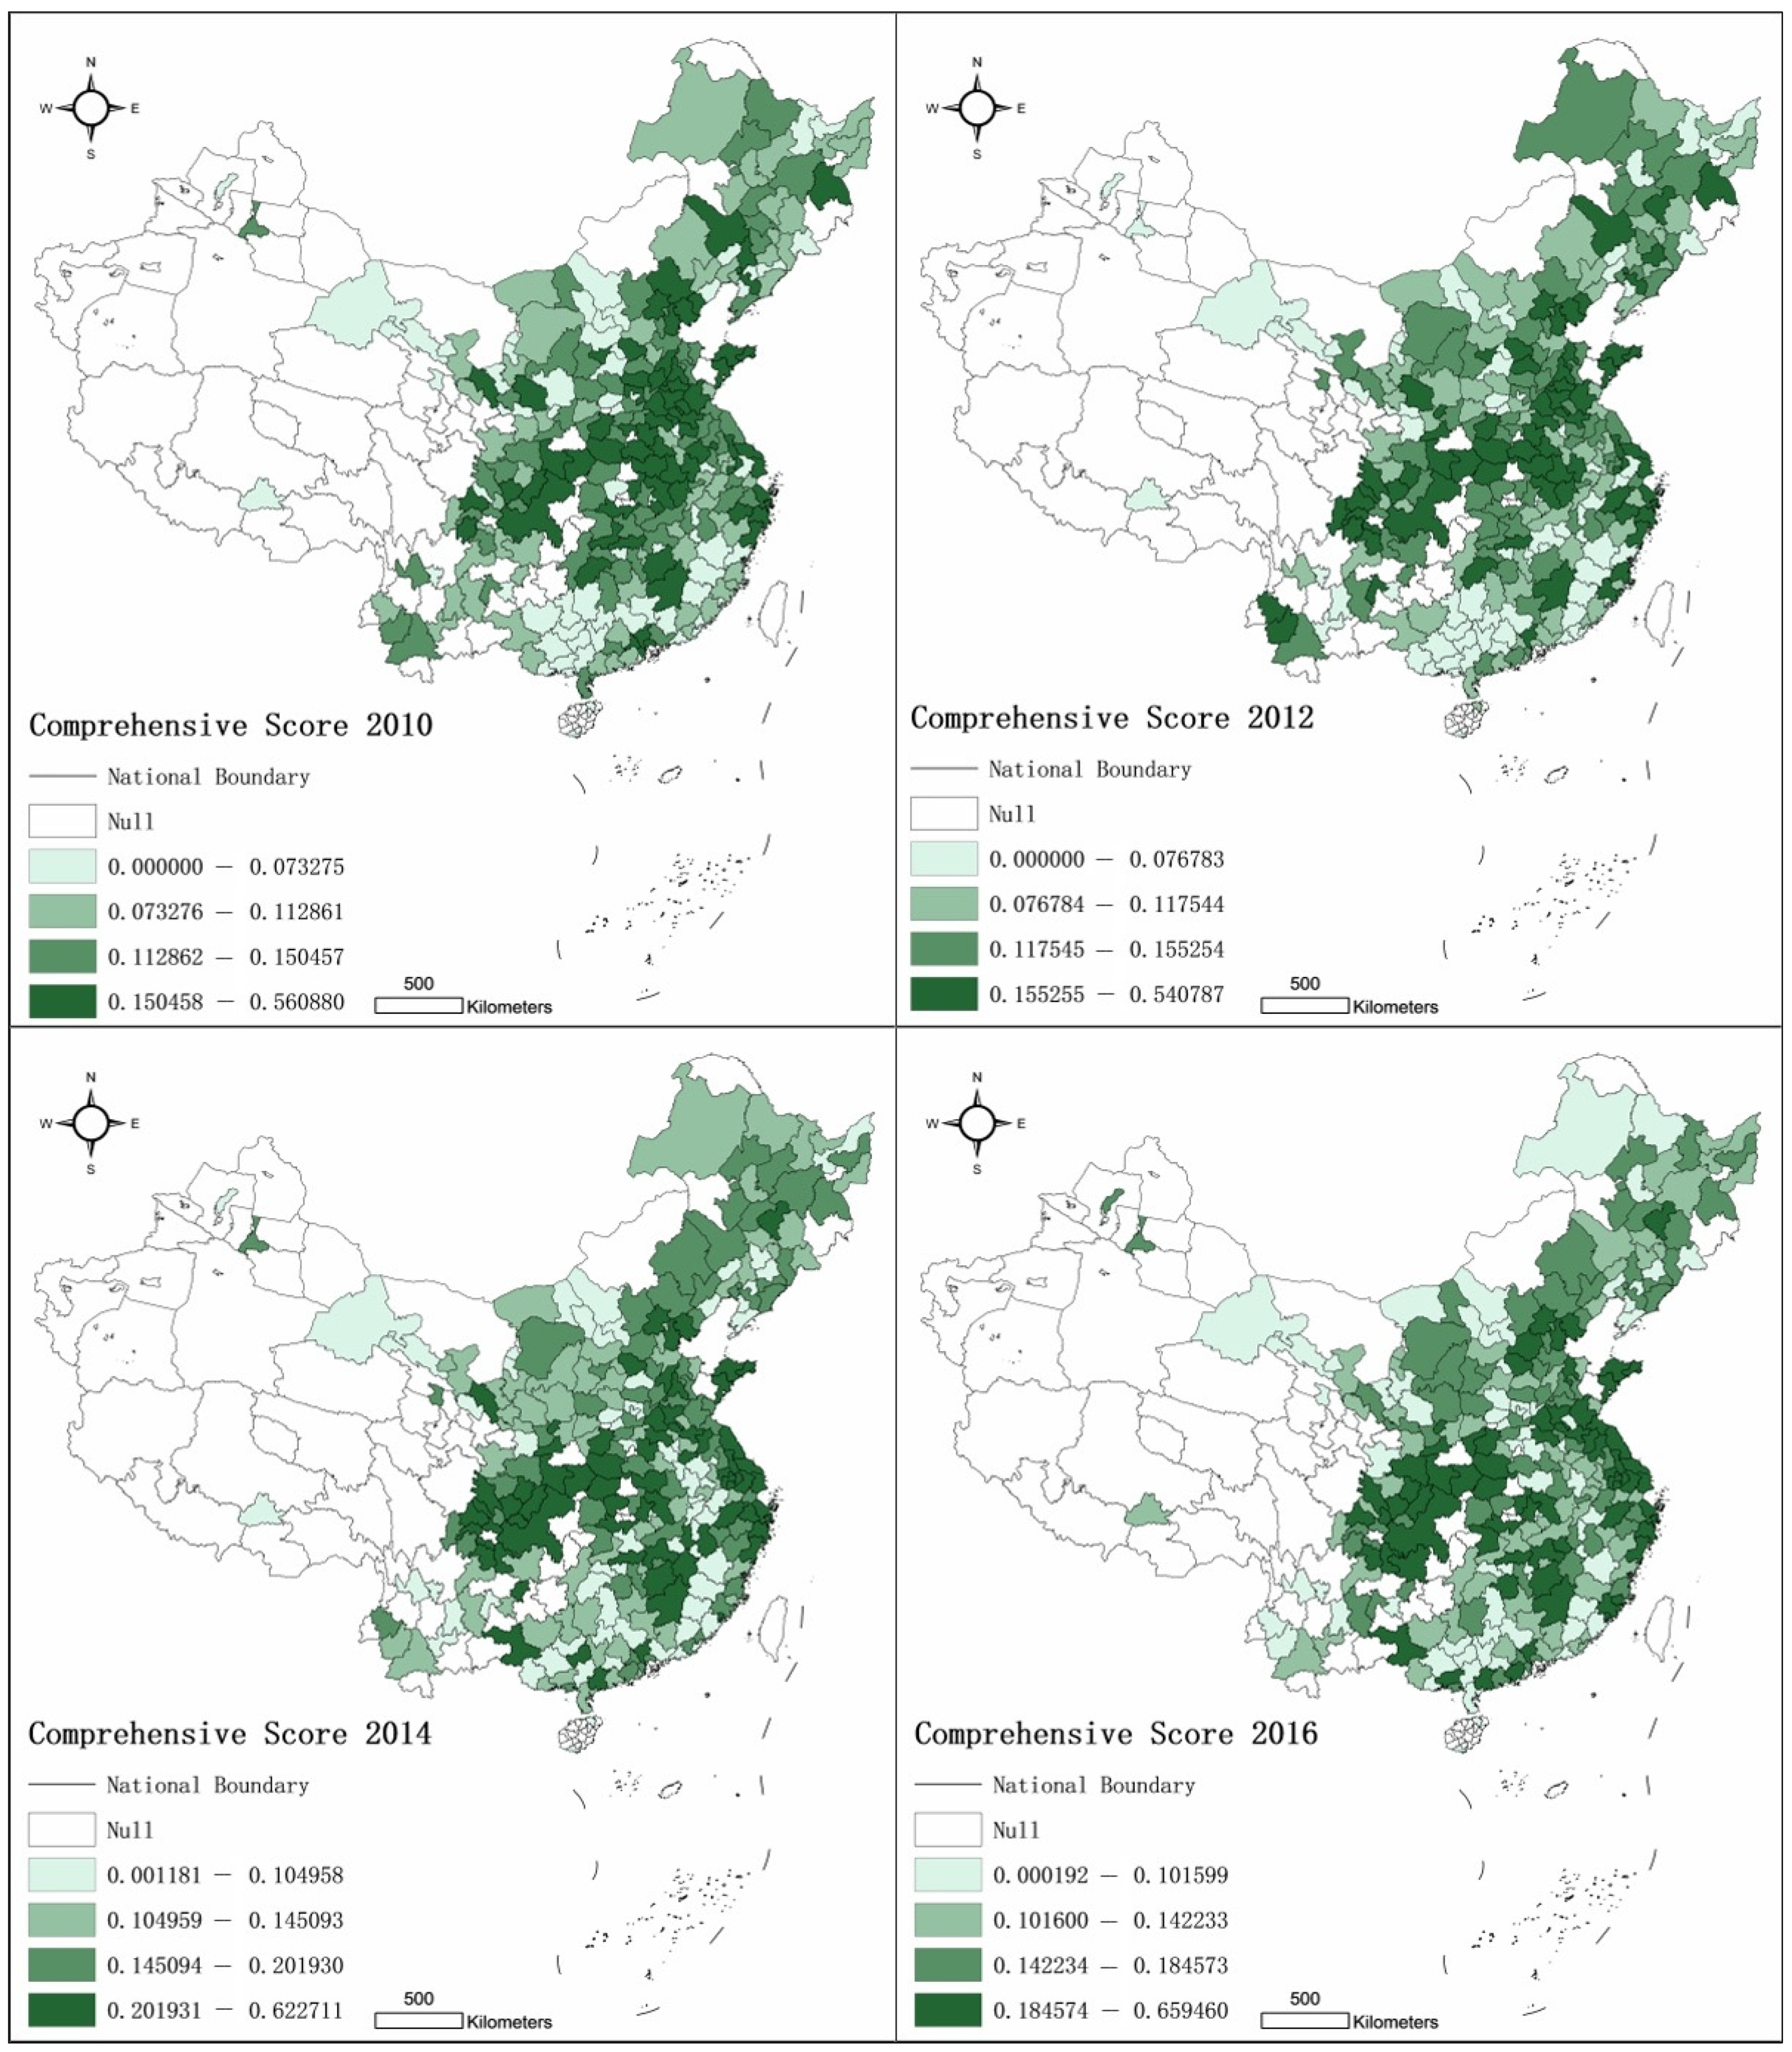
4.2. Spatial Pattern of Comprehensive Scores for Rural Elderly Care Institutions in China

The time series change analysis of China’s rural aged-care institutions reveals the changing development of rural aged-care institutions nationwide, but lacks regional analysis to reveal the changing characteristics of rural aged-care institutions in the northeast, east, central and west regions. For this reason, we will analyze the changing characteristics of regional rural aged-care institutions from a spatial perspective to reveal the spatial pattern of the development of rural aged-care institutions in China.
The development of rural elderly care institutions in the four major regions shows that: Firstly, there is a clear “gradient” in the east, middle and west of the country, with the eastern region having the highest overall score for rural aged-care institutions, followed by the central region, then the western region and finally the northeastern region. Secondly, the hard environment score of rural elderly care institutions also has an east–central–west “gradient”, with the higher hard environment score of rural elderly care institutions in the eastern region. Thirdly, there is a relatively small difference in the soft environment scores of rural elderly care institutions, with the western region having the highest soft environment score, followed by the northeastern region, the eastern region ranking third and the central region having the lowest soft environment score. Fourthly, the scores of rural elderly care institutions’ service recipients show a spatial pattern that is dominated by the east, that is, the scores of rural elderly care institutions’ service recipients in the east are much higher than those in the other three regions.
In terms of the change in the scores of rural elderly institutions in the four major regions, the western region had the fastest increase in the composite score of rural elderly institutions, with the composite score increasing from 0.092 in 2010 to 0.136 in 2016, an increase of 1.49 times; the lowest increase in the composite score was in the central region, whose composite score increased from 0.129 in 2010 to 0.139 in 2016, an increase of 1.08 times. The lowest increase was in the central region, whose composite score increased from 0.129 in 2010 to 0.139 in 2016, an increase of 1.08 times; in the northeast and east regions, the increase in composite score was 1.28 times and 1.35 times, respectively. For the three secondary indicators of hard environment, soft environment and service recipients, the scores of hard environments in the eastern, central, western and northeastern regions increased by 1.68 times, 1.29 times, 1.62 times and 1.70 times, respectively, from 2010 to 2016. In terms of the soft environment scores of rural elderly care institutions in China, the scores of the eastern and central regions tend to decline, while the western region shows a more significant increase. In terms of the scores of service recipients of rural elderly care institutions in China, the scores of the eastern, central, western and northeastern regions increased by 1.53 times, 1.09 times, 1.47 times and 1.47 times, respectively, from 2010 to 2016 (Table 5, Table 6, Table 7 and Table 8).
In terms of the spatial pattern of China’s rural retirement institutions score, the central-eastern region accounts for 25–30 rural retirement institutions in the top 20% of the composite score, the central region accounts for 10–18, the western region accounts for 7–15 and the northeastern region accounts for 1. The eastern region has an overwhelming predominance of the top 20% of rural aged-care institutions in the composite score, while the central region has seen a decrease in the number of municipalities in the top 20% of rural aged-care institutions in the composite score, while the western region has seen an increase in the number of municipalities and the northeastern region is in the range of 0–1 municipalities. In terms of the number of rural institutions in the four regions with a combined middle 60% score, the eastern and central regions have a certain advantage, with the number of institutions varying between 43 and 52; the western region shows a process of “decrease–increase–decrease again” with the number of municipalities with a combined middle 60% score in the western region. The number of rural elderly institutions in the western region decreased from 45 in 2010 to 39 in 2012, then increased to 50 in 2014, and then decreased to 45 in 2016; the number of rural elderly institutions in the northeast region with a composite score of the middle 60% fluctuated between 24 and 30. The number of municipalities in the eastern, central, western and northeastern regions with a combined score of the bottom 20% rural aged-care institutions changed from 14, 11, 28 and 2 in 2010 to 11, 20, 21 and 3 in 2016, respectively (Table 9).
In 2010, the top 20 cities in terms of rural retirement institutions in China (Figure 3) were Chongqing, Shanghai, Beijing, Nanyang, Taizhou, Wenzhou, Xuzhou, Linyi, Zhoukou, Jinan, Heze, Ganzhou, Taiyuan, Baiyin, Jining, Yantai, Zhumadian, Nantong, Qingyang, Guangzhou. In 2012, the top 20 cities in terms of rural retirement institutions were Chongqing, Shanghai, Beijing, Taizhou, Nantong, Nanyang, Jinan, Wenzhou, Qingdao, Zhumadian, Linyi, Heze, Zhoukou, Weifang, Jining, Fuzhou. In 2014, they became Beijing, Shanghai, Chongqing, Nanyang, Taizhou, Zhoukou, Nantong, Xuzhou, Nanchong, Suzhou, Wenzhou, Ganzhou, Shangqiu, Jining, Ningbo, Hangzhou, Chengdu, Ankang, Mianyang, Tianjin. In 2016, they became Shanghai, Beijing, Nantong, Heze Xuzhou, Nanchong, Chongqing, Taizhou, Ganzhou, Hangzhou, Ningbo, Jining, Suzhou, Qingdao, Weihai, Zunyi, Mianyang, Shijiazhuang, Taizhou and Tianjin. In terms of urban spatial distribution, China’s rural aged-care institutions score has the spatial characteristics of an eastern coast bias, with rural aged-care institutions in Jiangsu, Zhejiang, Shanghai, Shandong, Hebei, Tianjin and Beijing ranking highly, while the list of top 20 rural aged-care institution cities in the central region has declined severely and with some rural aged-care institutions in western cities maintaining their top 20 ranking, such as Chongqing. From 2010–2016, no rural aged-care institutions in the northeast region scored in the top 20. In terms of the cities with the bottom 20 rural elderly care institution scores, the eastern, central and western regions accounted for 3, 1 and 16, respectively, in 2010, while the eastern, central and western regions accounted for 6, 3 and 11, respectively, in 2016. The above changes in scores show that although the eastern region has a higher overall score for rural elderly institutions than the other three regions, it has developed relatively more slowly than the western region, and the difference in overall scores for rural elderly institutions in the eastern region is greater, while the difference in overall scores for rural elderly institutions in the northeastern region is smaller.

4.3. Analysis of Regional Differences in Rural Elderly Care Institutions in China

Time series change analysis can reveal the change characteristics of rural elderly institutions’ indicators, and comprehensive score space analysis can reflect the spatial and temporal patterns of rural elderly institutions, but neither can yet accurately analyze the characteristics of regional differences in rural elderly institutions’ indicators. To this end, we combine the time-series changes in rural elderly institutions with a comprehensive analysis of their regional variation characteristics, in order to provide a basis for revealing the total variation, inter-group variation and intra-group variation in the development of rural elderly institutions in China in depth.
In terms of overall variation, there is a large difference in the Theil index between the overall score, hard environment score, soft environment score and service recipient score of rural elderly institutions (Figure 4). The Theil index for the overall score decreased from 0.180 in 2010 to 0.130 in 2013, and then increased to 0.146 in 2016, with regional differences showing a “narrowing–widening” process. The Theil index for the hard environment score decreased from 0.440 in 2010 to 0.411 in 2012, then increased to 0.466 in 2013, then decreased to 0.464 in 2015, then increased to 0.487 in 2016, going through a process of “decrease–increase–decrease–increase again”. The Theil index for soft environment scores continued to decline from 0.245 in 2010 to 0.180 in 2014 and then rebounded to 0.205 in 2016, going through a “downward–upward” process. The Theil index for service users decreased from 0.263 in 2010 to 0.241 in 2011, then increased to 0.291 in 2014 and then decreased to 0.275 in 2016, going through a process of “decrease–increase–decrease again”. The smallest variation in the soft environment score for rural elderly care institutions is the result of the development of a comparable rate of increase in the soft environment indicators for each region, in line with the original development base of the region. The largest difference in the hard environment scores of rural elderly care institutions is related to the differences within their four regional groups, while the smallest difference in the overall scores is the result of the interactive coupling of the hard environment scores, soft environment scores and service recipient scores, and the result of the development of the secondary and tertiary indicators of rural elderly care institutions, which interact with each other.
The Theil index was decomposed into within-group differences and between-group differences, where within-group differences were further decomposed into within-group differences in the northeast, east, central and west regions (Table 10, Table 11, Table 12 and Table 13).
Firstly, from the inter-group variation of the Theil index, the overall inter-group variation shows a “falling–rising–falling–rising” process, with the Theil index falling from 0.015 in 2010 to 0.007 in 2012, then rising to 0.013 in 2013, then falling to 0.008 in 2014, then rising to 0.012 in 2016. The difference between the hard environment groups shows a “V”-shaped curve of “decline–rise”, with the Theil index decreasing from 0.044 in 2010 to 0.026 in 2014 and then to 0.012 in 2016. The difference between the soft environment groups shows a “falling–rising–falling” process, with the Theil index falling from 0.009 in 2010 to 0.001 in 2012, then rising to 0.008 in 2014 and then falling to 0.002 in 2016. Differences between client groups show a “rising–declining–rising” process, with the Theil index rising from 0.017 in 2010 to 0.039 in 2013, to 0.026 in 2014 and to 0.029 in 2016.
Secondly, the within-group variation in the Theil index shows a “decreasing–rising–decreasing” process, with the Theil index decreasing from 0.165 in 2010 to 0.117 in 2013, to 0.139 in 2015 and to 0.135 in 2016. Differences within the hard environment group show a “rising–falling–rising” process, with the Theil index rising from 0.396 in 2010 to 0.467 in 2014, to 0.435 in 2015 and to 0.453 in 2016. Differences within the soft environment group show that the Theil index continued to decline from 0.236 in 2010 to 0.172 in 2014 and then to 0.203 in 2016. The Theil index declined from 0.246 in 2010 to 0.234 in 2013, to 0.265 in 2014 and to 0.246 in 2016.
Thirdly, in terms of intra-group differences in the Theil index for the four regions, the overall trend of intra-group differences in the Theil index for the four regions shows a narrowing trend, with the eastern region showing higher intra-group differences than the western region, the western region showing higher differences than the central region and the central region showing higher differences than the northeastern region. In terms of hard environment, the within-group differences in the Theil index in the northeastern and western regions show an overall trend of narrowing, while the within-group differences in the Theil index in the eastern and central regions show an overall trend of widening, with the largest within-group differences in the eastern region, followed by the western region, then the central region and finally the northeastern region. In terms of soft environment, the within-group variation in the Theil index for the four regions tends to narrow, with the western region showing the largest within-group variation, followed by the eastern region, the central region and finally the northeastern region. In terms of service recipients, the within-group variation is the largest in the eastern region, followed by the western region, followed by the central region and the smallest in the northeastern region; the Theil index for the eastern region expanded from 0.088 in 2010 to 0.092 in 2016, and the Theil index for the central region expanded from 0.055 in 2010 to 0.093 in 2013, before falling back to 0.057 in 2016. The Theil index for the western region experienced a “rising–declining” process, with the Theil index rising from 0.088 in 2010 to 0.099 in 2014 and then declining to 0.088 in 2016.

4.4. Analysis of Coupling Coordination Degree of Rural Institutions for the Elderly in China

The coupling coordination model is used to reveal the level of coupling and coordination of rural elderly institutions in China, reflecting the coupling and coordination between the hard environment, soft environment and service users of rural elderly institutions. The stronger the interaction of the subsystems of rural elderly institutions, the more they tend to be coordinated with each other. In terms of the coupling and coordination relationship, the coupling degrees of the four major regions all exceeded the low-level coupling stage, with the coupling degree coefficient above 0.3, and were in the antagonistic stage or the grinding stage (Table 14). The coupling degree of the northeast region rose from 0.353 in 2010 to 0.422 in 2013, then to 0.512 in 2015 and then to 0.449 in 2016. The coupling in the central region also experienced an M-shaped curve of “rising–declining–rising–declining”, with the coupling declining from 0.627 in 2010 to 0.506 in 2016. In general, the coupling degree of the four major regions, in descending order, is: Central region > eastern region > northeastern region > western region, with the coupling degree of the eastern region, western region and northeastern region at the antagonistic stage and the coupling degree of central region at the abrasive stage; the coupling degree of the northeastern region is on an upward trend and the coupling degree of the eastern, central and western regions is on a decreasing trend.
The coupling degree can describe the degree of interaction and mutual influence of the subsystems of rural elderly care institutions, but it cannot reveal the level of coordinated development of the subsystems of rural elderly care institutions. For example, the development level of rural elderly care institutions in the eastern region is higher than that of the other three major regions, but the coupling degree is not as high as that of the central region. Therefore, it is necessary to further use the coupling coordination degree model to measure the degree of coordination between systems. The results of the coupling coordination degree measurement show that the average level of coupling coordination of rural elderly institutions in the four major regions is at a low level of coordination, and the overall coupling coordination degree is not high, which will inevitably affect the sustainable development of rural elderly institutions and is not conducive to coordinating the coupling coordination relationship between the soft and hard environments of rural elderly institutions and their service users. In terms of the ranking of the coupling coordination degree, the coupling coordination degree of the four major regions, in descending order, is: Eastern region > central region > northeastern region > western region. In terms of changes in the development of the coupling coordination degree, the coupling coordination degree of the northeastern region increased from 0.098 in 2010 to 0.127 in 2016, the coupling coordination degree of the eastern region increased from 0.139 in 2010 to 0.157 in 2016, the coupling coordination degree of the central region decreased from 0.157 in 2010 to 0.137 in 2016 and the coupling coordination of the western region increased from 0.084 in 2010 to 0.101 in 2016 (Table 15).
In terms of the spatial and temporal pattern of coupling degree (Figure 5), the number of cities in the low, antagonistic, teething and high coupling stages in 2010 were 105, 36, 70 and 65, respectively, that is, the number of rural elderly institutions with a coupling degree greater than 0.5 accounted for 48.91%; the number of cities in the low, antagonistic, teething and high coupling stages in 2016 were 109, 44, 67 and 56, respectively, that is, the number of rural elderly institutions with a coupling degree greater than 0.5 accounted for 44.57%. The top 20 cities in terms of coupling degree in 2010 were, in descending order, Suqian, Xiangtan, Yueyang, Shangqiu, Shiyan, Mianyang, Zhangjiakou, Xuzhou, Xinyang, Taizhou, Ankang, Heze, Deyang, Shangrao, Nantong, Hefei, Zhoukou, Changde, Nanyang and Bozhou. Among them, the numbers of cities in the eastern, central and western regions are 6, 11 and 3, respectively. The top 20 cities in terms of coupling in 2016 are, in descending order: Weihai, Shaoguan, Jincheng, Lianyungang, Yantai, Jingzhou, Siping, Huizhou, Binzhou, Harbin, Chaoyang, Deyang, Tai’an, Luoyang, Anqing, Xinxiang, Jinzhong, Jinzhou, Shaoyang and Leshan. Among the top 20 cities in terms of coupling degree from 2010 to 2016, the number of cities in the central region has decreased, while the number of cities in the northeast region has increased significantly, reflecting that the coupling degree in the central region is decreasing, while that in the northeast region is increasing.
In terms of the spatial and temporal pattern of coupling coordination, in 2010, only four cities, namely Beijing, Shanghai, Nanyang and Xuzhou, were in the moderate coordination development stage, that is, the D value of coupling coordination was between 0.3 and 0.5. In 2016, there were seven cities in the moderate coordination development stage, namely Shanghai, Beijing, Xuzhou, Weihai, Jining, Nanchong and Hangzhou, and compared with 2010, cities in the moderate coordination development stage had D values from 0.2–0.3, 96 cities had D values from 0.1–0.2 and 126 cities had D values below 0.1; in 2016, cities had D values from 0.2–0.3, 111 cities had D values from 0.1–0.2 and 126 cities had D values below 0.1; in 2016, cities had D values from 0.2–0.3, 111 cities had D values from 0.1–0.2 and 126 cities had D values below 0.1. The number of cities with D values between 0.1 and 0.2 was 111, and the number of cities with D values below 0.1 was 101. In terms of the development sequence of the coupling coordination degree, the coupling coordination degree of rural elderly care institutions in the four regions has increased, but the coupling coordination degree level is generally not high, and the majority of rural elderly care institutions in cities are in the low coupling stage, which is quite different from the ideal state value. The unsustainable status quo characteristics of rural elderly care institutions will inevitably affect the quality of elderly care services and the quality of life of rural elderly people in their twilight years and have a negative impact on the sustainable development of the regional economy and society. Therefore, it is vital to improve the quality of services provided by rural elderly care institutions by increasing the investment in strengthening the hard and soft environments of rural elderly care institutions.

5. Discussion and Conclusions

5.1. Discussion

5.1.1. Comparative Analysis with Reviewed Literature

The challenges posed by an aging population, which will become the norm in human society, stem more from the contradictions arising from the incompatibility between the age structure of an aging population and the existing socio-economic system. Aging is not a problem in itself; it is simply the result of a demographic transition, a demographic phenomenon that is in line with the laws of demographic transition. The problem lies in the fact that as the physical functions of the elderly tend to age and decline naturally, and to ensure a decent quality of life and quality of life for the elderly, there is an urgent need to speed up the establishment of a sound and diversified and accurate system of supplying diversified, diverse and accurate aging service products. However, the contradiction between the demand of the elderly for diversified, diverse and accurate elderly services and the single supply of service products by elderly institutions is still prominent, and the solution to this contradiction needs to be given consideration in terms of system design.
As an important part of elderly care services, the reform and development of elderly care institutions is related to the vital interests of the elderly. The State Council of the CPC Central Committee attaches great importance to this issue and has placed the issue of aging and people’s livelihood in a prominent position, proposing measures to deal with it at the macro-strategic level and at the level of social practice. At the macro-strategic level, the report of the 20th National Congress of the CPC clearly proposed “implementing a national strategy to actively cope with the aging of the population, developing the elderly care business and the elderly care industry, optimizing services for widows and orphans, and promoting the realization of basic elderly care services for all elderly people”, which pointed out the direction for the reform and development of China’s aging career. In terms of social practice, the State Council has issued the “14th Five-Year Plan for the Development of the National Ageing Cause and the Senior Care Service System”, which sets out the role of public elderly care institutions as a bottom-up guarantee, focusing on providing services for empty nesters (living alone), elderly people left behind, disabled people, elderly people with disabilities and elderly people in financial difficulties, as well as for elderly people from special families with family plans, on the premise of meeting the needs of elderly people in special hardship for centralized care. The services are provided for elderly people from special families with family planning. A large number of studies have been conducted on the development of elderly care institutions, and the spatial perspective of elderly care institutions is mainly focused on the spatial layout, accessibility and factors influencing the development of elderly care facilities. However, due to the limitations of research data, most studies are based on community-level data for investigation and analysis, while spatial and temporal analysis of rural elderly institutions at the spatial scale of prefecture-level cities and above is still insufficient, and research on the development and spatial and temporal patterns of rural elderly institutions needs to be strengthened. Our study uses panel data on rural aged-care institutions in 276 Chinese cities from 2010 to 2016 to construct comprehensive evaluation indicators for the development of rural aged-care institutions, to somewhat remedy the lack of research on the development and spatio-temporal patterns of rural aged-care institutions, and to provide certain countermeasure suggestions for the development of sustainable rural aged-care institutions.

5.1.2. Comparative Analysis of Consecutive Studies

In our study of the spatial and temporal differences in the development of rural and urban care institutions in China, we came up with the preliminary finding of “urban progress, rural decline”, due to the serious decline in some indicators of rural care institutions (Table 16) [44]. The results of this analysis stimulated our interest in the development of rural institutions in China, and further analysis was undertaken. The decline of rural elderly institutions is visually evident in the significant decline of hard environment indicators such as the number of rural elderly institutions, the floor area of rural elderly institutions and the number of beds in rural elderly institutions at the end of the year. In terms of the soft environment, the number of year-end workers in rural elderly institutions decreased from 131,900 to 106,400. In terms of rural elderly services, the number of people staying in rural aged-care institutions decreased from 1,691,200 to 1,037,300.
However, can we directly conclude from the results of the data analysis that the demand for elderly care services in rural China is decreasing? We cannot draw this conclusion arbitrarily. China’s rural areas are undergoing profound structural changes and rural society is facing unprecedented challenges. Despite the remarkable results of the Chinese government-led fight against poverty, the challenge of preventing systematic return to poverty remains. Traditionally, rural China has been characterized by the traditional idea of having many children and being blessed with many children, but in reality, the mainstay of China’s rural retirement is the rotating care of multiple children. Due to financial weakness, the vast majority of China’s rural elderly do not have sustainable financial resources to support the costs of institutionalization, resulting in a superficial decline in the indicators for rural institutions.
Of course, the decline in the total number of rural elderly care institutions does not necessarily indicate a decrease in the care needs of rural elderly people. With the combined impact of an aging population, empty nesting families and the weakening of traditional elderly care functions, the care needs of China’s rural elderly who are empty nesters, single and incapacitated have become prominent, as evidenced by the continued increase in the proportion of people who are semi-self-care and unable to care for themselves in rural elderly care institutions, with the proportion of semi-self-care individuals and individuals unable to care for themselves rising from 17.55% to 25.38%.
While the decline in the total data for most rural aged-care facilities has been observed, the data for a few rural aged-care facility evaluation indicators have rebounded. The proportion of caregivers working in rural aged-care institutions with university education has increased, from 9.08% in 2010 to 16.79% in 2016; the proportion of people aged 35 and under increased from 20.07% in 2010 to 21.49% in 2016. Essentially, the changes in rural institutions for the elderly are closely linked to China’s industrialization and urbanization, and even more so to the branding of the urban–rural dichotomy. China’s rapid development, using the “scissors difference” principle to supplement industry with agriculture, has accelerated the accumulation of primary capital and rapid industrialization through planned means and the deployment of resources from all sides. However, this process was accompanied by a widening urban–rural divide. With the rapid development and maturity of the cities, the central government has continued to increase its diversified investment in rural areas, agriculture and farmers, whether in the fight against poverty, the construction of new rural areas or the integrated development of urban and rural areas. Various policies have been introduced to nurture and benefit farmers, and cities continue to feed the countryside, bringing a certain number of resources, manpower and capital to feed rural development. In other words, the endogenous impetus for the development of rural aged-care institutions is insufficient, relying to a large extent on the power of policies and administrative forces to support them, bringing about a rise in the indicators of a small number of rural aged-care institutions.

5.2. Conclusions

Based on data from 276 rural aged-care institutions in cities at the prefectural level and above, the study uses a combination of hierarchical analysis, composite score method, Theil index and coupling coordination model to comprehensively measure the spatial and temporal patterns and coupling characteristics of the development of rural aged-care institutions in China, and draws the following main conclusions:
Firstly, in terms of time series changes, the overall score of rural elderly care institutions shows a “fluctuating” upward development process, with significant differences in the development of each secondary indicator. The mean score for the hard environment indicator fluctuated from 0.026 in 2010 to 0.040 in 2016, an increase of 1.53 times, the most significant increase among the three secondary indicators. The mean score for the soft environment indicator of rural elderly institutions improved more slowly, with the mean score for the soft environment indicator fluctuating from 0.046 in 2010 to 0.049 in 2016, an increase of only 1.07 times. The average volume score for the service user indicator fluctuated from 0.046 in 2010 to 0.063 in 2016, an increase of 1.38 times.
Secondly, in terms of spatial and temporal patterns, the overall scores of rural elderly care institutions, hard environment scores, soft environment scores and service recipient scores show a clear “gradient” in the east, central and west regions. The overall score of rural elderly care institutions in the eastern region is higher than that of the other three regions, but its development rate is relatively slower than that of the western region, and the difference in the overall score of rural elderly care institutions in the eastern region is greater, while the difference in the overall score of rural elderly care institutions in the northeastern region is smaller.
Thirdly, in terms of regional differences, the regional differences in Theil index for rural elderly institutions are, in descending order: Hard environment > service recipients > soft environment > overall score. In terms of the decomposed Theil index, the within-group differences of rural elderly institutions are much greater than the between-group differences, and the within-group differences of the four major regional Theil indices generally show a narrowing trend, with the within-group differences in the eastern region being higher than those in the western region, those in the western region being higher than those in the central region and those in the central region being higher than those in the northeastern region.
Fourthly, in terms of coupling coordination, the coupling degrees of the four major regions all exceed the low-level coupling stage indicator and are in the antagonistic stage or grinding stage. The coupling degrees of the four major regions are, from high to low, central region > eastern region > northeastern region > western region. The average level of coupling and coordination of rural elderly institutions in the four regions is at a low level of coordination in the development stage, and the overall coupling and coordination are not high. The coupling coordination degree of the four regions, in descending order, is: Eastern region > central region > northeastern region > western region. Among the top 20 cities in terms of coupling degree, the number of cities in the central region has decreased while the number of cities in the northeast region has increased significantly, reflecting that the coupling degree of the central region is decreasing while that of the northeast region is increasing. In terms of the development sequence of the coupling coordination degree, the coupling coordination degree of rural elderly institutions in the four major regions has increased, but the level of coupling coordination is generally not high, and the vast majority of urban rural elderly institutions are at a low coupling stage.

6. Recommendations

The problem of unbalanced and insufficient development between the people’s growing diversified and multi-level elderly services and the supply of elderly services is the main contradiction in the sustainable development of rural elderly institutions. There are three main reasons for this: First, the cost theory. Scholars believe that the unresolved issue of sharing the cost of care is one of the “meta-problems” of elderly care services in the age of population aging. The second is the high operating cost of elderly care institutions. For profit-making elderly care institutions, their facilities are characterized by low returns, high investment volume and long payback periods; for public elderly care institutions, imperfect policies, unbalanced development, high operating costs, high risks, low efficiency and low service satisfaction are the main factors affecting the high-quality development of public elderly care institutions. Second, transformation theory. Publicly run aged-care institutions are gradually developing from purely public welfare institutions to diversified investment and diverse services, with problems such as lower accessibility and underutilization of services, structural imbalance and separation of systems, insufficient supply capacity of private institutions and multiple funding dilemmas. Due to the problems in the positioning of functions, operating mechanism and resource allocation of public elderly institutions, the development of public elderly institutions is not sufficiently dynamic. Third, the theory of misalignment between supply and demand. China’s elderly care services face problems such as an imperfect institutional system, insufficient service supply and lower levels and uneven distribution of health resources. The main reason for the mismatch between supply and demand for community-based elderly care services is that the impact of age on the physical function, mental health and demand for community-based elderly care services has not been considered. From the supply side, the low level of supply of elderly care services is the supply-side reason for the lack of effective demand for social elderly care. Staffing per 100 beds and the availability of financial subsidies have a significant impact on the occupancy rate of private elderly care institutions. From the demand side, self-care elderly people have a demand for sports and leisure activities and no demand for medical care, while semi-self-care elderly people and non-self-care elderly people need medical care. The sustainable development of rural aged-care institutions is a key initiative to meet the pressure challenges of rural aged-care risk management and to address the aged-care needs of the elderly living alone, disabled and handicapped in rural areas. However, practical issues such as the unbalanced regional development of rural aged-care institutions, the low coordination of soft and hard environment coupling and the speed of development not being more in line with the actual needs of the elderly are yet to be addressed. Based on this, we propose a sustainable development path for rural aged-care institutions, aiming to provide countermeasure suggestions for the sustainable development of rural aged-care institutions (Figure 6).

6.1. Coordinated Development

The aim of coordinated development is to achieve relatively balanced development between the subsystems within the system and to achieve orderly growth of each subsystem to maximize the benefit of the overall growth of the system. Currently, there are four major regional disparities in the development of China’s rural elderly care institutions, as well as the uncoordinated development of the internal soft and hard environments of rural elderly care institutions. “Narrowing the gap and mending the shortcomings” is a direct means to solve the problem.
The first step is to narrow the regional gap in the development of rural aged-care institutions in the four major regions, increase the spatial allocation of resources for rural aged-care services in the central and western regions and reduce the imbalance in the development of regional rural aged-care institutions. Then, the aim is to narrow the urban–rural gap by continuously increasing the resources invested in rural elderly care service institutions and increasing the spatial allocation of hardware facilities and material resources for rural elderly care services.
The second step is to make up for the shortcomings. Compared with the hard environment, the development of the soft environment of rural aged-care institutions is relatively lagging behind, with slow growth, and even negative growth in some areas. Therefore, while increasing investment in the hard environment in rural areas, there is a greater need to strengthen the soft environment, especially by increasing the training and management of elderly service personnel in rural areas, increasing the sense of professional access and happiness of rural elderly caregivers and raising the income level of elderly caregivers. Policies such as financial, tax, subsidy and bonus dividends to attract university students to work in rural elderly care institutions and enrich the team of rural elderly care service workers may be adopted.

6.2. Coupling Development

Although the coupling of rural aged-care institutions in some cities is high, their coupling coordination is generally not high, meaning that the quality of development of rural aged-care institutions needs to be improved. How to integrate resources and improve the quality of rural elderly care services is a problem that needs to be faced by the development of coupling.
First, the allocation of resources to rural elderly institutions should be strengthened and the quality of rural elderly services improved. The proportion of elderly people who are semi-self-care or unable to care for themselves is increasing, which means that rural elderly people have a strong demand for institutional elderly care services, while the total number of people staying in rural elderly care institutions is decreasing; does this also mean that the demand for institutional elderly care services for the elderly is decreasing? It seems that the two indicators are contradictory. In fact, they are not necessarily contradictory. While the cost of reformed rural aged-care institutions is increasing, the quality of service in institutional aged-care facilities is not high, and the mismatch between this and the huge demand for institutional aged care in rural areas is an important reason for the lower occupancy rate. Therefore, on the one hand, it is still necessary to continue to strengthen the allocation of resources to rural elderly institutions, and on the other hand, to increase the improvement and enhancement of the quality of the soft environment, so as to improve the service quality of rural elderly institutions and attract more elderly people in need to move in.
Second, the allocation of resources for rural elderly care should be dynamically adjusted and the allocation of resources for rural elderly care services integrated. Considering the realities of high investment costs and high management and maintenance costs of rural elderly institutions, over-investment of resources brings waste instead, bringing financial pressure on the grassroots government and affecting the sustainable growth of the local economy. Therefore, the coupling development of rural aged-care institutions requires both increasing resource allocation on the premise of financial affordability and optimizing the allocation of stock resources by combining local realities, transforming unused rural factory buildings, village collective dormitories and office areas into space for aged-care institutions, increasing the quality of aged-care services, not wasting existing resource allocations and achieving dynamic balance and sustainable development of regional rural aged-care institutions.
Third, an overall standpoint of the aging industry policy should be implemented, adhering to the demand-side standpoint. The development of the rural elderly industry must follow market logic, meet the needs of the vast majority of people to provide elderly service products [57], in order to improve the quality of life of the vast majority of people in their old age and life, stand in the overall development of the elderly industry, guide and support the industry from the beginning to rapid development in stages and steps, stand in the people-based economy, stand in the needs, abilities and wishes of the demand side, improve the supply capacity [58], make long-term preparations, maximizing the effective demand for the development of the aging economy and promote win–win cooperation between the supply and demand sides of rural elderly institutions.

6.3. Sustainable Development

According to Doxiadis, rural institutions, as a typical type of habitat, consist of a shell and a content. The shell is the external physical environment such as the hardware and facilities of the institution, while the content is the internal things such as the soft environment and service quality of the institution. To improve the quality of rural elderly institutions, in addition to strengthening the coupled and coordinated development of rural elderly institutions, it is also necessary to strengthen the sustainability of rural elderly institutions to meet the basic living needs of rural elderly people.
The needs of the elderly in rural areas should be focused upon, and the efforts to invest in rural elderly resources that match the population should be strengthened. Meeting the needs of people is the primary basic issue addressed by Habitat for Humanity, that is, the sustainable development of aged-care institutions needs to focus on the health needs of the elderly, accelerate the establishment of efforts to invest in rural aged-care resources that match the elderly population, target the construction of aged-care service resources, accelerate the structural transformation of the supply side of rural aged-care institutions, enhance the dynamic balance between rural aged-care institutions and the population and deepen the adjustment of the rural elderly institutions’ service quality system.
A “15 min” elderly care service circle in rural communities should be established and the resources for institutional, community and home-based elderly care integrated. We will put the needs of the elderly at the center of the construction of the habitat of the elderly institutions, speed up the establishment of the “15 min” community elderly service circle centered on villages and towns, increase the coverage and radiation rate of rural elderly institutions, speed up the construction of a multi-level and multi-layered supply and demand guarantee system for rural elderly services, mainly for the elderly at home. It will also speed up the construction of a multi-level and multi-layered supply and demand guarantee system for rural elderly care services, with the aim of establishing eco-communities, healthy societies and age-friendly communities that are suitable for living, traveling and working in rural communities, and truly realizing “a sense of security, a sense of belonging, a sense of activity and a sense of enjoyment for the elderly”.
The resilience of rural community elderly care institutions should be improved and a “combined medical and nursing care” elderly care service guarantee system established. Steps should be taken to accelerate the renovation of age-appropriate rural areas, improve the resilience of rural community elderly institutions, establish emergency mechanisms and response mechanisms for public health emergencies, protect the lives and health of elderly people in rural elderly institutions to the maximum extent possible in the event of public health emergencies, establish a sound service guarantee system for rural elderly institutions that combines medical care with nursing care and promote the construction of sustainable rural elderly institutions. The project aims to establish and improve the service guarantee system of “medical and health care integration” in rural elderly institutions, promote the construction of sustainable rural elderly communities and realize the sustainable development of rural elderly institutions.

Author Contributions

All the authors contributed extensively to the work presented in this paper. Conceptualization: C.L.; methodology: J.W.; software: J.W.; writing—original draft preparation: C.L. and J.W.; writing—review and editing: Y.H. All authors have read and agreed to the published version of the manuscript.

Funding

National Social Science Foundation of China Research on the Policy Implementation Ability of County-level Government (Grant Number 19CZZ039); the Fundamental Research Funds for the Central Universities Study on Multi-Objective Coordination of Rural Green Development in the Perspective of Rural Revitalization (Grant Number 2232022E-07).

Institutional Review Board Statement

Not applicable for studies not involving human or animals.

Informed Consent Statement

Not applicable.

Data Availability Statement

No new data were created or analyzed in this study. Data sharing is not applicable to this article.

Conflicts of Interest

The authors declare no conflict of interest. They also declare no financial or personal relationships with other people or organizations that could inappropriately bias the results presented in this manuscript.

References

  1. The State Council. The People’s Republic of China. Seventh National Census Key Data; The State Council: Beijing, China, 2021. Available online: http://www.gov.cn/xinwen/2021-05/11/content_5605871.htm (accessed on 11 May 2021).
  2. China National Committee on Ageing. A Compilation of Research Reports on the Development of Data from the Fourth China Rural and Urban Sample Survey on the Living Conditions of the Elderly; Hualing Press: Beijing, China, 2018. [Google Scholar]
  3. Ding, J.D.; Guo, L. Research Report on the Development of Elderly Services in China; Huazhong University of Science and Technology Press: Wuhan, China, 2019. [Google Scholar]
  4. China Social Security Society. Report on the Development of Elderly Care Services in China; China Labor and Social Security Press: Beijing, China, 2021. [Google Scholar]
  5. Wang, D.; Qiao, C.; Liu, S.; Wang, C.; Yang, J.; Li, Y.; Huang, P. Assessment of Spatial Accessibility to Residential Care Facilities in 2020 in Guangzhou by Small-Scale Residential Community Data. Sustainability 2020, 12, 3169. [Google Scholar] [CrossRef]
  6. Wang, Z.; Wang, X.; Dong, Z.; Li, L.; Li, W.; Li, S. More Urban Elderly Care Facilities Should Be Placed in Densely Populated Areas for an Aging Wuhan of China. Land 2023, 12, 220. [Google Scholar] [CrossRef]
  7. Ma, H.; Wang, M.; Yang, B. Research on Urban Community Elderly Care Facility Based on Quality of Life by SEM: Cases Study of Three Types of Communities in Shenzhen, China. Sustainability 2022, 14, 9661. [Google Scholar]
  8. Higgs, G.; Langford, M.; Llewellyn, M. Towards an understanding of inequalities in accessing residential and nursing home provision: The role of geographical approaches. Health Soc. Care Community 2022, 30, 2218. [Google Scholar] [CrossRef]
  9. Gao, Y.; Li, Z. Optimization and Adjustment of Multilevel Medical Facilities for the Elderly from the Perspective of Accessibility. J. Urban Plan. Dev. 2022, 148, 05022011. [Google Scholar] [CrossRef]
  10. You, N. Assessing equity of the spatial distribution of primary health care facilities in Fuzhou City, China: A comprehensive method. PLoS ONE 2021, 16, e0261256. [Google Scholar] [CrossRef]
  11. Yu, Y.; Wu, Y.; Xu, X.; Chen, Y.; Tian, X.; Wang, L.; Chen, S. Spatial Disparities and Correlated Variables of Community Care Facility Accessibility in Rural Areas of China. Sustainability 2021, 13, 13400. [Google Scholar] [CrossRef]
  12. Vrabková, I.; Ertingerová, I.; Kukuliač, P. Determination of gaps in the spatial accessibility of nursing services for persons over the age of 65 with lowered self-sufficiency: Evidence from the Czech Republic. PLoS ONE 2021, 16, e0244991. [Google Scholar] [CrossRef] [PubMed]
  13. Zhou, R.; Zhuang, R.; Huang, C. Pattern evolution and formative mechanism of aging in China. Acta Geogr. Sin. 2019, 74, 2163–2177. [Google Scholar]
  14. Stentzel, U.; Bahr, J.; Fredrich, D.; Piegsa, J.; Hoffmann, W.; Berg, N. Is there an association between spatial accessibility of outpatient care and utilization? Analysis of gynecological and general care. BMC Health Serv. Res. 2018, 18, 322. [Google Scholar] [CrossRef]
  15. Tao, Z.; Cheng, Y.; Dai, T. Measuring spatial accessibility to residential care facilities in Beijing. Prog. Geogr. 2014, 33, 616–624. [Google Scholar]
  16. Du, P.; Li, L. Long-term Trends Projection of China’s Population Aging in the New Era. J. Renmin Univ. China 2017, 1, 96–109. [Google Scholar]
  17. Wu, C.P. Study on “Aging in Place in Urban Communities” in China. J. Zhejiang Gongshang Univ. 2019, 3, 91. [Google Scholar]
  18. Calatayud, E.; Rodríguez-Roca, B.; Aresté, J.; Marcén-Román, Y.; Salavera, C.; Gómez-Soria, I. Functional Differences Found in the Elderly Living in the Community. Sustainability 2021, 13, 5945. [Google Scholar] [CrossRef]
  19. Camp, N.; Lewis, M.; Hunter, K.; Johnston, J.; Zecca, M.; Di Nuovo, A.; Magistro, D. Technology Used to Recognize Activities of Daily Living in Community-Dwelling Older Adults. Int. J. Environ. Res. Public Health 2021, 18, 163. [Google Scholar] [CrossRef] [PubMed]
  20. Diago-Galmés, A.; Guillamón-Escudero, C.; Tenías-Burillo, J.M.; Soriano, J.M.; Fernández-Garrido, J. Salivary Testosterone and Cortisol as Biomarkers for the Diagnosis of Sarcopenia and Sarcopenic Obesity in Community-Dwelling Older Adults. Biology 2021, 10, 93. [Google Scholar] [CrossRef]
  21. Guedes, T.S.R.; Guedes, M.B.O.G.; de Oliveira, H.K.M.; Soares, R.L.; da Cunha, V.L.; Lopes, J.M.; de Oliveira, N.P.D.; Jerez-Roig, J.; de Souza, D.L.B. Urinary Incontinence in Physically Active Older Women of Northeast Brazil. Int. J. Environ. Res. Public Health 2021, 18, 5878. [Google Scholar] [CrossRef]
  22. Ding, Y.; Chen, L.; Zhang, Z. The relationship between social participation and depressive symptoms among Chinese middle-aged and older adults: A cross-lagged panel analysis. Front. Public Health 2022, 10, 996606. [Google Scholar] [CrossRef]
  23. Ha, V.-A.T.; Nguyen, T.N.; Nguyen, T.X.; Nguyen, H.T.T.; Nguyen, T.T.H.; Nguyen, A.T.; Pham, T.; Vu, H.T.T. Prevalence and Factors Associated with Falls among Older Outpatients. International. J. Environ. Res. Public Health 2021, 18, 4041. [Google Scholar] [CrossRef]
  24. Hu, H.; Si, Y.; Li, B. Decomposing Inequality in Long-Term Care Need Among Older Adults with Chronic Diseases in China: A Life Course Perspective. Int. J. Environ. Res. Public Health 2020, 17, 2559. [Google Scholar] [CrossRef]
  25. Kim, D.; Ko, Y.; Jung, A. Longitudinal effects of exercise according to the World Health Organization guidelines on cognitive function in middle-aged and older adults. Front. Public Health 2022, 10, 1009775. [Google Scholar] [CrossRef] [PubMed]
  26. Zhao, Y.H.; Nie, Q. System for the Elderly—An Empirical Investigation Based on Six Cities’ Elderly Institutions. Sociol. Stud. 2022, 37, 164–179. [Google Scholar]
  27. Zhou, C.; Han, Z.Y.; Qian, Z.J. Government Support and the Development of Private Elderly Care Institutions under the Perspective of Active Aging—An Analysis Based on Dynamic Evolutionary Game. Contemp. Econ. Manag. 2022, 44, 73–81. [Google Scholar] [CrossRef]
  28. Cheng, M.; Cui, X. Research on Spatial Configuration of Residential Care Homes Based on Principles of Fairness and Efficiency: A Case Study of Minhang District in Shanghai City. Areal Res. Dev. 2022, 41, 43–48. [Google Scholar] [CrossRef]
  29. Cui, X.; Cheng, M.; Dun, S. A Game Analysis of Service Supply of Residential Care Facilities under the Background of Market-Oriented Reform. Oper. Res. Manag. Sci. 2022, 31, 61–67. [Google Scholar] [CrossRef]
  30. Wang, B.; Wu, J.L.; Cao, Y.X. Spatial Analyses of Bed Vacancy of Nursing Homes in Beijing. Popul. Dev. 2022, 28, 118–128. [Google Scholar]
  31. Li, Q.L.; Lu, Z.T. Research on the Logical Framework and Effectiveness of Labor Allocation in Nursing Institutions for the Aged: Investigation Evidences from 117 Institutions in Hubei Province. J. Jiangxi Univ. Financ. Econ. 2021, 4, 73–85. [Google Scholar]
  32. Doxiadis, C.A. Ekistics, the Science of Human Settlements. Science 1970, 3956, 393–404. [Google Scholar] [CrossRef] [Green Version]
  33. Doxiadis, C.A. Ekistics and Regional Science. Ekistics 1962, 84, 193–200. [Google Scholar] [CrossRef]
  34. Doxiadis, C.A. Man’s Movement and his City. Science 1968, 3851, 326–334. [Google Scholar] [CrossRef]
  35. Doxiadis, C.A. The Ancient Greek City and the City of the Present. Ekistics 1964, 108, 346–364. [Google Scholar]
  36. Wu, L.Y. Introduction to Sciences of Human Settlements; China Construction Industry Press: Beijing, China, 2001. [Google Scholar]
  37. Wu, L.Y. Search for the Theory of Science of Human Settlement. Planners 2001, 17, 5–8. [Google Scholar]
  38. Wu, L.Y. Science of Human Settlements. Urban Dev. Stud. 1996, 1, 1–5. [Google Scholar]
  39. Wu, L.Y. “Habitat II ”and the Science of Human Settlements. City Plan. Rev. 1997, 5, 4–9. [Google Scholar]
  40. Ning, Y.M.; Zha, Z.Q. The Study of Evaluation and Optimization for Human Settlement in the Metropolitan Areas: Take Shanghai as an Example. City Plan. Rev. 1999, 23, 15–20. [Google Scholar]
  41. Ning, Y.M.; Xiang, D.; Wei, L. Study on the Human Settlement Environment with Three Small Towns in the Shanghai Suburban Areas as the Case. City Plan. Rev. 2002, 26, 31–35. [Google Scholar]
  42. Li, C. Research on the Evaluation of Urban Habitat Environment from a Geographic Perspective; Shanghai People’s Publishing House: Shanghai, China, 2018. [Google Scholar]
  43. Li, C.; Wu, J.; Li, Y.; Huang, Y. Analysis of healthcare needs differences and influencing factors among elderly population: Evidence from Yangtze River Delta region, China. Front. Public Health 2022, 10, 949468. [Google Scholar] [CrossRef]
  44. Li, X.; Li, C.; Huang, Y. Spatial-temporal analysis of urban-rural differences in the development of elderly care institutions in China. Front. Public Health 2022, 10, 1086388. [Google Scholar] [CrossRef] [PubMed]
  45. Fan, F.; Dai, S.Z.; Yang, B. Urban density, directed technological change, and carbon intensity: An empirical study based on Chinese cities. Technol. Soc. 2023, 72, 1–17. [Google Scholar] [CrossRef]
  46. Dai, S.; Fan, F.; Zhang, K. Creative Destruction and Stock Price Informativeness in Emerging Economies; MPRA Working Paper: Munich, Germany, 2022; Available online: https://mpra.ub.uni-muenchen.de/113661/ (accessed on 13 October 2022).
  47. Wang, X.L.; Wang, L. The spatiotemporal evolution of COVID-19 in China and its impact on urban economic resilience. Chn. Econ. Rev. 2022, 74, 101806. [Google Scholar] [CrossRef]
  48. Hu, J.; Ma, C.; Li, C. Can Green Innovation Improve Regional Environmental Carrying Capacity? An Empirical Analysis from China. Int. J. Environ. Res. Public Health 2022, 19, 13034. [Google Scholar] [CrossRef] [PubMed]
  49. Fan, F.; Dai, S.Z.; Zhang, K.K. Innovation agglomeration and urban hierarchy: Evidence from Chinese cities. Appl. Econ. 2021, 53, 6300–6318. [Google Scholar] [CrossRef]
  50. Fan, F.; Zhang, X.R. Transformation effect of resource-based cities based on PSM-DID model: An empirical analysis from China. Environ. Impact Assess. Rev. 2021, 91, 106648. [Google Scholar] [CrossRef]
  51. Fan, F.; Zhang, X.Y.; Wang, X.L. Are there political cycles hidden inside collaborative innovation efficiency? An empirical study based on Chinese cities. Sci. Public Policy. 2022, 45, 101093005. [Google Scholar] [CrossRef]
  52. Wang, S.; Wang, J.X.; Wang, Y.X.; Wang, X.L. Spillover and Re-Spillover in China’s Collaborative Innovation. Int. Reg. Sci. Rev. 2023, 46, 38–68. [Google Scholar] [CrossRef]
  53. Li, C.; Zhang, L.; Gu, Q.; Guo, J.; Huang, Y. Spatio-Temporal Differentiation Characteristics and Urbanization Factors of Urban Household Carbon Emissions in China. Int. J. Environ. Res. Public Health 2022, 19, 4451. [Google Scholar] [CrossRef]
  54. Li, C.; Li, H.; Qin, X. Spatial Heterogeneity of Carbon Emissions and Its Influencing Factors in China: Evidence from 286 Prefecture-Level Cities. Int. J. Environ. Res. Public Health 2022, 19, 1226. [Google Scholar] [CrossRef]
  55. Li, C.; Shen, S.Y.; Meng, Z.M. Study on the Coupling and Coordination of Human Settlement System in Yangtze River Delta City Cluster. Shanghai Econ. 2018, 2, 59–71. [Google Scholar]
  56. Li, C. Comprehensive measurement of the level of “ Age-appropriateness “ in mega-cities and analysis of the influencing factors: Shanghai as an example. Urban Probl. 2021, 11, 4–18. [Google Scholar]
  57. Dang, J.W. The Coming of the Super-Ageing Society—Great Prospects for Humanity in the New Era of Longevity; Hua Ling Publishing House: Beijing, China, 2018. [Google Scholar]
  58. Dang, J.W. The Ageing Economy: A New Economic and Industrial Development Model for the Age of Longevity; CITIC Press Group: Beijing, China, 2022. [Google Scholar]
Figure 1. Small town human environment system structure.
Sustainability 15 03286 g001
Figure 2. Change in rural aged-care facility scores, 2010–2016.
Sustainability 15 03286 g002
Figure 3. Spatial and temporal patterns of composite scores for rural aged-care facilities, 2010–2016.
Sustainability 15 03286 g003
Figure 4. Regional differences in rural aged-care institutions, 2010–2016.
Sustainability 15 03286 g004
Figure 5. Coupling coordination of rural aged-care institutions, 2010–2016.
Sustainability 15 03286 g005
Figure 6. Sustainable development pathways for rural aged-care institutions.
Sustainability 15 03286 g006
Table 1. Average random consistency index.
n12345678910
RI000.580.901.121.241.321.411.461.49
Table 2. Classification of soft and hard environment coupling coordination degree of rural elderly institutions.
Coupling DegreeCoupling StageRepresentative ValuesCoupling CoordinationLevelsRepresentative Values
C = 0Minimal coupling-D = 0Incongruity-
0 < C ≤ 0.3Low-level couplingIdeal state value 0.250 < D ≤ 0.3Low-level coordinationIdeal state value 0.25
0.3 < C ≤ 0.5Antagonistic phaseIdeal state value 0.500.3 < D ≤ 0.5Moderate coordinationIdeal state value 0.50
0.5 < C ≤ 0.8Breaking-in phaseIdeal state value 0.750.5 < D ≤ 0.8Good coordinationIdeal state value 0.75
0.8 < C < 1High-level couplingIdeal state value 1.000.8 < D < 1High level of coordinationIdeal state value 1.00
C = 1Maximum couplingD = 1Extremely well coordinated
Table 3. Secondary indicator judgement matrix and consistency test.
IndicatorsB1B2B3Weights
B11.00000.88001.15000.3347
B21.13641.00000.88000.3333
B30.86961.13641.00000.3320
Consistency testMaximum eigenvalue λmax = 3.017399, CI = 0.008699, RI = 0.58, CR = 0.014999 < 0.1
Table 4. Three-level indicator weights and consistency tests.
IndicatorsWeightsThree-Tier Indicator WeightsλmaxCI CR
C10.33790.11313.00770.00380.0066
C20.32930.1102
C30.33280.1114
C40.32400.10803.02900.01450.0250
C50.34280.1143
C60.33320.1111
C70.33600.11163.02730.01370.0236
C80.32490.1079
C90.33910.1126
Table 5. Composite score for rural aged-care institutions.
Regions2010201120122013201420152016
Northeastern Region0.10140.09560.10870.11300.13520.13430.1295
Eastern Region0.13780.12350.14120.15920.18790.18170.1866
Central Region0.12930.11490.11870.15150.14660.13390.1394
Western Region0.09160.08230.10770.11120.14970.13930.1360
Table 6. Hard environment scores for rural aged-care institutions.
Regions2010201120122013201420152016
Northeastern Region0.01350.01530.01390.01670.02790.02490.0230
Eastern Region0.03060.03150.02930.03000.05100.05040.0515
Central Region0.03370.03640.03250.02450.05060.04390.0435
Western Region0.01900.02110.01930.02270.03330.03080.0308
Table 7. Soft environment scores for rural aged-care institutions.
Regions2010201120122013201420152016
Northeastern Region0.04970.04010.05090.05440.05680.05170.0505
Eastern Region0.05090.04040.05210.04950.05710.04920.0493
Central Region0.04870.03610.04580.05690.04710.04330.0448
Western Region0.03690.02820.05150.04680.06550.05800.0526
Table 8. Rural aged-care institutions’ scores for clients served.
Regions2010201120122013201420152016
Northeastern Region0.03810.04030.04380.04190.05050.05770.0560
Eastern Region0.05630.05160.05980.07960.07980.08220.0858
Central Region0.04690.04240.04030.07010.04890.04670.0511
Western Region0.03570.03300.03690.04170.05090.05040.0526
Table 9. Ranking of rural elderly care institutions in China.
YearOverall ScoreEastern RegionCentral RegionWestern RegionNortheastern Region
2010Top 20%291871
Middle 60%43484530
Bottom 20%1411282
2012Top 20%2512153
Middle 60%51523924
Bottom 20%1013266
2014Top 20%2813140
Middle 60%47435026
Bottom 20%1121167
2016Top 20%3010141
Middle 60%45474529
Bottom 20%1120213
Table 10. Composite score Theil index decomposition.
Comprehensive Score2010201120122013201420152016
Tdb0.0050.0060.0090.0040.0040.0050.003
Td0.0640.0590.0580.0470.0540.0620.063
Tz0.0290.0290.0270.0310.0370.0260.025
Tx0.0670.0670.0590.0360.0410.0470.044
TWR0.1650.1610.1530.1170.1360.1390.135
TBR0.0150.0130.0070.0130.0080.0100.012
Table 11. Decomposition of the hard environment Theil index.
Hard Environment2010201120122013201420152016
Tdb0.0140.0130.0150.0170.0190.0180.019
Td0.1330.1140.1110.1270.1440.1710.177
Tz0.0790.0810.0820.1450.1190.0930.103
Tx0.1700.1670.1650.1780.1590.1520.154
TWR0.3960.3750.3730.4670.4410.4350.453
TBR0.0440.0380.0370.0150.0260.0290.034
Table 12. Decomposition of the soft environment Theil index.
Soft Environment2010201120122013201420152016
Tdb0.0120.0110.0220.0120.0090.0090.009
Td0.0950.0860.0830.0650.0640.0640.069
Tz0.0340.0310.0390.0630.0360.0520.048
Tx0.0950.0860.0840.0550.0630.0870.076
TWR0.2360.2140.2280.1960.1720.2110.203
TBR0.0090.0100.0010.0030.0080.0060.002
Table 13. Decomposition of the Theil index for service users.
Elderly Served2010201120122013201420152016
Tdb0.0150.0170.0170.0100.0120.0140.009
Td0.0880.0880.0950.0800.0960.0970.092
Tz0.0550.0410.0430.0930.0580.0510.057
Tx0.0880.0800.0880.0520.0990.0840.088
TWR0.2460.2270.2420.2340.2650.2450.246
TBR0.0170.0150.0210.0390.0260.0300.029
Table 14. Changes in the coupling of rural aged-care institutions in the four regions of China.
Regions2010201120122013201420152016
Northeastern Region0.3530.4330.3430.4220.5450.5120.449
Eastern Region0.5010.5510.4940.4530.5670.5190.485
Central Region0.6270.7020.6400.3480.5940.5280.506
Western Region0.3600.3790.3450.3830.3020.3090.316
Table 15. Changes in the coupling of rural aged-care institutions in the four major regions of China.
Regions2010201120122013201420152016
Northeastern Region0.0980.1100.0990.1140.1460.1380.127
Eastern Region0.1390.1400.1400.1340.1680.1580.157
Central Region0.1570.1580.1510.0960.1560.1390.137
Western Region0.0840.0860.0890.0990.1030.0990.101
Table 16. Time series changes in evaluation indicators of elderly care institutions in rural areas (unit: units, 10,000 square meters, 10,000 beds, persons, days, %).
Rural2010201120122013201420152016
Number of elderly care institutions28,52029,10029,73622,52319,14415,08114,773
GFA of elderly care facilities3155438447983876336629633135
Number of beds at end of year209.21226.11244.68206.39209.72167.69168.06
Number of employees at end of year13.1914.2914.8914.3212.4210.4610.64
Proportion of university education9.0811.4610.5415.8514.1315.6116.79
Proportion of persons aged 35 and under20.0720.9020.7125.1524.5823.5521.49
Number of people in elderly care institution at the end of the year169.12179.12186.33137.47144.57106.71103.73
Proportion of semi-self-care persons13.3814.8314.6418.6217.1418.3019.24
Proportion of people who cannot care for themselves4.174.174.536.654.965.276.14
Disclaimer/Publisher’s Note: The statements, opinions and data contained in all publications are solely those of the individual author(s) and contributor(s) and not of MDPI and/or the editor(s). MDPI and/or the editor(s) disclaim responsibility for any injury to people or property resulting from any ideas, methods, instructions or products referred to in the content.

