Article

Life Cycle Assessment of Mortars with Fine Recycled Aggregates from Industrial Waste: Evaluation of Transports Impact in the Italian Context

Department of Construction, Civil Engineering and Architecture, Università Politecnica delle Marche, Via Brecce Bianche 12, 60131 Ancona, Italy
*
Author to whom correspondence should be addressed.
Sustainability 2023, 15(4), 3221; https://doi.org/10.3390/su15043221
Submission received: 9 January 2023 / Revised: 6 February 2023 / Accepted: 7 February 2023 / Published: 9 February 2023

Abstract

:
An LCA study (based on ISO 14040, ISO 14044, and EN 15804 + A2 standards) was performed to evaluate the environmental impacts of two mortars incorporating recycled materials (composite and carbon dust) from industrial waste as fine aggregates. They were compared to “reference” mortars, with the same strength performance, entirely composed of raw natural materials. The aim was to advance knowledge on the performance of mortars with composite materials, especially deepening the impact of the phase of materials’ transport on life-cycle behavior. In this regard, the work was conducted in three phases. Firstly, the LCA was performed in a specific “local” production scenario. Then, a sensitivity analysis was carried out to assess the influence of the uncertainty of input data on the variance of LCA outcomes. Considering the high sensitivity of results to transport distances, the LCA was finally extended considering several scenarios with increasing distances of aggregates’ transport. The results demonstrate that, for all of the eleven impact categories considered, mortars with recycled aggregates perform better than reference mortars, mainly due to the higher weight of natural aggregates. Even considering an extreme scenario, where natural aggregates are produced in the mortar factory (aggregates’ transport distances set to 0 km, for reference mortars), mortars with recycled aggregates are still convenient from an environmental point of view, if distances for providing industrial waste are lower than 200 km. The promotion of a circular economy perspective, with the settlement of a network of local recycled materials’ providers and users can then generate important environmental benefits.

1. Introduction

Today the environmental performance of products is very important for several industries, and especially for the Buildings and Construction (B&C) sector [1], considering that it requires vast amounts of resources and accounts for about 50% of all extracted material [2]. Only Italy has an annual waste production of about 175 million tons, 26.4% of which comes from the B&C sector [3].
In March 2020 the European Commission adopted the Circular Economy Action Plan (CEAP) [2] to promote circularity principles and to address the sustainability performance of construction products in the context of the revision of the Construction Product Regulation [4], including the possible introduction of recycled content requirements for certain products, considering their safety and functionality. The EU’s transition to a circular economy should reduce pressure on natural resources and create sustainable growth and jobs [2]. CEAP also aims to integrate the Life Cycle Assessment (LCA) into Green Public Procurement (GPP) [5].
Making different industries cooperate to introduce recycled content in construction materials is a possible solution for recycling and reutilizing wastes in from a circular economy viewpoint, avoiding landfill disposal. This is particularly true for mortars with recycled aggregates, which can still perform the same functions and have the same strength classes of the original ones made with raw materials [6,7].
The choice of the mix design of mortars is particularly important for the LCA [8], especially the choice of components to be, totally or partially, replaced with others entailing lower impacts [9,10] or with recycled or reused ones [11,12,13,14]. Different approaches can be used to reduce the environmental impacts of mortars, which involve the possibility of using substitutions for the binder, the aggregates, and even the additives.
In mortar mixtures, using Portland Cement, air lime, or natural hydraulic lime makes an important difference in terms of environmental impact [15]. The type, content, and strength class of the cement directly affect the environmental impact [15,16]. Portland Cement is the most widespread binder with the largest contribution to the Global Warming Potential [15]; for this reason several researchers investigated ways to replace it, for instance, with forest biomass ashes [6] or fly ash [17]. A recent study shows that geopolymers can be used as the binder in mortar mixtures with important environmental results, as their reaction is carried out at a moderate temperature [9].
Other researchers studied the possibility of incorporating waste materials into mortars as aggregates [6,17], considering that sand is the component that is present in the greatest quantities [7] in mortars Construction and demolitions waste (CDW) [11], ceramic [18,19], sanitary ware [6,20], glass fiber reinforced polymer [6,21], ornamental rocks [22], cork [18,23], and expanded polystyrene [24,25] have been incorporated into mortars as substitutes for sand, still achieving good technical performance in mortars.
Evaluation of the environmental behavior of mortars should be performed based on the well-established criteria of LCA [26,27,28] for identifying the impacts through the entire life cycle of the material [1,10,29]. However, when analyzing mortars with recycled aggregates, research has shown the importance of considering and evaluating the environmental benefits, in relation to the avoided disposal of recycled materials, to the transport from factory to landfill, and to saving natural resources and raw materials [30].
Braz et al. conducted an LCA of 19 mortars obtained by replacing different percentages of cement and/or sand with waste materials, using a reference mortar for comparison, all belonging to the same strength class [6]. Sixteen of 19 analyzed mortars showed better environmental performance than the reference one, according to all the impact categories considered. The three remaining mortars presented a greater ADP (fossil) impact, due to the high transport distance of wastes.
Diaz-Basteris et al. formulated 12 restoration mortars, using different binders and (calcareous and silica) sand typologies and substituting the regular additive with a recycled one obtained with waste glass powder and crushed bricks [15]. Results showed that Portland Cement and air lime CL90 binders were the constituents with the largest contribution to the analyzed environmental impact categories, and that transportation distance of raw materials was one of the main parameters affecting results [15].
These studies suggest that great care should be taken in assessing environmental impacts linked to transportation and to re-processing of secondary materials, as it is not guaranteed that mortars produced with recycled materials are always the most sustainable ones [12,14]. In particular, literature suggests that transportation may considerably influence the environmental performance of construction materials [17,30]; therefore, it should be deeply investigated according to the goal and scope of the study.
In this context, some studies analyze specific mortar production factories, thus considering the real distances between them and their suppliers: a different factory location affects distances as well as transport environmental impacts and overall results [6]. Göswein et al. [17] adopted a complex approach, linking LCA with geospatial analysis, to estimate transportation-related impacts. In this way, different mixtures were assessed for the specific factory location, finding that the transportation impact of each mix highly varied depending on the factory location and on the construction site; raw materials suppliers and surrounding street networks were taken into consideration as well [17].
Other research examines different transport scenarios for raw and secondary materials suppliers [31]. For instance, the study by Turk et al. aimed to establish the limit in delivery distance of recycled aggregate, to determine at what point recycled scenarios show no benefit over the conventional ones [30]. In the specific case studied, the sensitivity of transports demonstrated that long delivery distances (i.e., 100 km or more, one-way) would result in outweighing of the environmental benefits [30].
Based on this literature background, the contribution of the present study is twofold.
Firstly, it aims to evaluate the environmental performance of mortars that incorporate composite materials from industrial waste as fine aggregates. To the best of authors’ knowledge, the investigation of mortars incorporating recycled composite and carbon dust constitutes a novelty in the field of mixtures environmental performance assessment. Secondly, the research investigates the role of transports on the environmental performance of mortars with recycled aggregates, by performing both global sensitivity and scenarios analyses.
The paper is organized as follows. Section 2 presents the overall research framework, i.e., the phases of the research in terms of which different evaluation approaches to the impact of materials’ transport have been explored. Section 3, “Materials and Methods”, describes the investigated materials, i.e., the mortars with recycled aggregates and their corresponding reference mixtures, and it considers the methods of the LCA study in relation to the reference international standards. Section 4 reports the results of the study. Discussion of the study and its main conclusions can be found, respectively, in Section 5 and Section 6.

2. Research Framework

In this study, LCA is performed to evaluate the environmental impacts associated with mortars incorporating recycled composite aggregates, named “DELTA” and “HP”, compared to reference mortars (respectively, “REF1” and “REF2”) entirely composed of raw materials and with the same performance strength (see Section 3.1 “Materials”).
The research involves the following three deepening steps to especially evaluate the impact of transport stages on the overall environmental performance ( better described in the following sub-sections): (I) An LCA of mortars considering a “local” scenario of a real mortars production company; (II) a global sensitivity analysis based on a stochastic LCA approach, to evaluate the impact of data input uncertainties on the LCA outcomes; (III) an LCA of mortars considering different transport scenarios with increasing distances. The LCA methodology followed in the three phases is reported in Section 3.2.

2.1. Phase 1–LCA Analysis–Local Scenario

In this phase, a specific mortar factory, located in Serra San Quirico (Ancona, Italy), is considered. The factory also produces the natural aggregate (sand) used in the mortars. In this scenario, the actual distances between the suppliers of raw materials and the company are assumed, always considering transport on trucks and one-way delivery distances.
Furthermore, the distance between the factory and the construction site (module A4, see Section 3.3.4) is set at specific values, considering two alternative scenarios: 50 km (scenario A) and 500 km (scenario B). For mortars with recycled aggregates, to evaluate the benefits of nonoccurrence of landfill disposal, the actual distance between recycled waste composites factories and their closest landfill are also considered. All distances for materials transports in this phase are reported in Table 1.

2.2. Phase 2–Sensitivity Analysis

To account for the inherent LCA outcomes’ uncertainties due to input data, Monte-Carlo (MC) methods are applied to the LCA models for uncertainty propagation [32,33,34,35]. The resulting outputs of the assessments take the form of probability distributions (PDF) of environmental indicators. Sensitivity Analysis (SA) can then be performed to assess the contribution of input assumptions on these output distributions.
In general, the uncertainty characterization of input parameters entails data collection based on literature and commercial databases (see Section 3.3).
A quantitative approach, based on parameter estimation techniques and goodness-of-fit tests, is used to fit distributions of the distances between natural/recycled aggregates delivery and the mortar factory. Firstly, companies producing mortars in Italy (with a revenue of over 3 million €) are identified. Then, all the one-way delivery distances between the two factories that produce wastes and the identified mortar factories are measured. Finally, from these data, two normal distributions are obtained, representing the distance between waste composite materials suppliers and production sites in Italy.
Concerning natural sand transport, a uniform distribution is obtained for the distance between sand suppliers and mortar factories (from 50 km to 500 km).
The methodology is implemented in R (ver. 4.1.3), an open-source programming language and software environment for statistical computing and graphics [36].
The distributions of the other LCA input data are retrieved from the ecoinvent database v.3, where the uncertainty of the unitary environmental impact for LCI background data is quantified by using the qualitative assessment of data quality indicators based on the pedigree matrix approach [37].
For each LCA, MC analysis is then performed using SimaPro software v9.1.0 (10,000 runs) and a data-fitting procedure is followed to identify and characterize the outcomes’ PDF.
Finally, in order to evaluate the effective influence of the uncertainties on materials transports, an SA through a variance-based decomposition technique (Sobol’s method) is performed, thus relating outputs’ variances to inputs’ variances [38]. Two sets of sensitivity indices are calculated for all input data. The “first-order” index (Si) represents the main contribution of each input factor to the output’s variance. The “total order” index (STi) measures the contribution to the output variance due to each input, including all variances caused by its interactions with any other input variables [26]. The higher the value of the sensitivity indices, the more influential are the related parameters’ uncertainty on the outcome.

2.3. Phase 3–Analysis of Alternative Scenarios of Transport

In this third phase, different transport scenarios are investigated, with increasing distances between natural/recycled aggregates industries and mortar factories (module A2). Six one-way delivery distance scenarios are considered: 0 km, 100 km, 200 km, 300 km, 400 km and 500 km, as reported in Table 2.
For HP mortar, which is composed of both sand and HP waste aggregates, we assumed that the mortar factory was halfway between sand factories and the HP Composite factory. Distances between cement and mortar factories, between waste aggregates factories and their closest landfills, and between factories and construction sites (scenario A and B) are set as in the local scenario of phase 1 (Table 1).

3. Materials and Methods

3.1. Materials

The LCAs are performed to compare the environmental performance of:
-
REF1 and DELTA mortar (compressive strength class 30 M [39]);
-
REF2 and HP mortar (compressive strength class 20 M),
whose detailed composition is reported in Table 3.
REF1 and REF2 are realized with fine sand, while DELTA and HP mortars are obtained by (totally or partially, respectively) replacing sand with fine aggregates from industrial composite waste, which allowed us to reach a certain plasticity and lightness to the mixtures.
DELTA mortar incorporates composite dust scraps produced by a sanitary industry during the process of sinks cutting. The dust is vacuumed and put in big bags. The composite material consists of acrylic resin (organic constituent) for 25.48 ± 0.58% and quartz sand for the remaining percentage. Ninety-eight percent of the particles are lower than 0.500 mm.
In HP mortar, sand is partially replaced with a composite material dust, consisting of epoxy resin and carbon, incorporated as a filler (particles lower than 0.500 mm), derived from industrial scraps of carbon fiber composite fragments.
The four analyzed mortars were mixed and tested in the laboratories of Università Politecnica delle Marche (Ancona, Italy).

3.2. Methods

3.2.1. Goal and Scope Definition

The goal of the LCAs in this study was the evaluation of the environmental impacts associated with DELTA and HP mortars, which involved the use of recycled composite materials as aggregates that are also compared with reference mortars (respectively, REF1 and REF2), entirely composed of raw materials. LCAs are performed referring to international standards ISO 14,040 [27], ISO 14,044 [26] and EN 15,804 + A2 [40], and to Product Category Rules PCR 2019: 14–Construction products [41], considering attributional modelling.

3.2.2. Declared Unit

The declared unit of the study refers to a liter of mortar mixture within a certain compressive strength class. In particular, according to EN 988-2 [39] and EN 15,804 + A2 [40], the declared units are:
-
1 L of mortar mixture of 32 MPa compressive strength (compressive strength class M30), for REF1 and DELTA mortars.
-
1 L of mortar mixture of 25 MPa compressive strength (compressive strength class M20), for REF2 and HP mortars.

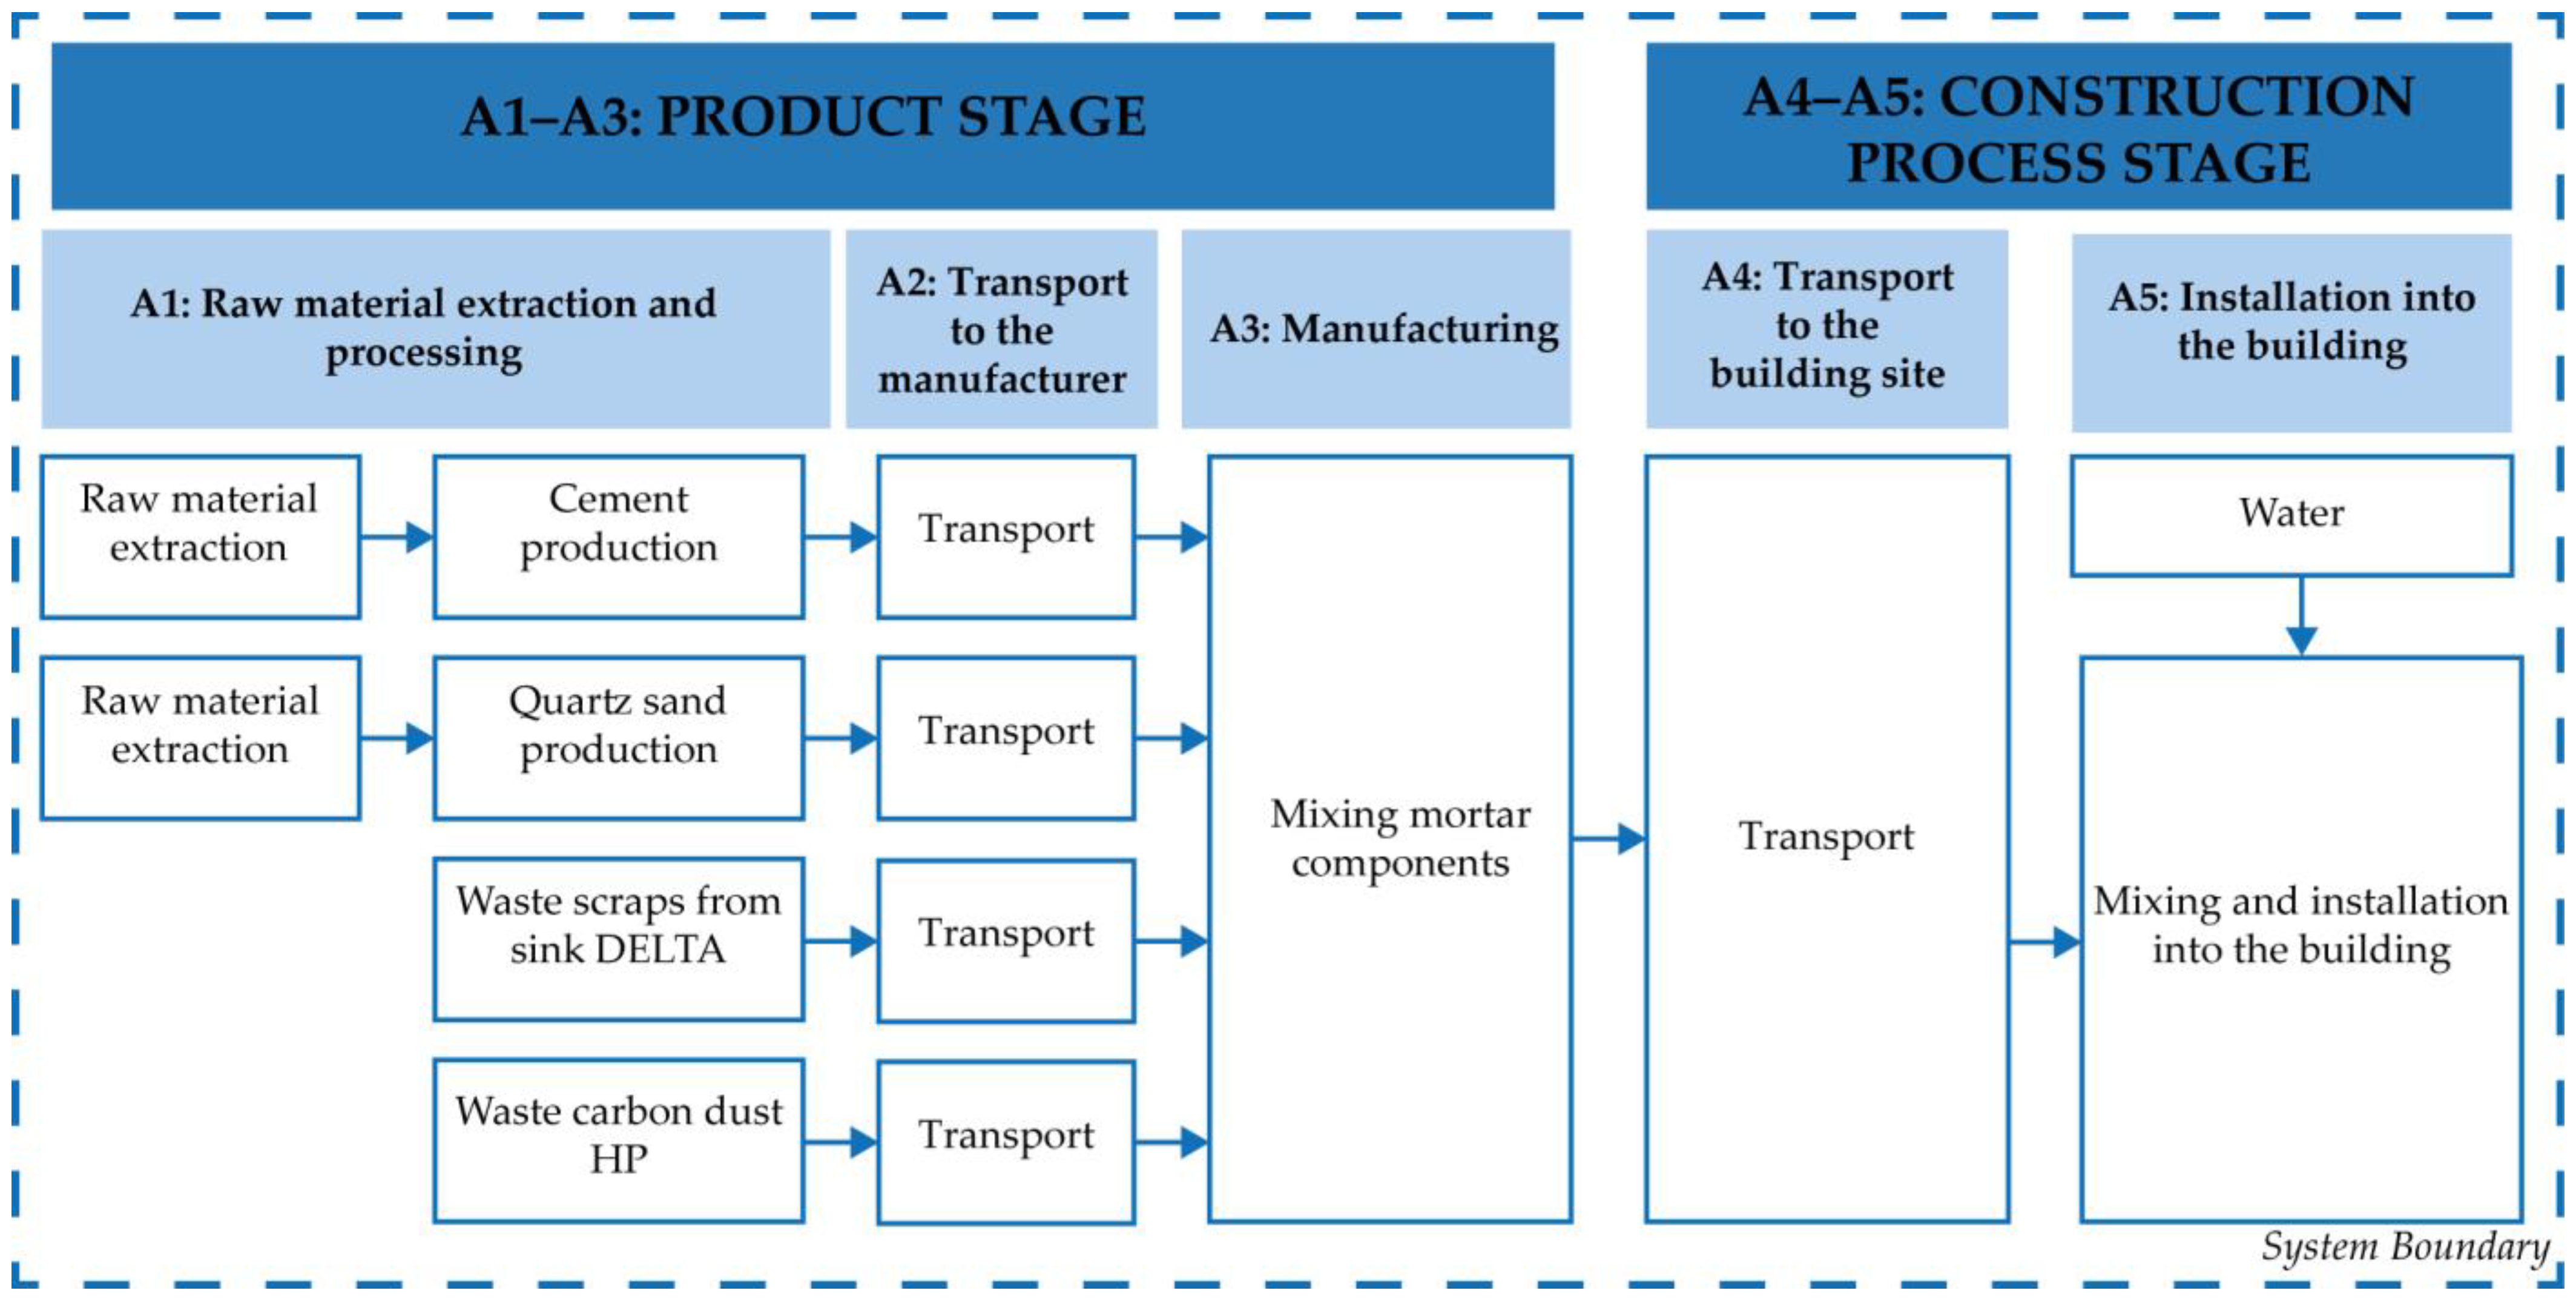
3.2.3. System Boundary

The system boundary is “cradle to gate” and includes modules of product stage (A1–A3) and construction process stage (A4–A5), as schematically represented in Figure 1.

3.2.4. Environmental Impact Categories

According to the reference standards, the analyzed impact categories are: Climate change (total) (GWP-total), Ozone Depletion (ODP), Acidification (AP), Eutrophication aquatic freshwater (EP- freshwater), Eutrophication aquatic marine (EP-marine), Eutrophication terrestrial (EP–terrestrial), Photochemical ozone formation (POCP), Depletion of abiotic resources–minerals and metals (ADP–Minerals and Metals), Depletion of abiotic resources–fossil fuels (ADP–fossil). In addition, the calculation of energy resources follows the Cumulative Energy Demand (CED) method [42], providing the impacts categories: Use of Non-Renewable Primary Energy Resources (PE-NRe) and Use of Renewable Primary Energy Resources (PE-Re) [40,42].

3.2.5. LCA Assumptions and Limitations

The main assumptions and limitations of the LCA performed in this study are the following:
-
According to the cut-off criteria of EN 15,804 + A2 [40], no additives are included in the LCA analyses because they never exceed 5% of total mass.
-
For processes modeling, secondary (generic) data are retrieved from the internationally recognized databases ecoinvent v.3 and ELCD (European Platform on LCA).
-
The factories producing waste used as aggregates are considered in their real locations.
-
No environmental impacts are associated with sieving processes.
-
The transports distance is always considered to be one-way delivering.
-
Concerning transport distances from the gate to the site (A4), two assessment scenarios are assumed: 50 km (scenario A) and 500 km (scenario B).

3.3. Life Cycle Inventory

All the industrial processes necessary to the effective production of mortars are taken into account. No multifunctional processes have been considered; hence it was not necessary to apply allocation criteria. Table 4 summaries the processes used for the life cycle inventory (LCI) of mortars and the reference databases. Details on processes are reported in next sections.

3.3.1. Raw Material Extraction and Processing (A1)

LCI data for cement (CEM II/A-LL 42.5 R) and sand (Sand 0/2) belong to a generic dataset available in SimaPro. The secondary waste composite materials (DELTA and HP) are incorporated into mortars after crushing (Rock Crushing, module A3), which takes place directly in the mortar factory, where the waste arrives without any previous treatment. The environmental impacts for DELTA and HP waste production are not included in the assessments, for several reasons: They are associated with the products originating them; they are not produced with the purpose of being incorporated into mortars; they would otherwise be destined for landfills.

3.3.2. Transport (A2)

Materials arrive at the mortar factory via truck transport (Transport, freight, lorry, unspecified) and are directly stored upon reaching the factory. Transport processes are calculated by multiplying the weight of each material for the kilometers (kg × km), and the distance is always considered a one-way delivery.
As already described in Section 2, materials transport distances were established according to a “local” scenario in Phase 1 (Table 1), while after studying the sensitivity and influence of transports on LCA results in Phase 2, transports distances then refers to several scenarios in Phase 3 (Table 2).

3.3.3. Manufacturing (A3)

Mortars manufacturing process starts when raw and secondary materials arrive at the mortar factory. DELTA and HP waste materials are crushed and sieved in the mortar factory. While environmental impacts associated with the sieving process are neglected, the crushing process is included (Rock Crushing).
Raw materials are mechanically mixed, in the right proportions, by an industrial mixer (Industrial machine, heavy, unspecified), then placed in bags (Packing, cement) made of kraft paper with a layer of high-density polyethylene. Bags are then stacked on pallets and stored in a reserved area inside the factory. Everything is transported inside the factory using conveyor belts (Conveyor belt). For the entire production process, a medium voltage electricity equal to 0.0278 kWh is assumed (Electricity, medium voltage).

3.3.4. Transport from the Gate to the Site (A4)

As already explained in Section 2.1, two assessment scenarios are assumed: 50 km (scenario A) and 500 km (scenario B).

3.3.5. Assembly (A5)

The application of mortars in buildings include energy use for mixing and water use for hydration. The consumption of electricity for mixing is assumed as 0.0278 kWh/l: the equivalent of using a 1500-Watt mortar mixer for 3 min.

3.3.6. Benefits of Uncollected Wastes

The nonoccurrence of disposal of DELTA and HP waste materials is considered a negative contribution to environmental impact and computed by summing the nonoccurrence of waste transport to landfill (Transport, freight, lorry, unspecified) and the nonoccurrence of landfill disposal (Waste plastic, mixture| treatment of waste plastic, mixture, sanitary landfill).

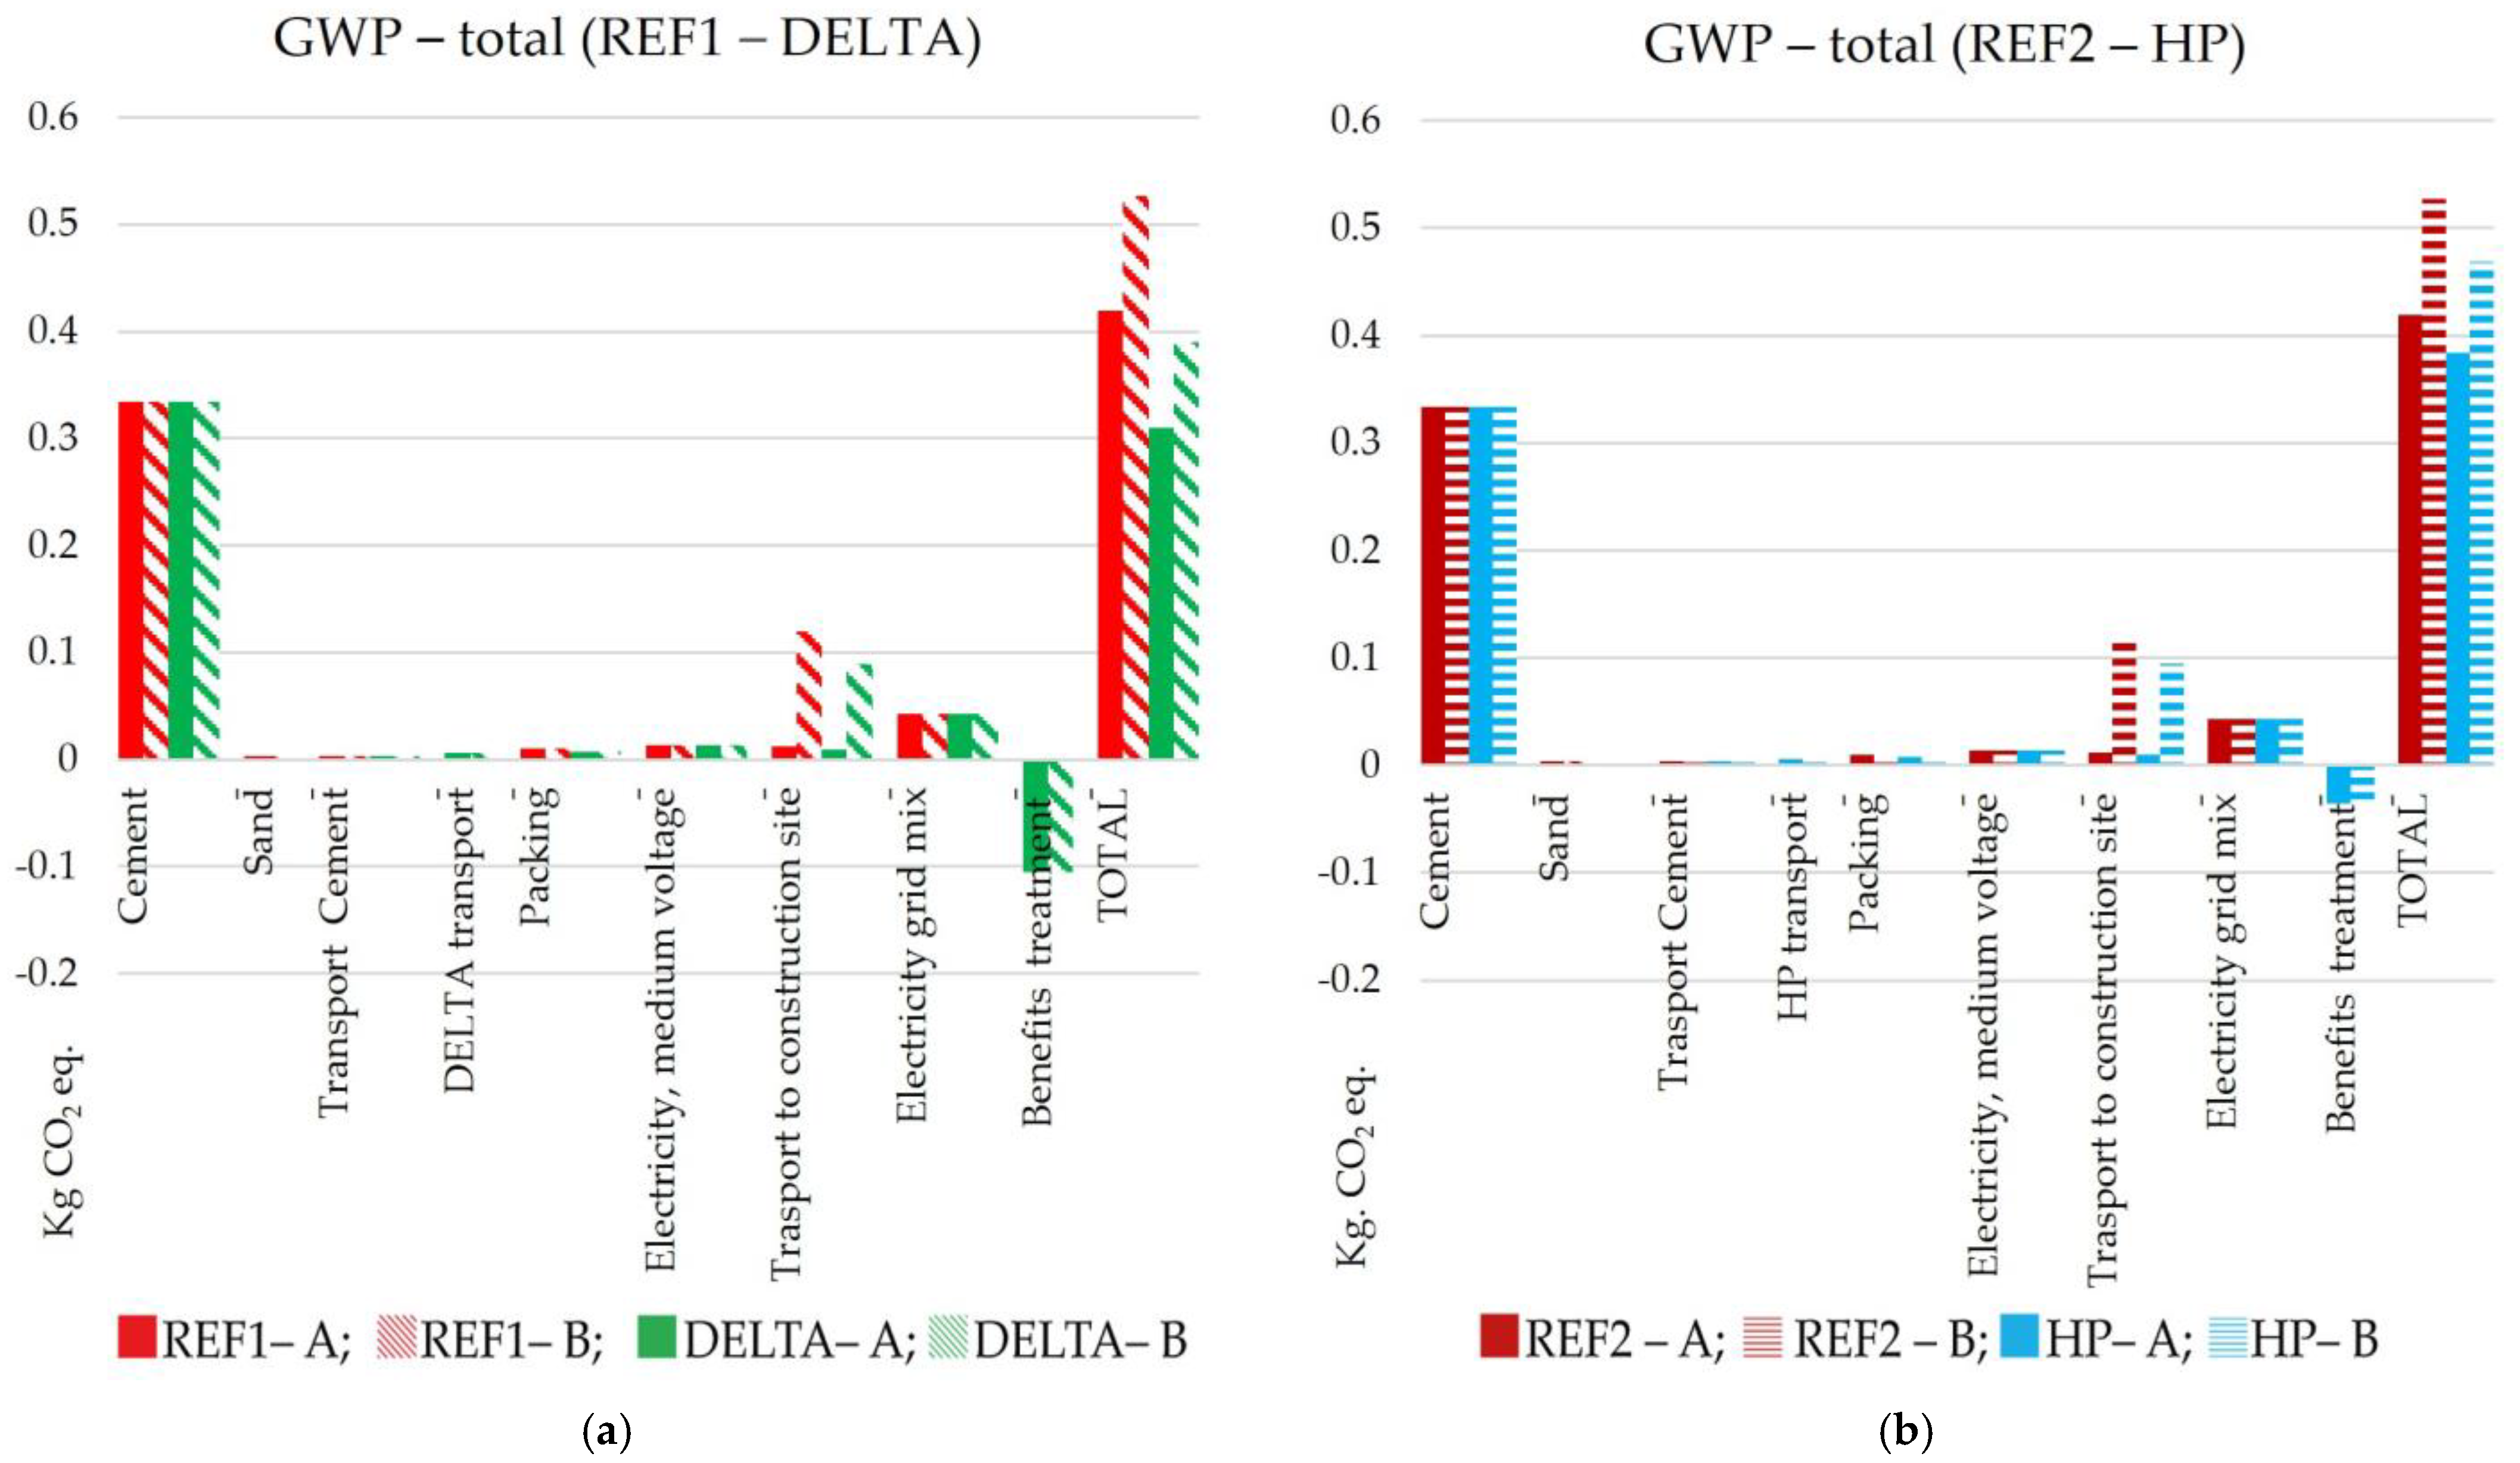
4. Results: Life Cycle Impact Assessment

4.1. Local Scenario

The comparison of Global Warming Potentials (GWP-total) in both scenarios (A and B) is shown in Figure 2a for REF1 and DELTA mortars and in Figure 2b for REF2 and HP mortars, also detailed at the material/process level. However, for the sake of representation clarity, results of processes related to the industrial machine, conveyor belt, tap water, rock crushing, and to benefits linked to nonoccurrence of transport to landfill of the wastes are not represented, as each of them affects total GWP by less than 0.6%.
In general, DELTA and HP mortars always result in better performance than their reference mortars made with raw materials (respectively, REF1 and REF2). The GWP of DELTA mortar is reduced by 26% compared to REF1 in both scenarios A and B, while HP mortar reduces GWP by 8% in scenario A and 11% in scenario B, compared to REF2.
The difference between results of scenarios A and B is due to the different transport distance of dry mortar from factory to construction sites. For REF1, REF2 and DELTA mortars, scenario B generates an increase in the production of GWP of +26% compared to scenario A; for HP the increase is +22%.
Cement production is the process that mostly affects the GWP of mortars, being responsible for more than 63% of the total GWP for all mixtures. The contribution related to benefits of nonoccurrence of landfill disposal is also significant: especially for DELTA mortar, which negatively affects GWP by 34% in scenario A and 27% in scenario B. However, the beneficial contribution of HP mortar is smaller (8% and 7% in A and B scenarios, respectively).
The LCA results related to the other examined environmental categories are presented in Supplementary Information SI-1. However, a summary of all impacts differences between mortars, in scenarios A and B, is shown in Table 5 for REF1 and DELTA mortars and in Table 6 for REF2 and HP mortars.
From the results reported in the tables, it appears that the environmental performance of DELTA mortar is always better than REF1 mortar, for every impact category and in both scenarios A and B. Albeit with smaller differences, also HP mortar shows a better environmental performance than REF2 mortar, except for ADP–minerals & metals, scenario A, where the performance is comparable (0.07% difference). In general, the performance difference between DELTA and REF1 mortar is more noticeable than that between HP and REF2, due to the total replacement of natural aggregates with recycled materials in DELTA mortar (versus a partial replacement in the HP mixture).
As better detailed in S1, in scenario A the incidence of cement is the most relevant for almost all the impact categories, and especially for: GWP (more than 80%), POPC (more than 76%), AP (more than 75%), EP-freshwater (more than 85%), EP-terrestrial (more than 79%), and ADP-Mineral & Metals (98%).
The incidence of transport from mortar factory to construction site becomes very relevant, or even the most influential, in B scenarios with the longest distance for some impact categories. For instance, for the ODP impact category, the impact related to the A4 module reaches 58% of the total impact for HP and REF2 mortars and 62% for HP and REF1 mortars.
For the PE-Re category, packing is the phase with the highest most impact, with a contribution to total impacts of between 41% and 49% for all mixtures and scenarios.
The contribution related to the benefits of nonoccurrence of landfill disposal is also significant, especially for some impact categories. In terms of EP-marine, the nonoccurrence of waste disposal even provides global environmental benefits.
The relevance of the incidence of transports suggests that the delivery distances are an important issue in LCA analysis. Hence this issue is further investigated in the next sections.

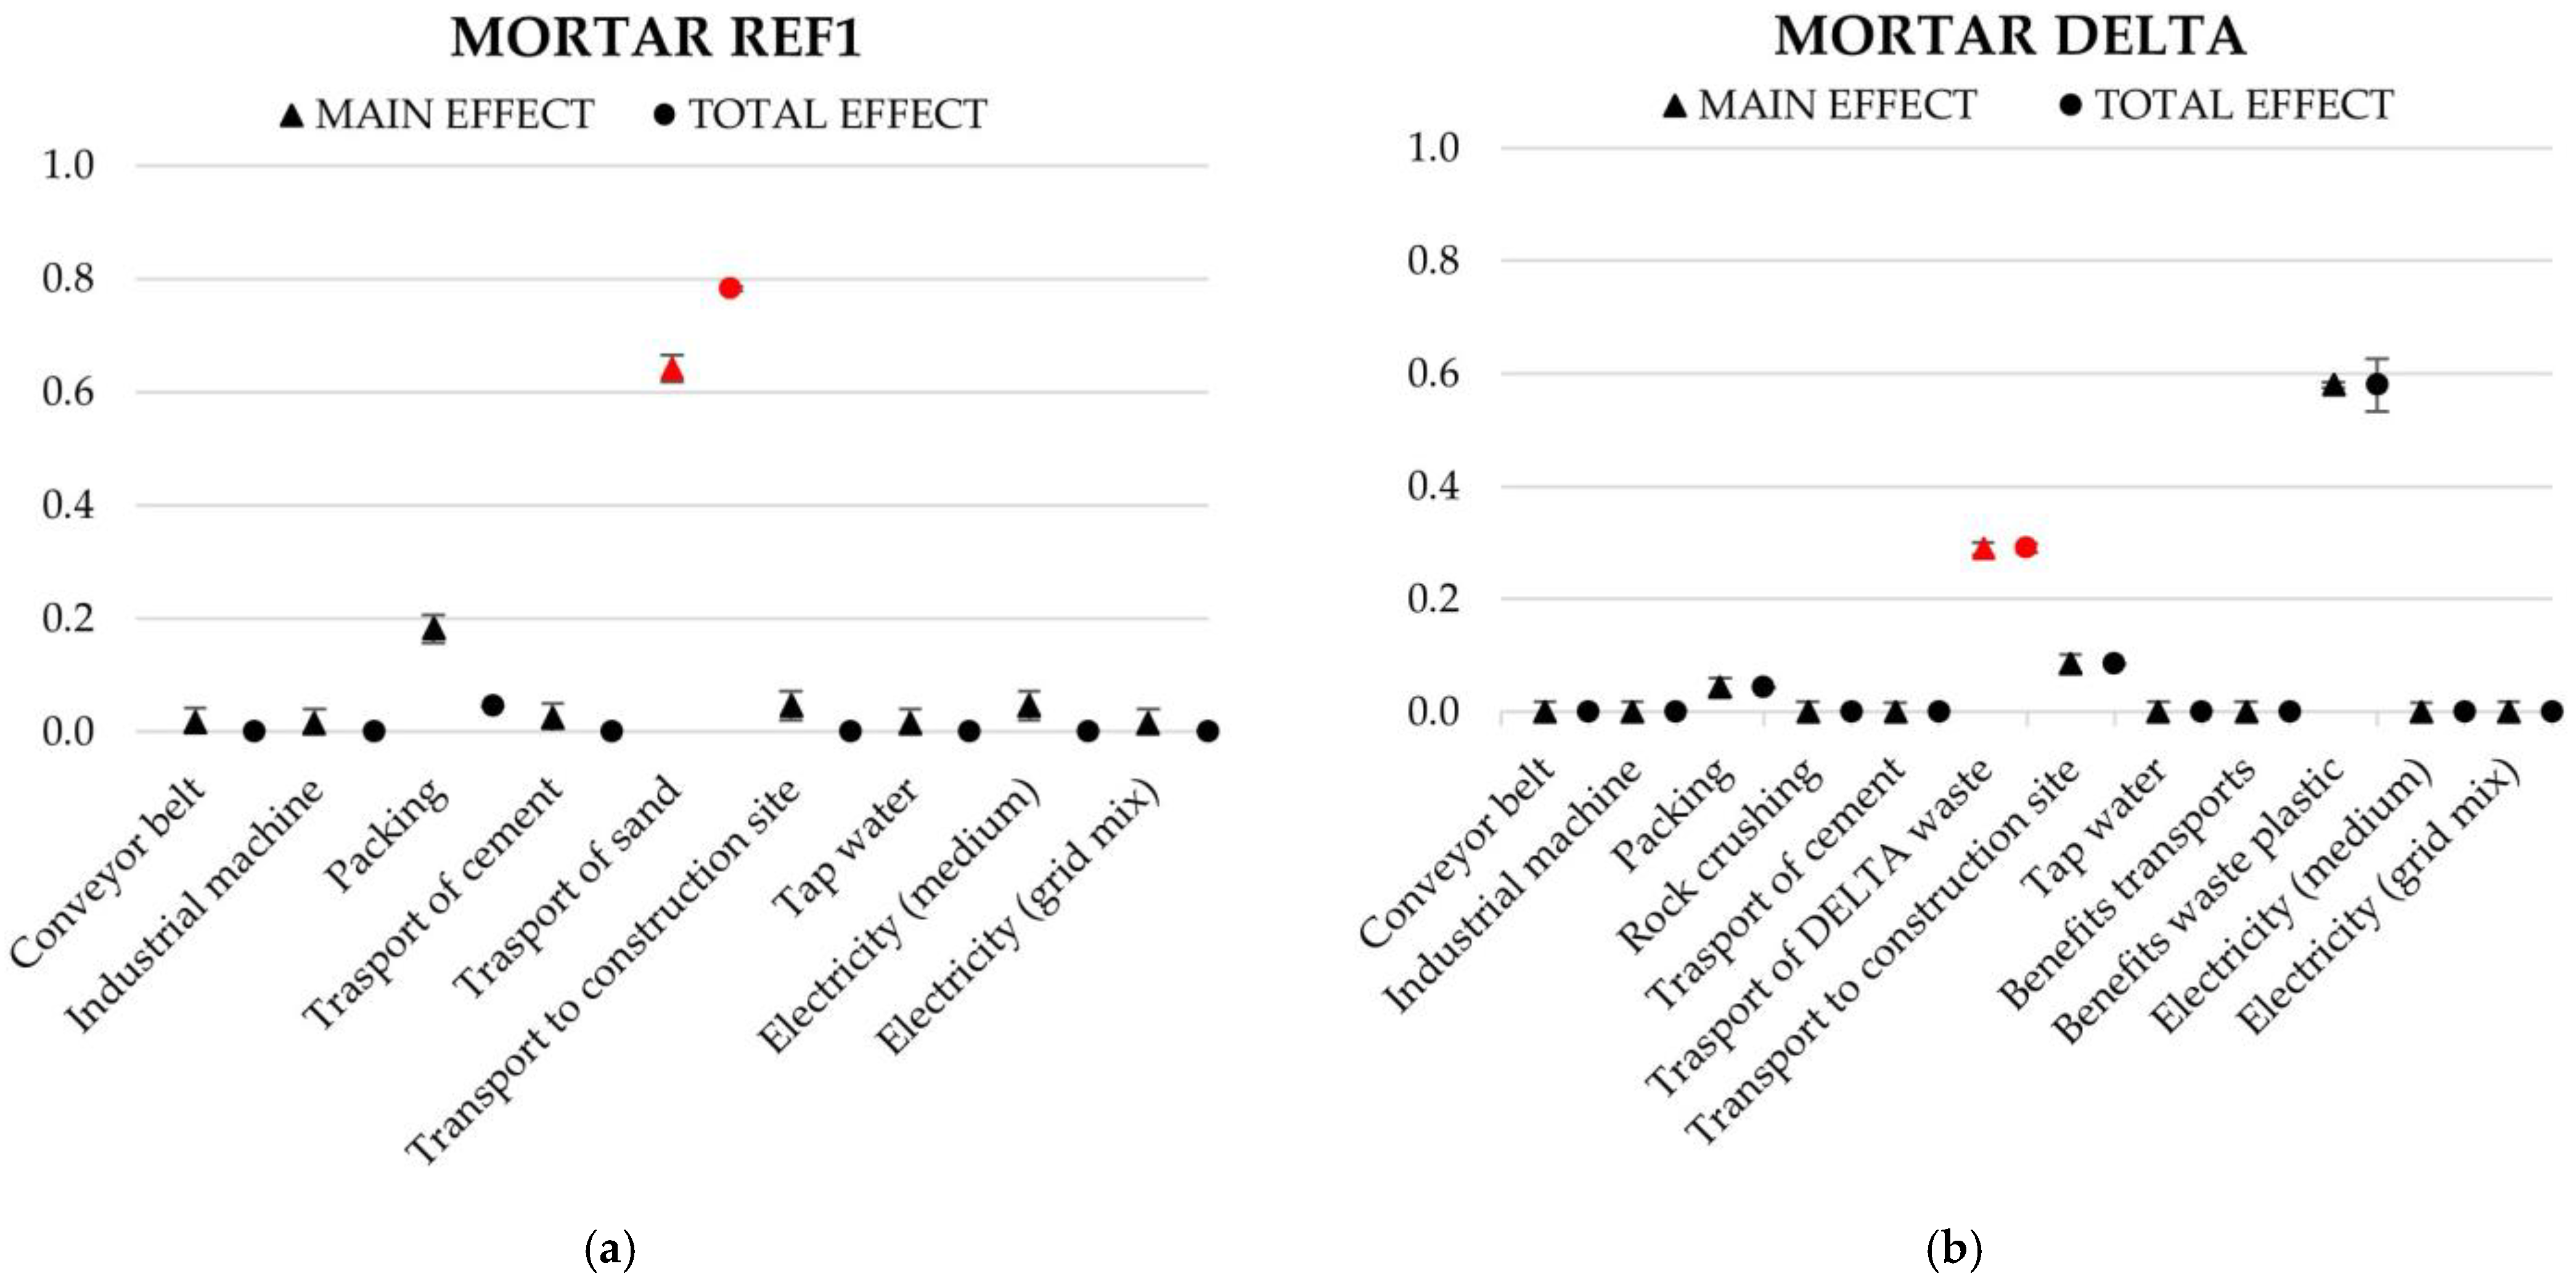
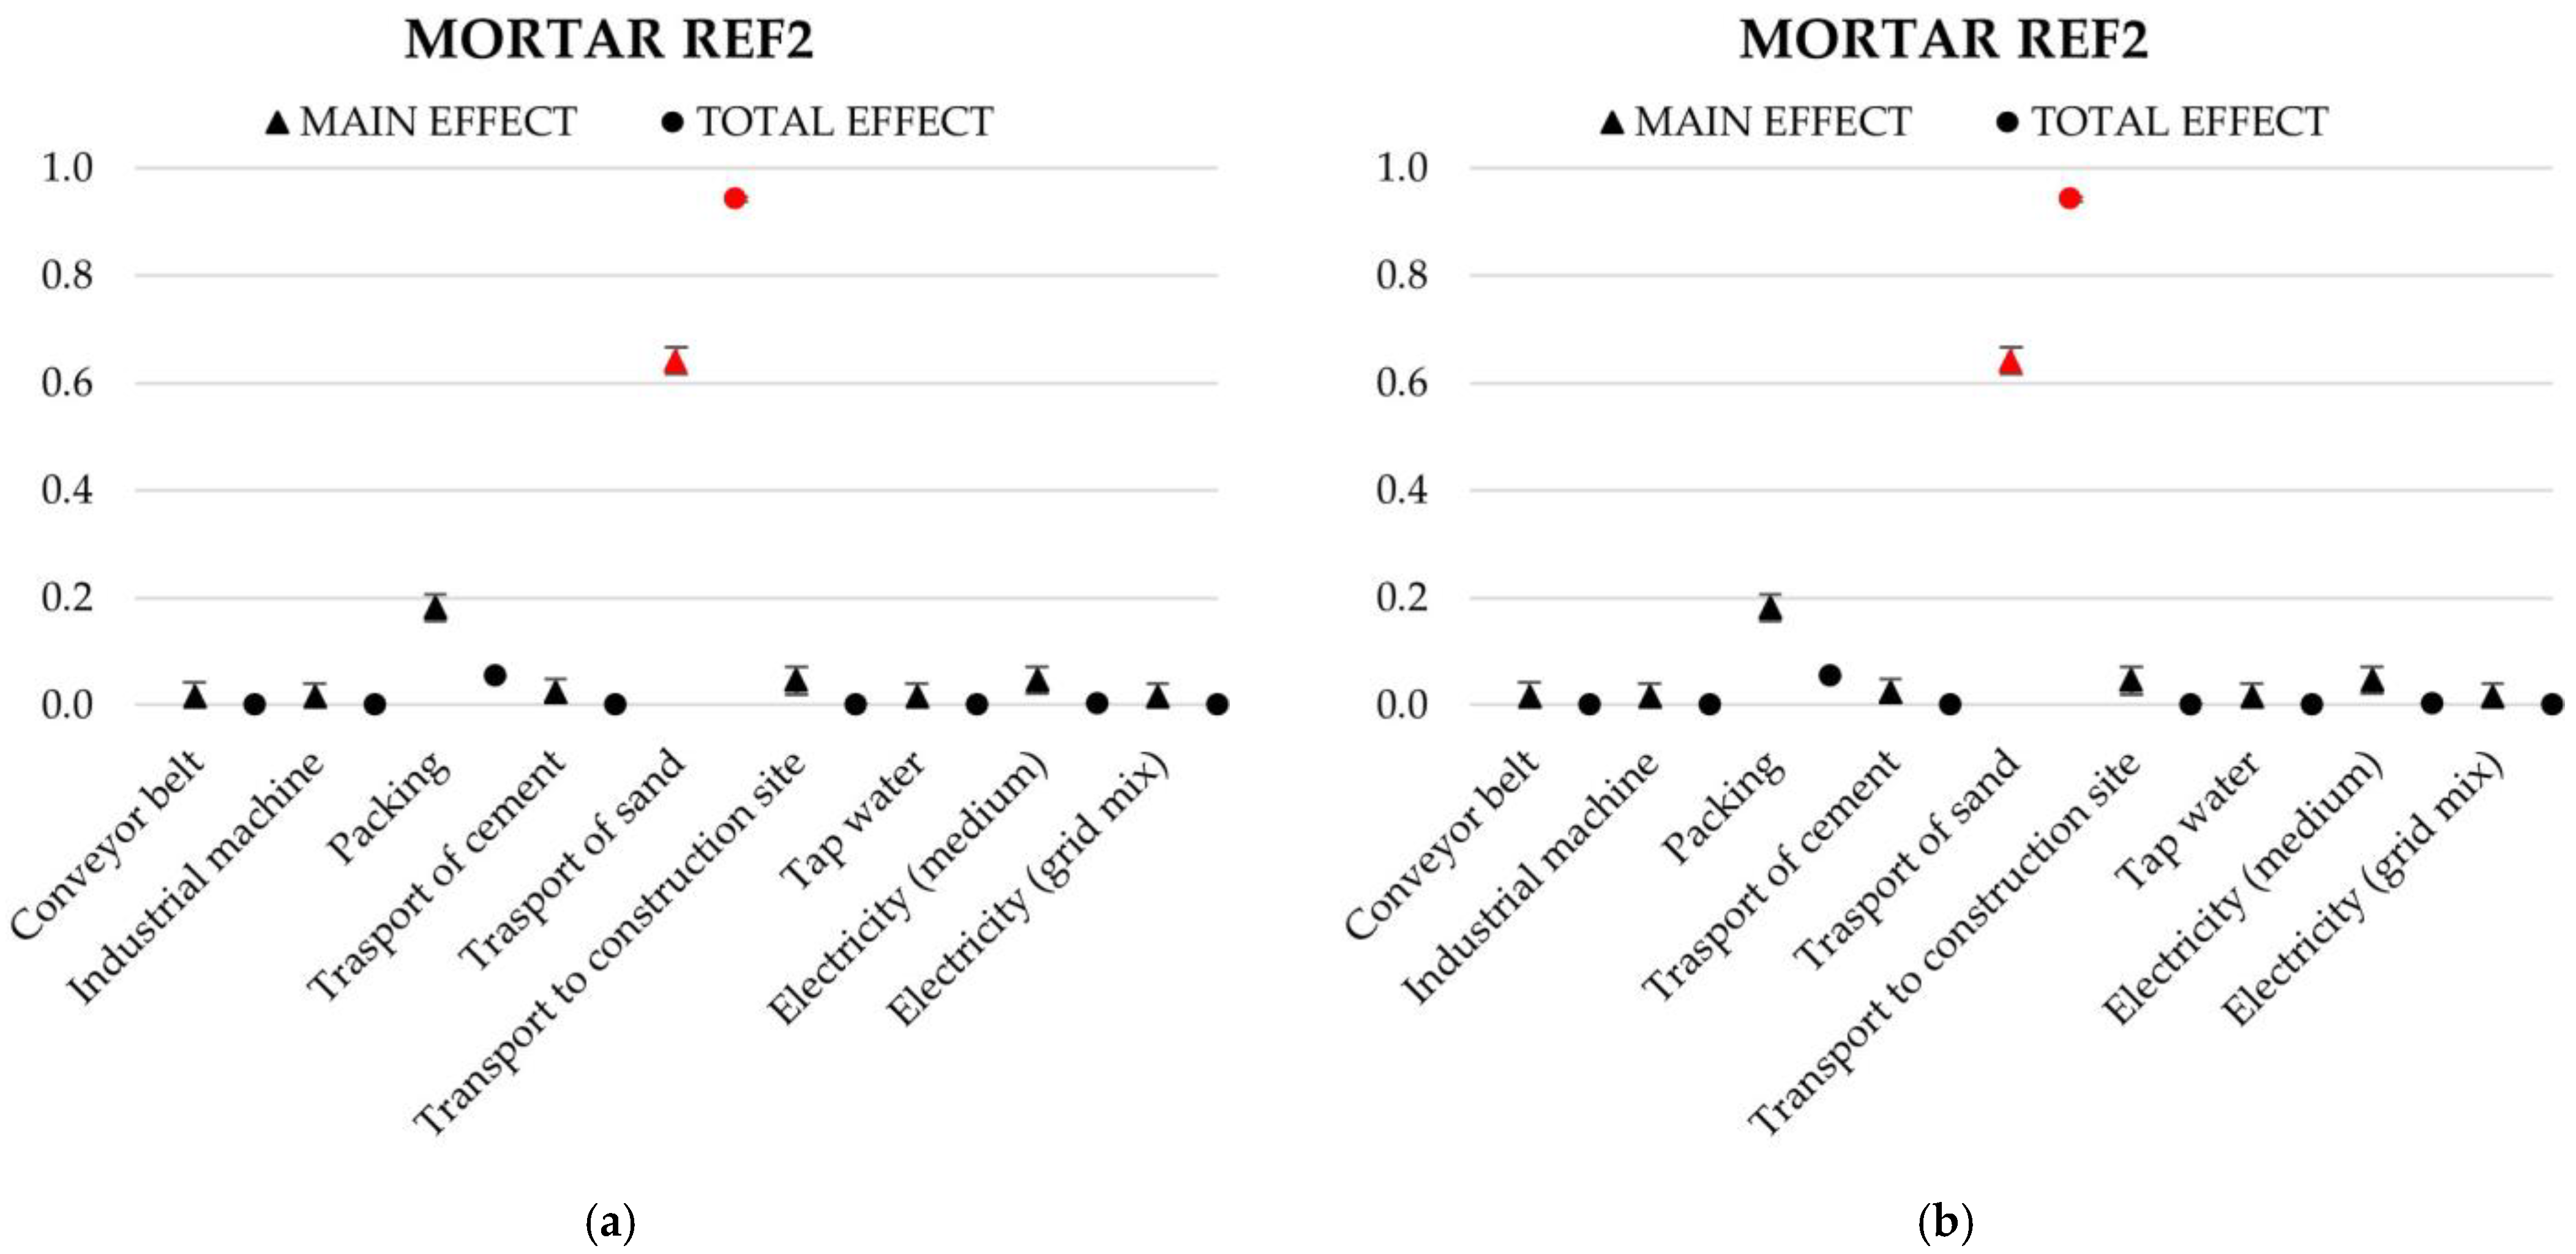
4.2. Sensitivity Analysis

As described in Section 2.2, a sensitivity analysis was performed to evaluate how the LCA inputs uncertainties affect the final outcomes distributions obtained through the MC method. The analysis is focused on GWP, then Table 7 summarizes the obtained distributions of kgCO2eq for all materials/processes for REF1 and DELTA mortars and Table 8 for REF2 and HP mortars.
As previously observed, including in this stochastic LCA, cement is the most impacting phase. The following Figure 3 and Figure 4 then represents the calculated sensitivity indices excluding cement, which is present in the same quantity in all the analyzed mortars. Transport of natural aggregate in mortar REF1 affects results uncertainty by 64% (main effect) and 78% (total effect); while transport of recycled aggregate DELTA affects them by 29% (both main and total effect). Even if the impact of benefits relating to non-occurrence of landfill disposal of DELTA waste is higher than the incidence of transport of DELTA waste (58%), it can be said that the transport of aggregates is a fundamental aspect that can influence the uncertainty of results.
Transport of natural aggregate in mortar REF2 affects results uncertainty by 64% (main effect) and 94% (total effect); while the transport of recycled aggregate HP affects them by 17% (main effect) and 3% (total effect). Moreover, in HP mortar, sand transport affects results uncertainty by 23% (main effect) and 6% (total effect). Even if the incidence of benefits relating to non-occurrence of landfill disposal of HP waste are also high (39% main effect, and 16% total effect), aggregates transport represents a fundamental issue influencing results.

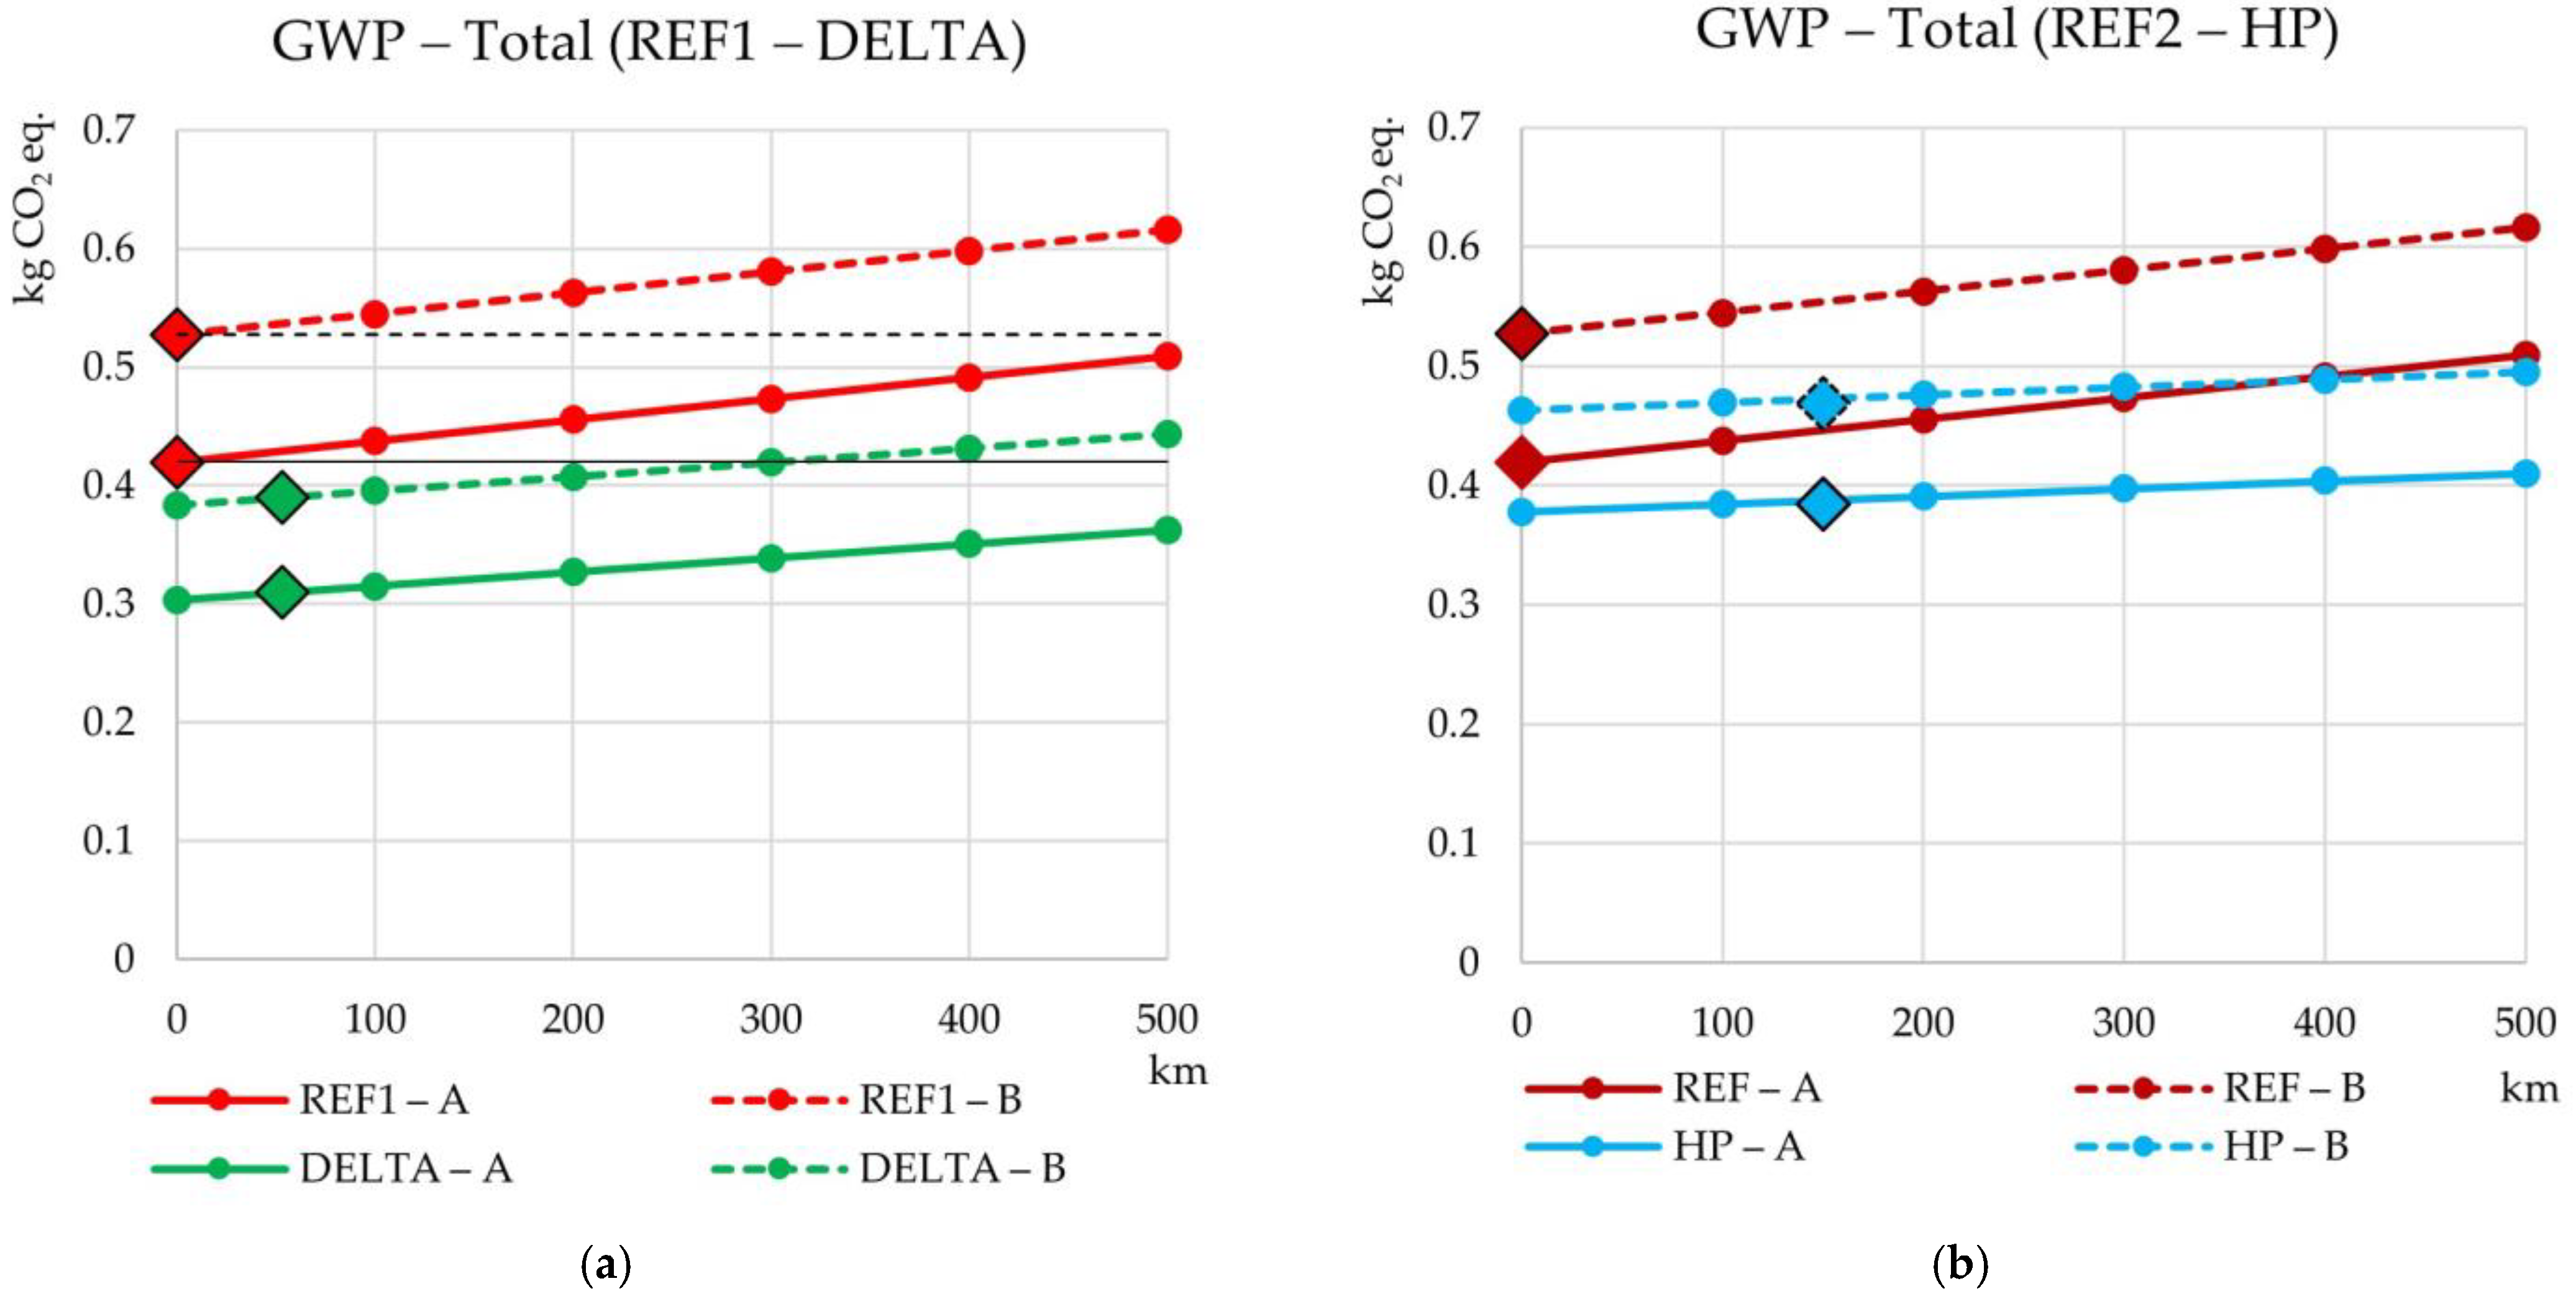
4.3. Impact of Transport Scenarios on LCA Results

As described in Section 2.3, in this phase of the study, the LCA performed for the “local” scenario is expanded, to calculate the impacts considering different transport scenarios entailing increasing distances between natural/recycled aggregates industries and mortar factories (module A2): 0 km, 100 km, 200 km, 300 km, 400 km and 500 km.
This section reports the GWP-total results for all mortars and transport scenarios, while results related to the other impact categories are included in SI-2 (Supplementary information S2).
Figure 5a shows GWP-total for REF1 and DELTA mortars, while Figure 5b for REF2 and HP mortars, through graphs in which the environmental impact (Y-axis) is a function of the delivery distance of aggregates (X-axis). The impact of the “local” scenario case (Section 4.1) is also reported in the graphs as a diamond shaped indicator, corresponding to the distances considered in that specific scenario.
As a general trend, as expected, the environmental impact increases with the increase of the delivery distance of aggregate transports. As previously stated, within the same transport scenario (A or B), and at the same distance of the natural/recycled aggregate to the mortar production factory (value in the X-axis), mortars with recycled aggregates (DELTA and HP) are always those with the lowest impact. Consequently, the lines slope of reference mortars (REF1 and REF2) is always higher than that of mortars with recycled aggregates. The reason is mainly in the weight of the aggregates themselves, being transports calculated in kg × km: In REF1 and REF2 mortars, natural aggregate weighs 1.35 kg, while in DELTA mortar there is only 0.90 kg of recycled aggregate, and in HP mortar the recycled carbon dust weighs only 0.974 kg.
From Figure 5a, it is also apparent that, for a same delivery distance, DELTA mortar always has a lower impact than REF1 mortar in both scenarios A and B: Actually, the impact of DELTA, scenario B, is even lower than that of REF1, scenario A. In contrast, from Figure 5b, at the same distance, the HP mortar in scenario A always has the lowest impact and REF2 mortar in scenario B always has the highest; however, the ”impact lines” of the HP mortar scenario B and REF2 mortar scenario A intersect.
Graphs in Figure 5a also report solid and dashed black lines, representing the limit in conditions where reference mortars, produced in the same place as natural aggregates (0 km scenarios), have the same impact as mortars with recycled aggregates delivered at higher distances. In other words, they represent the conditions where mortars with recycled aggregates are not convenient from an environmental point of view, as aggregates transports have high impacts (compared to the situation of natural aggregates produced in the same factories together with reference mortars). This convenience evaluation is only possible for DELTA mortar, which consists entirely of recycled aggregates, while it is unfeasible for HP mortar, which always half consists of natural aggregate.
In the case of GWP, it is convenient to use natural aggregates rather than recycled ones from the DELTA factory, only if the distance between mortar factories and the recycled aggregate factory is more than 978 km in scenario A (black solid line, Figure 5a) and more than 1203 km in scenario B (black dotted line, Figure 5a). These distance values are obtained by extrapolation, as higher than in the last computed 500 km distance scenario.
Concerning the other analyzed impact categories, detailed results are reported in S2. In general, for almost all of them (ODP, POCP, AP, EP-freshwater, EP-terrestrial, ADP-fossil, PE-NRe), the use of natural aggregate is convenient from an environmental point of view only with recycled aggregates distances over 172–276 km (DELTA, scenario A), 397–501 km (DELTA, scenario B). For ADP-Mineral & Metals, the distances of convenience are instead reduced by about one half.
Conversely, for EP-marine, the use of natural aggregate is never convenient from an environmental point of view, due to the significant benefits of the nonoccurrence of waste landfill disposal. In addition, for Pe-Re the recycled aggregate is always more convenient due the high convenience distance limit (over 2200 km).

5. Discussion

In this study, an LCA was performed to evaluate the environmental impacts of mortars made with recycled composite materials as aggregates (DELTA and HP mortars) including how it compared with reference mortars (REF1 and REF2) entirely composed of natural aggregates and with the same strength performance. The analysis was carried out in three phases, of which the following paragraphs report and discuss the main results obtained.
In the first phase, a specific “local” mortar factory, which also produces natural aggregates, was considered. The real distances between it and the suppliers of recycled aggregates have been assumed. In addition, the distance between the factory and the construction site (module A4) was set considering two alternative scenarios: 50 km (scenario A) and 500 km (scenario B).
For all impact categories, and for both scenarios A and B, DELTA and HP mortars always have better performance results than their reference mortars made with raw materials (respectively REF1 and REF2). These results are in line with those obtained in similar studies [6]. A higher impacts reduction is especially obtained for: EP-marine (up to 523%), GWP (up to 26%), ODP (up to 22%), POCP (up to 18%). The improvements are instead more marginal for other categories, such as: AP, EP-freshwater, PE-Re (up to 14%), ADP-fossil, EP-terrestrial, PE-NRe (up to 16%). For ADP-Mineral & Metals, the performances of all the mixtures are practically the same (variations below 3%), given that, in this category, the impact is mostly related to cement production, and considering that cement is present in all mixtures in the same quantity.
In general, the environmental benefits of using aggregates from industrial waste are more evident for DELTA mortar (in comparison with its reference REF1), rather than HP mortar (compared to REF2). This is due to the fact that in the DELTA mixture there is a total replacement of natural aggregates with recycled materials, while only a partial replacement happens in the HP mortar. In addition, the environmental benefits are more evident in scenario B, which requires higher transport distances from mortar factory to construction site and then generally higher impacts. Indeed, B scenarios entails much higher impacts than scenario A, especially for ODP (up to 136%), POCP (up to 65%), and EP-marine (up to 64%).
In scenario A, the incidence of cement is the most relevant for almost all the impact categories, while the incidence of transport from mortar factory to construction site becomes very relevant, or even most influential, in B scenarios for some impact categories (for instance ODP). The benefits of nonoccurrence of waste landfill disposal are especially significant for EP-marine, providing a total positive environmental balance.
In the second study phase, a stochastic approach is applied to LCA, in order to evaluate the impact of inputs’ uncertainty (especially that related to materials transports) on LCA outcome variance, through an SA based on Sobol’s method. The probability distributions of aggregates transport distances are set with a data fitting procedure based on real delivery distances in Italy. SA results demonstrate that variances on materials transport distances highly affect the outcome variance: A main effect of 78–94% is obtained for transport of natural aggregate in reference mortars; of 29% for transport of recycled aggregate DELTA; of 17% for HP mortar.
Given the high influence of transports variation on LCA outcome, a third study phase was performed, considering several transport scenarios with increasing distances between natural/recycled aggregates industries and mortar factories: 0 km, 100 km, 200 km, 300 km, 400 km and 500 km. As expected, for all the analyzed categories, the environmental impact increased with the increase of the delivery distance of aggregate transports. However, as in the “local” phase, at equal distance of natural/recycled aggregates to the mortar production factory, mortars with recycled aggregates are always best performing. In addition, as the distance increases, the environmental performance of the reference mortars proportionally deteriorates more rapidly than that of mortars with recycled aggregates, due to the higher weight of the natural aggregates themselves.
Finally, considering the case that in the mortar factory the natural aggregates are also produced (transport distance of 0 km for reference mortars), an environmental convenience limit has been calculated for DELTA mortar, in relation to waste aggregates transport distances. Results, in terms of GWP, demonstrate that it is convenient to use natural aggregates rather than recycled ones only if the distance between mortar factories and DELTA industry is more than 978 km in scenario A and more than 1203 km in scenario B. For almost all the other impact categories the use of natural aggregate is convenient only with recycled aggregates distances over 172–276 (scenario A) and 397–501 (scenario B). Conversely, for EP-marine, the use of natural aggregate is never convenient due to the significant benefits of nonoccurrence of waste landfill disposal due to the use of recycled aggregates.

6. Conclusions

An important area of application of the LCA methodology in the B&C sector is linked to the resources consumption, including materials. Indeed, while strategies for reducing energy consumption have been defined and implemented for decades, including through mandatory regulations, attention has only recently been focusing on the problem of raw materials consumption. The principles of the Circular Economy, aiming to close the circle in materials use, are in line with this need for an efficient use of resources and with a life cycle approach. Through recycling and reuse strategies, the Circular Economy aims to identify potential new resources in terms of secondary raw materials. In reality, however, principles of circularity are not always environmentally sustainable; thus an LCA verification is important to avoid distortions.
In the case study addressed by this research, general environmental benefits of using composite recycled aggregates for mortars are demonstrated, both for their lightweight features, which entail intrinsic lower environmental impacts, and for the nonoccurrence of landfill disposal. However, given the highlighted influence of materials transports on life-cycle performances, the environmental behavior should be verified in each specific case, considering the real distances of recycled materials factories.
In order to promote circularity principles and improve recycled mortars environmental performances, it is necessary to create market mechanisms regulated by the public sector, i.e., combined mechanisms of incentives for the use of recycled aggregates and disincentives for landfilling and withdrawal of virgin materials. In addition, various local industries should cooperate more and more, enlarging the network of possible secondary materials providers and users.

Supplementary Materials

The following supporting information can be downloaded at: https://www.mdpi.com/article/10.3390/su15043221/s1, Supplementary File S1: Local Scenario, Supplementary File S2: Transport scenarios.

Author Contributions

Conceptualization, M.D. and E.D.G.; Data curation, M.C.; Formal analysis, M.D., E.D.G. and M.C.; Funding acquisition, M.D.; Investigation, E.D.G.; Methodology, E.D.G.; Software, M.D. and M.C.; Validation, E.D.G.; Writing—original draft, E.D.G. and M.C.; Writing—review & editing, E.D.G. All authors have read and agreed to the published version of the manuscript.

Funding

This research was funded by POR MARCHE FESR 2014–2020-Asse 1-OS 2–Intervento 2.1.1 e Asse 8-OS 20-Azione 20.1-Intervento 20.1.1, grant number 154-18/06/2020.

Data Availability Statement

The data presented in this study are available in Supplementary Material.

Conflicts of Interest

The authors declare no conflict of interest.

References

  1. Colangelo, F.; Petrillo, A.; Cioffi, R.; Borrelli, C.; Forcina, A. Life Cycle Assessment of Recycled Concretes: A Case Study in Southern Italy. Sci. Total Environ. 2018, 615, 1506–1517. [Google Scholar] [CrossRef]
  2. European Commission, Communication from the Commission to the European Parliament, the Council, the European Economic and Social Committee and the Committee of the Regions, “Circular Economy Action Plan–For a Cleaner and More Competitive Europe”; COM(2020) 98 Final, Brussels, Belgium, 2020. Available online: https://eur-lex.europa.eu/legal-content/EN/ALL/?uri=COM:2020:98:FIN (accessed on 6 February 2023).
  3. Eurostat–Waste Database. Available online: https://ec.europa.eu/eurostat/waste (accessed on 31 January 2023).
  4. Regulation (EU) No 305/2011 of the European Parliament and of the Council of 9 March 2011 laying down harmonised conditions for the marketing of construction products and repealing Council Directive 89/106/EEC. Available online: https://eur-lex.europa.eu/legal-content/EN/TXT/?uri=CELEX:02011R0305-20140616 (accessed on 6 February 2023).
  5. European Green Public Procurement. Available online: https://ec.europa.eu/environment/gpp/index_en.htm (accessed on 6 February 2023).
  6. Farinha, C.B.; Silvestre, J.D.; de Brito, J.; Veiga, M.D.R. Life Cycle Assessment of Mortars with Incorporation of Industrial Wastes. Fibers 2019, 7, 59. [Google Scholar] [CrossRef]
  7. Santos, T.; Almeida, J.; Silvestre, J.D.; Faria, P. Life Cycle Assessment of Mortars: A Review on Technical Potential and Drawbacks. Constr. Build. Mater. 2021, 288, 123069. [Google Scholar] [CrossRef]
  8. Colangelo, F.; Forcina, A.; Farina, I.; Petrillo, A. Life Cycle Assessment (LCA) of Different Kinds of Concrete Containing Waste for Sustainable Construction. Buildings 2018, 8, 70. [Google Scholar] [CrossRef]
  9. Colangelo, F.; Farina, I.; Travaglioni, M.; Salzano, C.; Cioffi, R.; Petrillo, A. Eco-Efficient Industrial Waste Recycling for the Manufacturing of Fibre Reinforced Innovative Geopolymer Mortars: Integrated Waste Management and Green Product Development through LCA. J. Clean. Prod. 2021, 312, 127777. [Google Scholar] [CrossRef]
  10. Brás, A.; Gomes, V. LCA Implementation in the Selection of Thermal Enhanced Mortars for Energetic Rehabilitation of School Buildings. Energy Build. 2015, 92, 1–9. [Google Scholar] [CrossRef]
  11. Cuenca-Moyano, G.M.; Martín-Morales, M.; Bonoli, A.; Valverde-Palacios, I. Environmental Assessment of Masonry Mortars Made with Natural and Recycled Aggregates. Int. J. Life Cycle Assess. 2019, 24, 191–210. [Google Scholar] [CrossRef]
  12. Braga, A.M.; Silvestre, J.D.; de Brito, J. Compared Environmental and Economic Impact from Cradle to Gate of Concrete with Natural and Recycled Coarse Aggregates. J. Clean. Prod. 2017, 162, 529–543. [Google Scholar] [CrossRef]
  13. Jiménez, C.; Barra, M.; Josa, A.; Valls, S. LCA of Recycled and Conventional Concretes Designed Using the Equivalent Mortar Volume and Classic Methods. Constr. Build. Mater. 2015, 84, 245–252. [Google Scholar] [CrossRef]
  14. Blengini, G.A.; Garbarino, E. Resources and Waste Management in Turin (Italy): The Role of Recycled Aggregates in the Sustainable Supply Mix. J. Clean. Prod. 2010, 18, 1021–1030. [Google Scholar] [CrossRef]
  15. Diaz-Basteris, J.; Sacramento Rivero, J.C.; Menéndez, B. Life Cycle Assessment of Restoration Mortars and Binders. Constr. Build. Mater. 2022, 326, 126863. [Google Scholar] [CrossRef]
  16. Kurad, R.; Silvestre, J.D.; de Brito, J.; Ahmed, H. Effect of Incorporation of High Volume of Recycled Concrete Aggregates and Fly Ash on the Strength and Global Warming Potential of Concrete. J. Clean. Prod. 2017, 166, 485–502. [Google Scholar] [CrossRef]
  17. Göswein, V.; Gonçalves, A.B.; Silvestre, J.D.; Freire, F.; Habert, G.; Kurda, R. Transportation Matters–Does It? GIS-Based Comparative Environmental Assessment of Concrete Mixes with Cement, Fly Ash, Natural and Recycled Aggregates. Resour. Conserv. Recycl. 2018, 137, 1–10. [Google Scholar] [CrossRef]
  18. Moreira, A.; António, J.; Tadeu, A. Lightweight Screed Containing Cork Granules: Mechanical and Hygrothermal Characterization. Cem. Concr. Compos. 2014, 49, 1–8. [Google Scholar] [CrossRef]
  19. Matias, G.; Faria, P.; Torres, I. Lime Mortars with Ceramic Wastes: Characterization of Components and Their Influence on the Mechanical Behaviour. Constr. Build. Mater. 2014, 73, 523–534. [Google Scholar] [CrossRef]
  20. Farinha, C.; de Brito, J.; Veiga, R. Incorporation of Fine Sanitary Ware Aggregates in Coating Mortars. Constr. Build. Mater. 2015, 83, 194–206. [Google Scholar] [CrossRef]
  21. Farinha, C.B.; de Brito, J.; Veiga, R. Assessment of Glass Fibre Reinforced Polymer Waste Reuse as Filler in Mortars. J. Clean. Prod. 2019, 210, 1579–1594. [Google Scholar] [CrossRef]
  22. Rezende Leite, F.; Lúcia Pereira Antunes, M.; Aparecido Lopes Silva, D.; Cipriano Rangel, E.; Cristino da Cruz, N. An Ecodesign Method Application at the Experimental Stage of Construction Materials Development: A Case Study in the Production of Mortar Made with Ornamental Rock Wastes. Constr. Build. Mater. 2021, 293, 123505. [Google Scholar] [CrossRef]
  23. Tadeu, A.; Moreira, A.; António, J.; Simões, N.; Simões, I. Thermal Delay Provided by Floors Containing Layers That Incorporate Expanded Cork Granule Waste. Energy Build. 2014, 68, 611–619. [Google Scholar] [CrossRef]
  24. Prasittisopin, L.; Termkhajornkit, P.; Kim, Y.H. Review of Concrete with Expanded Polystyrene (EPS): Performance and Environmental Aspects. J. Clean. Prod. 2022, 366, 132919. [Google Scholar] [CrossRef]
  25. Zaragoza-Benzal, A.; Ferrández, D.; Atanes-Sánchez, E.; Saíz, P. Dissolved Recycled Expanded Polystyrene as Partial Replacement in Plaster Composites. J. Build. Eng. 2023, 65, 105697. [Google Scholar] [CrossRef]
  26. ISO 14044:2006; Environmental Management–Life Cycle Assessment–Requirements and Guidelines. ISO: Geneva, Switzerland, 2006.
  27. ISO 14040:2006; Environmental Management–Life Cycle Assessment–Principles and Framework. ISO: Geneva, Switzerland, 2006.
  28. EN 1504-3:2005; Products and Systems for the Protection and Repair of Concrete Structures—Definitions, Requirements, Quality Control and Evaluation of Conformity—Part 3: Structural and Non-Structural Repair. European Committee for Standardization (CEN): Brussels, Belgium, 2005.
  29. Guinée, J.B.; Heijungs, R.; Huppes, G.; Zamagni, A.; Masoni, P.; Buonamici, R.; Ekvall, T.; Rydberg, T. Life Cycle Assessment: Past, Present, and Future. Environ. Sci. Technol. 2011, 45, 90–96. [Google Scholar] [CrossRef]
  30. Turk, J.; Cotič, Z.; Mladenovič, A.; Šajna, A. Environmental Evaluation of Green Concretes versus Conventional Concrete by Means of LCA. Waste Manag. 2015, 45, 194–205. [Google Scholar] [CrossRef]
  31. Marinković, S.; Radonjanin, V.; Malešev, M.; Ignjatović, I. Comparative Environmental Assessment of Natural and Recycled Aggregate Concrete. Waste Manag. 2010, 30, 2255–2264. [Google Scholar] [CrossRef]
  32. Baldoni, E.; Coderoni, S.; di Giuseppe, E.; D’Orazio, M.; Esposti, R.; Maracchini, G. A Software Tool for a Stochastic Life Cycle Assessment and Costing of Buildings’ Energy Efficiency Measures. Sustainability 2021, 13, 7975. [Google Scholar] [CrossRef]
  33. Di Giuseppe, E.; D’Orazio, M.; Du, G.; Favi, C.; Lasvaux, S.; Maracchini, G.; Padey, P. A Stochastic Approach to LCA of Internal Insulation Solutions for Historic Buildings. Sustainability 2020, 12, 1535. [Google Scholar] [CrossRef]
  34. Favi, C.; Di Giuseppe, E.; D’Orazio, M.; Rossi, M.; Germani, M. Building Retrofit Measures and Design: A Probabilistic Approach for LCA. Sustainability 2018, 10, 3655. [Google Scholar] [CrossRef]
  35. Favi, C.; Meo, I.; Di Giuseppe, E.; Iannaccone, M.; D’Orazio, M.; Germani, M. Towards a Probabilistic Approach in LCA of Building Retrofit Measures. Energy Procedia 2017, 134, 394–403. [Google Scholar] [CrossRef]
  36. The R Project for Statistical Computing. Available online: http://www.r-project.org/ (accessed on 6 February 2023).
  37. Why Does the Ecoinvent Database Love the Lognormal Distribution? Available online: https://chris.mutel.org/ecoinvent-lognormal.html#:~:text=First%2C%20because%20the%20lognormal%20distribution,and%20crosses%20the%20zero%20line (accessed on 6 February 2023).
  38. Saltelli, A.; Ratto, M.; Andres, T.; Campolongo, F.; Jessica, G.; Gatelli, D.; Saisana, M.; Tarantola, S. Global Sensitivity Analysis: The Primer; Wiley: Chichester, UK, 2008; ISBN 978-0-470-05997-5. [Google Scholar]
  39. EN 998-2:2016; Specification for Mortar for Masonry—Part 2: Masonry Mortar. European Committee for Standardization (CEN): Brussels, Belgium, 2016.
  40. EN 15804:2012+A2:2019; Sustainability of Construction Works—Environmental Product Declarations—Core Rules for the Product Category of Construction Products. European Committee for Standardization (CEN): Brussels, Belgium, 2019.
  41. EPD International AB, PCR 2019:14 Construction Products, Version 1.11. 2021. Available online: https://portal.environdec.com/ (accessed on 6 February 2023).
  42. SimaPro Tutorial. Available online: https://pre-sustainability.com/legacy/download/SimaPro8Tutorial.pdf (accessed on 6 February 2023).
Figure 1. System Boundary of the LCA.
Sustainability 15 03221 g001
Figure 2. Global warming Potential (GWP–total) of: (a) REF1 and DELTA mortars; (b) REF2 and HP mortars.
Sustainability 15 03221 g002
Figure 3. Sensitivity analysis of all the processes involved in the life cycle of: (a) mortar REF1; (b) mortar DELTA.
Sustainability 15 03221 g003
Figure 4. Sensitivity analysis of all the processes involved in the life cycle of (a) mortar REF2; (b) mortar HP.
Sustainability 15 03221 g004
Figure 5. Global Warming Potential (GWP-total) in different scenarios of transport for: (a) mortars REF1 and DELTA; (b) mortars REF2 and HP.
Sustainability 15 03221 g005
Table 1. Distances for transports on trucks (kilometers), local scenario.
REF1/REF2DELTAHP
Scenario AScenario BScenario AScenario BScenario AScenario B
(km)(km)(km)(km)(km)(km)
Transport of cement606060606060
Transport of sand00--00
Transport of DELTA waste--5353--
Transport of HP waste----150150
Transport of mortar
to building site
505005050050500
Missed waste transport to landfill--202077
Table 2. One-way delivery distances of different transport scenarios (kilometers).
REF1/REF2DELTAHP
Scenario AScenario BScenario AScenario BScenario AScenario B
(km)(km)(km)(km)(km)(km)
Scenario 0REF–A0REF–B0DELTA–A0DELTA–B0HP–A0HP–B0
Transport of sand00--00
Transport of DELTA wastes--00--
Transport of HP wastes----00
Transport of mortar
to building site
505005050050500
Scenario 1REF–A1REF–B1DELTA–A1DELTA–B1HP–A1HP–B1
Transport of sand100100--5050
Transport of DELTA wastes--100100--
Transport of HP wastes----5050
Transport of mortar
to building site
505005050050500
Scenario 2REF–A2REF–B2DELTA–A2DELTA–B2HP–A2HP–B2
Transport of sand200200--100100
Transport of DELTA wastes--200200--
Transport of HP wastes----100100
Transport of mortar
to building site
505005050050500
Scenario 3REF–A3REF–B3DELTA–A3DELTA–B3HP–A3HP–B3
Transport of sand300300--150150
Transport of DELTA wastes--300300--
Transport of HP wastes----150150
Transport of mortar
to building site
505005050050500
Scenario 4REF–A4REF–B4DELTA–A4DELTA–B4HP–A4HP–B4
Transport of sand400400--200200
Transport of DELTA wastes--400400--
Transport of HP wastes----200200
Transport of mortar
to building site
505005050050500
Scenario 5REF–A5REF–B5DELTA–A5DELTA–B5HP–A5HP–B5
Transport of sand500500--250250
Transport of DELTA wastes--500500--
Transport of HP wastes----250250
Transport of mortar
to building site
505005050050500
Table 3. Composition of reference mortars (REF1 and REF2) and of mortars entailing industrial wastes (DELTA and HP). Dosages are shown in kg, referring to 1 L of mixture.
REF1DELTAREF2HP
Compressive strength32 MPa32 MPa25 MPa25 MPa
Compressive strength classM30M30M20M20
Volumetric mass2100 kg/m31700 kg/m32100 kg/m31600 kg/m3
Components(Kg)(Kg)(Kg)(Kg)
Water0.2800.2900.3000.290
Cement CEM II/A-LL 42,5 R0.4500.4500.4500.450
Sand 0/21.350-1.3500.675
Composite dust DELTA-0.900--
Carbon dust HP---0.300
Superplasticising admixture-0.010--
Table 4. Process included in Life Cycle Inventory.
DescriptionProcessDatabase
Known inputs from Technosphere (materials/fuels)
Cement CEM II/A-LL 42,5 RCement, limestone 6–20% [RoW], cement production, limestone 6–20%|APOS, UEcoinvent 3
Sand 0/2Sand 0/2, wet and dry quarry, production mix, at plant, undried RER SELCD 3.0
Industrial machineIndustrial machine, heavy, unspecified [RoW]|Market for industrial machine, heavy, unspecified|APOS, UEcoinvent 3
Conveyor beltConveyor belt [GLO]|market for|APOS, UEcoinvent 3
Rock Crushing of wastesRock Crushing (RER)|processing|APOS, UEcoinvent 3
PackingPacking, cement [GLO]|market for|APOS, UEcoinvent 3
TransportTransport, freight, lorry, unspecified [RER]|market for transport, freight, lorry, unspecified|APOS, UEcoinvent 3
Treatment of waste plastic in sanitary landfillWaste plastic, mixture {RoW}|treatment of waste plastic, mixture, sanitary landfill|APOS, UEcoinvent 3
Tap waterTap water (Eurpe without Switzerland)|market for|APOS, UEcoinvent 3
Known inputs from Technosphere (electricity/heat)
Electricity, medium voltageElectricity, medium voltage (IT)|market for|APOS, UEcoinvent 3
Electricity grid mixElectricity grid mix, AC, consumption mix, at consumer, 230 V IT SEcoinvent 3
Table 5. Environmental impacts difference between REF1 and DELTA mortars (in both scenarios A and B) and between scenarios A and B (within each mortar typology).
REF1–DELTA ComparisonScenario A–B Comparison
ABREF1DELTA
GWPkg CO2 eq.−26%−26%26%26%
ODPkg CFC11 eq.−18%−22%136%124%
POCPkg NMVOC eq.−13%−18%65%56%
APmol H + eq.−9%−14%46%38%
EP—freshwaterkg P eq.−9%−14%46%38%
EP—marinekg N eq.−523%−338%59%11%
EP—terrestrialmol N eq.−10%−16%59%49%
ADP—minerals & metalskg Sb eq.−0,50%−3%11%8%
ADP– fossilMJ−11%−16%60%51%
PE-NreMJ−11%−16%60%50%
PE-ReMJ−14%−14%6%5%
Table 6. Environmental impacts difference between REF2 and HP mortars (in both scenarios A and B) and between scenarios A and B (within each mortar typology).
REF2–HP ComparisonScenario A–B Comparison
ABREF2HP
GWPkg CO2 eq.−8%−11%26%22%
ODPkg CFC11 eq.−3%−13%136%111%
POCPkg NMVOC eq.−3%−10%65%54%
APmol H + eq.−3%−8%46%37%
EP—freshwaterkg P eq.−3%−8%46%37%
EP—marinekg N eq.−174%−117%59%64%
EP—terrestrialmol N eq.−2%−9%59%48%
ADP—minerals & metalskg Sb eq.+0,07%−2%11%8%
ADP—fossilMJ−3%−9%60%49%
PE-NreMJ−3%−9%60%49%
PE-ReMJ−11%−11%6%5%
Table 7. GWP distributions (kg CO2 eq) of materials/processes in REF1 and DELTA mortars LCA. SD = Standard Deviation.
REF1DELTA
DistributionMeanMedianSDDistributionMeanMedianSD
Cement, limestone 6–20%Lognormal0.332130.31031-Lognormal0.332130.31031-
Conveyor beltLognormal0.000040.00003-Lognormal0.000040.00003-
Industrial machineLognormal0.000010.00001-Lognormal0.000010.00001-
PackingNormal0.01045-0.005386Normal0.00736-0.00428
Rock crushing--- Lognormal0.000290.00029-
Transport of cementLognormal0.003570.00356-Lognormal0.003570.00356-
Transport of DELTA waste----Normal0.05035-0.02458
Transport to construction siteLognormal0.011920.01188-Lognormal0.008930.00890-
Tap WaterLognormal0.000100.00010-Normal0.00010-0.000004
Benefits transports- Normal−0.00238-0.00008
Benefits waste plastic- Normal−0.10558-0.05798
Electricity (medium)Lognormal0.013740.01374-Lognormal0.013740.01374-
Electricity (grid mix)Normal0.04277-0.00000Normal0.04277-0.00000
Sand-0.003330.00333-----
MinMax
Transport of sandUniform0.011400.08841-----
Table 8. GWP distributions (kg CO2 eq) of materials/processes in REF2 and HP mortars LCA. SD = Standard Deviation.
REF2HP
DistributionMeanMedianSDDistributionMeanMedianSD
Cement, limestone 6–20%Lognormal 0.3321340.310317-Lognormal 0.3321380.310317-
Conveyor beltLognormal 0.0000430.000034-Lognormal 0.0000430.000034-
Industrial machineLognormal 0.0000160.000013-Lognormal 0.0000160.000013-
PackingNormal0.010452-0.005386Normal0.007905-0.004381
Rock crushing----Lognormal 0.0000980.000098-
Transport of cementLognormal0.0035710.003560-Lognormal 0.0035710.003560-
Transport to construction siteLognormal0.0119230.011884-Lognormal 0.0094400.009430-
Tap WaterLognormal0.0001080.000108-Lognormal 0.0001440.000144-
Benefits transports----Normal−0.000278-0.000009
Benefits waste plastic----Normal−0.034873-0.019016
Electricity (medium)Lognormal0.0137410.0137410.001437Lognormal 0.0137410.013741-
Electricity (grid mix)Normal0.042770-0.000000Normal0.042770-0.000000
Sand-0.0033340.003334--0.0016690.001669-
Transport of HP waste----Normal0.018666-0.007674
MinMax MinMax
Transport of sandUniform 0.0114090.088415 Uniform 0.0052330.044020
Disclaimer/Publisher’s Note: The statements, opinions and data contained in all publications are solely those of the individual author(s) and contributor(s) and not of MDPI and/or the editor(s). MDPI and/or the editor(s) disclaim responsibility for any injury to people or property resulting from any ideas, methods, instructions or products referred to in the content.

