
Analysis of the Factors Affecting China’s Manufacturing Servitization from the Perspective of the Ecological Environment


Abstract
:1. Introduction
2. Analysis of the Factors Influencing MS
2.1. DPSIR Model
2.2. Construction of the EIS Based on DPSIR Model
2.2.1. Driving Force (D) Analysis
2.2.2. Pressure (P) Analysis
2.2.3. State (S) Analysis
2.2.4. Impact (I) Analysis
2.2.5. Response (R) Analysis
3. Methods and Processing
3.1. DEMATEL–ISM Method
3.2. Data Collection
3.2.1. Calculation of Comprehensive IM
3.2.2. Calculation of Reachability Matrix
4. Results and Discussion
4.1. Analysis of Results
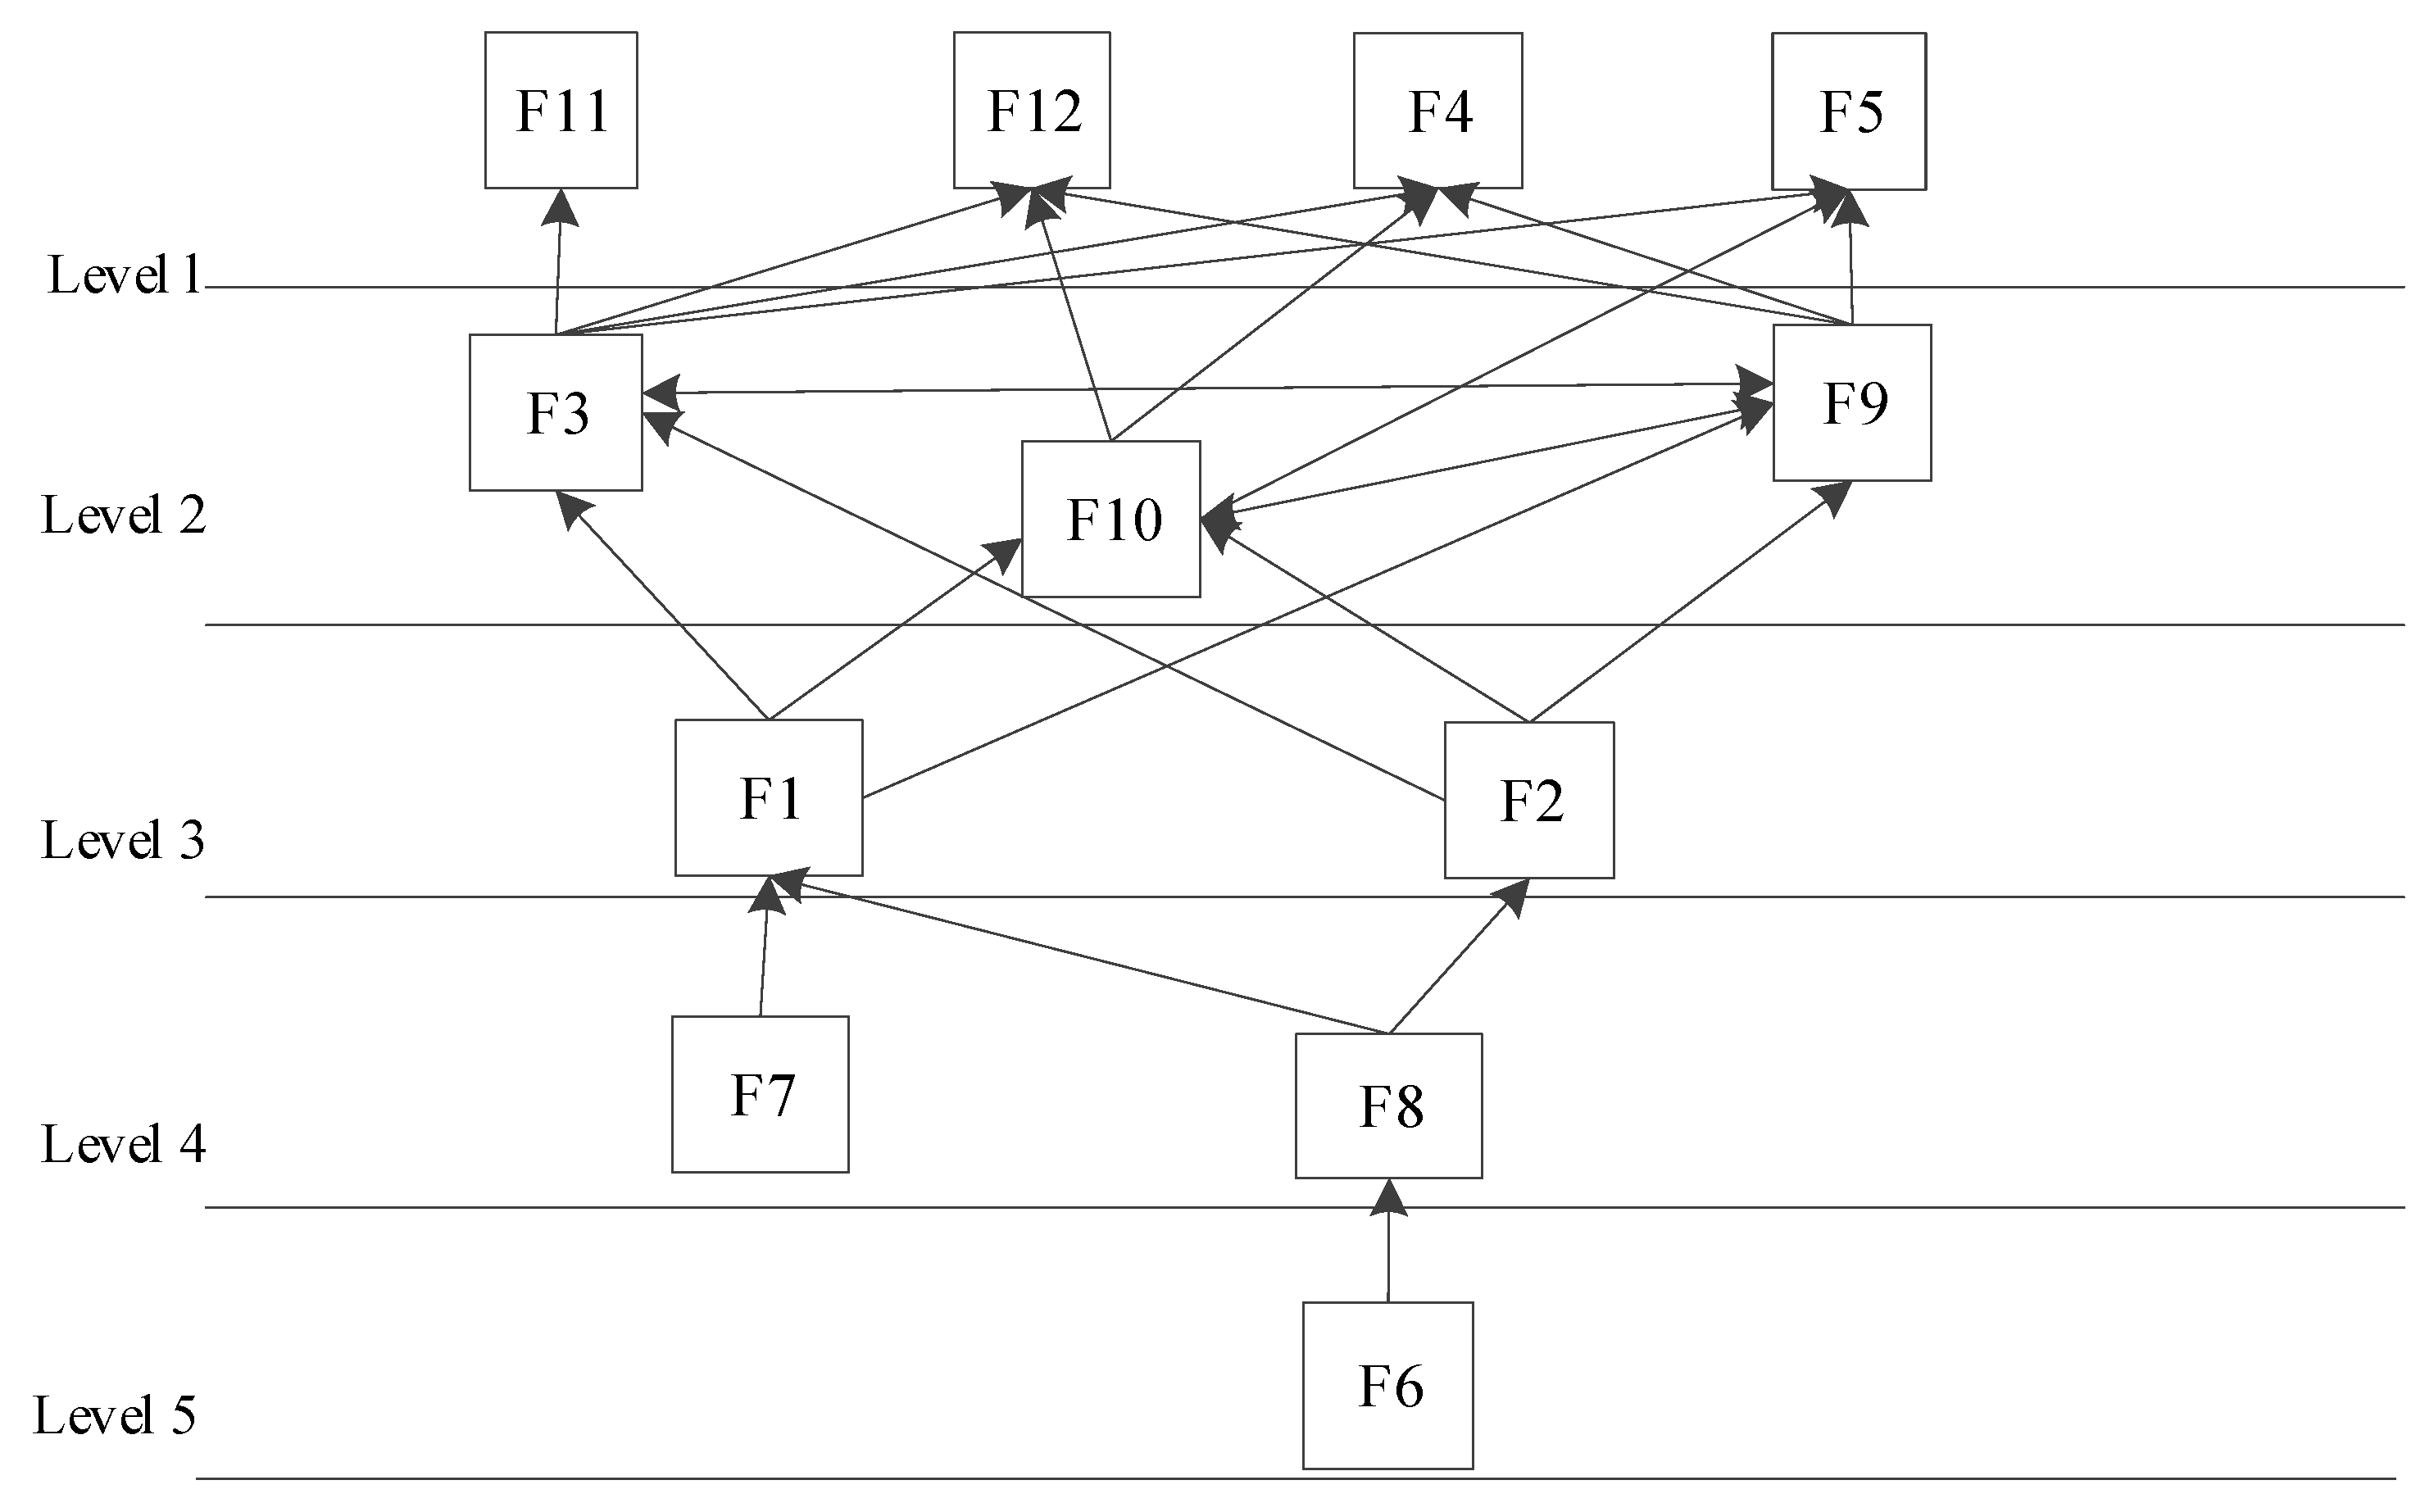
4.1.1. Impact Level Analysis
4.1.2. Impact Path Analysis
4.2. Policy Discussion
- (1)
- Address the technical aspects of training and introduction. The Chinese government has always attached great importance to the cultivation and introduction of talent. The 20th National Congress of the Communist Party of China put forward a strategy of strengthening the country with talent, fully affirming the importance of talent for the development of the country and enterprises. Talent is not only the foundation of enterprise development but also an important driving force for MS. In the process of promoting MS, increasing the introduction and training of talented individuals can comprehensively improve the innovation ability of the MI, promote knowledge sharing and transfer, produce significant benefits of technology diffusion and knowledge spillover, and promote the creation of EBs of MS;
- (2)
- Improve manufacturing input intensity. This is conducive to giving full play to the EBs of MS. At present, China’s MI is facing new problems and challenges, such as increased uncertainty in the international market, rising costs of domestic production factors, and tightening constraints on resources and the environment. Increasing manufacturing input intensity can not only encourage the MI to climb to both ends of the value chain and increase its added value but also reduce energy dependence and environmental pollution. Therefore, improving manufacturing input intensity is an inevitable requirement for the development of the MI and an important way to build an ecological civilization;
- (3)
- Increase the proportion of clean energy consumption and optimize the energy structure. China’s MI is an energy-intensive industry, and fossil energy is its main energy source. With the approaching national carbon peak and carbon-neutral target period, fossil energy consumption in the MI has become the main object of national concern. Therefore, in the process of MS, adhering to a clean and low-carbon orientation and accelerating the green and low-carbon transformation of energy is an important direction to fully capture the advantages of the EBs of MS as soon as possible;
- (4)
- Leverage the dual-driven “technology and business” model to accelerate MS. According to the results of hierarchical structure analysis, MS can be realized in two ways: technology-driven and business-driven. In promoting the servitization process of China’s MI, technological innovation can promote the MI and service industry to innovate production modes, business modes, and organization modes and produce environmental benefits. Similarly, more service factors in the MI can not only provide power for technological innovation but also play a positive role in energy conservation and emission reduction. Therefore, to speed up the realization of MS, technology-driven and business-driven modes need to operate together.
5. Conclusions
- (1)
- In terms of the degree of impact, the factors affecting the EBs of MS can be divided into five different levels. The most important factor (Level 5) is the proportion of R&D personnel. Level 4 includes the proportion of clean energy. Level 3 is the proportion of service revenue and growth rate of industrial added value. Level 2 harbors the proportion of high-tech MI, pollutant emission compliance rate, and proportion of R&D expenditure. Level 1 includes energy consumption intensity, pollutant emission intensity, the proportion of training expenditure, and the proportion of environmental governance investment.
- (2)
- According to the transmission mechanism of the factors, we propose two main methods to realize the EBs of MS from the external and internal driving mechanisms, aiming to jointly promote the realization of the EBs of MS through internal and external linkages.
Author Contributions
Funding
Institutional Review Board Statement
Informed Consent Statement
Data Availability Statement
Acknowledgments
Conflicts of Interest
Appendix A

| Factor | Code | Description | |
|---|---|---|---|
| Driving force (D) | Proportion of service revenue | F1 | Proportion of revenue from services provided by MI in total revenue |
| Growth rate of industrial added value | F2 | Annual growth rate of industrial added value | |
| Proportion of the high-tech MI | F3 | Proportion of the output value of high-tech industry in the total output value of MI | |
| Pressure (P) | Energy consumption intensity | F4 | Energy consumption per unit of industrial added value |
| Pollutant emission intensity | F5 | Pollutant emissions per unit of industrial added value | |
| State (S) | Proportion of R&D personnel | F6 | Ratio of the number of R&D personnel to the total number of manufacturing personnel |
| Input intensity | F7 | Proportion of manufacturing service investment in total manufacturing investment | |
| Proportion of clean energy | F8 | Proportion of clean energy in total energy consumption | |
| Impact (I) | Pollutant emission compliance rate | F9 | Ratio of pollutant emission to total emission |
| Response (R) | Proportion of R&D expenditure | F10 | Proportion of R&D expenditure in total industrial output value |
| Proportion of training expenditure | F11 | Proportion of training funds invested by MI in the total investment | |
| Proportion of environmental governance investment | F12 | Proportion of environmental governance investment in total output value of MI |
| Code | F1 | F2 | F3 | F4 | F5 | F6 | F7 | F8 | F9 | F10 | F11 | F12 |
|---|---|---|---|---|---|---|---|---|---|---|---|---|
| F1 | 0 | 4 | 5 | 5 | 9 | 6 | 10 | 4 | 6 | 9 | 8 | 4 |
| F2 | 1 | 0 | 8 | 8 | 6 | 8 | 2 | 0 | 2 | 8 | 6 | 4 |
| F3 | 8 | 7 | 0 | 8 | 6 | 6 | 7 | 8 | 5 | 6 | 6 | 4 |
| F4 | 0 | 0 | 4 | 0 | 10 | 0 | 2 | 9 | 10 | 3 | 0 | 5 |
| F5 | 0 | 0 | 3 | 10 | 0 | 4 | 2 | 9 | 0 | 4 | 4 | 8 |
| F6 | 8 | 5 | 6 | 3 | 0 | 0 | 6 | 5 | 4 | 10 | 8 | 4 |
| F7 | 8 | 3 | 3 | 5 | 5 | 8 | 0 | 0 | 4 | 6 | 6 | 3 |
| F8 | 4 | 0 | 5 | 10 | 10 | 8 | 2 | 0 | 9 | 8 | 6 | 8 |
| F9 | 0 | 0 | 2 | 9 | 0 | 5 | 0 | 9 | 0 | 4 | 2 | 9 |
| F10 | 8 | 4 | 8 | 6 | 6 | 10 | 8 | 4 | 6 | 0 | 2 | 6 |
| F11 | 8 | 2 | 4 | 6 | 4 | 6 | 8 | 2 | 2 | 6 | 0 | 0 |
| F12 | 2 | 1 | 0 | 8 | 8 | 6 | 2 | 6 | 9 | 4 | 1 | 0 |
| Code | F1 | F2 | F3 | F4 | F5 | F6 | F7 | F8 | F9 | F10 | F11 | F12 |
|---|---|---|---|---|---|---|---|---|---|---|---|---|
| F1 | 0 | 7 | 3 | 8 | 5 | 5 | 5 | 2 | 2 | 3 | 3 | 8 |
| F2 | 6 | 0 | 7 | 3 | 3 | 2 | 5 | 3 | 3 | 2 | 3 | 3 |
| F3 | 6 | 5 | 0 | 2 | 3 | 3 | 2 | 3 | 3 | 6 | 4 | 4 |
| F4 | 2 | 4 | 5 | 0 | 3 | 2 | 2 | 2 | 2 | 3 | 4 | 4 |
| F5 | 4 | 3 | 5 | 3 | 0 | 3 | 2 | 2 | 6 | 4 | 3 | 3 |
| F6 | 8 | 3 | 5 | 2 | 2 | 0 | 3 | 3 | 2 | 9 | 3 | 4 |
| F7 | 6 | 6 | 6 | 3 | 3 | 3 | 0 | 2 | 2 | 4 | 2 | 3 |
| F8 | 4 | 3 | 4 | 6 | 9 | 3 | 3 | 0 | 3 | 5 | 2 | 6 |
| F9 | 3 | 2 | 4 | 3 | 3 | 3 | 6 | 3 | 0 | 4 | 2 | 2 |
| F10 | 8 | 4 | 6 | 4 | 2 | 6 | 2 | 4 | 3 | 0 | 3 | 4 |
| F11 | 5 | 2 | 6 | 3 | 2 | 3 | 2 | 3 | 3 | 4 | 0 | 4 |
| F12 | 3 | 2 | 6 | 5 | 4 | 2 | 6 | 2 | 4 | 4 | 2 | 0 |
| Code | F1 | F2 | F3 | F4 | F5 | F6 | F7 | F8 | F9 | F10 | F11 | F12 |
|---|---|---|---|---|---|---|---|---|---|---|---|---|
| F1 | 0 | 2.5 | 4 | 2 | 2 | 3 | 8 | 2 | 2 | 5 | 2 | 5 |
| F2 | 5 | 0 | 8 | 5 | 3 | 2 | 5 | 3 | 3 | 5 | 3 | 3 |
| F3 | 8 | 8 | 0 | 3 | 3 | 3 | 2 | 8 | 3 | 5 | 5 | 5 |
| F4 | 1 | 5 | 5 | 0 | 4 | 1 | 2 | 8 | 3 | 5 | 4 | 4 |
| F5 | 2 | 3 | 5 | 4 | 0 | 2 | 2 | 9 | 8 | 3 | 3 | 8 |
| F6 | 5 | 2 | 3 | 1 | 2 | 0 | 3 | 3 | 2 | 8 | 5 | 3 |
| F7 | 8 | 5 | 6 | 2 | 2 | 3 | 0 | 3 | 2 | 7 | 2 | 2 |
| F8 | 2 | 3 | 4 | 8 | 8 | 3 | 8 | 0 | 3 | 5 | 4 | 3 |
| F9 | 2 | 3 | 3 | 3 | 2 | 2 | 2 | 3 | 0 | 3 | 2 | 5 |
| F10 | 8 | 5 | 5 | 5 | 2 | 6 | 5 | 5 | 3 | 0 | 5 | 4 |
| F11 | 4 | 3 | 5 | 4 | 3 | 5 | 2 | 4 | 2 | 5 | 0 | 2 |
| F12 | 2 | 3 | 5 | 4 | 5 | 3 | 2 | 6 | 5 | 4 | 2 | 0 |
| Code | F1 | F2 | F3 | F4 | F5 | F6 | F7 | F8 | F9 | F10 | F11 | F12 |
|---|---|---|---|---|---|---|---|---|---|---|---|---|
| F1 | 0 | 3 | 3 | 5 | 5 | 2 | 7 | 5 | 6 | 4 | 3 | 6 |
| F2 | 1 | 0 | 7 | 3 | 5 | 2 | 3 | 1 | 3 | 1 | 1 | 3 |
| F3 | 7 | 8 | 0 | 8 | 1 | 8 | 1 | 5 | 6 | 6 | 7 | 1 |
| F4 | 4 | 8 | 7 | 0 | 8 | 1 | 5 | 7 | 9 | 9 | 1 | 8 |
| F5 | 4 | 5 | 6 | 7 | 0 | 1 | 2 | 8 | 7 | 1 | 1 | 7 |
| F6 | 6 | 9 | 8 | 1 | 1 | 0 | 3 | 1 | 1 | 6 | 8 | 1 |
| F7 | 7 | 6 | 7 | 1 | 5 | 1 | 0 | 4 | 7 | 5 | 5 | 8 |
| F8 | 3 | 8 | 8 | 9 | 9 | 1 | 1 | 0 | 9 | 4 | 0 | 8 |
| F9 | 3 | 5 | 5 | 2 | 8 | 6 | 5 | 8 | 0 | 3 | 8 | 6 |
| F10 | 6 | 8 | 6 | 6 | 1 | 8 | 7 | 1 | 0 | 0 | 7 | 0 |
| F11 | 5 | 3 | 2 | 0 | 1 | 0 | 0 | 5 | 0 | 0 | 0 | 0 |
| F12 | 3 | 5 | 6 | 2 | 8 | 5 | 4 | 8 | 6 | 3 | 7 | 0 |
| Code | F1 | F2 | F3 | F4 | F5 | F6 | F7 | F8 | F9 | F10 | F11 | F12 |
|---|---|---|---|---|---|---|---|---|---|---|---|---|
| F1 | 0 | 2.5 | 5 | 2.5 | 2.5 | 3 | 8 | 2.5 | 2.5 | 5 | 5 | 2.5 |
| F2 | 4 | 0 | 7.5 | 7.5 | 2.5 | 5 | 2.5 | 5 | 7.5 | 7.5 | 2.5 | 2.5 |
| F3 | 8 | 7.5 | 0 | 7.5 | 7.5 | 8 | 0 | 7.5 | 7.5 | 8 | 2.5 | 2.5 |
| F4 | 2.5 | 7.5 | 6 | 0 | 10 | 2.5 | 5 | 8 | 7.5 | 10 | 2.5 | 5 |
| F5 | 2.5 | 2.5 | 7.5 | 10 | 0 | 0 | 2.5 | 8 | 0 | 0 | 0 | 7.5 |
| F6 | 5 | 5 | 8 | 2.5 | 0 | 0 | 0 | 5 | 0 | 7.5 | 5 | 0 |
| F7 | 8 | 2.5 | 0 | 0 | 2.5 | 0 | 0 | 0 | 0 | 0 | 5 | 0 |
| F8 | 2.5 | 2 | 5 | 9 | 2.5 | 2 | 0 | 0 | 10 | 2.5 | 0 | 5 |
| F9 | 2.5 | 7.5 | 7.5 | 7.5 | 0 | 0 | 0 | 10 | 0 | 0 | 0 | 10 |
| F10 | 5 | 7.5 | 10 | 2.5 | 0 | 7.5 | 0 | 6 | 0 | 0 | 2.5 | 0 |
| F11 | 4 | 2.5 | 2.5 | 2.5 | 0 | 5 | 5 | 0 | 0 | 2.5 | 0 | 0 |
| F12 | 2.5 | 2.5 | 2.5 | 5 | 7.5 | 0 | 0 | 10 | 10 | 0 | 0 | 0 |
| Expert | Designation | Field | Experience Experts’ Information (yrs) |
|---|---|---|---|
| Expert 1 (Qing Yang) | Production manager | Production management | 13 |
| Expert 2 (Pengtao Liu) | Director of production department | Organization and arrangement of production | 20 |
| Expert 3 (Guoan Liu) | Senior executive | Business process reengineering | 11 |
| Expert 4 (Shujiao Yi) | Information manager | Lean management | 18 |
| Expert 5 (Meixiang Wu) | Professor | Sustainable development | 25 |
References
- Adam, M.; Strähle, J.; Freise, M. The interaction of Product-Service Systems (PSS) and Corporate Environmental Management (CEM): Can PSS drive today’s fashion industry toward more environmental sustainability? Serv. Sci. 2017, 3, 235–249. [Google Scholar] [CrossRef]
- Tukker, A. Product services for a resource-efficient and circular economy—A review. J. Clean. Prod. 2015, 97, 76–91. [Google Scholar] [CrossRef]
- Zhu, S.J.; Xie, Y.; Wu, D.S. Research on energy-saving effect and intermediary mechanism of manufacturing service. Financ. Trade Econ. 2020, 41, 126–140. [Google Scholar]
- Wang, H.S.; Zhou, H.; He, D.N. Research on the influence of manufacturing service on carbon intensity. J. Technol. Econ. 2022, 2, 96–107. [Google Scholar]
- Kastalli, I.V.; Van, L.B. Servitization: Disentangling the impact of service business model innovation on manufacturing firm performance. J. Oper. Manag. 2013, 31, 169–180. [Google Scholar] [CrossRef]
- Xu, D.L.; Zhang, X.K. Research on the green welfare effect of China’s manufacturing industry servitization -- Based on the dual perspectives of pollution improvement and environmental TFP. J. China Univ. Geosci. 2021, 4, 56–72. [Google Scholar]
- Xia, J.C.; Xiao, Y. Develop and strengthen the real economy through the integration of manufacturing and service industries. China Bus. Mark. 2022, 3, 3–13. [Google Scholar]
- Chen, L.X.; Wei, Z.L. The theoretical logic and empirical test of China’s high quality economic development driven by manufacturing service. Rev. Econ. Manag. 2022, 6, 130–143. [Google Scholar]
- Eggert, A.; Hogreve, J.; Ulaga, W.; Muenkhoff, E. Revenue and Profit Implications of Industrial Service Strategies. J. Serv. Res. 2013, 17, 23–39. [Google Scholar] [CrossRef]
- Wei, Z.L.; Wang, F.B. The effect mechanism of manufacturing output servitization on enterprise performance -- Based on the perspective of product market competition. Ind. Econ. Rev. 2021, 1, 115–133. [Google Scholar]
- Ambroise, L.; Prim-Allaz, I.; Teyssier, C. Financial performance of servitized manufacturing firms: A configuration issue between servitization strategies and customer-oriented organizational design. Ind. Mark. Manag. 2018, 71, 54–68. [Google Scholar] [CrossRef]
- Chen, M.; Wang, F. Effects of top management team faultlines in the service transition of manufacturing firms. Ind. Mark. Manag. 2021, 98, 115–124. [Google Scholar] [CrossRef]
- Huang, Q.H.; Huo, J.D. Service level of global manufacturing industry and its influencing factors—An empirical analysis based on international input output data. Econ. Manag. 2014, 36, 1–11. [Google Scholar]
- Li, Y.H.; Liao, C.J.; Xiang, Z.W. Research on the configuration path of manufacturing service transformation under the background of digital economy. Forum Sci. Technol. China 2022, 8, 68–76. [Google Scholar]
- Zhou, N.L.; Bao, Y.N. Research on the influence of digital service market opening on manufacturing service level. Contemporary Fin. Econ. 2022, 7, 112–122. [Google Scholar]
- Xiao, T.; Liu, H.; Ye, P. Research on influencing factors of service innovation in manufacturing enterprises. Chin. J. manag. 2014, 11, 591–598. [Google Scholar]
- Qi, L.Q.; Zhao, S.H.; Cai, Y.Y. Service oriented process of equipment manufacturing industry and its influencing factors--An empirical study based on cross sectional data of 30 provinces and cities in mainland China. Sci. Technol. Prog. Pol. 2014, 31, 47–53. [Google Scholar]
- Qi, L.Q.; Cui, Y.Y.; Wang, J.S. Analysis of the influencing factors of China’s advanced manufacturing service. Mod. Manag. 2021, 6, 15–19. [Google Scholar]
- Tong, W.T.; Zhang, Y.Y. Can the opening policy of productive services effectively improve the serviceability of China’s manufacturing industry? Commer. Res. 2021, 6, 34–43. [Google Scholar]
- Zhang, X.M.; Chen, H.R.; Liu, Z. Operation strategy in an E-commerce platform supply chain: Whether and how to introduce live streaming services? Int. T. Oper. Res. 2022, 4, 1–29. [Google Scholar] [CrossRef]
- Zhang, X.M.; Li, Q.W.; Liu, Z.; Chang, C.T. Optimal pricing and remanufacturing mode in a closed-loop supply chain of WEEE under government fund policy. Comput. Ind. Eng. 2021, 1, 106951. [Google Scholar] [CrossRef]
- Jovanovic, M.; Raja, J.Z.; Visnjic, I.; Wiengarten, F. Paths to service capability development for servitization: Examining an internal service ecosystem. J. Bus. Res. 2019, 104, 472–485. [Google Scholar] [CrossRef]
- Su, X.; Mou, C.L.; Zhang, Z. Research on value co-creation mechanism and realization path of service oriented manufacturing—from the perspective of service ecosystem. Macroecomomics 2021, 1, 96–104+130. [Google Scholar]
- Tian, J.; Coreynen, W.; Matthyssens, P.; Shen, L. Platform-based servitization and business model adaptation by established manufacturers. Technovation 2021, 118, 102222. [Google Scholar] [CrossRef]
- Cuc, S.; Girneata, A.; Iordanescu, M.; Irinel, M. Environmental and socioeconomic sustainability through textile recycling. Ind. Textila 2015, 3, 156–163. [Google Scholar]
- Girneata, A.; Mascu, M. Development discrepancies between Western and Eastern EU countries: A statistical analysis of textile and apparel clusters. In Proceedings of the 8th International Management Conference “Management Challenges for the Sustainable Development”, Bucharest, Romania, 6–7 November 2014. [Google Scholar]
- Agrawal, V.V.; Bellos, I. The potential of servicizing as a green business model. Manag. Sci. 2017, 5, 1545–1562. [Google Scholar] [CrossRef]
- Reiskin, E.D.; White, A.L.; Johnson, J.K.; Votta, T.J. Servicizing the chemical supply chain. J. Ind. Ecol. 1999, 32, 19–31. [Google Scholar] [CrossRef]
- Mont, O.K. Clarifying the concept of product–service system. J. Clean. Prod. 2002, 3, 237–245. [Google Scholar] [CrossRef]
- Glatt, M.F.; Yi, L.; Mert, G.; Linke, B.S.; Aurich, J.C. Technical product-service systems: Analysis and reduction of the cumulative energy demand. J. Clean. Prod. 2019, 206, 727–740. [Google Scholar] [CrossRef]
- Liu, J.G.; Li, J.F. A review of the research on the service of manufacturing industry abroad. Economist 2007, 3, 120–127. [Google Scholar]
- Liu, J.G. Influencing factors of serving-inputting strategy and its performance in manufacturing firms: Theoretic framework and empirical research. Chin. J. Manag. 2008, 2, 237–242. [Google Scholar]
- Wang, L.; Zhang, C. Evaluation of sustainable utilization of Weifang regional water resources based on driving Forces-Pressure-State-Response Model. J. Ocean Univ. China 2013, 12, 79–84. [Google Scholar]
- Shi, S.X.; Tong, P.S. Study on the evaluation and obstacle factors of industrial structure optimization in different regions of China—Based on DPSIR-TOPSIS model. J. Hebei Univ. Econ. Trade. 2020, 2, 54–64. [Google Scholar]
- Yang, L.; Huang, T.Z. Construction and comprehensive measurement of the evaluation model of eco-environmental collaborative governance effect in metropolitan area under the framework of DPSIR—Empirical evidence from Suzhou, Wuxi & Changzhou metropolitan area. Acad. Forum. 2019, 6, 41–53. [Google Scholar]
- Jiao, L.; Ma, W.L.; Hong, S.M.; He, X.; Xu, H.; Sun, H.L. Comparison of haze and ambient air quality in Hangzhou. Environ. Sci. Technol. 2012, 7, 50–54. [Google Scholar]
- Mumtaz, U.; Ali, Y.; Petrillo, A.; De, F. Identifying the critical factors of green supply chain management: Environmental benefits in Pakistan. Sci. Total Environ. 2018, 1, 144–152. [Google Scholar] [CrossRef] [PubMed]
- Li, G.; Huang, D.; Sun, C.; Li, Y. Developing interpretive structural modeling based on factor analysis for the water-energy-food nexus conundrum. Sci. Total Environ. 2019, 651, 309–322. [Google Scholar] [CrossRef]
- Zhou, D.Q.; Zhang, L. Establishing hierarchy structure in complex systems based on the integration of DEMATEL and ISM. J. Manag. Sci. China 2008, 12, 20–26. [Google Scholar]
- Li, M.J.; Shi, R. The influence factors analysis of the apron capacity based on integrated DEMATEL-ISM. J. Math. Pract. Theory. 2017, 21, 155–164. [Google Scholar]


| Factors | Code | Supporting Literatures | |
|---|---|---|---|
| Driving force (D) | Proportion of service revenue | F1 | Liu and Li [31], Liu [32] |
| Growth rate of industrial added value | F2 | Wang and Zhang [33], Shi and Tong [34], Yang and Huang [35] | |
| Proportion of the high-tech MI | F3 | Yang and Huang [35] | |
| Pressure (P) | Energy consumption intensity | F4 | Wang and Zhang [33], Shi and Tong [34] |
| Pollutant emission intensity | F5 | Shi and Tong [34], Yang and Huang [35] | |
| State (S) | Proportion of R&D personnel | F6 | Shi and Tong [34] |
| Input intensity | F7 | Liu [32] | |
| Proportion of clean energy | F8 | Shi and Tong [34] | |
| Impact (I) | Pollutant emission compliance rate | F9 | Wang and Zhang [33] |
| Response (R) | Proportion of R&D expenditure | F10 | Yang and Huang [35] |
| Proportion of training funds | F11 | Yang and Huang [35] | |
| Proportion of environmental governance investment | F12 | Shi and Tong [34], Jiao et al. [36] |
| Code | F1 | F2 | F3 | F4 | F5 | F6 | F7 | F8 | F9 | F10 | F11 | F12 |
|---|---|---|---|---|---|---|---|---|---|---|---|---|
| F1 | 0 | 3.8 | 4 | 4.5 | 4.7 | 3.8 | 7.6 | 3.1 | 4.1 | 5.2 | 4.2 | 5.1 |
| F2 | 3.4 | 0 | 7.5 | 5.3 | 3.9 | 3.8 | 3.5 | 2.4 | 3.7 | 4.7 | 3.1 | 3.1 |
| F3 | 7.4 | 7.1 | 0 | 5.7 | 4.1 | 5.6 | 2.4 | 5.5 | 5.1 | 6.2 | 4.9 | 3.3 |
| F4 | 1.9 | 4.9 | 5.4 | 0 | 7 | 1.3 | 3.2 | 5.7 | 6.5 | 6 | 2.3 | 5.2 |
| F5 | 2.5 | 2.7 | 5.3 | 6.8 | 0 | 2 | 2.1 | 4.1 | 7.6 | 2.4 | 2.2 | 6.7 |
| F6 | 6.4 | 4.8 | 6 | 1.9 | 1 | 0 | 3 | 2 | 1.8 | 8.1 | 5.8 | 2.4 |
| F7 | 7.4 | 4.5 | 4.4 | 2.2 | 3.5 | 3 | 0 | 1.2 | 3.2 | 4.4 | 4 | 3.2 |
| F8 | 3.1 | 3.2 | 5.2 | 8.4 | 7.7 | 3.4 | 2.8 | 0 | 9.8 | 4.9 | 2.4 | 6 |
| F9 | 2.1 | 3.5 | 4.5 | 4.9 | 6.8 | 3 | 2.6 | 6.6 | 0 | 2.8 | 2.8 | 6.4 |
| F10 | 7 | 5.7 | 7 | 4.7 | 2.2 | 7.5 | 4.4 | 3.3 | 6 | 0 | 3.9 | 2.8 |
| F11 | 5.2 | 2.5 | 3.9 | 3.1 | 2 | 3.8 | 3.4 | 2.4 | 2.6 | 3.5 | 0 | 1.2 |
| F12 | 2.5 | 2.7 | 3.9 | 4.8 | 6.5 | 3.2 | 6.4 | 4.6 | 1.4 | 3 | 2.4 | 0 |
| Code | F1 | F2 | F3 | F4 | F5 | F6 | F7 | F8 | F9 | F10 | F11 | F12 |
|---|---|---|---|---|---|---|---|---|---|---|---|---|
| F1 | 0.35 | 0.39 | 0.47 | 0.44 | 4.7 | 0.36 | 0.39 | 0.43 | 0.45 | 0.45 | 0.34 | 0.42 |
| F2 | 0.37 | 0.31 | 0.49 | 0.44 | 0.40 | 0.33 | 0.31 | 0.39 | 0.41 | 0.41 | 0.30 | 0.36 |
| F3 | 0.52 | 0.50 | 0.48 | 0.54 | 0.49 | 0.44 | 0.36 | 0.55 | 0.53 | 0.53 | 0.40 | 0.45 |
| F4 | 0.39 | 0.42 | 0.51 | 0.41 | 0.50 | 0.33 | 0.33 | 0.51 | 0.51 | 0.47 | 0.32 | 0.44 |
| F5 | 0.37 | 0.37 | 0.48 | 0.49 | 0.37 | 0.32 | 0.30 | 0.50 | 0.50 | 0.40 | 0.30 | 0.44 |
| F6 | 0.43 | 0.38 | 0.47 | 0.38 | 0.34 | 0.28 | 0.31 | 0.40 | 0.38 | 0.46 | 0.35 | 0.34 |
| F7 | 0.41 | 0.35 | 0.41 | 0.36 | 0.36 | 0.30 | 0.24 | 0.35 | 0.35 | 0.38 | 0.30 | 0.34 |
| F8 | 0.44 | 0.43 | 0.55 | 0.58 | 0.55 | 0.39 | 0.36 | 0.46 | 0.46 | 0.50 | 0.35 | 0.49 |
| F9 | 0.36 | 0.37 | 0.47 | 0.46 | 0.47 | 0.33 | 0.30 | 0.50 | 0.50 | 0.40 | 0.31 | 0.43 |
| F10 | 0.50 | 0.46 | 0.56 | 0.50 | 0.44 | 0.45 | 0.38 | 0.49 | 0.49 | 0.41 | 0.37 | 0.42 |
| F11 | 0.33 | 0.28 | 0.35 | 0.32 | 0.29 | 0.27 | 0.25 | 0.31 | 0.31 | 0.32 | 0.20 | 0.26 |
| F12 | 0.32 | 0.32 | 0.40 | 0.40 | 0.41 | 0.29 | 0.27 | 0.42 | 0.35 | 0.35 | 0.26 | 0.28 |
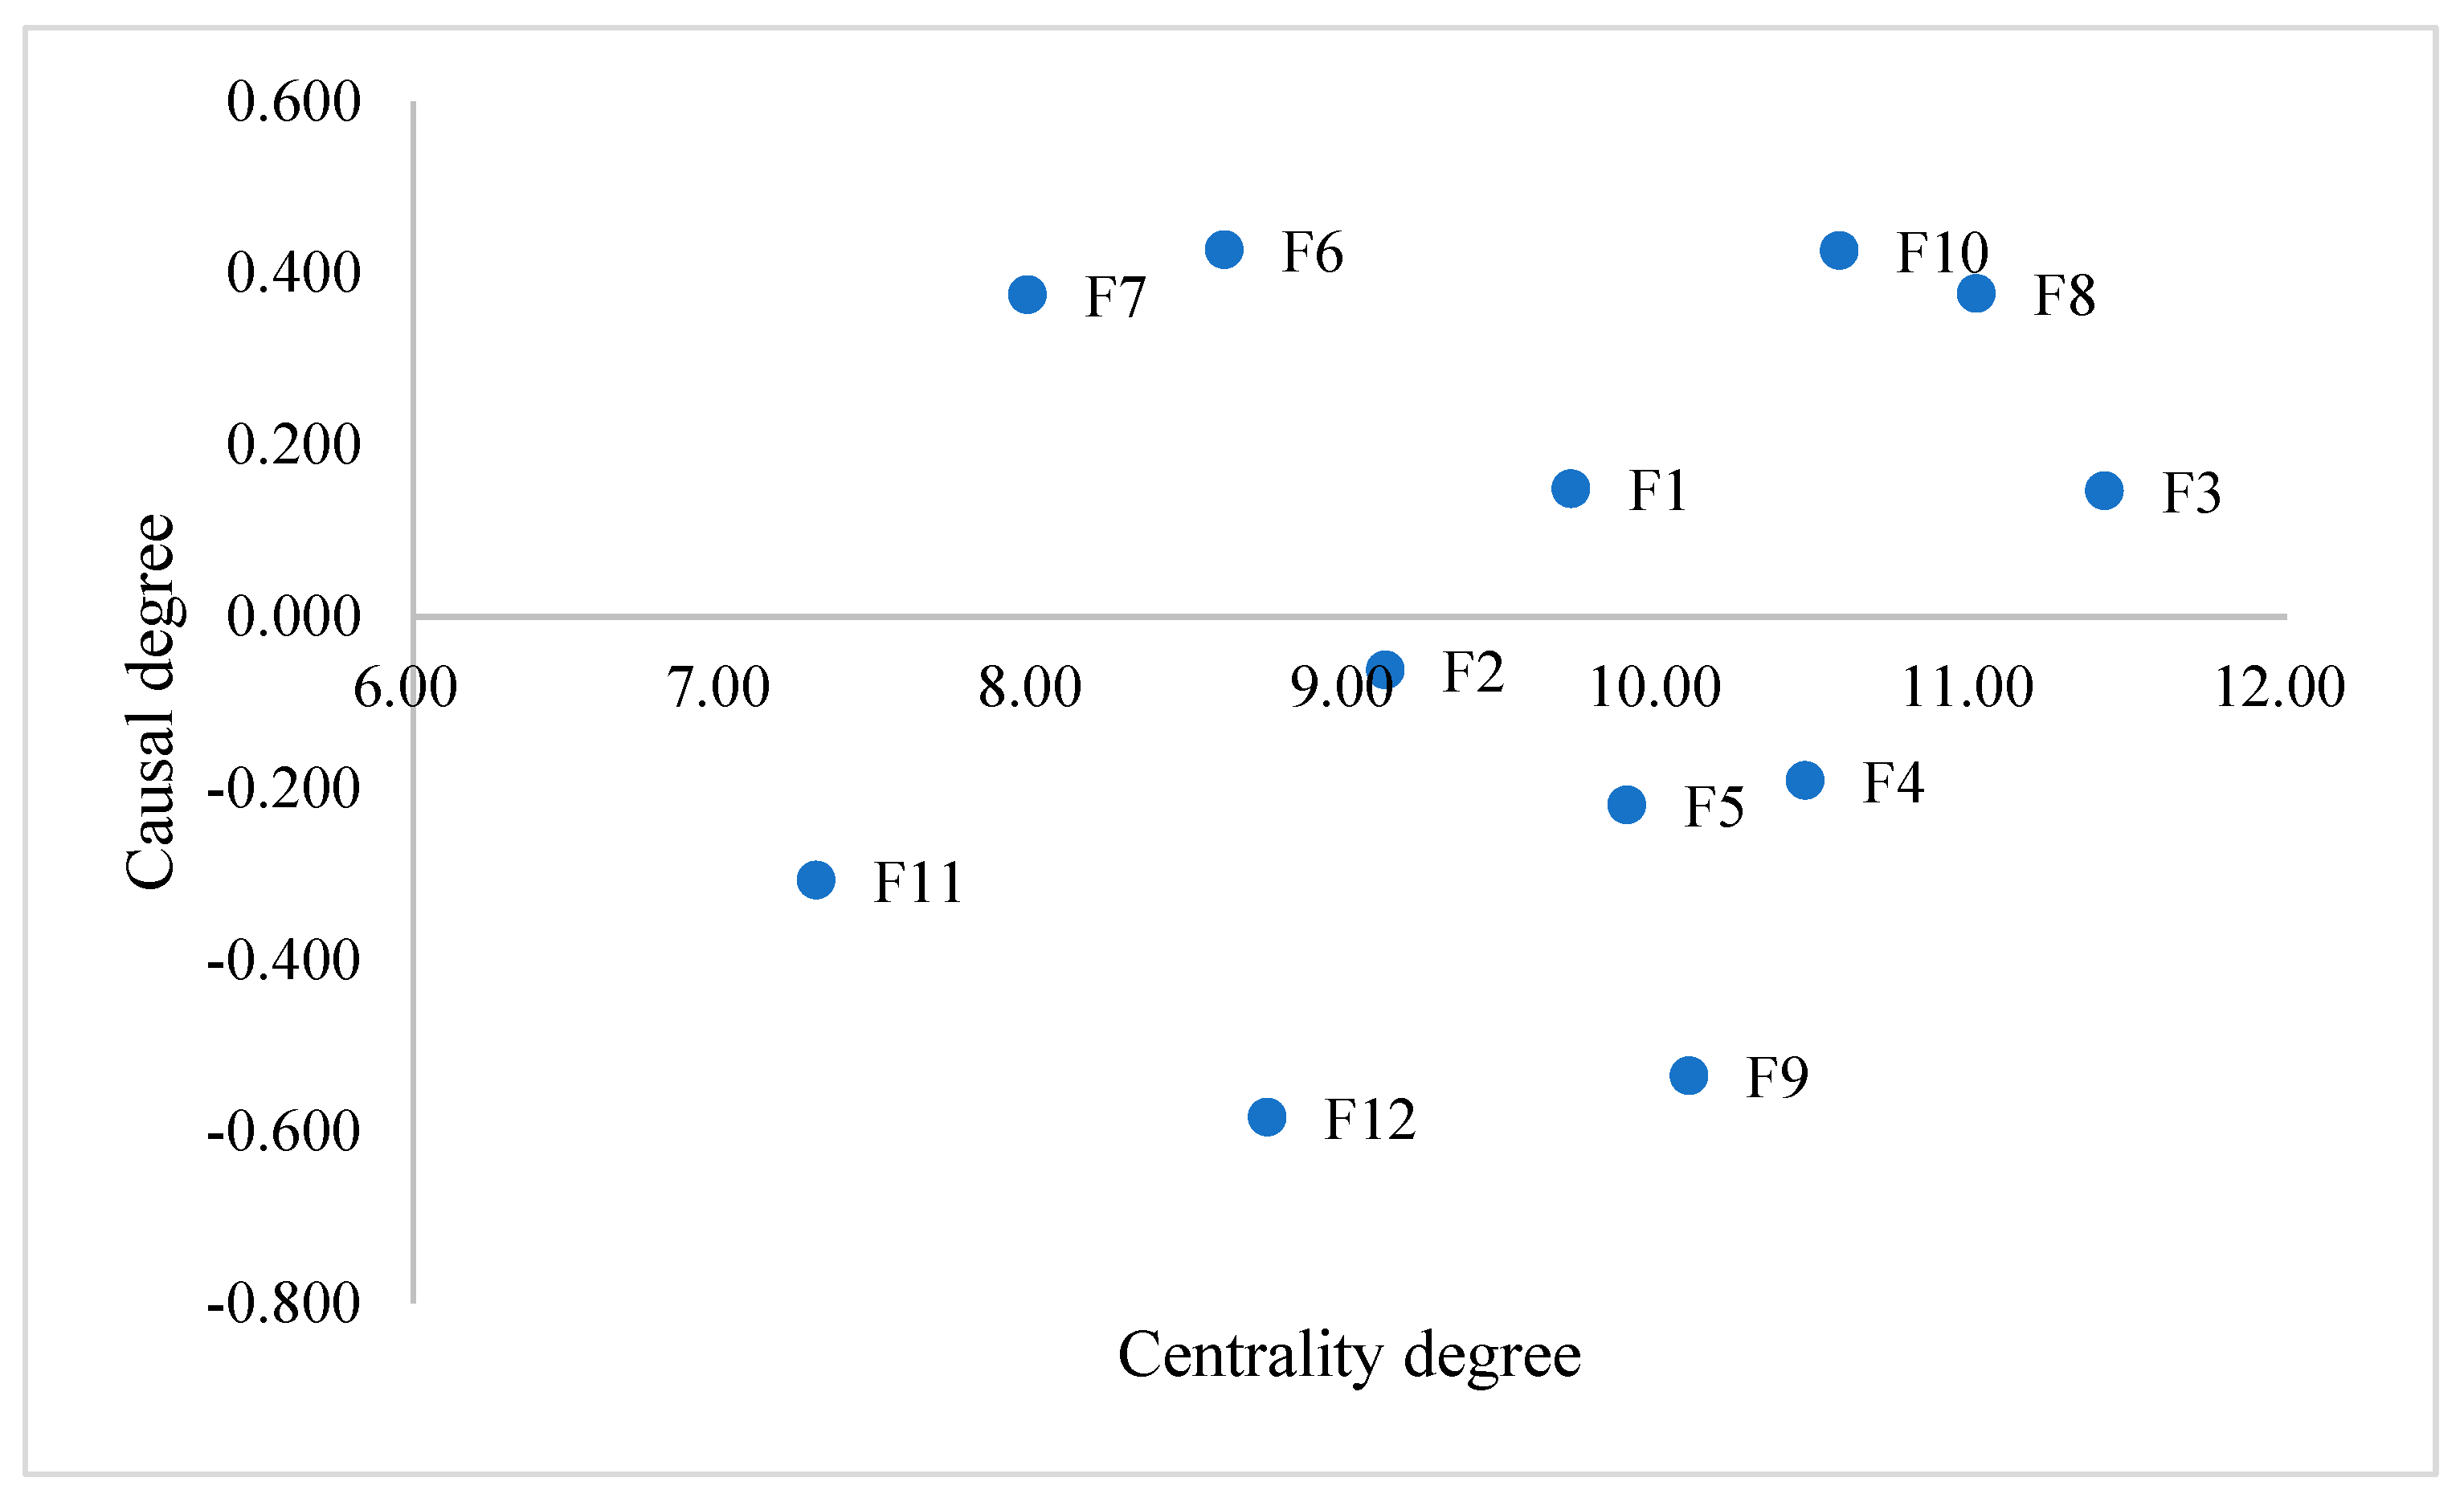
| Code | Di | Qi | Pi | Ei | Category |
|---|---|---|---|---|---|
| F1 | 4.93 (5) | 4.78 (7) | 9.71 (7) | 0.149 (5) | Net cause |
| F2 | 4.53 (8) | 4.59 (9) | 9.11 (8) | −0.062 (7) | Net effect |
| F3 | 5.78 (1) | 5.64 (1) | 11.42 (1) | 0.146 (6) | Net cause |
| F4 | 5.13 (4) | 5.33 (2) | 10.46 (4) | −0.191 (8) | Net effect |
| F5 | 4.51 (9) | 4.09 (10) | 8.60 (10) | 0.427 (1) | Net cause |
| F6 | 4.83 (6) | 5.05 (6) | 9.89 (6) | −0.22 (9) | Net effect |
| F7 | 4.17 (10) | 3.80 (12) | 7.97 (11) | 0.375 (4) | Net cause |
| F8 | 5.69 (2) | 5.32 (3) | 11.01 (2) | 0.376 (3) | Net cause |
| F9 | 4.78 (7) | 5.31 (4) | 10.09 (5) | −0.535 (11) | Net effect |
| F10 | 5.50 (3) | 5.07 (5) | 10.57 (3) | 0.426 (2) | Net cause |
| F11 | 3.49 (12) | 3.80 (11) | 72.9 (12) | −0.583 (10) | Net effect |
| F12 | 4.08 (11) | 4.67 (8) | 8.74 (9) | −0.72 (12) | Net effect |
| Code | F1 | F2 | F3 | F4 | F5 | F6 | F7 | F8 | F9 | F10 | F11 | F12 |
|---|---|---|---|---|---|---|---|---|---|---|---|---|
| F1 | 1 | 0 | 1 | 1 | 1 | 0 | 0 | 1 | 1 | 1 | 0 | 1 |
| F2 | 0 | 1 | 1 | 1 | 1 | 0 | 0 | 0 | 1 | 1 | 0 | 0 |
| F3 | 1 | 1 | 1 | 1 | 1 | 1 | 0 | 0 | 1 | 1 | 1 | 1 |
| F4 | 0 | 1 | 1 | 1 | 1 | 0 | 0 | 1 | 1 | 1 | 0 | 1 |
| F5 | 0 | 0 | 1 | 1 | 1 | 0 | 0 | 1 | 1 | 1 | 0 | 1 |
| F6 | 1 | 0 | 1 | 0 | 0 | 1 | 0 | 1 | 0 | 1 | 0 | 0 |
| F7 | 1 | 0 | 1 | 0 | 0 | 0 | 1 | 1 | 0 | 0 | 0 | 0 |
| F8 | 1 | 1 | 1 | 1 | 1 | 0 | 0 | 0 | 1 | 1 | 0 | 1 |
| F9 | 0 | 0 | 1 | 1 | 1 | 0 | 0 | 1 | 1 | 1 | 0 | 1 |
| F10 | 1 | 1 | 1 | 1 | 1 | 1 | 0 | 1 | 1 | 1 | 0 | 1 |
| F11 | 0 | 0 | 0 | 0 | 0 | 0 | 0 | 0 | 0 | 0 | 1 | 0 |
| F12 | 0 | 0 | 1 | 1 | 1 | 0 | 0 | 1 | 0 | 0 | 0 | 1 |
| Factors | Reachability Set | Antecedent Set | Intersection Set | Level |
|---|---|---|---|---|
| Iteration 1 | ||||
| 1 | 1, 3, 4, 6, 8, 9, 10, 12 | 1, 3, 5, 7, 8, 10 | 3, 8, 10 | |
| F2 | 2, 3, 4, 6, 9, 10 | 2, 3, 4, 8, 10 | 2, 3, 4, 10 | |
| F3 | 1, 2, 3, 4, 5, 6, 8, 9, 10, 11, 12 | 1, 2, 3, 4, 5, 6, 7, 8, 9, 10, 12 | 1, 2, 3, 4, 5, 6, 8, 9, 10, 12 | |
| F4 | 2, 3, 4, 6, 8, 9, 10, 12 | 1, 2, 3, 4, 6, 8, 9, 10, 12 | 2, 3, 4, 6, 8, 9, 10, 12 | 1 |
| F5 | 3, 4, 6, 8, 9, 10, 12 | 1, 2, 3, 4, 6, 8, 9, 10, 12 | 3, 4, 6, 8, 9, 10, 12 | 1 |
| F6 | 1, 3, 5, 8, 10 | 3, 5, 10 | 3, 5, 10 | |
| F7 | 1, 3, 7 | 7 | 7 | |
| F8 | 1, 2, 3, 4, 6, 8, 9, 10, 12 | 1, 3, 4, 5, 6, 8, 9, 10, 12 | 1, 3, 4, 6, 8, 9, 10, 12 | |
| F9 | 3, 4, 6, 8, 9, 10, 12 | 1, 2, 3, 4, 6, 8, 9, 10 | 3, 4, 6, 8, 9, 10 | |
| F10 | 1, 2, 3, 4, 5, 6, 8, 9, 10, 12 | 1, 2, 3, 4, 5, 6, 8, 9, 10 | 2, 3, 4, 6, 8, 9, 10 | |
| F11 | 11 | 3, 11 | 1, 2, 3, 5, 8, 9, 10 | 1 |
| F12 | 3, 4, 6, 8, 12 | 1, 3, 4, 6, 8, 9, 10, 12 | 3, 4, 6, 8, 12 | 1 |
| Iteration 2 | ||||
| F1 | 1, 3, 8, 9, 10 | 1, 3, 5, 7, 8, 10 | 1, 3, 8, 10 | |
| F2 | 2, 3, 9, 10 | 2, 3, 8, 10 | 2, 3, 10 | 2 |
| F3 | 1, 2, 3, 5, 8, 9, 10 | 1, 3, 5, 8, 9, 10 | 1, 3, 8, 9, 10 | |
| F6 | 1, 3, 5, 8, 10 | 3, 5, 10 | 3, 5, 10 | |
| F7 | 1, 3, 7 | 7 | 7 | |
| F8 | 1, 2, 3, 8, 9, 10 | 1, 3, 8, 9, 10 | 1, 3, 8, 9, 10 | |
| F9 | 3, 8, 9, 10 | , 2, 3, 8, 9, 10 | 3, 8, 9, 10 | |
| F10 | 1, 2, 3, 5, 8, 9, 10 | 1, 2, 3, 5, 8, 9, 10 | 1, 2, 3, 5, 8, 9, 10 | 2 |
| Iteration 3 | ||||
| F1 | 1, 8 | 1, 5, 7, 8 | 1, 8 | 3 |
| F2 | 2 | 2, 8 | 2 | 3 |
| F6 | 1, 5, 8 | 5 | 5 | |
| F7 | 1, 7 | 7 | 7 | 3 |
| F8 | 1, 2, 8 | 1, 5, 8 | 1, 8 | |
| Iteration 4 | ||||
| F6 | 5, 8 | 5 | 5 | |
| F7 | 7 | 7 | 7 | 4 |
| F8 | 8 | 5, 8 | 8 | 4 |
| Iteration 5 | ||||
| F6 | 5 | 5 | 5 | 5 |
Disclaimer/Publisher’s Note: The statements, opinions and data contained in all publications are solely those of the individual author(s) and contributor(s) and not of MDPI and/or the editor(s). MDPI and/or the editor(s) disclaim responsibility for any injury to people or property resulting from any ideas, methods, instructions or products referred to in the content. |
© 2023 by the authors. Licensee MDPI, Basel, Switzerland. This article is an open access article distributed under the terms and conditions of the Creative Commons Attribution (CC BY) license (https://creativecommons.org/licenses/by/4.0/).
Share and Cite
Li, H.; Chu, L.; Qin, X. Analysis of the Factors Affecting China’s Manufacturing Servitization from the Perspective of the Ecological Environment. Sustainability 2023, 15, 2934. https://doi.org/10.3390/su15042934
Li H, Chu L, Qin X. Analysis of the Factors Affecting China’s Manufacturing Servitization from the Perspective of the Ecological Environment. Sustainability. 2023; 15(4):2934. https://doi.org/10.3390/su15042934
Chicago/Turabian StyleLi, Hui, Lixia Chu, and Xiaoyi Qin. 2023. "Analysis of the Factors Affecting China’s Manufacturing Servitization from the Perspective of the Ecological Environment" Sustainability 15, no. 4: 2934. https://doi.org/10.3390/su15042934