Article

A Fuzzy-Set Configurational Examination of Governance Capability under Certainty and Uncertainty Conditions: Evidence from the Chinese Provincial Cases of Early COVID-19 Containing Practice

1
School of Public Policy and Management, China University of Mining and Technology, Xuzhou 221116, China
2
School of Safety Engineering, China University of Mining and Technology, Xuzhou 221116, China
3
School of International and Public Affairs, Shanghai Jiao Tong University, Shanghai 200030, China
*
Author to whom correspondence should be addressed.
Sustainability 2023, 15(3), 2828; https://doi.org/10.3390/su15032828
Submission received: 28 December 2022 / Revised: 25 January 2023 / Accepted: 1 February 2023 / Published: 3 February 2023
(This article belongs to the Section Health, Well-Being and Sustainability)

Abstract

:
It is a complex task for provincial governments to sustain the effectiveness of the governance system in containing the spread of COVID-19 in the early stages. This study aims to examine the complex causal combinations of certainty, uncertainty and governance capabilities leading to high and low effectiveness of governance across 30 Chinese provincial administrative regions. The fuzzy-set qualitative comparative analysis (fsQCA) shows that: (1) Two paths lead to a high level of governance effectiveness. One is condition-based, while the other is mainly based on the expertise of health directors and low-spreading control conditions. (2) Two paths lead to a low level of governance effectiveness. Because of a high level of spreading control difficulty, most provinces take the first path. (3) The SARS experience in 2003 may not be a necessary condition to improve the governance effectiveness of the COVID-19 outbreak. Provinces could achieve good governance effectiveness even if they had no prior SARS experience. The findings enhance the understanding of the emergency response to a public health crisis in a country with a strong government by clarifying various effective and ineffective configurations. It also reflects China’s existing public health emergency system to maintain sustainable governance under varying degrees of certainty and uncertainty.

1. Introduction

There was an interesting phenomenon in the early COVID-19 containing practices. A province with better medical, information infrastructure and other physical conditions may have lower governance effectiveness than another province with poorer physical conditions at this stage. The influencing factors are numerous, including governance capability, economic development, public health conditions, population density, transportation, etc. This example also demonstrates that a good configuration of policy choices and investment in governance, social protection, green economy and digitalization, that is, an “SDG push”, would assist some less-developed regions in moving beyond development trajectories, even though the outbreak of COVID-19 may widen the gap between the developed and developing regions [1]. To reveal the complex causal relationships in unexpected epidemics, abrupt biophysical system shifts and economic crises, the complexity theory was introduced into governance literature for more than two decades [2,3]. In the public health crisis, how to match resources with governance capability from a broad perspective could have a significant impact on the effectiveness of governance. A good public health governance model would be sustainable and balanced in containment and social functioning.
Governments make a great number of decisions on policy choices, such as resource allocation and the speed of response to emergent health issues. One of the most inexorable factors affecting policymakers’ decisions is uncertainty, since they cannot make perfectly informed judgements and their interpretations of the existing evidence may lead to numerous interpretations and perspectives [4,5,6]. This was especially true during the early stages of the COVID-19 pandemic. The policymakers were challenged by the limited knowledge about the virus and abundant policy decisions with unknown potential consequences. Complexity entails both uncertainty and some stability [7]. Uncertainty can be divided into measurable uncertainty and unmeasurable uncertainty [8]. Certainty is what we can control, and to some extent, reduce uncertainty and direct a complex situation toward stability [9]. Certainty, uncertainty and governance capabilities are mixed in a complex task. Which combinations of these certainty, uncertainty and governance conditions could be effective in controlling the fast transmission of the novel coronavirus? How to design governance strategies considering the ever-changing environment?
Previous research has analyzed these questions primarily from a governance strategy perspective. Different institutional arrangements and cultural orientations lead to different governance strategies [10]. Equifinality occurs when the deployments of various governance strategies in different countries produce similar successes [11,12]. For example, capable politicians, a high-trust society, a strong economy, and a low population density were conducive to effective government measures against the pandemic in Norway [13]. In the case of Japan, solid governance, individual behavior, and the health care system were all important factors in the country’s success in controlling the virus spread [12]. It is also found that the early and anticipatory approaches to containing the virus are also proven to be superior to the late and reactive strategies [14,15]. The uncertainty inherent in the complex governance tasks has been mentioned multiple times in the current literature [16,17,18], but it has not yet been the focus of previous studies.
The government’s assessment of certainty and uncertainty would have an impact on the governance responses, which in turn could affect the effectiveness of the complex task. The mismatch between (un)certainty and governance reveals a lack of understanding of the complex tasks in public management. The uncertainty caused by the virus has put a strain on one-size-fits-all government measures that are implemented without much consideration of the realities that they face. The governments of different countries rarely share the same situation in fighting the COVID-19 pandemic, so how they make policy choices within their own governance configurations may be reflected in the final results on curbing the virus’ spread. The purpose of this complex task is to improve the effectiveness of governance, that is, how quickly the increasing rate of newly added cases is slowed and how many individuals are infected compared to the total population in one province.
The plural and conditional advice from experts could be a solution to this mismatch problem, but a better suggestion is to reconcile the science-based evidence and appraisal feedback [5]. For government managers, even when they obtain comprehensive evaluations, they still need to arrange the configurations according to their local conditions, and the outcome of these governance efforts is very likely to be uncertain. We look into this issue by constructing a framework to identify the configurations of matching certainty, uncertainty and governance that the provincial governments of China take in the battle against coronavirus in the first two months of the COVID-19 outbreak in 2020.
We use fuzzy-set qualitative comparative analysis (fsQCA) to reap the benefits of both qualitative and quantitative methods in investigating configurations that could indicate certainty, uncertainty, and governance combinations in the complex task of fighting COVID-19 in China. The contribution of this research is, theoretically and practically, to understand the complex causality of effective government response to the fast-spreading virus in China, which could aid the government in improving governance capabilities when facing similar situations in the future. Methodologically, we take data from official reports, statistical yearbooks and public data platforms and use the fsQCA as our primary approach. This paper builds on and expands on a prior study on government policy control against the pandemic [19] and a comparison of country risk and responses to COVID-19 across 25 countries using QCA [15].
This paper consists of the following sections. First, a contextual and theoretical framework is outlined. Then, data collection, methods, and sample selection are presented, followed by a discussion and a conclusion.

2. Context and Theoretical Framework

2.1. Context: A Complex Scenario of containing COVID-19 in China in the Early Stages

The situation in which China’s government is attempting to prevent and control the novel coronavirus is unique. First, in the early stages of transmission, the uncertainty for public management in China is expected to be higher. “The virus was first identified as the cause of a cluster of cases of severe pneumonia in Wuhan, to date it is uncertain from where the first cases originated” [20]. Second, the governance is timely and transparent with a fairly good performance. On 12 March 2020, the newly added infected cases dropped to only 11 cases (8 domestic cases and 3 imported cases). It was the lowest at this stage, according to the data from the National Health Commission of China (NHCC). Since then, the spread of COVID-19 has been slowed, and the number of new cases has remained low, despite multiple instances of small- and medium-scale transmission, such as the Nanjing airport cluster transmission in July 2021. As a result, the time length to roughly accomplish this complex task for Chinese provincial governments is only 51 days from 21 January 2020, when the National Health Commission of China (NHCC) began updating the epidemic information daily via their websites on 21 January 2020 [21]. Third, China is a big country with vast economic and infrastructure disparities between provincial administrative regions. Provinces, autonomous regions, municipalities and special administrative regions (SAR) are all included in the provincial regions. Municipalities are densely populated metropolitan cities such as Beijing and Shanghai. The provinces are so divergent with both the advanced eastern provinces like Jiangsu, Zhejiang and Guangdong and the less-developed western provinces like Gansu and Qinghai. Autonomous regions, such as Ningxia and Guangxi, have more ethnic groups. The SARs include Hong Kong and Macao.

2.2. Theoretical Framework: A Match of Certainty, Uncertainty and Governance

Complexity theory offers us a systematic perspective to examine government operations and responses to governance tasks [22,23]. The term “complexity” refers to a particular dynamic or movement in time that is paradoxically stable and unstable, predictable and unpredictable, known and unknown, certain and uncertain, all at the same time [24]. The importance of complexity thinking for public managers performing governance duties cannot be overstated. The governance task often relates to the “dynamic system” of so many interconnected social issues. In this system, even slight changes are amplified over time [25]. The dynamic of stability and instability complicates a task, as a given input does not always result in a given outcome [24]. As a result, a reductionist approach to evaluating policy performance has been criticized for oversimplifying the cause-and-effect relationship [26].
However, the instability of the complex governance system does not rule out the possibility of increasing effectiveness and allocating resources more scientifically. Practitioners can improve their effectiveness if they “complicate” themselves by increasing their understanding of complexity and matching the complex situation [27]. How can you make sense of a complicated situation? Most often, what is unknown in the process of change is frequently a barrier to the specialists and decision-makers, and the concealed potential risk is “uncertainty”, which refers to the limited knowledge to handle the threats [28]. The hard effort is to recognize this hiddenness and the inside causal logic [29]. A matrix based on knowledge about possibilities and probabilities is proposed to help them deepen their understanding of risk and acquire more knowledge about uncertainty, ambiguity and ignorance by using both quantitative and qualitative methods [5].
Though it is difficult to assess the effectiveness of the governance strategy, results-based evaluation may not be fair in an unforeseeable environment, and process-based governance should be considered [30]. Governments also need to cope with the changes incurred by time and space [31,32] and should be well adapted to changing circumstances. In the 2009 A/H1N1 public health crisis, for example, the governments needed to develop agility when facing pandemic uncertainty [33]. The government’s adjustments should also be proactive and could be assorted into seven system interventions for public service organizations by Meadow’s work, including value-based interventions, finding direction and core purpose, intervening in self-organization, intervening in internal bureaucracy, strategic information management, interventions for change and crisis, and routine resource interventions [9].

2.2.1. Certainty and Uncertainty in the COVID-19 Crisis in China

Certainty is something we can control but not easily improve in a short time. Information publishing and medical diagnosis and treatment are the most essential parts of this complex virus-fighting task. The information infrastructure is one certainty for the governments to publish accurate information and to curb the spread of rumors. The virus’s terror might readily be mishandled to instill fear in the public during an infectious disease outbreak. One of the most prominent examples is the panic buying that occurs in supermarkets as customers rush to purchase daily essentials as a result of the misinformation spreading online [34]. This is likely to coincide with the public’s worry. Another major duty for governments in this special period is to prevent groundless rumors and disseminate accurate facts. Good infrastructure, if utilized properly, could be a very powerful tool in addressing this emergency.
The other certainty is the medical condition. China uses the strategy of early discovery, diagnosis, treatment and quarantine to curb the spread [35]. All of the procedures need medical infrastructure. For example, the pressure from the shortage of hospital beds was relieved by the building of Huoshenshan hospital with 1000 beds and Leishenshan hospital with 1600 beds. The two new hospitals were built in around ten days for the treatment of confirmed cases [36]. In many provinces, governments also built or transformed special wards for potential patients. The medical conditions are also reflected in the number of hospitals and medical staff. To a very large extent, the testing capability and the maximum number of patients accommodated at the same time depend on this medical infrastructure.
The unknown number of the outflow population from Wuhan before the lockdown caused uncertainty in this complex task. In the period when NHCC updated its report daily and the emergency level was rising, people outflowing from Wuhan and Hubei province to other parts of China attracted a lot more attention. All provincial governments took measures to sort through the influx of individuals from Wuhan and Hubei. Although some western media may be critical of this governance mechanism, it is perfectly reasonable in an emergency. According to a prior study, the number of people flowing out of Wuhan was proportional to the number of cases reported in other provinces of China [37]. Therefore, quarantining these people at home for 2 weeks was good for the health of the general public. On the other hand, if all the inflowing people from Wuhan and Hubei were not required to stay at home, and the governments provided no support for their basic needs, the infected people who did not show symptoms could pose a hazard to the entire population. The healthcare system would collapse after everyone is diagnosed. Therefore, “the medical and information infrastructures” are a certainty, while the uncertainty is “spreading control difficulty”.

2.2.2. Governance Capabilities

In China, modernization of the national governance system and governance capacity was proposed in 2013 and has been implemented since then, which could be a good prerequisite for addressing the looming public health problem. The five elements of governance capability consist of collective action, coordination, resilience, learning and resources [38]. Bear this in mind, governance capabilities are demonstrated as the emergency response capability, collective and cooperation capability, professional leaderships, and capability of learning from the past in this article by using “the governance response speed”, “mutual support and help”, “expertise of the health director” and “the past experience of SARS in 2003” indicators. First, the Chinese governance system attached importance to response speed. When the public health crisis emerged, the first level of emergency response started very fast, but still not at the same pace. Second, the advantage of coordination and cooperation with unified leadership was demonstrated. For example, the governance system necessitates quick action to form a special leadership team to coordinate epidemic control in each province and provide support to Hubei. A “one province to one city in Hubei” assistance matching plan was implemented, in which each province or several provinces offered medical and emergency goods support to one municipal city in Hubei province, for example, Jiangsu province to Huangshi Prefecture City, Hubei province. However, it appears that mutual assistance is insufficient. For example, Dali, a city in Yunnan province, expropriated medical supplies heading to Chongqing [39]. Third, the expertise of some provincial health commission directors seemed not very appropriate given their educational background and past working experience. This also shows whether or not this role was critical in the health-emergency-management system prior to the outbreak. Finally, the Severe Acute Respiratory Syndrome (SARS) epidemic, which ended in 2003, appears to have left little experience for this fight. The public health infrastructure for emergency use had not been matched with fast-growing economic development. Even in Beijing, Xiaotangshan hospital, which served as a temporary medical center for SARS patients in 2003, was dismantled in 2010 [40].

2.2.3. Results-Based Effectiveness of Governance

The effectiveness of governance is judged by the results of the governance system [30]. The competition for the provincial governments exists in many aspects. Provincial governments were competing for speed and accuracy in publishing the infected case reports day by day to keep the public informed immediately. The infected cases were most often published anonymously in newspapers and on the web, which includes their false names, the community they live in, and a description of the places they visited in the past two weeks. Thus, the results of effectiveness of governance were satisfying on the whole. The domestic newly infected cases were controlled in only 51 days, and the number has remained relatively low. This is closely related to how provincial governments compete to slow down the increasing trend of confirmed cases and reduce the mortality rate. Considering the total population, the proportion of infected cases is very small for most provinces.
The effectiveness is measured by how quickly the increasing rate of newly added cases is being lowered, and how many people are infected in relation to the overall population of a province. Thus, “the length of time it takes to see the turning point”, “the ratio of infected people to the population” and “the ratio of the peak number to the population” are used to assess the outcome.
Therefore, based on the literature and public management practice in China, we construct a conceptual model of how the matching of certainty, uncertainty and governance conditions would lead to high and low effectiveness of governance in the case of the government controlling the COVID-19 pandemic in China, as presented in Figure 1.

3. Methods, Data and Case Selection
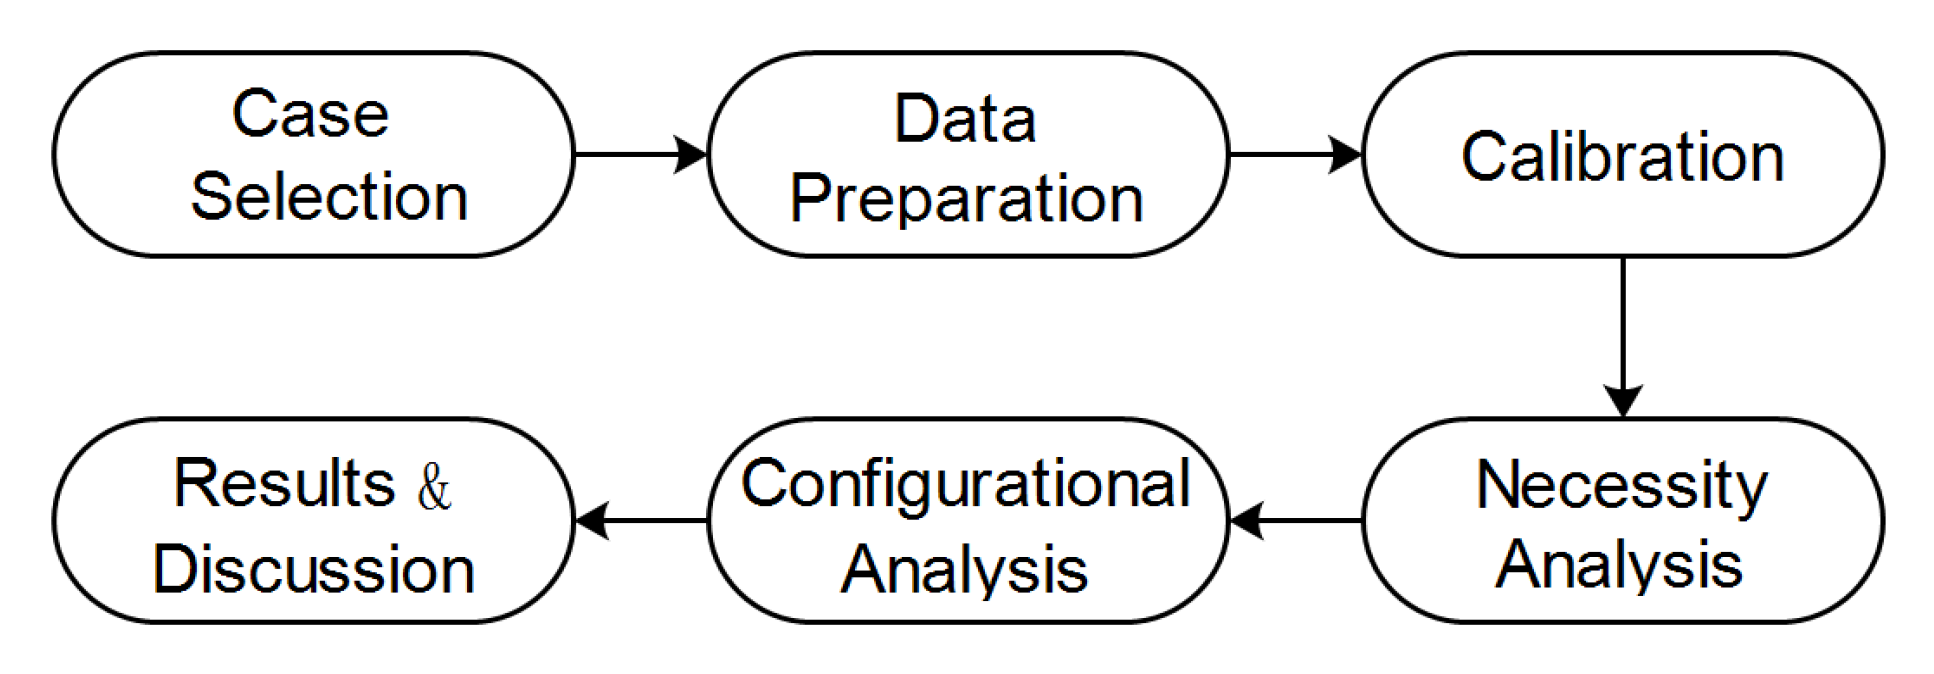
The fuzzy set Qualitative Comparative Analysis (fsQCA) is applied in this study to see which configurations of certainty, uncertainty and governance capability could be excellent combinations to improve the results-based effectiveness of governance.

3.1. Methods

The fsQCA method has several advantages for this study. First, case-based approaches have been advocated in explaining the complex causal relationships, especially for those small- and medium-sized samples [41]. We regard each province in China as an in-depth case, which aligns with QCA’s case-centered advantages in understanding complex phenomena. QCA is also suitable for the number of cases in this research, which rules out methods that require large samples. Second, fsQCA could lead to a better understanding of condition combinations compared with crisp set QCA (csQCA) [42]. The introduction of a fuzzy set to QCA brings the advantage of keeping more valuable information than csQCA, through which the original dataset calibrates to a new dataset with either 0 (non-membership) or 1 (full membership). For fsQCA, the transformation of the data produces continuous scores from 0 to 1, with 0.5 as the crossover point, so that the degree of membership is developed as predefined, such as high, low and in-between [43,44]. Third, fsQCA provides causal combinations of the conditions, or “recipes”, which could be good for practical use. “QCA is very suitable when the relationships between conditions and outcomes are not presumed and can be used to build theory in the complex environment of construction” [45]. This helps to understand the complex task of containing COVID-19 for the government, which involves numerous unknown situations and outcomes.
The analysis procedure follows six parts, as shown in Figure 2. The first step is to conduct a case selection to keep as many cases as possible based on the characteristics of cases. The second step is to collect and clean the data. Third is a calibration according to Ragin’s calibration method. Then follows necessity analysis to find whether there are single conditions necessary. The fifth step is to conduct a configurational analysis by focusing on the truth table and then finding the paths that lead to both high and low outcomes. The last step is to analyze the results. It explains equifinality by demonstrating that different combinations of certainty, uncertainty and governance capabilities result in the same level of success or failure.

3.2. Case Selection

In this research, each province is treated as a separate case, but Hubei Province, Taiwan Province, Hong Kong SAR and Macao SAR are not included in the selected cases for the following reasons. First, each of these regions has chosen distinct governance measures in this containing practice. For example, Wuhan and its surrounding Hubei Province were under the management of the Special Guidance Team from the central government of China. The measures are highly likely different from the other provinces. Almost all the other provinces were matched to help the prefecture-level cities in Hubei, by sending medical teams, vegetables, food and so on. However, all the other provinces were only giving instead of taking. Second, in China, the virus was first observed in Wuhan; hence, the severity of the virus’ spread in Hubei province was different from the rest. Third, Taiwan Province, Hong Kong SAR and Macao SAR are special governance regions. The governance measures differ from those in other provinces. Therefore, the selected cases in this research are 21 provinces, 5 minority autonomous regions and 4 province-level municipalities. The number of selected cases is 30, which complies with the minimum requirements of fsQCA of at least 15 cases [43]. Figure 3 shows the total number of infected domestic cases in these regions until 12 March 2020.
According to the description of the total number of confirmed cases after subtracting the number of imported cases in this period, more than 1000 people were infected in Guangdong, Henan, Zhejiang and Hunan, while in Tibet, Qinghai, Ningxia, Inner Mongolia, Xinjiang, Gansu and Jilin, there were fewer than 100 infected people. Among the four province-level municipalities, the number of infected people in Tianjin was less than a quarter of that number in Chongqing, one-third of that number in Beijing, and half of that number in Shanghai.

3.3. Measures, Indicators and Data

Table 1 presents the measures of seven conditions and the outcome in this research. Most conditions are composite ones with more than one indicator. The advantage of composite indicators as conditions and outcomes is more impartial and reliable. The most common practice in QCA is that the intermediate-N cases from 10 to 40 are best chosen from 4 to 7 conditions [46]. Therefore, 30 cases and 7 conditions in this research conform to the requirements. Among all seven conditions, “Information Infrastructure”, “Medical Infrastructure”, “Governance Response Speed”, “Expertise of the Provincial HC Director” and “SARS experience” are possibly positive conditions for the outcome, while the other two, “Inflow People from Wuhan” and “Support Wuhan and Hubei”, are negative conditions. Most provinces dispatched medical personnel to assist Wuhan and Hubei, which is good for the overall situation but may be detrimental to their province temporarily. Therefore, “support for Wuhan and Hubei” is likely to be a negative condition for the provincial effectiveness of governance for other provinces.

3.3.1. Outcome: The Effectiveness of Governance

The effectiveness of governance (EOG) is a results-based outcome that is measured by three indicators: “the length of time it takes to reach the turning point”, “the ratio of infected people to the population” and “the ratio of the peak number to the population”. The first indicator of time duration is of much relevance to the start of governance effectiveness, which could disclose the time cost of this complex governance task. The second and third indicators show the proportion of infected people to the entire population, which could reveal the infected cost. The reason is that the purpose of the virus-fighting task for governments is to occupy less time and lower the infected population. Unlike prior research on government effectiveness and governance efficiency, which used Likert-scale questionnaires or administrative indicators, this design focuses more on complex task [47,48], but it is similar to the idea of performance between service delivery and its results [49].
The data is collected from a variety of sources. The number of infected cases is obtained from the websites of the provincial health commission. The population data for each province is from the China Statistical Yearbook (2020).

3.3.2. The Conditions of Certainty

The information and medical conditions represent certainty in this article. According to the Information and Communications Technology Development Index by the International Telecommunications Union, the information infrastructure is measured by “the provincial telecommunication business turnover, the number of fixed telephone users, mobile phone users, and internet users per 10,000 population in the province”. These indicators could reflect information communication in a single province, and the information instruments are often used by the governments in combating the pandemic. By following the practice of Sustainable Development Goals Target 3.c [50], the medical infrastructure is measured by “the number of hospital beds, doctors and nurses in the province per 10,000 population in the province” and “the number of tertiary hospitals in the province”. The former provides statistics on average medical conditions, while the latter provides the maximum testing capacity for a single province. This is because the COVID-19 nucleic acid test could only be performed in tertiary hospitals in the early stages of the epidemic. That is why this number does not consider the average population. The greater the number of tertiary hospitals in a province, the greater the testing capacity. The data is collected from the provincial statistical yearbooks (2019), China Statistical Yearbook (2020) and China Healthcare Statistical Yearbook (2020).

3.3.3. The Condition of Uncertainty

The uncertainty stems primarily from the spreading control difficulties. Based on the “Baidu Migration” Big Data Platform (https://qianxi.baidu.com, accessed on 20 December 2022) and the population density of the province, it is measured by the relative ratio of the inflow population from Wuhan into the province from 10 January to 23. The “relative ratio of the inflow population from Wuhan” indicator represents the proportion of the outflow population from Wuhan in one province to the total outflow population from Wuhan. Population density is defined as the ratio of the provincial population to the unit of area (square kilometers) in each province. The data on spreading control difficulty is retrieved through the “Baidu Migration” platform and collected from the provincial Statistical Yearbooks (2019).

3.3.4. The Conditions of Governance Capability

The governance capability is measured by “governance response speed”, “expertise of the provincial health director”, “support for Wuhan and Hubei” and “SARS experience”. The governance response speed is a comprehensive indicator that reveals how quickly and how much effort provincial governments put in to respond to potential risks and how much effort they take. This includes the time length of the provincial governments’ responses to the national health commission’s daily updates, the time length between the first news conference and the first case reported in the province, and the number of news conferences on the fighting in the period. The “expertise of the provincial health director” is used to highlight the importance of the job position in the government before the outbreak. The “support Wuhan and Hubei” indicator is the number of medical workers to reinforce the local medical capabilities. This reflects how much help the other provinces give to the most serious virus-spreading province in China and how the provinces react to the central government’s arrangements. The “SARS experience” is assessed by the overall number of confirmed cases in the 2003 SARS epidemic. The more confirmed cases in 2003 may leave more attention and experience on the provincial public health governance through the years and even leave mobile cabin hospitals such as Xiaotangshan Hospital in Beijing. Therefore, the province that experienced a serious epidemic in 2003 may have a deeper memory and more expertise to formulate an emergency public health plan in advance. This conforms to the Chinese management logic that “a fall into the pit, a gain in your wit”, meaning, one should draw a lesson from poor performance in the past.
The data is collected from all the provincial health commission’s websites, provincial government websites, the introduction of health directors’ profiles, news reports of the supporting medical team returning home, and the Ministry of Health webpage with daily updates on SARS in mainland China [51].

3.3.5. Descriptive Analysis and Calibration of Sets

The data preparation process consists of the following steps. First, it is to collect the original data and calculate the indicators. We first collect the data and keep the original value in the dataset. The descriptive analysis of all indicators is presented in Table 2. Second, it is to normalize the data. The data point was transformed from 0 to 1 to normalize the difference of the unit by the Min-Max method. Third, the average of the indicators as the value of the conditions and outcome for the calibration. The crossover point in the calibration is the average value and all these normalized values were calibrated based on this. The range takes into consideration the level of each indicator. All the points are transformed into 0.05, the average value (crossover point), and 0.95 to indicate whether this point is “fully out” (less than 0.05), “more out than in” (0.05 to the average value), “more in than out” (the average value to 0.95), or “fully in” (more than 0.95) for each indicator [42,43].

4. Results

In this section, we present the results of fsQCA analysis to find which combinations could be effective in improving the effectiveness of governance in the fight against the coronavirus. First, necessity analysis is done to assess whether a condition is necessary for the outcome variable. Second, sufficiency analysis determines if the cause can produce a certain outcome by itself [52]. Configuration analysis is conducted to explain which combinations of conditions could be effective or ineffective.

4.1. Necessity Analysis

The results of the necessity analysis are presented in Table 3. This test is done to find whether the conditions are highly necessary for the outcome. This study is made to identify conditions that are required for the effectiveness of governance in the fight against the coronavirus in China, including certainty, uncertainty and governance conditions.
The consistency value of a condition in the necessity analysis has a threshold of 0.9 [53,54], and Table 2 reveals that ~SCD and ~SS are two necessary conditions. The ~SCD (low SCD) is necessary for EOG with a consistency value of 0.909. The ~SS is a necessary condition for both high EOG and low EOG, with 0.924 and 0.899, respectively. That is, the condition of low spreading control difficulty is necessary for the effectiveness of governance. However, the low SARS experience is necessary for both the high and low effectiveness of governance. Therefore, we drop the SARS experience condition because it does not appear to be relevant to the outcome.

4.2. Truth Table Analysis

In this research, all the calibrated variables are used in the calculation, and Table 4 presents the results of the truth table. The data matrix of six conditions, the number of cases in this configuration, and its relative raw consistency are the columns from left to right. The configurations whose case number is less than 1 are removed. We employ 0.8 as our threshold for the judgment of membership of EOG [55]. If the raw consistency is more than 0.8, the relative EOG is assigned “full-membership”, otherwise “non-membership”. An intermediate solution is presented after the truth table analysis. Intermediate solutions could be good enough as the final solution since they are between parsimony and complexity based on substantive and theoretical knowledge [55]. Logical remainders are the rows without cases with membership scores higher than 0.5 [54]. This reveals limited diversity in social research [56]. The complex solution ignores any logical remainder, whereas the parsimonious solution includes all of them. The intermediate solution strikes a good balance in including those simplifying assumptions [57]. The robustness of the fsQCA results is reflected by the solution consistency threshold.

4.3. Configurations

The intermediate solutions are presented in Table 5. There are seven configurations in the intermediate solutions of the fsQCA output, which cover 84.8% of all cases. All the configurations are sufficient to increase the effectiveness of governance in 80.1% of cases.
Seven configurations could be incorporated into two paths. In Path 1 (~RS*~SCD*MI, ~RS*MI*II, ~RS*~SCD*~SP), configurations 1a, 1b and 1c lead to high effectiveness of governance though the response speed is low. Provinces in configurations 1a and 1b have very good infrastructure, which is beneficial to a better effectiveness. The advantage of provinces in configuration 1c is that the relatively low spreading control difficulty and less mutual support to Wuhan and Hubei. In Path 2 (EP*~RS, EP*~SCD*~SP, EP*~SCD*~MI, EP*~SCD*II), all the configurations attach importance to the expertise of Health Directors. Configuration 2a indicates that low response speed and good expertise of Health Directors could lead to high effectiveness of governance in the provinces with low spreading control difficulty. Configuration 2b, 2c and 2d also share the absence of spreading control difficulty.
We use the concept of asymmetric causality to assert that social phenomena are the results of asymmetric conditions [43,58]. That is, the causal relations are asymmetrical, and this is much closer to the social reality. The configurations leading to high EOG and those leading to low EOG could be different. Therefore, we also ran the test on which conditions lead to the negation outcome. This could help explain why the low outcome occurs. In the fsQCA methodology, the output of a negative outcome test could not be used to explain the inverse of the positive outcome test [59]. Thus, this research also presents the output of the intermediate solutions leading to low effectiveness of governance in Table 6. There are five configurations that contribute to low effectiveness of governance, covering 83.0% of cases. These are sufficient to reduce the effectiveness of governance in 82.1% of cases. The configurations are SCD, RS*SP, ~II *MI*EP, II*~MI*RS*~EP and II*~MI*~RS*EP.
There are two paths leading to low effectiveness of governance. Most cases are in path 1 (SCD), including Henan (0.96, 0.73), Shanghai (0.96, 0.78), Hunan (0.82, 0.72), Anhui (0.7, 0.77), Guangdong (0.69, 0.73), Beijing (0.68, 0.92), Jiangsu (0.64, 0.23), Tianjin (0.56, 0.46), Jiangxi (0.64, 0.94), Shandong (0.56, 0.96), Zhejiang (0.53, 0.97) and Chongqing (0.52, 0.86). The other four configurations constitute path 2. The great investment of mutual support in Wuhan and Hubei leads to lower effectiveness of governance though response speed is high in configuration 2a (RS*SP). The RS*SP configuration includes the cases of Guangdong (0.9, 0.73), Zhejiang (0.78, 0.97), Shanghai (0.65, 0.78), Chongqing (0.64, 0.86), Shandong (0.61, 0.96), Heilongjiang (0.6, 0.81), Shanxi (0.59, 0.24), Sichuan (0.56, 0.2), Shaanxi (0.56, 0.28), Fujian (0.53, 0.28) and Anhui (0.52, 0.77). The disadvantage of configuration 2b (~MI*II*RS*~EP) is the poor expertise of health director and poor medical infrastructure. This configuration includes the cases of Chongqing (0.6, 0.86) and Qinghai (0.54, 0.16). The configurations 2b and 2d (~MI*II*~RS*EP) are lack of medical infrastructure, which may cause low effectiveness. The case of Ningxia (0.54, 0.73) is in the above configuration. The configuration 2c (~II*MI*EP) is lack of information infrastructure.
The contradictory cases in the low EOG configurative sets are the cases of Jiangsu, Tianjin, Shanxi, Sichuan, Shaanxi, Fujian, Inner Mongolia and Qinghai, and the calibrated outcome values are 0.23, 0.46, 0.24, 0.2, 0.28, 0.28, 0.14 and 0.16, respectively. These values are in the negation of EOG, so the smaller the value, the higher the outcome of EOG should be. However, these cases are in the low EOG configurative sets, so this demonstrates that some cases cannot be explained by the configurations [60].

5. Further Discussion on the Early-Stage Sustainable Epidemic Governance

Early-stage epidemic governance strategies are vital for provincial governments to make arrangements for containing the fast-spreading virus and keeping the society operational. We intend to provide reflections on the previous governance strategies and identify the deficiencies for future reference.

5.1. Sustainable Governance under High Certainty Conditions

It makes sense that most configurations with high certainty conditions lead to high outcomes, such as “~RS*MI*II”, “~RS*~SCD*MI” and “EP*~SCD*II”. Jiangsu is in the case of the configuration “~RS*MI*II”. Jiangsu has advantages of medical and information infrastructure over many provinces in China. Although it initiated the first-level emergency response plan not very rapidly and the news conference to publish new updates was barely visible, the obvious advantage in the physical conditions could be one of the main reasons to achieve high effectiveness of governance. Jiangsu has 74 tertiary hospitals, placing it fourth among all provinces in this study, which determines how large a province’s testing capacity is. Doctors per 10,000 people and hospital beds per 10,000 people are 91.82 and 61.05, respectively. Furthermore, a solid information infrastructure could enrich medical resources by extending the traditional medical services to online and offline services. For example, e-hospital and online outpatient services on both mobile applications and the internet lessen the pressure from people with a fever who may not have COVID-19 and other panicked people. The previous research also demonstrated that travel restrictions against people from certain regions could have an impact [61], but the restrictions are widely found in the early-stage practices of provincial governments. This research extends the analysis by looking for the factors leading to different governance outcomes. The other two configurations appear to benefit from the low spreading control difficulty. The case of Liaoning with good medical infrastructure is in the “~RS*~SCD*MI” configuration, while the cases of Fujian, Shaanxi and Ningxia with good information infrastructure are in the “EP*~SCD*II” configuration. In the early-stage period, the cases of high certainty conditions are comparably easy to achieve success when combined with positive policy choices. The social functioning measures have positive impacts on sustainable governance. For example, industrial production recovered because of the “zero-COVID” policy after the first two weeks. Moreover, emergency supplies such as masks and detection kits were produced nonstop for 24 h. Further, these measures maintain smooth supply and transportation management for the daily food supplies and fast delivery operations. These social functioning measures keep the governance system sustainable.

5.2. Sustainable Governance under Low Certainty Conditions

The lack of medical or information infrastructure in a province most often leads to low outcomes, which could validate the configurations of “~II*MI*EP”, “~MI*II*RS*~EP” and “~MI*II*~RS*EP”. However, a configuration of “EP*~SCD*~MI” is unanticipated since one province with poor medical infrastructure attains good performance. It is noticeable that the configurations with low certainty are not low in both medical and information infrastructure. In the “~II*MI*EP” configuration, the examples of Heilongjiang, Shandong and Inner Mongolia only have a lack of information infrastructure while the medical infrastructure is abundant. It appears that a lack of information is a factor in the poor outcome. The other two conditions are relatively good in these provinces. For example, the number of tertiary hospitals in Heilongjiang is 73, ranking 5th among all the provinces. However, in “~MI*II*RS*~EP” and “~MI*II*~RS*EP” combinations, the shortage of medical infrastructure appears to explain the poor outcomes in the cases of Chongqing, Qinghai and Ningxia to some extent. Another key factor is the low expertise of the HC director. Provincial decision-making teams consist of the HC director, social management directors, directors of centers for disease control, and others, but the HC directors are generally considered the head of the team. The weight of their advice is possibly higher than that of the other experts, which will further reflect the overall expertise of the team. For example, the Health Directors of Qinghai and Chongqing have master’s degrees in business and economics rather than in health-related majors. Their previous working experiences are also not related to healthcare. It is more difficult to keep the operation of social functions sustainable in provinces with poor physical conditions. These governments implemented a lot of policies to help people and organizations to endure difficult times. The measures include refunding 6 months’ social insurance charges for enterprises without job cuts, exempting tax for small and medium enterprises, and canceling the transportation tolls for raw materials and livelihood.

5.3. Sustainable Governance under High Uncertainty Conditions

Many provinces perform poorly in the outcome because of high difficulty in spreading control, including Henan, Shanghai, Hunan, Anhui, Guangdong, Beijing, Jiangsu, Tianjin, Jiangxi, Shandong, Zhejiang and Chongqing. Two contradictory cases are Jiangsu and Tianjin, because they are, in fact, attaining good performance in the outcome. However, we could not ignore the higher containment difficulties in these regions. Most of the other cases are bordering Hubei province, so there was a large number of people inflowing from Wuhan from 10 to 23 January 2020, the lockdown date for Wuhan. From the Baidu Migration Platform, the relative ratios of Henan, Hunan, Jiangxi, Anhui and Jiangsu are 5.69%, 3.48%, 2.12%, 2.27% and 1.46%, respectively. Beijing and Tianjin are highly populated megacities with close economic connections with Wuhan and Hubei. Several provinces, despite the high level of uncertainty, continue to provide strong support to Wuhan and Hubei. Jiangsu has dispatched 3096 medical personnel to assist Wuhan and Hubei. In the configuration of “RS*SP”, Guangdong, Zhejiang, Shanghai, Chongqing and Shandong sent 2484, 2018, 1649, 1636 and 1794 medical personnel, respectively. This configuration demonstrates that mutual support in public health threats is good in achieving the overall performance of governance but should be provided according to their own capability in their own crisis. The social functioning measures under high uncertainty conditions are much relevant with the inflow population. The grassroots officials sent notice to the people from the “high risk” regions so that they quarantined themselves at home, monitored body temperatures daily, and were assigned livelihood goods for them. These measures can keep the potentially infected people at home and reduce the possibility of fast spreading. Governments made arrangements for basic livelihood assignments and delivery for these self-quarantined, potentially infected people. When the people were tested negative, they were transferred to the cabin hospital for professional care.

5.4. Sustainable Governance under Low Uncertainty Conditions

Most cases under a low uncertainty environment lead to positive outcomes (EP*~SCD*~SP, ~RS*~SCD*~SP, ~RS*~SCD*MI). The configurations of a positive outcome are consistent with the hypothesis that spreading control difficulty is a negative condition in promoting the effectiveness of governance. This is also supported by the results of the necessity analysis. ~SCD is a necessary condition leading to high EOG with a consistency value of 0.909, more than the threshold of 0.9. Low uncertainty conditions make for a very good environment for governance. Tibet, Xinjiang, Gansu, Guizhou, Liaoning, Guangxi, Ningxia, Jilin and Hainan cases are in this group. In these provinces, the infected cases are very few. The total number of infected cases is only one in Tibet at this stage. Most of these provinces are in the border area of China and have no close economic relations with Wuhan. The first case in these regions was reported very late, so the response speed is a little slow. However, it does not mean the insignificance of response speed. This is related to the first case reported in the province. According to the configurations, the measures to keep the society operating smoothly could be found in the “~RS*~SCD*~SP” and “EP*~SCD*~SP” configurations. Inner Mongolia and Guangxi were sending 849 and 962 medical personnel, respectively, to support Wuhan and Hubei. This would be a little lower than most provinces, but is quite appropriate for their medical situation. On the other hand, Jiangsu, Guangdong, Shanghai, Zhejiang and Shandong showed strong support despite the high level of uncertainty in their individual regions. In the midst of this emerging public health crisis, all the provinces were pulling together, yet the less support they gave others, the better they would face their dilemma of resource scarcity. This could be a useful finding for the central and provincial governments to improve the overall support arrangements.

6. Conclusions and Limitations

6.1. Conclusions

This study examines the governance capabilities under the certainty and uncertainty conditions in achieving high and low effectiveness of governance in the early-stage pandemic containment in China. We prefer to adopt a results-based performance evaluation as the outcome since it is more in line with the managerial practice in China. With the application of fsQCA, we reflect the configurative set at the province level. The findings can be summarized in the following points. First, the configurations offer an explanation of the phenomenon that poor physical conditions could have a higher effectiveness of governance. Although the overall quasi-lockdown and travel restrictions had been implemented in almost all provinces, governance capabilities could be highlighted by the good expertise of Health directors and reduced mutual support. Second, good information and medical infrastructure could be highly likely to have a high effectiveness of governance, but could not guarantee a good outcome. The lack of either information or medical conditions, if response speed is slow or the expertise of the health director is poor, makes it possible to have poorer effectiveness of governance. Third, the necessity analysis reveals that the SARS experience in 2003 seems not to have much impact on governance effectiveness. Provinces with little or no SARS experience are required for both high and low performance, whereas those with high SARS experience are not necessary for high performance. It demonstrates that, to some extent, prior lessons and experiences are not taken seriously in the emergency public health system. On the other hand, from the other side of the point, provinces could attain high performance even without the SARS experience.

6.2. Contributions

The contribution of this study could be in four aspects. Firstly, we construct indicators to analyze the complex matches of the certainty, uncertainty, and governance capabilities conditions leading to high and low effectiveness of governance on the public health crisis at the provincial level. These findings enhance the understanding of the complex emergency response in the country with strong governments [3,14,62,63]. Secondly, the analysis of certain and uncertain conditions in the early-stage COVID-19 outbreak contributes to how to keep public health governance sustainable [7,9,24,64,65]. Thirdly, the more objective dataset, collected from public databases and open data on government websites, is a complement to the critique of the subjectivity of the fsQCA technique in the case analysis. Furthermore, the certainty and uncertainty conditions could be seen as “control variables” in the tests. Although they are part of the configurations in the results, we group the configurations according to them in the discussion. Lastly, one possible contribution to government management practice would be to reflect on China’s existing emergency public health system to identify the potential governance deficiency for future improvement. The asymmetric causality of fsQCA offers us diverse combinations of certainty, uncertainty and governance capability, which help us understand what governments should do better in achieving fast and effective virus-spreading control in various provincial contexts. This would also aid the central and provincial governments in developing a well-thought-out contingency plan in the event of a future public health emergency [10,15,48,66].

6.3. Limitations and Future Research

There are potential limitations of this study. The major limitation of this study is that it is difficult to come up with “fair” criteria for evaluating the effectiveness of governance when considering the complex nature of the task of virus containment. We prefer to use a multiple-indicator metric that reveals how quickly we observe a turning point and how many people are infected in the overall population of a province. This is very similar to how governance evaluation is done in practice in China. It is comparable to the concept of efficiency in economics. Then, we elucidate the causal links from a more practical perspective. In addition, our definition of the outcome is relevant to the theoretical goal of finding the right balance of certainty, uncertainty and governance in a complex task for different provinces. Furthermore, the limitations are also derived from the data availability and methodology. For example, the maximum nucleic testing capacity in one province is not available, so we use the number of tertiary hospitals because they are the only designated hospitals to do this test. The configurations of logical remainders cannot be found in all the empirical evidence, and limited diversity exists. Future research could remedy the issues when such data is available.

Author Contributions

Conceptualization, C.Y. and X.M.; Methodology, C.Y.; Investigation, X.M.; Writing—original draft, C.Y.; Writing—review & editing, C.Y. All authors have read and agreed to the published version of the manuscript.

Funding

This research was funded by the Jiangsu Social Science Funds for Young Scholars (grant number 21GLC018) and Jiangsu Postdoctoral Research Funds (grant number 2020Z096).

Institutional Review Board Statement

Not applicable.

Informed Consent Statement

Not applicable.

Data Availability Statement

The data used during the study are available from the corresponding author by request.

Conflicts of Interest

The authors declare no conflict of interest.

References

  1. Babatunde, A.; Joanna, F.; Serge, K.; Laurel, P. Leaving No One Behind: Impact of COVID-19 on the Sustainable Development Goals (SDGs); United Nations Development Programme: New York, NY, USA; Frederick, S., Ed.; Pardee Center for International Futures: Denver, CO, USA, 2021. [Google Scholar]
  2. Byrne, D.S. Complexity Theory and the Social Sciences: An Introduction; Psychology Press: London, UK, 1998; ISBN 978-0-415-16295-1. [Google Scholar]
  3. Duit, A.; Galaz, V. Governance and Complexity: Emerging Issues for Governance Theory. Governance 2008, 21, 311–335. [Google Scholar] [CrossRef]
  4. Wynne, B. Uncertainty and Environmental Learning 1, 2Reconceiving Science and Policy in the Preventive Paradigm. Glob. Environ. Change 1992, 2, 111–127. [Google Scholar] [CrossRef]
  5. Stirling, A. Keep It Complex. Nature 2010, 468, 1029–1031. [Google Scholar] [CrossRef] [PubMed]
  6. Boulton, J.G.; Allen, P.M.; Bowman, C. Embracing Complexity: Strategic Perspectives for an Age of Turbulence; Oxford University Press: Oxford, UK, 2015; ISBN 978-0-19-956525-2. [Google Scholar]
  7. Ayres, S.; Stafford, I. Managing Complexity and Uncertainty in Regional Governance Networks: A Critical Analysis of State Rescaling in England. Reg. Stud. 2014, 48, 219–235. [Google Scholar] [CrossRef]
  8. Knight, F. Risk, Uncertainty and Profit; Houghton Mifflin Company: Boston, MA, USA; New York, NY, USA, 1921. [Google Scholar]
  9. Haynes, P. Managing Complexity in the Public Services; Routledge: London, UK, 2015. [Google Scholar]
  10. Yan, B.; Zhang, X.; Wu, L.; Zhu, H.; Chen, B. Why Do Countries Respond Differently to COVID-19? A Comparative Study of Sweden, China, France, and Japan. Am. Rev. Public Adm. 2020, 8, 762–769. [Google Scholar] [CrossRef]
  11. McKee, M. Learning from Success: How Has Hungary Responded to the COVID Pandemic? GeroScience 2020, 42, 1217–1219. [Google Scholar] [CrossRef]
  12. Tashiro, A.; Shaw, R. COVID-19 Pandemic Response in Japan: What Is behind the Initial Flattening of the Curve? Sustainability 2020, 12, 5250. [Google Scholar] [CrossRef]
  13. Christensen, T.; Lægreid, P. Balancing Governance Capacity and Legitimacy: How the Norwegian Government Handled the COVID-19 Crisis as a High Performer. Public Adm. Rev. 2020, 80, 774–779. [Google Scholar] [CrossRef]
  14. Migone, A.R. The Influence of National Policy Characteristics on COVID-19 Containment Policies: A Comparative Analysis. Policy Des. Pract. 2020, 3, 259–276. [Google Scholar] [CrossRef]
  15. Greener, I. Comparing Country Risk and Response to COVID-19 in the First 6 Months across 25 Organisation for Economic Co-Operation and Development Countries Using Qualitative Comparative Analysis. J. Int. Comp. Soc. Policy 2021, 37, 211–225. [Google Scholar] [CrossRef]
  16. Capano, G.; Howlett, M.; Jarvis, D.S.L.; Ramesh, M.; Goyal, N. Mobilizing Policy (In)Capacity to Fight COVID-19: Understanding Variations in State Responses. Policy Soc. 2020, 39, 285–308. [Google Scholar] [CrossRef] [PubMed]
  17. Mascio, F.D.; Natalini, A.; Cacciatore, F. Public Administration and Creeping Crises: Insights From COVID-19 Pandemic in Italy. Am. Rev. Public Adm. 2020, 50, 621–627. [Google Scholar] [CrossRef]
  18. Tsiotas, D.; Magafas, L. The Effect of Anti-COVID-19 Policies on the Evolution of the Disease: A Complex Network Analysis of the Successful Case of Greece. Physics 2020, 2, 17. [Google Scholar] [CrossRef]
  19. Chaebo, G.; Medeiros, J.J. Conditions for Policy Implementation via Co-Production: The Control of Dengue Fever in Brazil. Public Manag. Rev. 2017, 19, 1381–1398. [Google Scholar] [CrossRef]
  20. WHO. WHO-Convened Global Study of Origins of SARS-CoV-2: China Part; WHO: Geneva, Switzerland, 2021. [Google Scholar]
  21. Xinhua Timeline: China’s Prompt Release of COVID-19 Information, Experience-Sharing. China Daily. 12 April 2021. Available online: https://www.xinhuanet.com/english/2021-04/12/c_139875358.htm (accessed on 31 January 2023).
  22. Cairney, P. Complexity Theory in Political Science and Public Policy. Political Stud. Rev. 2012, 10, 346–358. [Google Scholar] [CrossRef]
  23. Teisman, G.R.; Edelenbos, J. Towards a Perspective of System Synchronization in Water Governance: A Synthesis of Empirical Lessons and Complexity Theories. Int. Rev. Adm. Sci. 2011, 77, 101–118. [Google Scholar] [CrossRef]
  24. Stacey, R.; Griffin, D. (Eds.) Complexity and the Experience of Managing in Public Sector Organizations; Routledge: London, UK, 2007; ISBN 978-1-134-21053-4. [Google Scholar]
  25. Prigogine, I. The End of Certainty: Time, Chaos, and the New Laws of Nature; Free Press: New York, NY, USA; London, UK, 1997; ISBN 978-0-684-83705-5. [Google Scholar]
  26. Haynes, P. Complexity Theory and Evaluation in Public Management: A Qualitative Systems Approach. Public Manag. Rev. 2008, 10, 401–419. [Google Scholar] [CrossRef]
  27. Macintosh, R.; Maclean, D.; Stacey, R.; Griffin, D. (Eds.) Complexity and Organization; Routledge: London, UK, 2013; ISBN 978-1-134-52719-9. [Google Scholar]
  28. Aven, T.; Renn, O. The Role of Quantitative Risk Assessments for Characterizing Risk and Uncertainty and Delineating Appropriate Risk Management Options, with Special Emphasis on Terrorism Risk. Risk Anal. 2009, 29, 587–600. [Google Scholar] [CrossRef]
  29. Renn, O.; Klinke, A.; van Asselt, M. Coping with Complexity, Uncertainty and Ambiguity in Risk Governance: A Synthesis. AMBIO 2011, 40, 231–246. [Google Scholar] [CrossRef]
  30. Mazouz, B.; Rousseau, A. With the collaboration of Pierre-André Hudon Strategic Management in Public Administrations: A Results-Based Approach to Strategic Public Management. Int. Rev. Adm. Sci. 2016, 82, 411–417. [Google Scholar] [CrossRef]
  31. Klijn, E.-H. Complexity Theory and Public Administration: What’s New? Key Concepts in Complexity Theory Compared to Their Counterparts in Public Administration Research. Public Manag. Rev. 2008, 10, 299–317. [Google Scholar] [CrossRef]
  32. Teisman, G.R.; Klijn, E.-H. Complexity Theory and Public Management: An Introduction. Public Manag. Rev. 2008, 10, 287–297. [Google Scholar] [CrossRef]
  33. Lai, A.Y.-H. Agility amid Uncertainties: Evidence from 2009 A/H1N1 Pandemics in Singapore and Taiwan. Policy Soc. 2018, 37, 459–472. [Google Scholar] [CrossRef]
  34. Zhou, N.; Wu, Q.; Hu, X.; Xu, D.; Wang, X. Evaluation of Chinese Natural Gas Investment along the Belt and Road Initiative Using Super Slacks-Based Measurement of Efficiency Method. Resour. Policy 2020, 67, 101668. [Google Scholar] [CrossRef]
  35. Xinhua China Highly Responsible in Curbing Virus Spread. China Daily Online. 21 January 2020. Available online: https://global.chinadaily.com.cn/a/202001/21/WS5e26a523a3101282172728c3.html (accessed on 31 January 2023).
  36. Liu, Y. Anti-Epidemic Efforts Demonstrate China’s Great Strength—People’s Daily Online. 31 August 2020. Available online: https://en.people.cn/n3/2020/0831/c90000-9740188.html (accessed on 31 January 2023).
  37. Chen, Z.; Zhang, Q.; Lu, Y.; Zhang, X.; Zhang, W.; Guo, C.; Liao, C.; Li, Q.; Han, X.; Lu, J. Distribution of the 2019-NCoV Epidemic and Correlation with Population Emigration from Wuhan, China. medRxiv 2020. [Google Scholar] [CrossRef]
  38. Van Popering-Verkerk, J.; Molenveld, A.; Duijn, M.; van Leeuwen, C.; van Buuren, A. A Framework for Governance Capacity: A Broad Perspective on Steering Efforts in Society. Adm. Soc. 2022, 54, 1767–1794. [Google Scholar] [CrossRef]
  39. Xinhua Yunnan Punishes Officials over Mask Requisition amid Epidemic Fight—People’s Daily Online. People’s Daily. 24 February 2020. Available online: https://www.xinhuanet.com/english/2020-02/24/c_138813563.htm (accessed on 31 January 2023).
  40. Zhuang, Q.; Sun, M. Why Xiaotangshan Hospital Dismantled Seven Years Later? China Youth Daily. 10 April 2010. Available online: http://www.cyol.net/zqb/content/2010-04/10/content_3176786.htm (accessed on 31 January 2023). (In Chinese).
  41. Cooper, B.; Glaesser, J. Using Case-based Approaches to Analyse Large Datasets: A Comparison of Ragin’s FsQCA and Fuzzy Cluster Analysis. Int. J. Soc. Res. Methodol. 2011, 14, 31–48. [Google Scholar] [CrossRef]
  42. Vis, B. The Comparative Advantages of FsQCA and Regression Analysis for Moderately Large-N Analyses. Sociol. Methods Res. 2012, 41, 168–198. [Google Scholar] [CrossRef]
  43. Rihoux, B.; Ragin, C. Configurational Comparative Methods: Qualitative Comparative Analysis (QCA) and Related Techniques; SAGE Publications, Inc.: Thousand Oaks, CA, USA, 2009; ISBN 978-1-4129-4235-5. [Google Scholar]
  44. Kraus, S.; Ribeiro-Soriano, D.; Schüssler, M. Fuzzy-Set Qualitative Comparative Analysis (FsQCA) in Entrepreneurship and Innovation Research—The Rise of a Method. Int. Entrep. Manag. J. 2018, 14, 15–33. [Google Scholar] [CrossRef]
  45. Jordan, E.; Gross, M.E.; Javernick-Will, A.N.; Garvin, M.J. Use and Misuse of Qualitative Comparative Analysis. Constr. Manag. Econ. 2011, 29, 1159–1173. [Google Scholar] [CrossRef]
  46. Dirk, B.-S.; Meur, G.D. Comparative Research Design: Case and Variable Selection. In Configurational Comparative Methods: Qualitative Comparative Analysis (QCA) and Related Techniques; SAGE Publications, Inc.: Thousand Oaks, CA, USA, 2009; ISBN 978-1-4129-4235-5. [Google Scholar]
  47. Jiao, H.; Koo, C.K.; Cui, Y. Legal Environment, Government Effectiveness and Firms’ Innovation in China: Examining the Moderating Influence of Government Ownership. Technol. Forecast. Soc. Change 2015, 96, 15–24. [Google Scholar] [CrossRef]
  48. Jung, S.-M. Participatory Budgeting and Government Efficiency: Evidence from Municipal Governments in South Korea. Int. Rev. Adm. Sci. 2021, 88, 002085232199120. [Google Scholar] [CrossRef]
  49. Lynn, L.E.; Robichau, R.W. Governance and Organisational Effectiveness: Towards a Theory of Government Performance. J. Public Policy 2013, 33, 201–228. [Google Scholar] [CrossRef]
  50. World Health Statistics World Health Statistics. Available online: https://www.who.int/data/gho/data/themes/topics/topic-details/GHO/world-health-statistics (accessed on 3 November 2021).
  51. Ministry of Health China Daily Updates on SARS in Mainland China by Ministry of Health in China. Available online: http://news.sina.com.cn/c/2003-04-30/19521025930.shtml (accessed on 2 November 2021).
  52. Ragin, C.C. User’s Guide to Fussy-Set/Qualitative Comparative Analysis; University of California: Irvine, CA, USA, 2017. [Google Scholar]
  53. Ragin, C.C. Set Relations in Social Research: Evaluating Their Consistency and Coverage. Political Anal. 2006, 14, 291–310. [Google Scholar] [CrossRef]
  54. Schneider, C.Q.; Wagemann, C. Set-Theoretic Methods for the Social Sciences: A Guide to Qualitative Comparative Analysis; Strategies for Social Inquiry; Cambridge University Press: Cambridge, MA, USA, 2012; ISBN 978-1-107-01352-0. [Google Scholar]
  55. Ragin, C.C. Measurement Versus Calibration: A Set-Theoretic Approach. Available online: https://www.oxfordhandbooks.com/view/10.1093/oxfordhb/9780199286546.001.0001/oxfordhb-9780199286546-e-8 (accessed on 24 August 2020).
  56. Cooper, B.; Glaesser, J. Qualitative Comparative Analysis, Necessary Conditions, and Limited Diversity: Some Problematic Consequences of Schneider and Wagemann’s Enhanced Standard Analysis. Field Methods 2016, 28, 300–315. [Google Scholar] [CrossRef]
  57. Schneider; Wagemann, C. Doing Justice to Logical Remainders in QCA: Moving Beyond the Standard Analysis. Political Res. Q. 2013, 66, 211–220. [Google Scholar]
  58. Schneider; Wagemann, C. Standards of Good Practice in Qualitative Comparative Analysis (QCA) and Fuzzy-Sets. Comp. Sociol. 2010, 9, 397–418. [Google Scholar] [CrossRef]
  59. Ragin Fuzzy-Set Social Science; University of Chicago Press: Chicago, IL, USA, 2000.
  60. Marx, A.; Dusa, A. Crisp-Set Qualitative Comparative Analysis (CsQCA), Contradictions and Consistency Benchmarks for Model Specification. Methodol. Innov. Online 2011, 6, 103–148. [Google Scholar] [CrossRef]
  61. Liu, Q.; Liu, Z.; Kang, T.; Zhu, L.; Zhao, P. Transport Inequities through the Lens of Environmental Racism: Rural-Urban Migrants under COVID-19. Transp. Policy 2022, 122, 26–38. [Google Scholar] [CrossRef]
  62. Lawson, J.; Xu, F. SARS in Canada and China: Two Approaches to Emergency Health Policy. Governance 2007, 20, 209–232. [Google Scholar] [CrossRef]
  63. Tursunbayeva, A.; Franco, M.; Pagliari, C. Use of Social Media for E-Government in the Public Health Sector: A Systematic Review of Published Studies. Gov. Inf. Q. 2017, 34, 270–282. [Google Scholar] [CrossRef]
  64. Kovacic, Z.; Di Felice, L.J. Complexity, Uncertainty and Ambiguity: Implications for European Union Energy Governance. Energy Res. Soc. Sci. 2019, 53, 159–169. [Google Scholar] [CrossRef]
  65. Schneider; Wickert, C.; Marti, E. Reducing Complexity by Creating Complexity: A Systems Theory Perspective on How Organizations Respond to Their Environments: Reducing Complexity by Creating Complexity. J. Manag. Stud. 2017, 54, 182–208. [Google Scholar] [CrossRef]
  66. Jones, C.M.; Clavier, C.; Potvin, L. Policy Processes sans Frontières: Interactions in Transnational Governance of Global Health. Policy Sci. 2020, 53, 161–180. [Google Scholar] [CrossRef] [Green Version]
Figure 1. Hypothesized Conceptual Model.
Sustainability 15 02828 g001
Figure 2. Analysis Procedure.
Sustainability 15 02828 g002
Figure 3. The total domestic case number of COVID-19 in 30 provinces, autonomous regions and province-level municipalities (with the imported case number deducted) in the early stage.
Sustainability 15 02828 g003
Table 1. Conditions, Outcomes and Indicators.
CategoriesConditions & OutcomeIndicatorsData Sources
CertaintyCondition 1:
Information Infrastructure (II)
1. Provincial Telecommunication Business Turnover in the Province per 10,000 people (TBT)
2. The Number of Fix Telephone Users in the Province per 10,000 people (FTE)
3. The Number of Mobile Phone Users in the Province per 10,000 people (Mob)
4. The Number of Internet Users in the Province per 10,000 people (Int)
Provincial Statistical Yearbook (2019);
China Statistical Yearbook (2020)
Condition 2:
Medical Infrastructure (MI)
1. The Number of Hospital Beds in the Province per 10,000 people (Beds)
2. The Number of Doctors and Nurses in the Province per 10,000 people (DN)
3. The Number of Tertiary Hospitals in the Province (THP)
China Healthcare Statistical Yearbook (2020)
UncertaintyCondition 3:
Spreading Control Difficulty (SCD)
1. The Relative Ratio of the Inflow Population from Wuhan in the Province from 10 to 23 January based on the “Baidu Migration” Big Data Platform (IFR)
2. The Population Density (PPD)
“Baidu Migration” platform;
Provincial Statistical Yearbooks (2019)
Governance capabilityCondition 4:
Governance Response Speed (RS)
1. The Date to Start the 1st Level of Public Health Emergencies Minus the Date of National Health Commission updating the virus daily on the website (EMR)
2. The Date to organize the first news conference on the fighting Minus the Date of the first case being reported in the province (NCD)
3. The number of news conference times on the fighting during the period (NCT)
The provincial health commission’s websites;
Provincial government websites;
Condition 5:
Expertise of Provincial Health Commission Director (EP)
1. Educational Background of the Provincial Health Commission (HC) Director (Bachelor/Master/PhD degree) (HCE)
2. The Past Experience in Health-related Work of the HC Director (HCW)
The profiles of health director
Condition 6:
Support Wuhan and Hubei (SP)
The Number of Medical Personnel in the Province to Support Wuhan and HubeiNews reports of the supporting medical team returning home;
Condition 7:
SARS experience(SS)
The total number of confirmed cases reported in the province in the 2003 SARS epidemicThe Ministry of Health website
Results-based OutcomeOutcome:
Effectiveness of Governance(EOG)
1. The Time Length of the First Peak Date of Newly Added Confirmed Cases Minus the Report Date of the First Confirmed Case in the Province (Fast)
2. The Ratio of the Number of Total Domestic Confirmed Cases to the Provincial Total Population (CFC)
3. The Ratio of the Peak number of newly added cases through the targeted period to the Provincial Total Population (NP)
The websites of the provincial health commission;
China Statistical Yearbook (2020)
Table 2. A descriptive analysis of all the indicators.
IndicatorsNMinMaxMeanSD
II-TBT300.4591.2450.8100.198
II-FTE300.0600.2740.1470.064
II-Mob300.8941.8661.1610.213
II-Int300.7541.5270.9550.177
MI-Beds3043.74872.13658.9957.995
MI-DN3029.789130.77377.25419.059
MI-THP306.000120.00046.93327.581
SCD-IFR300.0205.6901.0131.179
SCD-PPD302.8003847.619463.395719.375
RS-EMR302.0008.0003.5671.073
RS-NCD261.00019.0007.0005.091
RS-NCT300.00074.00021.36718.356
EP-HCE301.0003.0002.2000.664
EP-HCW300.0001.0000.7330.450
SP303.0003096.0001323.967613.363
SS300.0002521.000177.300527.044
EOG-Fast300.00030.00013.1335.457
EOG-CFC300.0030.2100.0910.062
EOG-NP300.0020.0230.0080.005
N is the number of cases; SD is the standard deviation value.
Table 3. Necessity Analysis Results for EOG and ~EOG.
ConditionEOGEOG~EOG~EOG
ConsCovConsCov
II0.4910.6330.5880.719
~II0.782 0.6670.7000.565
M0.4920.5890.6400.726
~MI0.7710.6940.6370.543
SCD0.3370.4860.6370.868
~SCD0.9090.7260.6220.471
RS0.5340.5470.7300.708
~RS0.7140.736 0.5330.520
EP0.6280.5810.7560.662
~EP0.6350.7330.5220.570
SP0.5760.6260.7220.743
~SP0.7630.7440.6360.587
SS0.1580.6240.1880.701
~SS0.9240.5460.8990.503
Note: The conditions and outcome with the symbol ‘~’ mean low, and the ones without ‘~’ mean high. For example, EOG means high effectiveness of governance and ~EOG means low effectiveness of governance.
Table 4. Truth Table of Six Conditions Variables and its raw consistency values for EOG and ~EOG and frequency of provinces or regions in that configuration.
MIIIRSEPSCDSPNumberEOGRaw Consist of EOG~EOGRaw Consist
of ~EOG
000000410.89200.650
111111300.59810.984
111110200.73910.968
001100210.86400.733
111101110.80110.883
110011110.94410.828
101111100.79210.986
101101100.78210.917
101100110.85710.848
100001110.93200.761
011101110.90010.824
011011100.75410.978
011000100.79710.811
010100110.82810.840
010000110.85500.747
001110100.79810.938
001101110.86210.826
001011100.65110.984
001001100.79110.819
001000100.79100.788
000111110.82310.924
000100110.86200.734
Note: The conditions and outcome with the symbol ‘~’ mean low, and the ones without ‘~’ mean high. For example, EOG means high effectiveness of governance and ~EOG means low effectiveness of governance.
Table 5. Configurations leading to high effectiveness of governance.
ConfigurationsP1aP1bP1cP2aP2bP2cP2d
Conditions
Certainty & Uncertainty
Information Infrastructure
Medical Infrastructure
Spreading Control Difficulty
Governance Capability
Response Speed
Mutual Support
Expertise of Health Director
SARS experience
Consistency0.8430.9170.8090.7550.8100.8460.801
Raw Coverage0.3450.2800.5750.4340.4890.4820.348
Unique Coverage0.0410.0190.1490.0230.0180.0220.009
Solution Consistency0.801
Solution Coverage0.848
Note: ⬤ (Presence) and Ⓧ (absence) represent central conditions; ● (Presence) and (absence) represent contributing conditions. The constructs of conditions are in bold.
Table 6. The configurations leading to low effectiveness of governance.
ConfigurationsP1P2aP2bP2cP2d
Conditions
Certainty & Uncertainty
Information Infrastructure
Medical Infrastructure
Spreading Control Difficulty
Governance Capability
Response Speed
Mutual Support
Expertise of Health Director
SARS experience
Consistency0.8680.8180.8320.8640.843
Raw Coverage0.6370.6150.2200.4010.254
Unique Coverage0.1270.0320.0050.0070.038
Solution Consistency0.821
Solution Coverage0.830
Note: ⬤ (Presence) represent central condition; ● (Presence) and (absence) represent contributing conditions. The constructs of conditions are in bold.
Disclaimer/Publisher’s Note: The statements, opinions and data contained in all publications are solely those of the individual author(s) and contributor(s) and not of MDPI and/or the editor(s). MDPI and/or the editor(s) disclaim responsibility for any injury to people or property resulting from any ideas, methods, instructions or products referred to in the content.

