Article

Sustainability Assessment in Social Housing Environments: An Inclusive Indicators Selection in Colombian Post-Pandemic Cities

by
Jhon Ricardo Escorcia Hernández
*,
Sara Torabi Moghadam
and
Patrizia Lombardi
Interuniversity Department of Regional and Urban Studies and Planning, Politecnico di Torino, 10125 Torino, Italy
*
Author to whom correspondence should be addressed.
Sustainability 2023, 15(3), 2830; https://doi.org/10.3390/su15032830
Submission received: 31 December 2022 / Revised: 27 January 2023 / Accepted: 2 February 2023 / Published: 3 February 2023

Abstract

:
The use of indicators for sustainability assessment in the urban planning process is a widely used approach. With the definition of the Agenda 2030 and the role of cities in achieving sustainable development goals, much work has been devoted to the definition of evaluation frameworks and indicators to assess policies and plans and support decision-making in the transition to sustainable urban environments. Therefore, there is currently a wide range of indicator frameworks for the sustainability assessment of human settlements. However, considering the effects of the COVID-19 pandemic on the urban sustainability paradigm, the need to reassess the relevance of existing assessment frameworks in the post-pandemic context has been highlighted. Thus, this article aims to illustrate a selection of indicators to evaluate urban sustainability in developing countries’ post-pandemic contexts, using Colombia as a case study. This work comprises the characterization of the post-pandemic relevance of a set of sustainability indicators through the participation of stakeholders associated with the development process of social housing in urban environments in Colombia. Within a Delphi process, the initial indicators were taken from local and international sustainability frameworks validated before the pandemic. Further, a final selection was made through the evaluation of a survey from a sample of 45 stakeholders, and different participatory mechanisms with experts. These results acknowledged the relevance of factors, such as atmospheric conditions, risk management, the performance of public transport systems, and the availability and accessibility to key services, in the achievement of urban sustainability. These results will support the sustainability assessment of the development of post-pandemic recovery policies in Colombia and serve as a reference for other contexts in developing countries.

1. Introduction

The international sustainability agenda seeks to support the development of the world towards closing the socioeconomic gap, ending poverty, protecting the planet, and improving people’s lives, within the paradigm of sustainable development. That is to say: to take action towards a development that satisfies the needs of the present without compromising the resources of future generations so they will be able to please their needs too [1,2]. Currently, more than half of the world’s population lives in cities, and it is projected that this will increase up to 70% by 2050 [3,4]. However, cities are also responsible for approximately 70% of global GHG emissions and are one of the main sources of contamination [4]. Thus, to achieve a sustainable future, improve people’s lives, and reduce the impacts on the planet, involving the cities is critical.
Consequently, among the 17 sustainable development goals of the United Nations (SDGs), SDG 11 is entirely focused on achieving more inclusive, safe, resilient, and sustainable human settlements [5]. Furthermore, in different studies that have analyzed the overlaps in the SDGs and the development plans for the sustainability agenda, cities have been defined as a factor transversal to several goals [6,7]. It has been stated that the cities should be involved in the strategies to achieve the goals [8,9]. However, cities are highly complex systems, composed of diverse systems that need to operate synchronously in daily life [10]. Thus, the development of policies to achieve the sustainability agenda at the urban level must permeate this systemic nature to be integrated into the operation of cities [3].
Therefore, there arises the need to quantify the conditions of sustainability in cities and to follow up on the impact of the strategies defined to move the sustainability agenda forward. For this task, one of the most widely used approaches in the evaluation of public policies and urban planning is the use of indicators. Even if it has certain limitations, related to the boundaries of the analysis, the evaluation of indicators is widely used because it offers several benefits. The assessment process through indicators allows us (i) to measure and monitor the impact of different actions or policies in an evaluated system, (ii) to inform decision-makers in a synthesized way about the status of a system, or the possible consequences of a choice, and improve the level of awareness about a problem before making decisions, and (iii) to integrate the evaluation of different systems typically nonrelated and to give the alternative to assign rankings and weighting processes to perform multi-dimensional evaluations [11]. In this, the definition of indicators becomes a key factor for the evaluation and development of the sustainability agenda. Consequently, with the definition of the SDGs, 231 indicators were defined to monitor the 17 goals [12]. In particular, 14 monitoring indicators were assigned to Goal 11 [12,13,14]. However, in recent years, multiple studies and projects have been developed to define the frameworks and systems of indicators with greater complexity to obtain more detailed evaluations of policies at different scales and to assess the conditions of different urban systems according to their particularities [15,16,17].
Since the definition of the Agenda 2030, different initiatives, projects, and certification systems have proposed other sets of indicators and there has been a discussion of which ones are more relevant [16,18]. Likewise, how to integrate the systemic nature of the sustainability agenda and the environments to be evaluated is an ongoing discussion [9,19,20,21]. In addition, the importance of defining indicators in detail to meet the particularities of the different contexts in which they are to be assessed has been discussed [15,16,22]. Even if the objectives of the sustainability agenda are common at the international level, the conditions of the cities and the different geographical contexts have certain distinctive aspects of each place for which indicators must be selected methodologically to ensure their local relevance. Consequently, it is crucial to involve stakeholders in participatory processes during the definition of the sustainability assessment framework, including the selection of indicators [23].
Nevertheless, in recent years, with the arrival of the COVID-19 pandemic and its negative effects on the life of cities, a discussion was opened on the paradigm of urban sustainability and the key role of resilience to disruptive events such as a pandemic [24,25]. The socioeconomic effects on people’s lives were negative with a greater impact on vulnerable communities and the developing world [26]. These effects, among other impacts that have been discussed in the literature [24,27,28], opened the discussion about how relevant or pertinent the existing sustainability frameworks and indicators are for the assessment of urban environments in the current post-pandemic conditions. In this regard, some studies have proposed the evaluation of the pertinence of the SDG11 indicators after the COVID-19 outbreak [29,30,31,32,33,34].
Given this background, within the framework of the development of a tool for sustainability assessment in developing countries, this paper answers the question: how should social housing urban environments be evaluated to achieve a carbon-neutral scenario within the sustainability agenda in the post-pandemic context? Consequently, its objective is to illustrate a selection of indicators for sustainability assessment in the social housing environments of developing countries’ cities. Moreover, this study is focused on the current post-pandemic conditions, through the participation of stakeholders in the urban development sector. Colombia was selected as a case study due to its relevance as a developing country member of the OECD [35]. Recently, in the OECD National Urban Policy Review of Colombia, different problems were highlighted [35]. This report discusses flaws in the conditions of the low-income (social) housing sector, associated with the quality of housing, and the poor conditions of habitability at the urban scale in medium and low-income urban environments. It also highlights the need to improve neighborhood sustainability conditions, combat socioeconomic injustices, improve people’s living conditions, and restore the social fabric in the country’s cities [35,36]. Likewise, it is discussed that in the planning model of several cities, policies and strategies are not articulated with each other toward the sustainability agenda. For example, it is mentioned that the system of cities and the housing development model is not articulated with the initiatives to promote urban sustainability and the decarbonization of cities [35]. To achieve the aforementioned objective, the work carried out in Colombia is methodologically composed of a multi-step approach framed on a Delphi process, a structured data-collection method that aims to facilitate a group of experts in achieving agreements on a topic. The method has been used to develop definitions of criteria and objectives within different disciplines [37,38,39,40]. The inclusion of the stakeholders through participatory approaches offers the validation of theoretical proposals and adds extra value to the evaluation of different alternatives given by the expertise of selected individuals [23,40]. Furthermore, in city development and planning the complexity of the problems requires the participation of different multidisciplinary actors. Their inclusion in the process to define metrics for different evaluations means an advantage to capture the mindset of the stakeholders involved in each process and to find convergence among them [23].
In this case, the selection of indicators according to their relevance in the current post-pandemic context of Colombian cities should include a participatory approach to catch the perspective of the stakeholders in the selection and validation process. The methodological approach started with a preselection of indicators suitable for the case study. Later, within the framework of the Delphi method, a sample of stakeholders was invited to participate to evaluate the relevance of the preselected indicators. Finally, according to the results of the survey and its validation with experts, a selection of the most relevant indicators and a definition of KPIs is proposed.
Notably, this study approaches a common issue in urban planning and sustainability assessment research. However, some differentiating factors make this work relevant in the current conditions. The work presented in this paper is framed within the context of research that aims to develop a system to support the achievement of urban sustainability in the social housing environments in Colombian cities. Thus, the indicators and the selections presented in this paper define the evaluation framework to build a tool, and defining a set of indicators validated by a heterogeneous group of participants incurred a difficulty in involving stakeholders who come from different sectors (public administrations, academia, construction, sustainability consultancy, etc.). Even before the pandemic, it was stated that the needs of emerging economies towards the achievement of the SDGs might differ from the ones prioritized in stronger economies [3,41]. Moreover, the definition of an assessment framework in this study considers that, in a developing country, the pandemic might have influenced the prioritization of dimensions that seek human settlements that are more sustainable, resilient, safe, and inclusive.
This article is divided into four chapters including this introduction. Subsequently, a detailed description of the methodological framework, followed by the presentation and discussion of the results, and the conclusions and future steps of this work are illustrated.

2. Materials and Methods

To reach the aforementioned objective, the work carried out in Colombia was methodologically composed of a multi-step process based on a Delphi method process [23,42]. The work proposed a robust inclusive methodology. It is therefore helpful to break it down into the main elements that frame it to understand the research process stages employed in this study. To this end, Figure 1 a schematic flowchart of the methodological approaches which are organized into 3 main stages is shown.
  • Stage 1: Pre-selection of a set of indicators suitable for the Colombian context. Initially, a review of sources of indicators for this framework at the national and international levels was carried out. Subsequently, based on existing and previously validated assessment frameworks in Colombia, and filtering based on feedback from different stakeholders at the national level, a pre-selection of indicators relevant to the context of the case study was proposed (56 indicators).
  • Stage 2: Feedback from the stakeholders. Selection, integration, and participation of the different stakeholders. In this stage, a participatory process was carried out through an online survey. This stage started with a stakeholders’ analysis to define the desired sample, and then it was followed by the design and application of the survey to evaluate the relevance of the pre-selected indicators in the current context (post-COVID) in Colombia. The survey design, based on the principles of the Delphi method [43,44], was carried out through an iterative process of feedback with a sample of experts to validate the questionnaire before its publication. Later, the survey was published, and three rounds of invitations were made with a new selection of stakeholders based on snowball sampling. Therefore, after the rounds of invitations, a total of 142 invitations to participate in the survey were issued, and in the end, a sample of 45 participants was obtained.
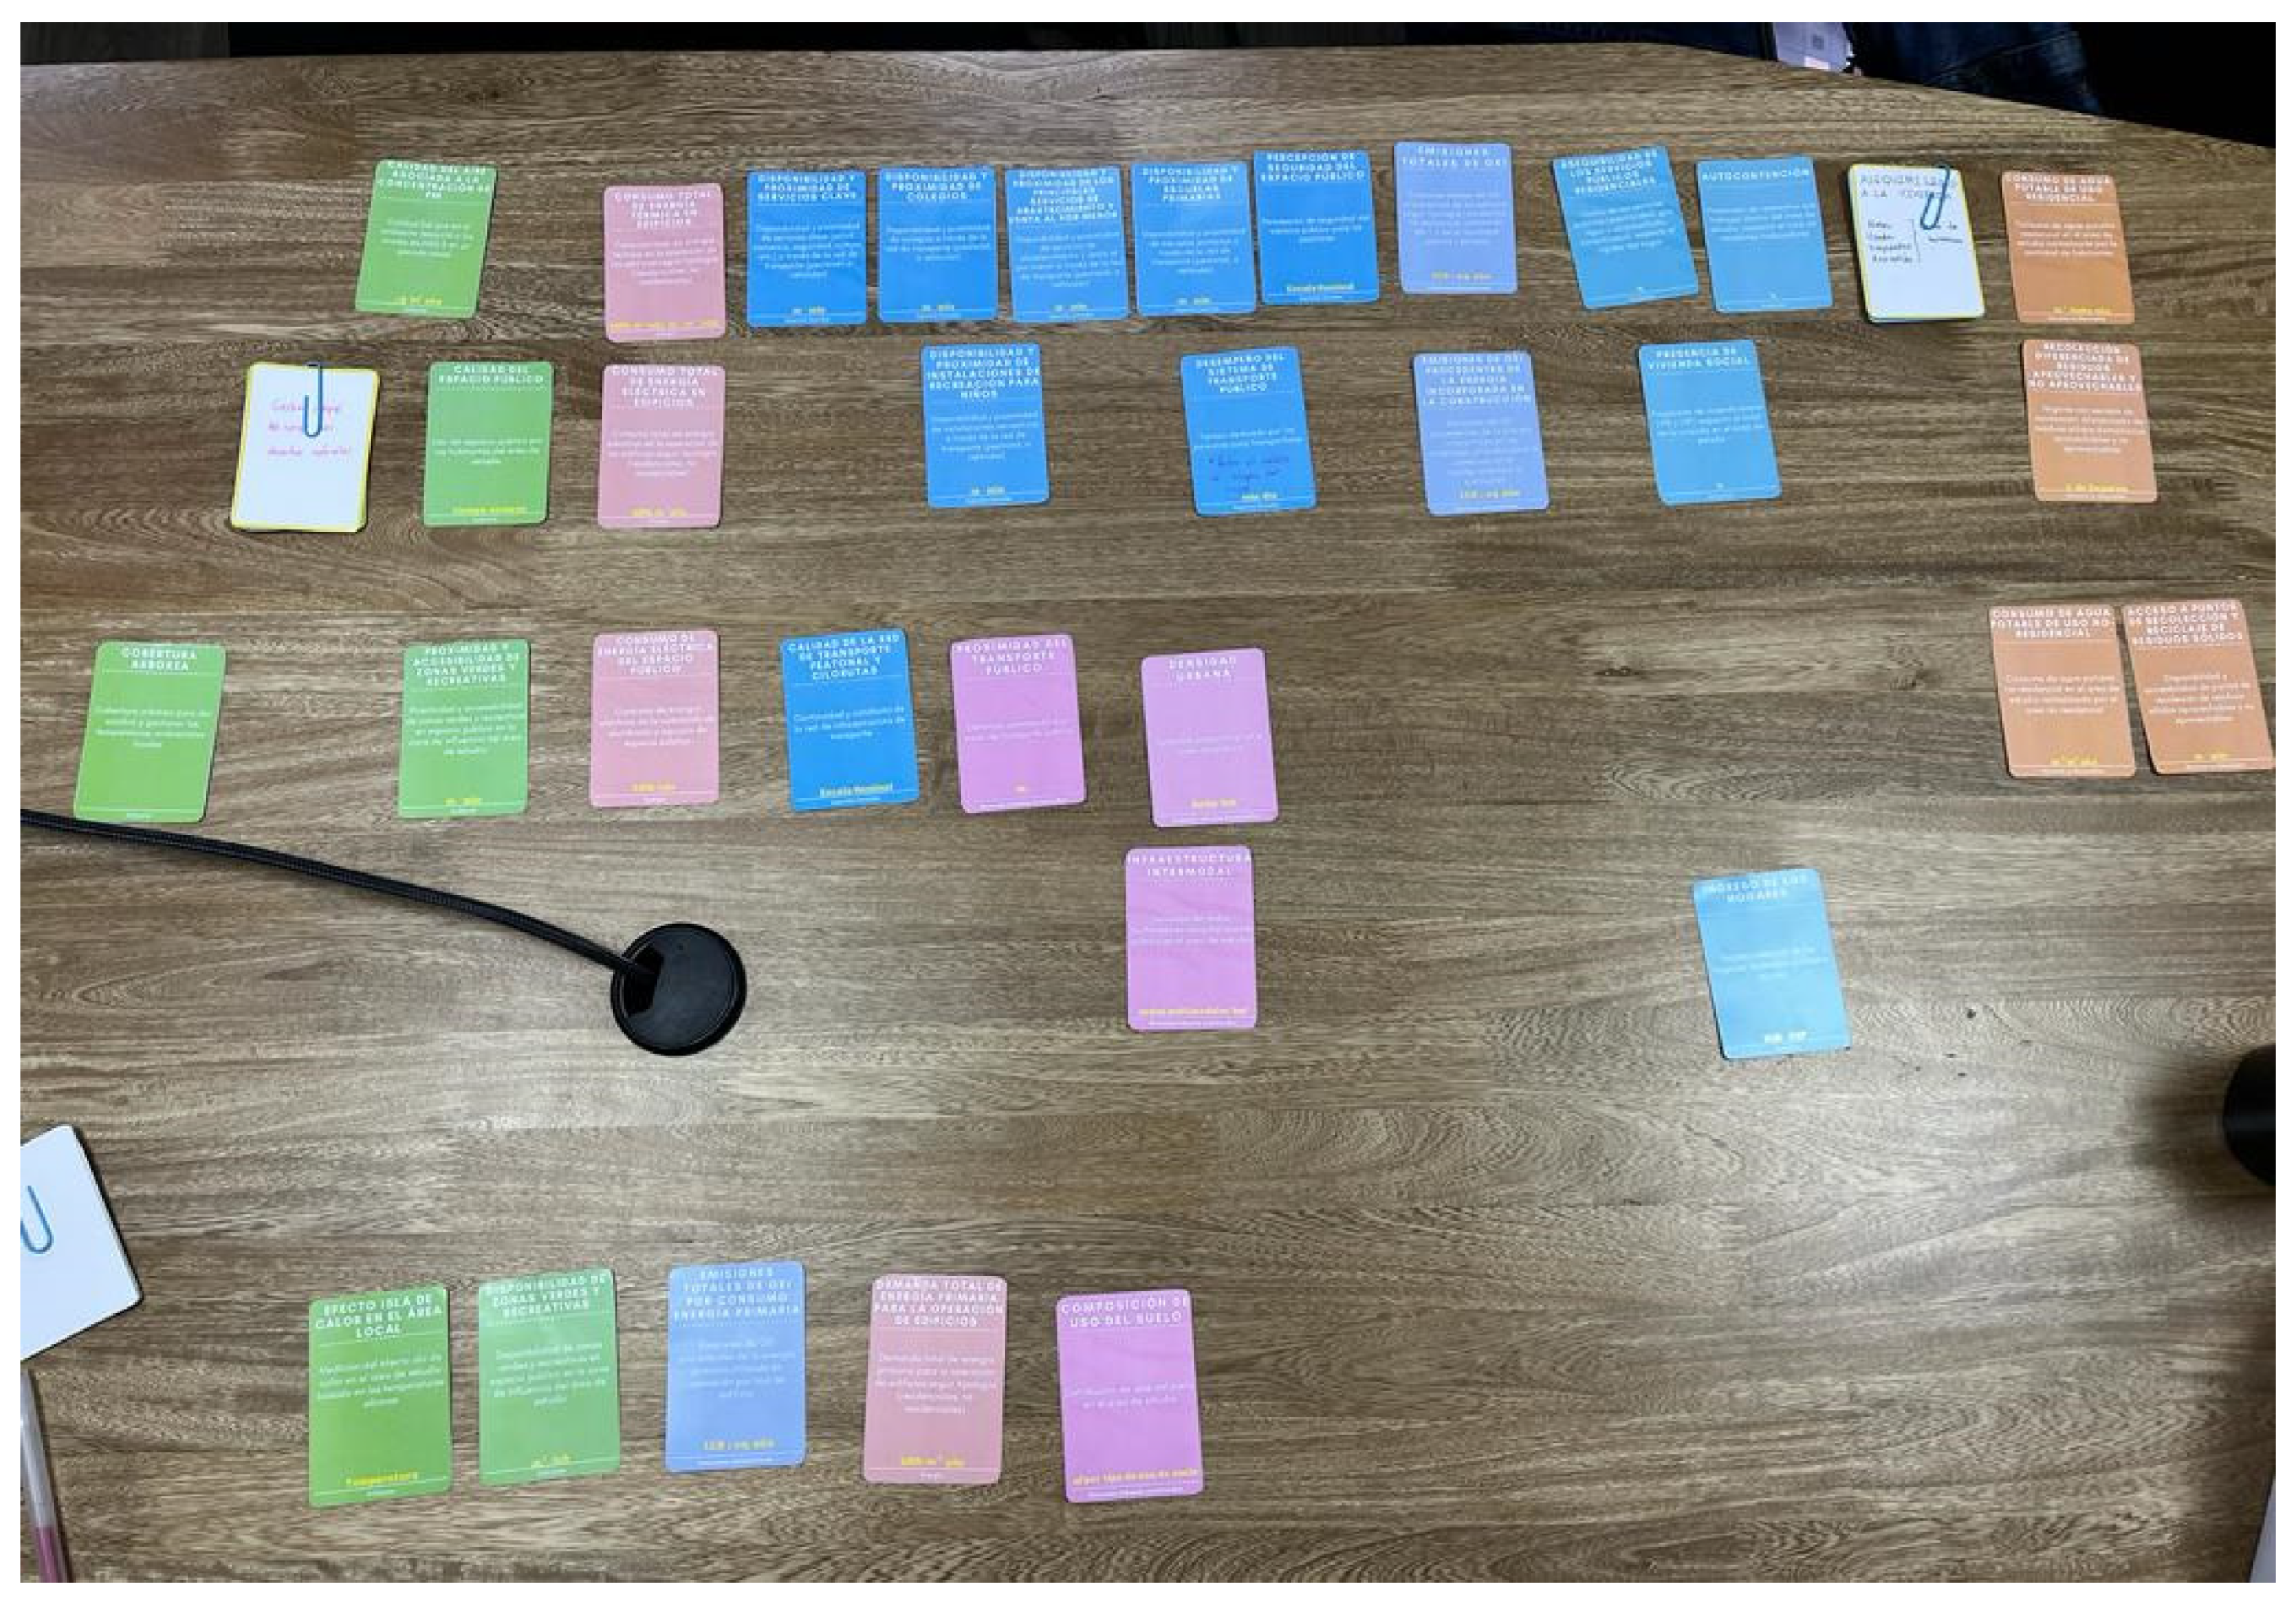
  • Stage 3: Final selection of the indicators based on the results of stage 2 and their validation. The results of the survey were processed to obtain a relevance index for each of the proposed indicators, and with the participation of experts through semi-structured interviews, a process of validation of these results was carried out to finally propose a selection of the 30 most relevant indicators. Finally, the next step was to define the selection of the KPIs for the evaluation of the urban sustainability of social housing environments in Colombia. To do so we organized a workshop with experts, in which the different participants had to discuss, select, and rank the most relevant indicators of the sample selected with the survey with the Simo’s playing cards method proposed by Figueira and Roy (SRF) [45].
The process to define a comprehensive set of indicators for the actual paradigm in the case study comprised different operational steps to retrieve a selection that offers a systemic and multidisciplinary assessment of the sustainability conditions in an urban settlement. Stage 1 illustrates the pre-selection of indicators that later would be critically assessed by the stakeholders according to their relevance in the post-COVID context. This preselection started with an identification of different sources of sustainability indicators from the literature (i.e., papers, working papers, policy papers, certifications, books, and project reports) that were proposed before the 2020 pandemic. After an extensive review of initiatives and frameworks developed in Colombia and internationally, several sources were organized and filtered, and in the end, the 7 main sources presented in Table 1 were selected to support this selection.
The framework of 80 indicators proposed in the project “Systemic perspective for low carbon cities in Colombia. A regulatory and policy approach” [47] served as a baseline of indicators that were progressively modified to finally have a preselection of 56 indicators to be evaluated in this paper. This initial preselection was performed according to the feedback of experts and insights from international references dealing with the current paradigm of urban sustainability. The baseline framework of 80 indicators [47] was developed and validated by a board of experts and external advisors to be representative and relevant for the Colombian context just before the pandemic [47].
The project proposed a methodology and a toolbox to support sustainable urban development through the analysis of two case studies in Colombia, the social housing urban macro-project Ciudad Verde, in the municipality of Soacha, and Lagos de Torca, an urban development under construction in Bogota. Their methodology proposes a sectoral approach that considers urban ecosystems, integrated water management, energy use, waste management, sustainable mobility, and buildings and infrastructure [22,47]. Later, the project performed transference of knowledge to test and validate the methodology in other Colombian cities. The methodology was applied to other case studies in three cities with different geographical and sociodemographic conditions [22]. On the outputs of this analysis were stated a set of recommendations on the indicators and needs for sustainable cities in the post-pandemic era. Among these, an opportunity was identified to make the framework more flexible and scalable to other territories in the country by selecting new indicators. In addition, it was suggested to include indicators to evaluate from a more complex way the ecosystems within the urban environments [22].
Likewise, these issues were approached in the monitoring framework for TODs in Colombia, in which a smaller number of indicators (48) are sorted into three levels of information to give flexibility in the measuring process according to the capacity of the municipalities to acquire the data from a multiscale point of view [48]. It has also been remarked on that there is a need to define indicators that could be measured through public data, and to use them as a driver for the public administrations to improve their data acquisition and management protocols, so the monitoring of the indicators through time could be guaranteed [22,47]. Based on these references, the preselection of indicators should result in a shorter list of indicators than the 80 indicators of the baseline. Furthermore, these indicators should preferably be quantifiable with public data sources. In the end, the literature regarding the paradigm of sustainable cities in the post-pandemic era highlights the importance of the liveability conditions within compact urban environments, with proximity and access to key services and public spaces, playing a key role in the urban sustainability conditions of compact-polycentric cities [47,50,51].
These recommendations, consigned in the literature, and the suggestions of the Colombian stakeholders described before were the criteria to modify the baseline of indicators and define the preselection of 56 indicators. The frameworks described in Table 1 served as sources of indicators to enrich and modify the baseline. The 182 indicators from the urban sustainability framework [18] and the 178 indicators from the CESBA project [15] were mined to find suitable indicators to modify the baseline indicators according to the suggestions of the stakeholders in Colombia. Finally, the preselection of 56 indicators presented in Table 2 was defined to be further validated by the stakeholders. The aggregation of the indicators follows the structure based on different criteria and issues (for each category) used in the CESBA project [15], instead of the sectorial approach defined in the project used for the baseline of indicators. This is to promote the systemic analysis of the urban environments while avoiding the technical bias in the quantification of the indicators that could lead to the mistake of keeping the analysis within a strict sectorial categorization.
Once the preselection of the indicators was defined, thanks to the review of the diverse sources and the feedback received from different stakeholders in Colombia, the set of indicators validated before the COVID-19 pandemic was the starting point for the next stage: to define the relevance of these indicators from the current post-pandemic conditions to the future towards the achievement of the sustainability agenda.
Stage 2 started with two main activities: the definition and design of the participation mechanism, and the stakeholders’ analysis to define the desired group participants. Initially, due to the practicality of involving the stakeholders remotely, it was defined using a survey as the main participatory mechanism for this evaluation. However, within the framework of the Delphi method, the feedback of the stakeholders across the design and analysis of the survey was crucial in the creation process. Thus, the design of the survey was defined within a cycle of review and validation with two experts from the sample of stakeholders. These experts reviewed the survey before making it public and officially submit it to the sample of stakeholders. The survey was designed and structured in Spanish (it is available at the link: https://forms.office.com/r/ttiY7PqbSN (accessed on 30 December 2022)). It was composed of eight sections. The first section was the heading with the survey’s name, the research context, the survey objective, and a general explanation of the survey’s structure, followed by the declaration of consent to participate in the study. The second section asked for the participant’s personal information to build a profile of the respondent, based on their academic and professional background. Further, from the third to the eighth section, the participants had to evaluate the relevance of each indicator. From the third, each section of the survey corresponded to the evaluation of one of the seven categories of indicators defined in the preselection. The participant had to evaluate the relevance of each indicator using a Likert scale from 0 to 4, where 0 is equivalent to absolutely irrelevant, 1 is irrelevant, 2 is slightly relevant, 3 is relevant, and 4 is critical. Furthermore, they had two non-mandatory open questions in which they were able to suggest new indicators for each category, suggest modifications to the existing ones; and provide information about data sources to quantify the indicators of each section. In the end, after two rounds of feedback from the experts revising the questionary, the survey was published.
The stakeholders’ analysis followed a variation of the typology of methods presented by Reed et al. [52]. For this paper, the selection of stakeholders was initially performed through a reconstructive bottom-up categorization, based on the authors involved in the reference studies of Table 1 that were developed in Colombia, followed by a snowball sampling approach. The reconstructive bottom-up started with the compilation of the authors, collaborators, advisors, and other individuals involved in the projects [47,48]. Furthermore, the analysis comprised the screening of the institution(s) that the initial sample of stakeholders represented, followed by the identification of other stakeholders in the organizational hierarchy structure of those institutions. Later, the analysis was extended to other institutions that were of interest for the planning, promotion, and definition of policies for urban and social housing development. Similarly, a plural sample of institutions and individuals from both public and private sectors with expertise in the analysis of indicators for urban sustainability assessment, and who play different roles in the hierarchy of their institutions, was obtained. Likewise, it covered the participation of professionals working in the construction and urban planning sectors. The outcome of this approach was a group of 70 people. This initial sample of stakeholders was later used as a source to identify and involve other stakeholders through a snowball sampling approach. The invitations to participate were submitted in three rounds of emails and one-to-one invitations to participate in the survey. First, an email with an invitation to participate in the survey was sent to the initial sample of 70 people. However, the share of responses after two weeks after the invitation was sent was approximately 1%, thus, another email with a reminder and description of the exercise was sent. At the same time, based on the first answers of the stakeholders and the advice of experts, an extra sample of 35 stakeholders was identified and a first invitation was sent to this group. After some responses, another sample of 37 relevant stakeholders was identified and invited to participate in the survey via text message instead of email. In the end, 4 months after the survey’s publication, and 142 invitations being sent, 45 stakeholders took part in the study by answering the questionnaire.
Table 3 presents the general stakeholders’ analysis. It shows a general categorization of the stakeholders by the definition of the institutions or sectors of interest. In addition, it shows the cluster in which it was classified, and the level of the operation from a territorial and administrative point of view.
In stage 3, the results of the survey allowed us to define an index of relevance for each indicator according to the stakeholders’ points of view. The relevance index was computed as the mean of the answers to the survey for each indicator taking into account all the participants. In addition, the open questions of the survey allowed to retrieve feedback and recommendations about the indicators and the availability of public data to calculate and spatialize them. Based on the Delphi method, a discussion with experts was defined to validate the results of the survey. The discussion aimed to evaluate the results of the survey and the final output was a ranking of the most relevant indicators to perform urban sustainability assessments in Colombian cities according to the survey.
Later, a workshop with experts in the definition of indicators was held to define a set of KPIs and a ranking from the final selection of indicators resulting from the survey and its validation. In detail, the workshop was designed to filter the indicators into a subset of the most relevant according to the expertise of the participants, and it relies on the Delphi method [23,37] and the SRF playing cards game [45,53] to reach a consensus among the criteria of the experts. Ultimately, from this process, it is expected to retrieve a ranking of the relevance of the indicators according to the responses of the stakeholders to the survey, and a second ranking result from the workshop with the experts that takes prioritizes a smaller amount of indicators, that will be taken as KPIs to assess urban sustainability in social housing environments in the current post-pandemic scenario in Colombia.

3. Results and Discussion

Each of the 56 indicators proposed in the preselection was critically assessed by the stakeholders based on how relevant they considered each of them for the urban sustainability evaluation in Colombia. The valuation of each indicator through the Likert scale allowed us to define an average value of relevance for each of them. Through this, we retrieved a first look at the most relevant indicators according to the surveyed stakeholders. Table A1 (available in the Appendix A) presents the overall mean index of relevance for the whole list of indicators. This overall index comes from the average score given to the indicators taking the whole sample of answers. From this evaluation, the five indicators with the highest relevance were: Performance of the public transport system (3.76/4), Ambient air quality concerning PM2.5 over one-year (3.62/4), Consumption of potable water for the residential population (3.58/4), Urban density (3.53/4), and Availability of green zones and recreation areas (3.53/4). These indicators represent the dimensions of Social aspects, Environmental, Non-renewable resources, and Built urban systems of the framework defined in the preselection. Moreover, the evidence shows that, on average, the 56 indicators were evaluated at least as slightly relevant. Table A1 shows that with the complete sample of stakeholders, the indicator with the lowest index of relevance was the Total final thermal energy consumption for building operations (2.40/4) from the Energy dimension.
Furthermore, from the seven dimensions of the framework defined in the preselection, on average, the indicators with the highest relevance were the ones classified in the Environment dimension (Table 4). Moreover, on average, the indicators evaluated as less relevant were the members of the Energy dimension. Nevertheless, since no indicator from the preselection was considered irrelevant, then the analysis of these results turned into which of these are the most relevant for the current Colombian context. Overall, according to the scale of evaluation in the survey, an indicator was considered completely relevant when assigned a value of at least 3.
In addition to the general evaluation, the results were sorted according to the profile of the stakeholders, specifically based on the working background of the participants. In this way, the stakeholders were classified into three groups: those who declared to have experience working in the private sector, in the public sector, and in the specific construction sector. This categorization relies on the importance of these sectors in the definition and materialization of development strategies, even if these are not framed toward the achievement of the urban sustainability agenda. Consequently, the answers to the survey were divided into three subsamples, and for each of them, the average relevance given to each indicator was computed. The result of these calculations for each one of the indicators is also consigned in Appendix A (Table A1).
According to the average relevance of the indicators, for the stakeholders in the private sector, the five most relevant indicators were: Performance of the public transport system (3.69/4), Consumption of potable water for the residential population (3.59/4), Ambient air quality concerning PM2.5 over one year (3.59/4), Urban density (3.55/4), and Availability of green zones and recreation areas (3.55/4). In contrast, the indicator with the lowest index of relevance was the Share of renewable energy on-site, relative to total final thermal energy consumption for building operations (2.34/4). For the sample of stakeholders from the public sector, the five indicators with the highest relevance were: Performance of the public transport system (3.89/4), Affordability of residential utilities (3.78/4), Ambient air quality concerning PM2.5 over one year (3.72/4), Perceived safety of public areas for pedestrians (3.67/4), and tied in fifth place, Urban density and Quality of pedestrian and bicycle network (3.61/4). In contrast, the indicator with the lowest index of relevance was Total final thermal energy consumption for building operations (2.28/4). Finally, for the sample of the construction sector, the five most relevant indicators were: Performance of the public transport system (3.93/4), Consumption of potable water for the residential population (3.86/4), Urban density (3.79/4), and tied in the last two places, Availability of green zones and recreation areas (3.71/4), Accessibility of green zones and recreation areas (3.71/4), and Quality of public space (3.71/4). In contrast, the indicator with the lowest index of relevance was Total final thermal energy consumption for building operations (2.29/4).
In the evaluation of the survey segregated by the field of work, the results show that for all three categories, on average, no indicator in the preselection has been assigned as irrelevant. Even if there is an inclination to set some indicators as critical in the sustainability assessment, on average, each of the indicators has been given a relevance index of at least 2.4; more than half of the preselected indicators have a value higher than 3. Therefore, it was still necessary to define a threshold to select the most relevant from the preselection.
Starting from the labels given to each value of the Likert scale, the selection of the value 2 implies an indicator slightly relevant in the evaluated context. Though, to select the most relevant indicators, it was decided that these should have a value of at least 3, which is equal to the label relevant in the evaluation scale. Thus, the indicators to be included in the selection should have an average value of at least 3. The application of these criteria produced a selection of 30 indicators as a result of the survey, which meant that all of them were defined by the stakeholders as relevant or critical for the sustainability assessment of Colombian cities in the current post-pandemic scenario.
To validate the results of the survey and its analysis, a meeting was set with three experts from the sample of 45 stakeholders involved in the selection exercise. It started with the presentation survey’s results, including the final selection of 30 indicators. Further, each one of them took 5 min to analyze the list of 30 and compare it with the full list of 56 indicators and their respective indexes of relevance. The first highlight was the discussion regarding the fact that no indicator from the preselection was set as irrelevant in the survey. It was concluded that a good pre-selection of indicators was made. Therefore, none of these indicators were discarded by the stakeholders involved in the survey.
Regarding the selection of indicators, the analysis raised two general concerns. First, it was stated that the number of indicators (30) in the final selection was little compared to the number used in international frameworks of sustainability indicators, where generally the assessment framework could have over 50 indicators of different natures (see Table 1). Simultaneously, it was noted that some key indicators for the assessment of sustainable cities, specifically in vulnerable communities, such as the social housing environments and urban decarbonization targets, had not been prioritized in the final selection of 30 indicators. For instance, the indicator of self-containment, which is responsible for measuring the capacity of an urban environment to supply the job demand for its inhabitants [47], or the GHG emissions from the embodied energy of the materials and processes used for construction [47,54]. In this regard, the discussion led to the proposal of adding these indicators to the selection as a complement to the 30 indicators even if the results of the survey had not prioritized them. Within the same logic, the inclusion of three other indicators were proposed: the affordability of housing rental, the provision of social housing units, and the total final thermal energy consumption in buildings’ operation. The selection exercise had as a result a set of 35 indicators (Table 5) chosen by the stakeholders in various stages or through different participatory mechanisms.
The concern regarding the number of indicators included in the selection was managed with the consensus of experts highlighting that an assessment framework should be flexible and open to the possibility of integrating new indicators, according to the needs and the context of when or where they are being applied. Therefore, the indicators that were not prioritized in the selection but were part of pre-selection exercises, or even some indicators that were not handled in this study, could be included in this selection to enrich the assessment framework if the features of the case study require it. However, with this in mind, it was also critical to define a group of indicators that, under the current situation of the cities in Colombia, should be evaluated in all the scenarios as key performance indicators (KPIs). Therefore, it was necessary to define which indicators of the selection of 35 could be the KPIs to evaluate the sustainability conditions of the cities in Colombia, with special attention on the urban areas with a high presence of social housing units.
The definition of the KPIs was executed through another participatory exercise with the participation of a panel of experts, based on a Delphi process and the method of the SRF playing cards. For this approach, a deck of cards representing each of the 35 selected indicators was made (see Figure 2). The participants were introduced to the framework of the research and the results of the selection of indicators. Later, they were also introduced to the methodology of the workshop, which was divided into two parts. First, they had to filter from 15 to 20 indicators through an open discussion of their criteria and view of the actual paradigm of urban sustainability in Colombia, focused on the priorities to be evaluated in environments with a high presence of social housing. Later, in the second part, they had to define a hierarchical order of the indicators that they prioritized following the rules of the playing cards game [45].
Table 6 presents the indicators that were prioritized in the filtering exercise. The experts decided to prioritize 20 out of the 35 available indicators. Figure 2 presents the layout of the cards used to filter the critical indicators in the first part of the workshop, the first two lines of cards are the indicators prioritized by the experts. In the discussion to discard 15 of the 35 indicators, the convergence point was the application of the indicators to follow the targets of SDG11, with special attention on the secure and socioeconomically inclusive urban environments. In this regard, the board agreed to propose the modification of two indicators in the list of 35 to prioritize them in the filtering process. The first modification was the definition of the indicator Affordability of housing rental to make it more sensible to the population. The modification consisted into expand the indicator into affordability of housing in general, which meant including in the definition indicators of other living conditions different from rental (e.g., payment of a mortgage loan, or a lease). On the other hand, they also asked to change the indicator Surface water (runoff) management for a comprehensive indicator of risk management for natural disasters. The surface water management indicator had the chance to capture the mitigation potential of flood hazardous events. Nevertheless, to be prioritized as a potentially generalizable indicator for different environments in the country, the indicator should integrate the evaluation of other potential risks that could be critical according to the context of each city.
Following the first part, the participants had to sort the 20 indicators in a hierarchical ranking of relative importance concerning the others. According to the SRF methodology, the cards had to be placed from the most to the least important. The hierarchy defines that each level of the cards means that the actual card is one times more important than the subsequent card. However, there is also the chance to place different cards (indicators) on the same level, meaning that they were equally important. In the case that between some indicators the relative importance would be higher than one times, the algorithm allows placing one or more white cards between the different indicators, to indicate that the indicators are two, three, or n-times more important than the subsequent.
With this in mind, the participants arranged the 20 indicators in the setup presented in Figure 3. From the arrangement, it must be remarked that the experts agreed to arrange two indicators sharing the first position with the same importance. In addition, they placed four indicators on the fifth level with the same importance and they decided to use one white card between the tenth and eleventh position of the ranking. Finally, they also decided to place the same importance on the last two indicators (positions 19 and 20). With this in mind, the column “Position” in Table 6 shows the place (from the most to the less important) of each indicator after the application of the playing cards. The rows with more than one value represent indicators that were placed with the same importance in the ranking, such as Ambient air quality concerning PM2.5 over one year and Natural disasters risk management sharing the position of the most important indicator.
The definition of the first 10 indicators as the most critical answers to the vision of the cities, in which in some environments the basic needs are not satisfied, as these 10 indicators intend to measure the conditions of an urban environment regarding the basic needs or the bare minimum conditions that a city should provide to its inhabitants in their residency area. The indicators that start the ranking respond to the necessity of preserving life by providing safe urban environments from natural hazards such as floods, fires, and landslides. The first place is shared because air quality-related diseases are the main environmental risk factor related to mortality in Colombian cities. For the experts, these two indicators must be the first control that has to be fulfilled to think about achieving sustainable cities, and closing socioeconomic gaps. This is also directly related to the targets of SDG11: 11.1 (safe and affordable housing), 11.4 (protect the world’s cultural and natural heritage), 11.5 (reduce de adverse effects of natural disasters), 11.6 (reduce the environmental impact of cities), 11.7 (provide access to safe and inclusive green and public space), and 11.B (Implement policies for inclusion, resource efficiency, and disaster risk reduction). After ensuring an environment that is prone to preserve human life, the definition of the indicators in positions three to five are related to the opportunity of having a house with access to basic utilities. In this regard, it was discussed that stating the first indicators as a priority, the development should provide formal urban environments that translate into safe and adequate houses. However, in the discussion, it was highlighted that these indicators aimed to measure the closing of the quantitative habitational deficit, although it does not cover completely the measurement of the qualitative habitational deficit, which should be tackled in parallel to the quantitative. The following four indicators were placed on the same level because they are all considered services that, regardless of the socioeconomic conditions, all the cities should provide to their residents in their neighborhoods to achieve the objectives of the sustainability agenda. During the discussion, it was considered to propose the redefinition of these indicators as a compound index of accessibility to services and facilities in the residence area, however, it was not decided to get a better monitoring of the provision of these services in the area of analysis. The tenth indicator was the performance of the public transport system, as a driver to provide an efficient operation that satisfies the needs of the population to move within the city. Even if it was intended to prioritize other indicators, such as the job rate within the residence area (self-containment) or indicators related to the efficient consumption of public services, the provision of the right transport system could derivate to better conditions of living even if it does not mean that all the activities are being developed in the area of residence, as it is the goal of paradigms such as the cities of proximity. This was broadly discussed because, due to the conditions of the real estate market in Colombian cities, finding a place to live near a place of work is not feasible for most of the population, even less so if the target of analysis is zones with a high presence of social housing and vulnerable communities.
As stated before, the first 10 indicators in this exercise were prioritized over the others, including placing a white card to explicitly define a gap of importance between the two groups. Hence, after the discussion of the ranking, it was accepted to propose these 10 indicators as the KPIs that should be measured and optimized towards the achievement of the sustainability agenda and to improve the living conditions in a city, especially in vulnerable areas and social housing environments.
One of the big discussions in the arrangement and prioritization of the indicators was the position of the indicator that tracks the GHG emissions, and that putting it in the last place of the ranking would deliver a message of relegating the importance of carbon-neutral development strategies. However, the consensus was arrived at that even if it is a crucial metric, potentially with the optimization of the others, it would also be reduced by the carbon intensity of the urban environments. It was also highlighted that the plans to mitigate climate change should improve people’s living conditions as the path to achieving a carbon-neutral scenario. Finally, it was remarked that even though the other 10 indicators were not defined as KPIs, it must be remarked that these have been stated as highly important, and their analysis would always be relevant to monitor the progress toward a sustainable transition, and the decarbonization of urban environments. In the end, these 20 indicators have been prioritized from the first set of 56 indicators as critical metrics in the current paradigm of sustainable cities in Colombia.

4. Conclusions and Future Developments

The present study reports the process of indicator selection for urban sustainability assessment in the post-pandemic era through the involvement of stakeholders linked to urban planning and development, and sustainable development policies, with different points of view on the evaluation of urban systems. This paper illustrates in detail the process of indicator selection applied to the context of cities in Colombia, with special attention to social housing urban environments.
The selection work started with an identification of the background of similar exercises in which indicator systems were defined at the case study and international level. Based on this background, a pre-selection of indicators was proposed and further critically evaluated by a sample of stakeholders to determine their relevance in the current paradigm of post-pandemic sustainable cities. Subsequently, the exercise followed the development of a stakeholders’ involvement mechanism based on an online survey and a series of interviews with experts in Colombia to make an initial selection of relevant indicators. This participation process was framed by the Delphi method, in which a constant feedback cycle is established among the participants of the exercise. Starting from the pre-selection of 56 indicators, the survey allowed us to retrieve a selection of 30 indicators that were considered relevant or critical for the evaluation of sustainability in the system of cities in Colombia. Later, through a process of validation of the results with interviews with experts, an additional selection was defined to obtain a final series of 35 indicators.
Later, starting from these 35 indicators, with the help of a board of experts in monitoring and assessment, a workshop based on the SRF playing cards methodology was performed to select a set of KPIs and a rank of the most critical indicators for the context of Colombian cities. The outcome of this fraction of the work was a sample of 20 indicators sorted hierarchically according to the relative importance of each indicator concerning the others, in which the 10 most relevant indicators were defined as transferable KPIs for the assessment of urban sustainability in social housing environments in different cities of the country.
These indicators were sorted in a framework of 7 dimensions toward the definition of a comprehensive evaluation defined since the preselection. From the selection exercise, it was possible to retrieve some information related to the priorities of the stakeholders according to their selections. Even within the diversity of the participants, there was a consensus on the relevance of the indicators to evaluate the performance of the public transport systems of the cities; the environmental conditions that affect personal health (i.e., air quality); and the accessibility and availability of key services, for example urban green areas, education facilities or health facilities. In addition, it was found a specific willingness to prioritize the evaluation of socio-economic conditions such as the affordability of the utilities in the residential sector, the offer of jobs, and the household income in perspective with the cost of living. These are examples of the criteria with high relevance in the mindset of the stakeholders in the current post-pandemic paradigm of urban sustainability in Colombia. The prioritization of these criteria in the results of the survey and its validation exercise, responds to the reality of the cities in the country. For instance, the National Health Department has stated that health issues related to bad air quality are the main source of mortality related to natural risk factors in Colombian cities [55]. On the other hand, in a study of the activity and mobility patterns in the capital city during the COVID-19 outbreak, the results showed that in lower-income areas people had less chance to shift into teleworking and had to be exposed to longer commutes using the massive transport system, which was also a vector of high exposition to biological risk for these vulnerable communities. In addition, these low-income zones also are typically very dense, and the people had to spend most of their free time at home because they did not have a place to go in their neighborhoods [51]. These areas have also the highest concentration of social housing projects, and these issues are part of the historical spatial inequalities of the cities and were more exposed during the pandemic. Thus, these are issues that have to be tackled and should be prioritized within the development strategies to follow the Agenda 2030 in urban areas.
The same principle could be reflected also in the definition of the KPIs pursued in the workshop with experts, where from the selection of the indicators they defined a ranking of the most critical for the evaluation of an urban environment towards the achievement of the Agenda 2030. These KPIs respond to the evaluation of the basic services that a city should provide to its inhabitants in their zone of residency. The prioritization of the indicators responds to an evaluation of the bare minimum of safety to secure people’s life and progressively increase to other standards of life quality, for example the provision of formal, adequate, and affordable housing. Subsequently, it starts to expand the analysis from the units to the built environment and the services that should be offered around the house, and it closes with the evaluation of the public transport system as the service to navigate the city into another scale of analysis.
This approach is relevant in the local context, particularly when it is intended to assess sustainability conditions in areas with a considerable presence of social housing. It is also the reflex of how the societies working towards the achievement of the SDGs start from different conditions and the road could be longer and harder to transit for developing societies, and the international cooperation to assist developing countries in this transition seems crucial. Moreover, due to the particular context of the case study of this paper, it should be required to keep performing the exercise of indicator selection to monitor the impact of the urban policies toward the sustainability agenda in a way that recognizes that, while the metrics start to improve, the definition of the indicators start to change towards the definition of more ambitious thresholds to make a progress in closing the gaps and leaving no one behind. It is to be remarked that the indicators prioritized in this research should not serve as a metric to monitor ambitious development scenarios, since they have been validated to measure the fulfillment of the bare minimum standards of a formal city that seeks to transit into the sustainability agenda. Furthermore, it must be remarked that this approach has the limitation that it has been developed within the framework of a formal city, and it must be highlighted that in the world there is a huge share of the population living in urban slums or informal settlements, and monitoring the progress of these environments towards the formalization and regeneration of other indicators, such as the coverage of public services, should be included in a relevant assessment framework.
Even with these considerations, this work provides a framework to assess urban sustainability in the context of Colombian cities, and its value relies upon the selection of indicators that have been validated by relevant stakeholders in an extensive process of stakeholders’ involvement. Moreover, it offers a guide to scale this kind of exercise in developing countries, since it provides a theoretical and methodological guide to define an evaluation framework for urban sustainability in other contexts of the developing world where there is still a deficiency regarding the basic needs that cities should offer to the vulnerable communities. Thus, it could help different stakeholders from the urban development sector. Policymakers could help themselves from this study by retrieving the indicators proposed in this article to evaluate and follow policies for sustainable urbanization or the regeneration of marginal areas towards the improvement of living conditions in the cities. It could also serve as a guide to researchers that can take the framework as a reference to extend the works into other dimensions of the system of cities, even for a general and comprehensive evaluation of urban metabolism or for specific sectorial assessments of urban subsystems.
From now on, regarding the particular context developed in this study, it is necessary to define a baseline for three urban environments to be used as a case study in Colombia. Further, it will be required to make a spatial impact assessment in which the indicators selected in this paper must be calculated and spatialized for the selected three control case studies. These case studies are expected to be in urban environments with a high presence of social housing in Bogota.

Author Contributions

J.R.E.H.: conceptualization, methodology, formal analysis, investigation, writing—original draft; S.T.M.: conceptualization, methodology, writing and revision, supervision; P.L.: supervision and revision of the whole work. All authors have read and agreed to the published version of the manuscript.

Funding

This research received no external funding.

Informed Consent Statement

Informed consent was obtained from all subjects involved in the study.

Data Availability Statement

Data is available upon request by mail to the corresponding correspondent author.

Conflicts of Interest

The authors declare no conflict of interest.

Appendix A. General Results of the Survey—Relevance Evaluation of the Indicators

Table A1. Compiled results of the relevance index.
Rank
(Overall Mean)
IdNameUnitDimensionOverall MeanPrivate Sector MeanPublic Sector MeanConstruction Sector Mean
140Performance of the public transport systemmin/day (time dedicated to commuting)Social3.763.693.893.93
233Ambient air quality concerning PM2.5 over one yearµg/m3 yearEnvironment3.623.593.723.50
323Consumption of potable water for the residential populationm3/inh. yearNon-renewable resources3.583.593.503.86
41Urban densityarea—territorial surfaceBuilt urban systems3.563.553.613.79
534Green zones and recreation areas availabilitym2/inh.Environment3.563.553.563.71
635Green zones and recreation areas accessibilitym—min.Environment3.533.523.563.71
741Quality of pedestrian and bicycle networknominal scaleSocial3.533.483.613.57
839Quality of public spacenominal scaleEnvironment3.513.483.563.71
913Affordability of residential utilities% of minimum wage Economy3.493.283.783.29
1053Perceived safety of public areas for pedestriansnominal scaleSocial3.473.313.673.36
1144Availability and proximity of a secondary schoolm—min.Social3.423.413.393.36
1248Availability and proximity of key servicesm—min.Social3.423.523.223.57
1343Availability and proximity of a primary school m—min.Social3.403.343.443.21
144Walking distance to public transportm.Built urban systems3.383.313.503.50
1522Total GHG emissions from buildings, private and public mobilitytCO2-eq/yearAtmospheric emissions3.363.283.503.21
1625Access to solid waste and recycling collection pointsm—min.Non-renewable resources3.363.483.223.36
1730Surface water (runoff) managementm3/h (drained by NBS and SUDS)Environment3.363.413.283.50
182Land use compositionm2 by type of land use -%Built urban systems3.333.413.223.14
196Intermodal facilitiesintermodal nodes/km2Built urban systems3.313.213.503.36
2026Separate collection and disposal of solid waste and recycling % of waste in final disposal (t not recycled/t of waste)Non-renewable resources3.293.283.393.07
2118Total primary energy demand for building operationskWh/m2 yearEnergy3.273.413.063.43
2245Availability and proximity of children’s play facilitiesm—min.Social3.203.033.443.00
2337Tree coverage for shade and management of local ambient temperatures-Environment3.163.073.283.14
249Income equity for residential householdsUSD—COP Economy3.113.073.173.43
2515Total final electrical energy consumption for building operationskWh/m2 yearEnergy3.113.213.003.14
2624Consumption of potable water for non-residential building systemsm3/m2 yearNon-renewable resources3.113.212.893.21
2742Availability and proximity of key food and retail servicesm—min.Social3.113.033.223.29
2819Electrical energy consumption in public spaceKWh/yearEnergy3.043.103.063.50
2921Total GHG emissions from primary energy used in building operationstCO2-eq/yearAtmospheric emissions3.043.142.943.07
3036Heat island effect in the local areaTemp.Environment3.042.793.392.79
3110Average annual per-capita income of residentsUSD—COPEconomy2.982.903.173.29
3250Community involvement in urban planning activities# Of spaces opened and # Of participantsSocial2.962.833.112.93
3338Ecological sensitivity classification of the areaecosystem services quantifiedEnvironment2.933.002.833.07
3452Compatibility of public open space with local cultural valuesnominal scaleSocial2.933.002.723.14
3517Share of renewable energy on-site, relative to final electrical energy consumption %Energy2.912.902.942.93
3646Availability and proximity of leisure facilitiesm—min.Social2.892.862.893.00
3729Recharge of groundwater through permeable paving or landscapingm3Non-renewable resources2.872.902.672.71
387Self-containment%Economy2.843.002.563.00
3949Involvement of residents in community affairs# Of spaces opened and # Of participantsSocial2.842.932.722.64
4051Compatibility of urban design with local cultural valuesnominal scaleSocial2.842.932.613.14
4131Summer thermal comfort conditionsoperative temperatureEnvironment2.822.902.562.93
4247Availability and proximity of cultural facilitiesm—min.Social2.822.792.832.86
435Extent and connectivity of bicycle paths separated from vehicular traffickm cycle inf./km road inf.Built urban systems2.802.663.002.79
4411Employment rate% inh.Economy2.802.862.783.14
4527Percent of reused or recycled materials used for construction or renovation%Non-renewable resources2.802.862.672.86
463Conservation of land% m2/m2Built urban systems2.712.762.672.79
4756Aesthetic quality of new facility exteriorsnominal scaleSocial2.712.862.503.00
4855Perceptual quality of area developmentnominal scaleSocial2.692.662.782.86
4920GHG emissions from energy embodied in construction materials used for construction, maintenance, or replacement(s)tCO2-eq/yearAtmospheric emissions2.672.762.562.50
5028Adaptive re-use of existing buildings and structures # BuildingsNon-renewable resources2.672.832.502.57
5132Winter thermal comfort conditionsOperative temperatureEnvironment2.622.792.332.64
528Affordability of housing rentalUSD/COP/%Minimum WageEconomy2.602.592.612.57
5354Impact of overhead electric distribution system on the visual environmentm of exposed distribution networkSocial2.602.552.612.71
5412Provision of social housing units% (SH Unts/H Units)Economy2.492.552.442.86
5516Share of renewable energy on-site, relative to total final thermal energy consumption for building operations%Energy2.442.342.612.57
5614Total final thermal energy consumption for building operationskWh/m2 year—m3/m2 yearEnergy2.402.452.282.29

References

  1. UN Cities—United Nations Sustainable Development. Available online: https://www.un.org/sustainabledevelopment/cities/ (accessed on 10 June 2022).
  2. United Nations. Transforming Our World: The 2030 Agenda for Sustainable Development. Available online: https://sdgs.un.org/2030agenda (accessed on 10 June 2022).
  3. United Nation-HLPF. 2018 Review of SDGs Implementation: SDG 11—Make Cities and Human Settlements Inclusive, Safe, Resilient and Sustainable. In High-Level Political Forum on Sustainable Development; United Nations: New York, NY, USA, 2018; pp. 1–11. [Google Scholar]
  4. United Nations. The Sustainable Development Goals Report; United Nations: New York, NY, USA, 2022. [Google Scholar]
  5. United Nations. SDG 11—Build Resilient Infrastructure, Promote Inclusive and Sustainable Industrialization and Foster Innovation. In The Role of Business Key Business Themes Addressed by This SDG Examples of Key Business Actions and Solutions Examples of Key Business Tools; United Nations: New York, NY, USA, 2016. [Google Scholar]
  6. Kolesnichenko, O.; Mazelis, L.; Sotnik, A.; Yakovleva, D.; Amelkin, S.; Grigorevsky, I.; Kolesnichenko, Y. Sociological Modeling of Smart City with the Implementation of UN Sustainable Development Goals. Sustain. Sci. 2021, 16, 581–599. [Google Scholar] [CrossRef]
  7. van Zanten, J.A.; van Tulder, R. Towards Nexus-Based Governance: Defining Interactions between Economic Activities and Sustainable Development Goals (SDGs). Int. J. Sustain. Dev. World Ecol. 2021, 28, 210–226. [Google Scholar] [CrossRef]
  8. Krellenberg, K.; Koch, F. Conceptualizing Interactions between Sdgs and Urban Sustainability Transformations in COVID-19 Times. Politics and Governance 2021, 9, 200–210. [Google Scholar] [CrossRef]
  9. Weitz, N.; Carlsen, H.; Nilsson, M.; Skånberg, K. Towards Systemic and Contextual Priority Setting for Implementing the 2030 Agenda. Sustain. Sci. 2018, 13, 531–548. [Google Scholar] [CrossRef]
  10. Batty, M. Cities as Complex Systems: Scaling, Interactions, Networks, Dynamics and Urban Morphologies; UCL Centre for Advanced Spatial Analysis: London, UK, 2005; Volume 44. [Google Scholar]
  11. Anelli, D.; Tajani, F.; Ranieri, R. Urban Resilience against Natural Disasters: Mapping the Risk with an Innovative Indicators-Based Assessment Approach. J. Clean. Prod. 2022, 371, 133496. [Google Scholar] [CrossRef]
  12. Global Indicator Framework for the Sustainable Development Goals and Targets of the 2030 Agenda for Sustainable Development Goals and Targets (from the 2030 Agenda for Sustainable Development) Indicators. Available online: https://unstats.un.org/sdgs/indicators/indicators-list/ (accessed on 10 June 2022).
  13. Abastante, F.; Lami, I.M.; Gaballo, M. Pursuing the SDG11 Targets: The Role of the Sustainability Protocols. Sustainability 2021, 13, 3858. [Google Scholar] [CrossRef]
  14. UN-Habitat. Sustainable Development Goal 11—A Guide to Assist National and Local Governments to Monitor and Report on SDG 11+ Indicators; UN-Habitat: Nairobi, Kenya, 2018. [Google Scholar]
  15. CESBA MED Project. Documento Orientativo CESBA MED; CESBA MED Project: Schwarzenberg, Austria, 2020. [Google Scholar]
  16. Merino-Saum, A.; Halla, P.; Superti, V.; Boesch, A.; Binder, C.R. Indicators for Urban Sustainability: Key Lessons from a Systematic Analysis of 67 Measurement Initiatives. Ecol. Indic. 2020, 119, 106879. [Google Scholar] [CrossRef]
  17. Tokazhanov, G.; Tleuken, A.; Durdyev, S.; Otesh, N.; Guney, M.; Turkyilmaz, A.; Karaca, F. Stakeholder Based Weights of New Sustainability Indicators Providing Pandemic Resilience for Residential Buildings. Sustain. Cities Soc. 2021, 75, 103300. [Google Scholar] [CrossRef]
  18. World Bank. Urban Sustainability Framework: 1st ed. Available online: https://documents.worldbank.org/en/publication/documents-reports/documentdetail/339851517836894370/urban-sustainability-framework-1st-ed (accessed on 22 March 2022).
  19. Pradhan, P.; Costa, L.; Rybski, D.; Lucht, W.; Kropp, J.P. A Systematic Study of Sustainable Development Goal (SDG) Interactions. Earths Future 2017, 5, 1169–1179. [Google Scholar] [CrossRef]
  20. van Soest, H.L.; van Vuuren, D.P.; Hilaire, J.; Minx, J.C.; Harmsen, M.J.H.M.; Krey, V.; Popp, A.; Riahi, K.; Luderer, G. Analysing Interactions among Sustainable Development Goals with Integrated Assessment Models. Glob. Transit. 2019, 1, 210–225. [Google Scholar] [CrossRef]
  21. Ament, J.M.; Freeman, R.; Carbone, C.; Vassall, A.; Watts, C. An Empirical Analysis of Synergies and Tradeoffs between Sustainable Development Goals. Sustainability 2020, 12, 8424. [Google Scholar] [CrossRef]
  22. Cardona Urrea, S.; Alexander Escobar García, D.; Javier Velásquez, C.; Sisa, A.; Maturana, A.; Rivillas, G.; Ávila, H.; Janer, J.; Aldana, J.; Rojas, O.; et al. Universidad de Los Andes Systemic Perspectives on Low-Carbon Cities in Colombia-An Integrated Urban Modeling Approach for Policy and Regulatory Analysis Reporte de Transferencias FASE II: Marzo 2021 Equipo Universidad Nacional Sede Medellín; Universidad de los Andes: Bogota, Colombia, 2021. [Google Scholar]
  23. Pignatelli, M.; Torabi Moghadam, S.; Genta, C.; Lombardi, P. Spatial Decision Support System for Low-Carbon Sustainable Cities Development: An Interactive Storytelling Dashboard for the City of Turin. Sustain. Cities Soc. 2023, 89, 104310. [Google Scholar] [CrossRef]
  24. Sharifi, A.; Khavarian-Garmsir, A.R. The COVID-19 Pandemic: Impacts on Cities and Major Lessons for Urban Planning, Design, and Management. Sci. Total Environ. 2020, 749, 142391. [Google Scholar] [CrossRef] [PubMed]
  25. AbouKorin, S.A.A.; Han, H.; Mahran, M.G.N. Role of Urban Planning Characteristics in Forming Pandemic Resilient Cities—Case Study of COVID-19 Impacts on European Cities within England, Germany and Italy. Cities 2021, 118, 103324. [Google Scholar] [CrossRef]
  26. Cuerdo-Vilches, T.; Navas-Martín, M.Á.; Oteiza, I. Behavior Patterns, Energy Consumption and Comfort during COVID-19 Lockdown Related to Home Features, Socioeconomic Factors and Energy Poverty in Madrid. Sustainability 2021, 13, 5949. [Google Scholar] [CrossRef]
  27. Tampe, T. Potential Impacts of COVID-19 in Urban Slums: Addressing Challenges to Protect the World’s Most Vulnerable. Cities Health 2021, 5, S76–S79. [Google Scholar] [CrossRef]
  28. Megahed, N.A.; Ghoneim, E.M. Antivirus-Built Environment: Lessons Learned from COVID-19 Pandemic. Sustain. Cities Soc. 2020, 61, 102350. [Google Scholar] [CrossRef]
  29. Abastante, F.; Lami, I.M.; Mecca, B. How COVID-19 Influences the 2030 Agenda: Do the Practices of Achieving the Sustainable Development Goal 11 Need Rethinking and Adjustment? Valori e Valutazioni 2020, 2020, 11–23. [Google Scholar] [CrossRef]
  30. Kakderi, C.; Oikonomaki, E.; Papadaki, I. Smart and Resilient Urban Futures for Sustainability in the Post COVID-19 Era: A Review of Policy Responses on Urban Mobility. Sustainability 2021, 13, 6486. [Google Scholar] [CrossRef]
  31. Tleuken, A.; Tokazhanov, G.; Guney, M.; Turkyilmaz, A.; Karaca, F. Readiness Assessment of Green Building Certification Systems for Residential Buildings during Pandemics. Sustainability 2021, 13, 460. [Google Scholar] [CrossRef]
  32. Valenzuela-Levi, N.; Echiburu, T.; Correa, J.; Hurtubia, R.; Muñoz, J.C. Housing and Accessibility after the COVID-19 Pandemic: Rebuilding for Resilience, Equity and Sustainable Mobility. Transp. Policy 2021, 109, 48–60. [Google Scholar] [CrossRef]
  33. Campolongo, F.; Commission, E.; Cariboni, J.; Commission, E.; Rita, A.; Manca, R.; Commission, E. Time for Transformative Resilience: The COVID-19 Emergency; Publications Office of the European Union: Luxembourg, 2020. [Google Scholar] [CrossRef]
  34. Pelling, M.; Chow, W.T.L.; Chu, E.; Dawson, R.; Dodman, D.; Fraser, A.; Hayward, B.; Khirfan, L.; McPhearson, T.; Prakash, A.; et al. A Climate Resilience Research Renewal Agenda: Learning Lessons from the COVID-19 Pandemic for Urban Climate Resilience. Clim. Dev. 2021, 14, 617–624. [Google Scholar] [CrossRef]
  35. OECD. National Urban Policy Review of Colombia; OECD Urban Studies; OECD: Paris, France, 2022. [Google Scholar]
  36. OECD. Cities Policy Responses—OECD. Available online: https://read.oecd-ilibrary.org/view/?ref=126_126769-yen45847kf&title=Coronavirus-COVID-19-Cities-Policy-Responses (accessed on 30 May 2022).
  37. Musa, H.D.; Yacob, M.R.; Abdullah, A.M.; Ishak, M.Y. Delphi Method of Developing Environmental Well-Being Indicators for the Evaluation of Urban Sustainability in Malaysia. Procedia Environ. Sci. 2015, 30, 244–249. [Google Scholar] [CrossRef]
  38. Farhadi, E.; Pourahmad, A.; Ziari, K.; Faraji Sabokbar, H.; Tondelli, S. Indicators Affecting the Urban Resilience with a Scenario Approach in Tehran Metropolis. Sustainability 2022, 14, 12756. [Google Scholar] [CrossRef]
  39. Lohuis, A.M.; van Vuuren, M.; Bohlmeijer, E. Context-Specific Definitions of Organizational Concepts: Defining ‘Team Effectiveness’ with Use of the Delphi Technique. J. Manag. Organ. 2013, 19, 706–720. [Google Scholar] [CrossRef]
  40. Lombardi, P.; Abastante, F.; Torabi Moghadam, S.; Toniolo, J. Multicriteria Spatial Decision Support Systems for Future Urban Energy Retrofitting Scenarios. Sustainability 2017, 9, 1252. [Google Scholar] [CrossRef]
  41. The Lancet Public Health. Will the COVID-19 Pandemic Threaten the SDGs? Lancet Public Health 2020, 5, e460. [Google Scholar] [CrossRef] [PubMed]
  42. Moghadam, S.T.; Lombardi, P.; Mutani, G. A Mixed Methodology for Defining a New Spatial Decision Analysis towards Low Carbon Cities. Procedia Eng. 2017, 198, 375–385. [Google Scholar] [CrossRef]
  43. Hendricks, M.D.; Meyer, M.A.; Gharaibeh, N.G.; van Zandt, S.; Masterson, J.; Cooper, J.T.; Horney, J.A.; Berke, P. The Development of a Participatory Assessment Technique for Infrastructure: Neighborhood-Level Monitoring towards Sustainable Infrastructure Systems. Sustain. Cities Soc. 2018, 38, 265–274. [Google Scholar] [CrossRef]
  44. Dindler, C.; Smith, R.; Iversen, O.S. Computational Empowerment: Participatory Design in Education. CoDesign 2020, 16, 66–80. [Google Scholar] [CrossRef]
  45. Figueira, J.; Roy, B. Determining the Weights of Criteria in the ELECTRE Type Methods with a Revised Simos’ Procedure. Eur. J. Oper. Res. 2002, 139, 317–326. [Google Scholar] [CrossRef]
  46. OECD. Green Growth Indicators 2017|OECD Green Growth Studies|OECD ILibrary. Available online: https://www.oecd-ilibrary.org/environment/green-growth-indicators-2017_9789264268586-en (accessed on 27 September 2022).
  47. Smith, R.; Ángela, Q.; Monroy, C.; Mónica; Valderrama, E.; Quijano, N.; Escallón, C.; Guevara, J.A.; Guzmán, L.A.; Jiménez, G.; et al. Ciudades Sostenibles un Enfoque de Modelaje Urbano Integrado Para el Análisis de Política en Colombia, 1st ed.; Ediciones Uniandes: Bogota, Colombia, 2022; ISBN 9789587982817. [Google Scholar]
  48. NAMA Facility; Center for Clean Air Policy; Findeter; CIUDAT; WWF; Hill Consulting. Guía Para Monitorear Proyectos de Desarrollo Orientado Por el Transporte Sostenible en Colombia—Estrategia de Monitoreo y Evaluación Para Colombia TOD NAMA; Findeter: Bogota, Colombia, 2020. [Google Scholar]
  49. BID. Guía Metodológica Programa de Ciudades Emergentes y Sostenibles: Tercera Edición: Anexo de Indicadores. Available online: https://publications.iadb.org/es/guia-metodologica-programa-de-ciudades-emergentes-y-sostenibles-tercera-edicion-anexo-de (accessed on 27 June 2022).
  50. de Valderrama, N.M.F.; Luque-Valdivia, J.; Aseguinolaza-Braga, I. The 15 Minutes-City, a Sustainable Solution for PostCOVID19 Cities? Ciudad y Territorio Estudios Territoriales 2020, 52, 653–664. [Google Scholar] [CrossRef]
  51. Guzman, L.A.; Arellana, J.; Oviedo, D.; Moncada Aristizábal, C.A. COVID-19, Activity and Mobility Patterns in Bogotá. Are We Ready for a ‘15-Minute City’? Travel Behav. Soc. 2021, 24, 245–256. [Google Scholar] [CrossRef]
  52. Reed, M.S.; Graves, A.; Dandy, N.; Posthumus, H.; Hubacek, K.; Morris, J.; Prell, C.; Quinn, C.H.; Stringer, L.C. Who’s in and Why? A Typology of Stakeholder Analysis Methods for Natural Resource Management. J. Environ. Manag. 2009, 90, 1933–1949. [Google Scholar] [CrossRef]
  53. Arias, S.R.; Moghadam, S.T.; Lombardi, P. Scenario Analysis for Incremental Community Planning in an African Context. Sustainability 2020, 12, 8133. [Google Scholar] [CrossRef]
  54. Macias, J.; Iturburu, L.; Rodriguez, C.; Agdas, D.; Boero, A.; Soriano, G. Embodied and Operational Energy Assessment of Different Construction Methods Employed on Social Interest Dwellings in Ecuador. Energy Build. 2017, 151, 107–120. [Google Scholar] [CrossRef]
  55. Minsalud Comprometido Con La Calidad Del Aire. Available online: https://www.minsalud.gov.co/Paginas/Minsalud-comprometido-con-la-calidad-del-aire-.aspx (accessed on 24 January 2023).
Figure 1. Methodological framework.
Sustainability 15 02830 g001
Figure 2. Filtering process—workshop part 1.
Sustainability 15 02830 g002
Figure 3. Ranking of indicators according to the SRF method—workshop Part 2.
Sustainability 15 02830 g003
Table 1. Sources of indicators.
N.FrameworkOrganizationLocationYearIndicatorsSource
1Global Indicators Framework for the SDGsUN-Sust. DevelopmentInternational—Global2017231
(14 for SDG11)
[12]
2Urban Sustainability FrameworkWorld BankInternational—Global2018182[18]
3Urban Environmental indicators—Green growth in citiesOECDInternational—Global201780[46]
4Systemic Perspective for Low Carbon Cities in Colombia. A Regulatory and Policy Approach.University of the Andes, Colombian Green Building CouncilNational—Colombian cities202080[47]
5System for Monitoring and Evaluation of the TODS NAMACCAP, Findeter, CIUDAT, WWF, Hill ConsultingNational—Colombian cities202048[48]
6CESBA-MED ProjectCESBA-MED: Sustainable citiesInternational—European cities2020178[15]
7ESCI Indicators. In “Methodological Guide: Emerging and Sustainable Cities InitiativeIDBInternational—Iberoamerican cities2016127[49]
Table 2. Preselection of indicators.
Id.CriteriaIssueIndicator
1Built Urban SystemsUrban structure and formUrban density
2Land use composition
3Conservation of land
4Transportation infrastructureWalking distance of public transport
5Extent and connectivity of bicycle paths separated from vehicular traffic
6Intermodal facilities
7EconomyJobsSelf-containment
8Economic activityAffordability of housing rental
9Income equity for residential households
10Average annual per-capita income of residents
11Employment rate
12Provision of social housing units
13Cost and InvestmentAffordability of residential utilities
14Total final thermal energy consumption for building operations
15EnergyConsumptionTotal final electrical energy consumption for building operations
16Share of renewable energy on-site, relative to total final thermal energy consumption for building operations
17Share of renewable energy on-site, relative to final electrical energy consumption
18Total primary energy demand for building operations
19Electrical energy consumption in public space
20Atmospheric emissionsAtmospheric emissionsGHG emissions from energy embodied in construction materials used for construction, maintenance, or replacement(s)
21Total GHG emissions from primary energy used in building operations
22Total GHG emissions from buildings, private, and public mobility
23Non-renewable resourcesConsumptionConsumption of potable water for the residential population
24Consumption of potable water for non-residential building systems
25Solid and liquid wastesAccess to solid waste and recycling collection points
26Separate collection and disposal of solid waste and recycling
27Percent of reused or recycled materials used for construction or renovation
28Adaptive re-use of existing buildings and structures
29EnvironmentOutdoor environmental qualityRecharge of groundwater through permeable paving or landscaping
30Surface water (runoff) management
31Summer thermal comfort conditions
32Winter thermal comfort conditions
33one year
34Ecosystems and landscapesGreen zones and recreation areas availability
35Green zones and recreation areas accessibility
36Heat island effect in the local area
37Tree coverage for shade and management of local ambient temperatures
38Ecological sensitivity classification of the area
39Social aspectsTraffic and mobility servicesQuality of public space
40Performance of the public transport system
41Public and private facilities and services (Proximity—Reachability)Quality of pedestrian and bicycle network
42Availability and proximity of key food and retail services
43Availability and proximity of a primary school
44Availability and proximity of a secondary school
45Availability and proximity of children’s play facilities
46Availability and proximity of leisure facilities
47Availability and proximity of cultural facilities
48Management and community involvementAvailability and proximity of key services
49Involvement of residents in community affairs
50Society, culture, and heritageCommunity involvement in urban planning activities
51Compatibility of urban design with local cultural values
52Compatibility of public open space with local cultural values
53Perceived safety of public areas for pedestrians
54Impact of overhead electric distribution system on the visual environment
55Perceptual quality of area development
56Aesthetic quality of new facility exteriors
Table 3. Stakeholders’ categorization.
StakeholdersClusterLevelNature
Ministry of environment and sustainable developmentGovernment and public administrationNationalPublic
Ministry of TransportGovernment and public administrationNationalPublic
Ministry of housing, city, and territoryGovernment and public administrationNationalPublic
National planning developmentGovernment and public administrationNationalPublic
Mayor’s office and city councilGovernment and public administrationLocal (Different cities)Public
District mobility officeGovernment and public administrationLocal (Different cities)Public
District habitat officeGovernment and public administrationLocal (Different cities)Public
District planning officeGovernment and public administrationLocal (Bogota)Public
District environment officeGovernment and public administrationLocal (Different cities)Public
Bogota urban development and renewal companyGovernment and public administrationLocal (Bogota)Public
IDECAGovernment and public administrationLocal (Bogota)Public
Transmilenio S.A.Government and public administrationLocal (Bogota)Private—Public
Metro Linea 1 SASGovernment and public administrationLocal (Bogota)Private—Public
CGBCConstruction and DesignNationalPrivate
Housing developersConstruction and DesignNationalPrivate
Home construction companiesConstruction and DesignNationalPrivate
Architectural designer co.Construction and DesignNationalPrivate
Environmental consultancyConsultancy and researchNationalPrivate
GIZConsultancy and researchNationalPrivate—Public
Engineering school—University of the AndesAcademy and researchLocal (Bogota)Private
Engineering school—University of the NorthAcademy and researchLocal (Bogota)Private
Engineering school—University of the SantanderAcademy and researchRegional (Santander)Private
Engineering school—National UniversityAcademy and researchLocal (Bogota)Private
Engineering school—Pontifical Javeriana UniversityAcademy and researchLocal (Different cities)Private
Architecture school—University of the AndesAcademy and researchLocal (Bogota)Private
Design school—University of the AndesAcademy and researchLocal (Bogota)Private
Interdisciplinary center for development studiesAcademy and researchLocal (Bogota)Private
Housing observatory—University of the AndesAcademy and researchLocal (Bogota)Private
World bankMultilateral bankInternationalPrivate
Interamerican development bankMultilateral bankInternationalPrivate
NGOsNGOsLocal (Bogota)Public
Table 4. Aggregated relevance index for each category of the indicators’ framework.
DimensionOverall Mean Relevance Ind.
Environment3.22
Built urban systems3.18
Non-renewable resources3.10
Social3.09
Atmospheric emissions3.02
Economy2.90
Energy2.86
Table 5. Final selection of indicators based on the survey.
Rank
(Overall Mean)
NameUnitDimension
1Performance of the public transport systemmin/day (time dedicated to commuting)Social
2Ambient air quality concerning PM2.5 over one yearµg/m3 yearEnvironment
3Consumption of potable water for the residential populationm3/inh. yearNon-renewable resources
4Urban densityarea—territorial surfaceBuilt urban systems
5Green zones and recreation areas availabilitym2/inh.Environment
6Green zones and recreation areas accessibilitym—min.Environment
7Quality of pedestrian and bicycle networknominal scaleSocial
8Quality of public spacenominal scaleEnvironment
9Affordability of residential utilities% of minimum wage Economy
10Perceived safety of public areas for pedestriansnominal scaleSocial
11Availability and proximity of a secondary schoolm—min.Social
12Availability and proximity of key servicesm—min.Social
13Availability and proximity of a primary school m—min.Social
14Walking distance to public transportm.Built urban systems
15Total GHG emissions from buildings, private and public mobilitytCO2-eq/yearAtmospheric emissions
16Access to solid waste and recycling collection pointsm—min.Non-renewable resources
17Surface water (runoff) managementm3/h (drained by NBS and SUDS)Environment
18Land use compositionm2 by land use—%Built urban systems
19Intermodal facilitiesintermodal nodes/km2Built urban systems
20Separate collection and disposal of solid waste and recycling % of waste in final disposal (t not recycled/t of waste)Non-renewable resources
21Total primary energy demand for building operationskWh/m2 yearEnergy
22Availability and proximity of children’s play facilitiesm—min.Social
23Tree coverage for shade and management of local ambient temperatures-Environment
24Income equity for residential householdsUSD—COP Economy
25Total final electrical energy consumption for building operationskWh/m2 yearEnergy
26Consumption of potable water for non-residential building systemsm3/m2 yearNon-renewable resources
27Availability and proximity of key food and retail servicesm—min.Social
28Electrical energy consumption in public spacekWh/yearEnergy
29Total GHG emissions from primary energy used in building operationstCO2-eq/yearAtmospheric emissions
30Heat island effect in the local areaTemp.Environment
31Self-containment%Economy
32GHG emissions from energy embodied in construction materials used for construction, maintenance, or replacement(s)tCO2-eq/yearAtmospheric emissions
33Affordability of housing rentalUSD/COP/%Minimum WageEconomy
34Provision of social housing units%Economy
35Total final thermal energy consumption for building operationskWh/m2 year—m3/m2 yearEnergy
Table 6. Selection and ranking of indicators—playing cards.
PositionNameUnitDimension
1,2Ambient air quality concerning PM2.5 over one yearµg/m3 yearEnvironment
1,2Natural disasters risk management-Environment
3Affordability of housingUSD/COP/%Minimum WageEconomy
4Provision of social housing units%Economy
5Affordability of residential utilities%Economy
6–9Availability and proximity of key servicesm—min.Social
6–9Availability and proximity of key food and retail servicesm—min.Social
6–9Availability and proximity of a primary schoolm—min.Social
6–9Availability and proximity of a secondary schoolm—min.Social
10Performance of the public transport systemmin/day (time dedicated to commuting)Social
11Consumption of potable water for the residential populationm3/inh. yearNon-renewable resources
12Total final thermal energy consumption for building operationskWh/m2 year—m3/m2 yearEnergy
13Perceived safety of public areas for pedestriansnominal scaleSocial
14Quality of public spacenominal scaleEnvironment
15Availability and proximity of children’s play facilitiesm—min.Social
16Self-containment%Economy
17Separate collection and disposal of solid waste and recycling% of householdsNon-renewable resources
18Total final electrical energy consumption for building operationskWh/m2 yearEnergy
19,20Total GHG emissions from buildings, private and public mobilitytCO2-eq/yearAtmospheric emissions
19,20Total GHG emissions from primary energy used in building operationstCO2-eq/yearAtmospheric emissions
Disclaimer/Publisher’s Note: The statements, opinions and data contained in all publications are solely those of the individual author(s) and contributor(s) and not of MDPI and/or the editor(s). MDPI and/or the editor(s) disclaim responsibility for any injury to people or property resulting from any ideas, methods, instructions or products referred to in the content.

