1. Introduction
With the rapid increase in regional electric vehicle (EV) ownership, there will be an associated large-scale demand for EV access to the regional power grid in the near future. Its random and cross-regional charging behavior will have a non-negligible impact on the security, stability, and economic operation of the regional power grid. With the support of China’s national policies and the promotion of market demand, EV ownership and the construction of charging piles in a certain region of China in recent years have increased and are shown in
Figure 1 and
Figure 2. According to
Figure 1, although the growth rate of EVs has slowed down in recent years, it still maintains a growth rate of nearly 30%. In terms of charging pile construction, it can be seen from
Figure 2 that the number of charging piles has maintained a relatively stable growth trend at an average growth rate of 39.8% in the past five years. By 2020, the region had invested in a total of 83,760 charging piles to provide charging services for EVs.
Due to the uncertainty of EVs in terms of time and space as a mobile charging load, the charging of most EVs is not controlled at present. When EVs are connected to the grid, they are charged immediately until either the battery is fully charged or they leave the grid. This charging behavior is not conducive to the safe and stable operation of the grid [
1]. Therefore, we need to pay attention to and study how to make full use of the flexibility of charging demand of EVs and the response potential of discharging to the regional power grid in advance so that EVs can interact well with the power grid after accessing it, and promote the coordinated and sustainable development of EVs and the power grid. EV charging load forecasting and demand response potential analysis are the research basis for EV charging load optimization and operation control, V2G (vehicle-to-grid), and EVs participating in grid ancillary services [
2].
The factors affecting the charging load of EVs are complex, and the charging behavior of different types of vehicles is also quite different. Therefore, to date, most scholars have studied and analyzed the influencing factors of the charging load of EVs. Reference [
3] proposed to consider the influence of EV parking probability in the charging load modeling process, and a two-stage method was used to determine the node where the charging load is located. Reference [
4] found that the timely interaction of multi-source information and the regret of users will affect the spatio-temporal distribution of the charging load. Reference [
5] constructed a charging decision optimization model considering time, charging cost, road condition, charging condition, and other factors to provide EV users with the best charging time and the lowest charging cost. Reference [
6] used a stochastic method to establish a probability model of electric vehicle charging modes considering vehicle type, battery capacity, state of charge, driving habits, and other factors. Reference [
7] established a prediction model considering real traffic distribution data and weather conditions, classified traffic patterns through cluster analysis, identified influencing factors through relationship analysis, and established classification criteria using the decision tree method.
Globally, many researchers have carried out studies into EV charging load prediction. The traditional method is to establish a mathematical model based on the load variation law. Reference [
8] proposed a new method for modeling and analyzing the charging load of EVs in residential areas based on the parking time of EVs, charging demand, and other factors. Taking a city as an example, Monte Carlo simulation and analysis were carried out, and relevant conclusions on the distribution of the charging load were drawn. In [
9], the Monte Carlo method was used to simulate the spatial and temporal distribution characteristics of the household EV charging load in a working day under the dual constraints of the regional traffic network and trip chain. Then, based on the spatial and temporal distribution results of the EV load, combined with the three characteristic factors of the state of charge, dwell time, and electricity price, the fuzzy algorithm was used to calculate the power and capacity involved in the response when the EV is connected to the network. Reference [
10] proposed an autoregressive integrated moving average method to simultaneously predict the conventional power load and the charging demand of EVs in the parking lot, taking the daily driving pattern and driving distance as input to determine the expected charging load distribution or combining them with the historical charging behavior data of the EVs. However, power load forecasting based on traditional methods is generally limited by two aspects in the modeling process: one is that it is difficult to include all of the influencing factors in the established model, and the other is that the internal relationship between the parameters is relatively complex, and it is usually difficult to determine [
11].
With the development of communication and Internet of Things technology, a large number of actual operation data can be obtained from the EV battery management system, such as the vehicle’s state of charge and mileage, as well as the external environmental information of the vehicles, such as the use of charging piles and meteorological data. Data analysis technology is used to study and analyze the driving behavior and power consumption of EVs [
12]. For example, Reference [
13] adopted the hierarchical probability prediction method and solved the standard probability models such as gradient enhanced regression tree, quantile regression forest, and quantile regression neural network and finally determined the hierarchical perspective to predict a total load of different geographical areas. Reference [
14] used the correlation analysis method to extract the factors affecting the charging load of electric bus stations, applied the gray correlation theory to construct a small sample set of similar days based on the relevant factors, and then established a Support Vector Machine (SVM) prediction model with multiple inputs and a single output. In [
15], a prediction model of EV charging load considering the daily type and maximum and minimum temperature was constructed. A fuzzy C-means (FCM) clustering algorithm was used to extract a similar daily load, and the Least Square Support Vector Machine (LS-SVM) was used for the prediction. Reference [
16] comprehensively considered the impact of time-of-use electricity price and the diversity of charging modes on the charging load distribution, simulated the time characteristics of the load distribution of EVs in disorder and order using the Monte Carlo method, and proposed a method of predicting the charging load space–time distribution of electric vehicles based on a fuzzy reasoning algorithm.
With the increase in EV ownership, a larger number of EVs will be connected to the grid in the future, and their charging and discharging behavior will have a significant impact on the grid [
17]. Reference [
18] proposed an EV charging load prediction method based on the Origin-Destination Matrix (ODM) and considering the spatio-temporal distribution and concluded that the EV charging load increases the peak load of the distribution network, which will affect the safe operation of the distribution network. Reference [
19] pointed out that when EVs randomly connect to the distribution network for fast charging after reaching the charging station, large fluctuations in the grid power and frequent alternation of peak and valley loads occur, which is not conducive to the stable operation of the distribution network. Reference [
20] selected the electricity method to analyze the calculation process of network loss. The authors highlighted the harm of network loss to the power grid, analyzed the causes of voltage deviation from the perspective of battery and reactive power, respectively, and pointed out the harm that voltage deviation causes to the power system. In order to evaluate the impact of large-scale deployment on the urban distribution network of plug-in EVs, Reference [
21] developed a spatio-temporal model (STM), which used the OD (origin–destination) analysis method in intelligent transportation research to model the mobility of electric vehicles. Reference [
22] established a coordination framework for EV charging to minimize the possibility of local overload and battery degradation in the distribution network, while Reference [
23] proposed using EVs for peak shaving and load curve correction, with the response load providing compensation for wind power and photovoltaic power generation. Reference [
24] proposed establishing a correct intelligent dispatching method for EVs to match renewable energy generation with EV charging so as to avoid problems such as the power quality degradation caused by distribution system overload.
As EV usage gradually becomes large-scale and the vehicles begin to participate in demand response, issues relating to flexibility and the possible risks for investors as well as the critical infrastructure of EVs participating in the regional power grid are being raised by scholars. In [
25], an aggregated EV fleet with different charging behaviors was integrated into the linear programming (LP) model as a flexible demand; the authors posit that using demand-side flexibility to balance the rescheduling demand can reduce the phenomenon of wind and light abandonment (up to 25%) and reduce the power generation of thermal power plants. Reference [
26] stated that some of the current research is devoted to using blockchain technology and machine learning to support the implementation of secure P2P transactions between prosumers and EVs so as to give full play to the flexibility of EVs in demand response. Reference [
27] proposed a new mathematical model to best quantify and maximize the flexibility of the EV battery-swapping station (BSS) load to provide demand response for utility operators and asserted that providing battery-switching services for EVs can reduce peak load and power station operating costs. Reference [
28] adopted a stochastic optimization method based on the downward risk constraint (DRC) to evaluate the risk of industrial energy hubs considering the presence of EVs. It has been found that this method can effectively achieve a basic risk level of zero and ensures that the system is free from economic losses. Reference [
29] described how the intelligent charging of EVs has the characteristics of investment flexibility and the potential ability to reduce the grounding investment and constructed a multi-stage stochastic programming framework to determine the best investment strategy and reduce the risk of grounding investment.
Based on the above, it is clear that the current research mainly focuses on the analysis of the factors influencing charging load, the prediction of charging load, and the impact of charging load on the power system. However, at present, EV load forecasting is mainly based on the mathematical model of load change law; the analysis of the charging behavior of EV users is not comprehensive enough, and the potential analysis and demand response architecture planning of EVs participating in the regional power grid demand response still need to be further improved. Consequently, after analyzing the influencing factors of regional EV ownership, this paper first establishes an EV prediction model based on the sparrow search algorithm-improved BP neural network (SSA-BPNN). On this basis, an EV charging load prediction model is established based on the sparrow search algorithm-improved BP neural network and Monte Carlo algorithm (SSA-BPNN-MC). Secondly, the charging behavior of different types of EVs is analyzed and modeled. Taking regional data as an example, the SSA-BPNN-MC model is used to predict the EV charging load. Then, based on the forecasting results, the demand response potential of future EV participation in the regional power grid is analyzed using the scenario analysis method. Finally, in order to solve the problem of data processing and the demand response management of the massive, multi-source, and heterogeneous electricity market, ancillary services market, regional power grid, and vehicles in the process of EVs participating in the regional power grid demand response, the basic framework of EVs participating in regional power grid demand response is planned.
The remainder of this paper is organized as follows.
Section 2 analyzes the regional EV ownership and charging load prediction, constructs the EV charging load prediction model based on SSA-BPNN-MC, analyzes and models the charging behavior of different types of EVs, and uses regional data as an example for prediction.
Section 3 analyzes the demand response potential of EVs participating in the regional power grid in the future using the scenario analysis method based on the EV charging load forecast results.
Section 4 plans the basic architecture for EVs to participate in the regional grid demand response.
Section 5 introduces the main conclusions of this study and the future work prospects. The main innovations and contributions of this paper are as follows:
- (1)
An EV charging load forecasting model based on the improved SSA-BPNN-MC is constructed, which introduces the sparrow search algorithm (SSA) into the BP neural network model to optimize its internal weights and thresholds. Compared with the traditional regression model, it has the advantages of high self-learning and adaptive ability.
- (2)
The scenario analysis method is used to analyze the potential of EVs participating in regional power grid demand response in the future. The results can provide a certain basis for the optimization and operational control of the EV charging load and vehicle-to-grid response.
- (3)
The demand response architecture of EVs participating in the regional power grid based on data space theory planning can provide certain support for promoting EV participation in regional power grid demand response.
2. Prediction of Regional EV Ownership and Charging Load
There are many factors affecting the regional charging load of EVs, and these factors are relatively complex. For example, the performance conditions of the vehicle itself, the charging facilities and environment of the power grid, the driving habits of EV users, and the use of EVs will have different degrees of impact on the EV load. The number of EVs, charging power, available battery capacity, and other parameters determine the charging demand level in the regional power grid, and the total charging load of regional EVs will increase with the concentration of charging time. Therefore, we first analyze the prediction of regional EV ownership and the charging behavior of EVs, and we then predict the future charging load of regional EVs.
2.1. Prediction Model of Electric Vehicle Ownership Based on SSA-BPNN
Firstly, the future population of regional EVs is predicted. As the data on the population of EVs are mainly annual statistics, the BPNN model improved by the SSA algorithm (SSA-BPNN) is used to predict the future population of EVs in a region between 2021 and 2030. The model can realize medium- and long-term predictions by analyzing the relationship between each influencing factor and the number of EVs.
Compared with traditional models such as vector autoregression and gray prediction, the BP neural network has significant advantages, such as high self-learning and adaptive ability, which essentially realizes the mapping from input to output and is suitable for solving prediction problems under the influence of multiple factors. However, the simple BP neural network model has a slow convergence rate, is sensitive to the initial value of the weight, and can easily fall into the local optimum. Therefore, many scholars have introduced the particle swarm and gray wolf optimization algorithms into the BP neural network to optimize the internal weight and threshold to improve the prediction accuracy of the BP neural network method. With the rapid development of swarm intelligence algorithms, an increasing number of swarm intelligence optimization algorithms have been proposed, and prediction accuracy has been improved. Based on the SSA, which has better convergence speed and robustness, this paper establishes a sparrow search algorithm-optimized BP neural network model to predict the number of EVs.
2.1.1. Analysis of Influencing Factors
The prediction of the future ownership of regional EVs is affected by many factors, which are mainly composed of external value chain factors and internal value chain factors. The external value chain factors include economic factors, policy subsidy factors, and technological development factors, while the internal value chain factors include charging facilities and construction and consumer factors. The specific analysis is provided in the following sections.
- (1)
Economic factors
The development of the automobile industry is closely related to economic factors. A good economic environment will help to improve the level of automobile consumption. Research has shown that when the per capita gross domestic product (GDP) in China increases by 1%, car ownership per thousand people increases by 0.46% [
30]. With the stable economic growth of China, the scale of the production and marketing of EVs has been ranked first in the world for many years. GDP is commonly used to measure the level of economic development of a region, but it is also affected by the number of people [
31]. Therefore, in this paper, we use the GDP per capita as an index to measure regional economic factors.
- (2)
Policy subsidies
Existing research shows that the regional EV industry is largely affected by policy subsidies. At the beginning of the development of EVs in China, as energy and environmental problems become increasingly serious, EVs have been vigorously promoted by the government as an effective tool to solve energy and environmental problems [
32]. In the “Automobile Industry Adjustment and Revitalization Plan” issued in 2009, the national energy-saving and new energy vehicle demonstration project began, and the central government arranged funds to subsidize it. In the same year, the “Notice on the Pilot Work of Demonstration and Promotion of Energy-Saving and New Energy Vehicles” was issued by the Ministry of Finance, which clarified the subsidy requirements for new energy vehicles in pilot cities. With the support of national policies and the promotion of market demand, in order to further encourage the development of EVs, various regions also introduced corresponding supporting subsidy policies. Therefore, this paper analyzes the average government subsidy index as one of the important factors affecting regional EV ownership.
- (3)
Technology development factors
With the gradual decline in financial subsidies, the regional EV industry will gradually change from policy support to market-driven; the maturity of technological development will become the fundamental factor for the development of the EV industry, and technological innovation will also play a considerable role in guiding consumers to buy. At present, with the continuous breakthrough of science and technology, the performance of EVs is also constantly improving, and its technological maturity shows a rapid upward trend [
33]. The survey and analysis show that the technical factors that consumers pay the most attention to when purchasing EVs are the range of the vehicle, followed by the appearance, price, and space. Generally speaking, the endurance mileage of EVs has always been an important factor affecting their development, and it can also directly reflect the maturity of technology development. Therefore, in this paper, we use sustainable endurance mileage to represent the factors of technology development.
- (4)
Construction of charging facilities
With the continuous improvement of related basic charging facilities such as regional charging stations and charging piles, it will be possible to effectively guarantee the operation of electric vehicles, improve their convenience, and thus improve people’s willingness to buy them. At present, the total number of charging facilities for EVs in China is the highest in the world, but the distribution gap across various regions is large, with charging stations being mainly concentrated in more developed medium and large cities, while the proportion in some underdeveloped regions is still very low [
34]. In the future, for urban development, the continuous improvement of charging facilities will inevitably lead more people to buy and use EVs. Therefore, for this paper, we selected the number of public charging piles to measure the construction of charging facilities, and we take this as an important basis for predicting the future ownership of EVs in a city.
- (5)
Consumer factors
Whether the development of regional EVs is successful or not is ultimately attributed to the attitude of consumers, and consumers’ recognition of EVs is an important factor affecting the number of EVs on the road. Consumer acceptance refers to the acceptance of EVs by consumers in many kinds of automotive products, which is affected by the development of EV technology and its supporting facilities. At present, consumers’ acceptance of EVs is still limited. The current market share of EVs is still small due to the practical problems mentioned in this paper, such as the level of technology development and the construction of charging facilities. However, with the solution to the above problems and the popularization of knowledge related to EVs, consumers will continue to improve their recognition of EVs [
35]. The percentage of EVs among the total number of vehicles can directly indicate consumer recognition of EVs and can be used as an important factor in predicting the future number of EVs.
2.1.2. SSA-BPNN Prediction Model
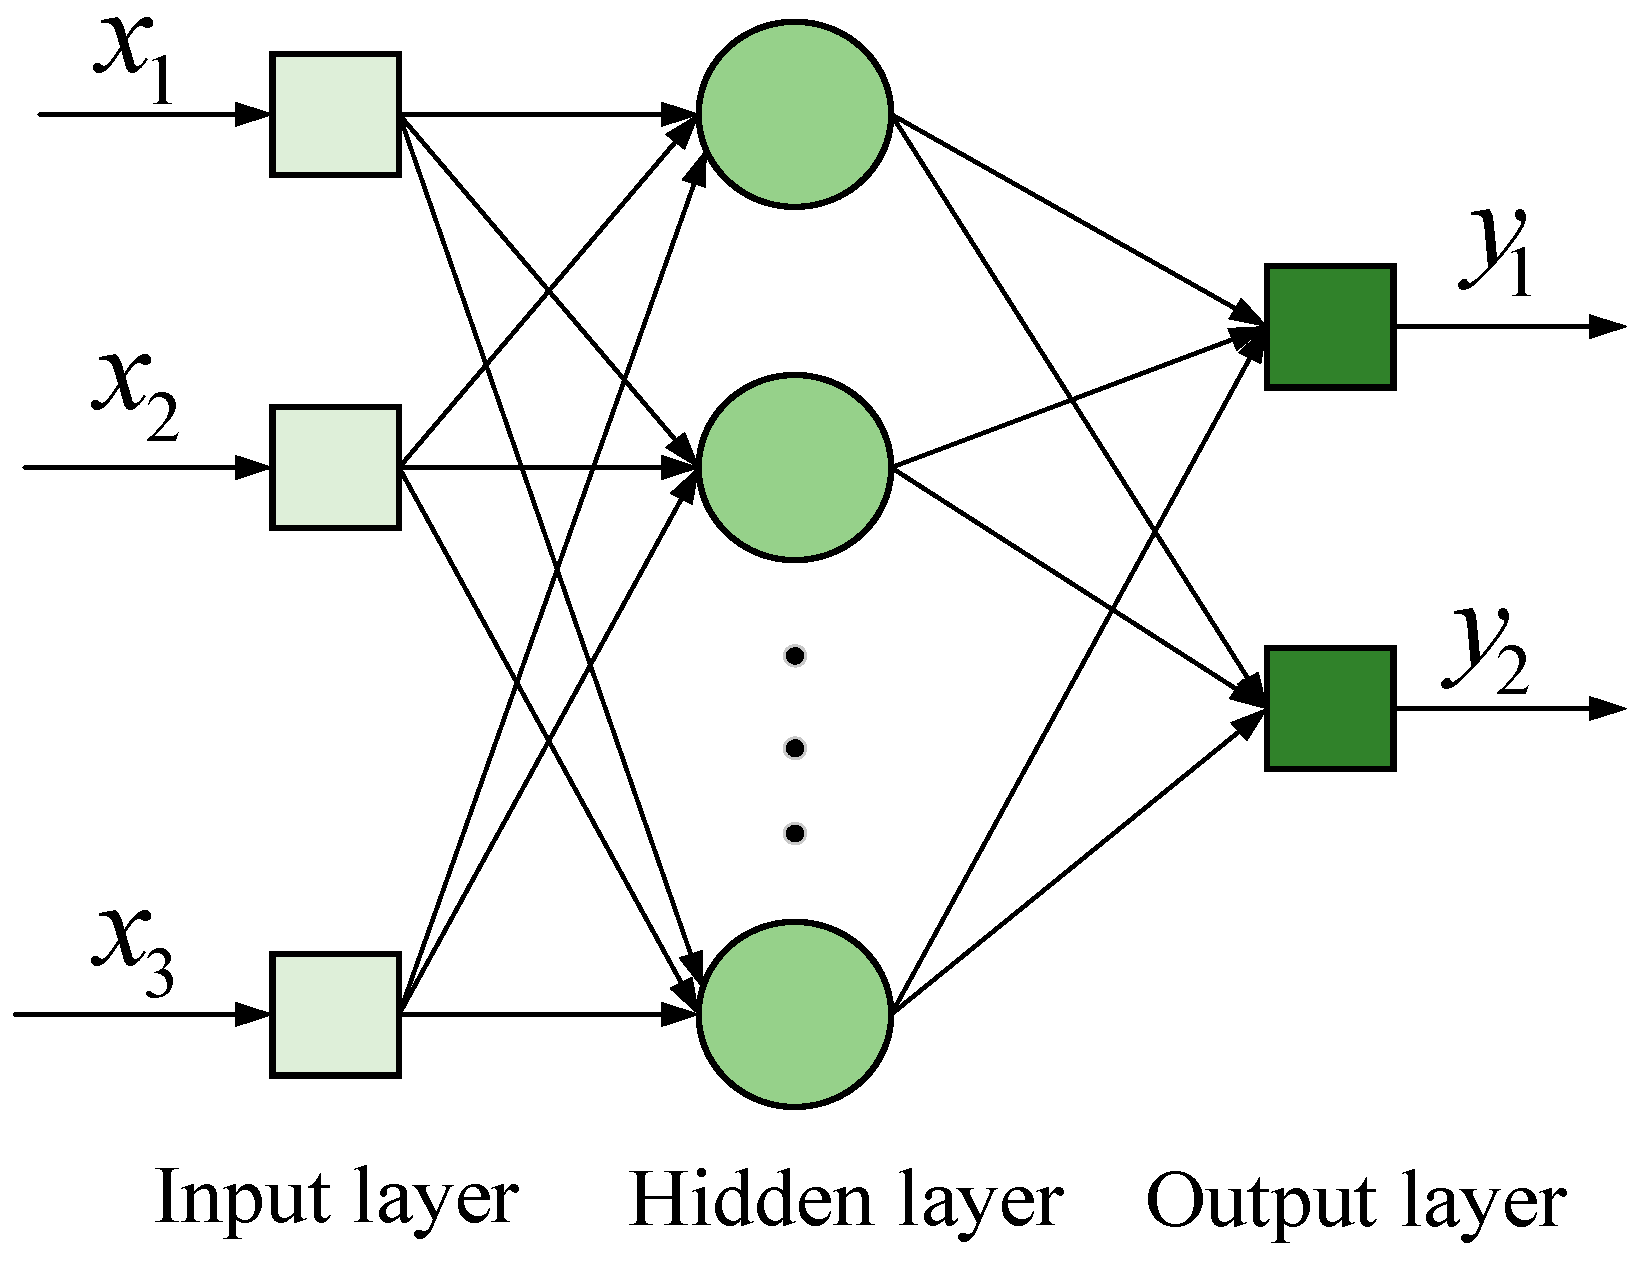
Based on the above analysis of the influencing factors of regional EV ownership, in this paper, we use the SSA-BPNN model to calculate EV ownership in a region from 2021 to 2030. BPNN is a multi-layer feed-forward neural network, and through a large amount of network training and using the backpropagation of error, the weights and thresholds in the network are optimized to achieve nonlinear data relationship mapping. The structure of the BP neural network prediction method is shown in
Figure 3.
The SSA algorithm is a swarm intelligence optimization algorithm based on the behavior of sparrows foraging and escaping from predators. In the process of foraging, sparrows are divided into finders and followers. The finders are responsible for finding food in the population and providing foraging areas and directions for the whole sparrow population, while the followers use the finders to obtain food. In a population, individuals will monitor the behavior of other individuals, and in order to increase their predation rate, attackers will compete with high-intake peers for food resources. In SSA, the finder with a better fitness value will preferentially obtain food during the search process. Since the finder needs to find food for the entire population and provide foraging directions for the followers, the finder can obtain a larger foraging search range than the followers.
During each iteration, the position of the finder is updated as shown in Equation (1):
where
denotes the current number of iterations,
represents the maximum number of iterations,
represents the position information of the
th sparrow in the
th dimension,
is a random number,
indicates the warning value,
denotes a safety value, and
denotes a random number subject to normal distribution.
is a matrix
, where every element in the matrix is 1. When
, it means that some sparrows in these populations have detected predators and alerted others in the population, at which time all sparrows need to quickly fly to other safe places to feed. The description of the follower’s location update is
where
denotes the optimal position occupied by the discoverer,
is the worst position in the current global, and
is population size.
is a matrix of
, and
. When
, it indicates that the
th follower with a lower fitness value fails to obtain food and is in a very hungry state. Therefore, in order to obtain more energy, it needs to fly to other places to find food. Sparrow populations will act against predation when they are aware of the danger, which is mathematically expressed as shown in Equation (3):
where
denotes the current global optimal position,
represents the step length control parameter, obeying the mean of 0, and the variance of 1 normal distribution of random numbers.
is a random number, indicating that the direction of movement of the sparrow is also a step length control parameter.
denotes the fitness value of the current individual sparrow,
represents the current global optimal fitness value,
represents the worst fitness value in the current global, and
is the smallest constant.
To avoid a denominator of 0, for simplicity, when
and
indicate that the sparrow is at the edge of the population and is extremely vulnerable to predators,
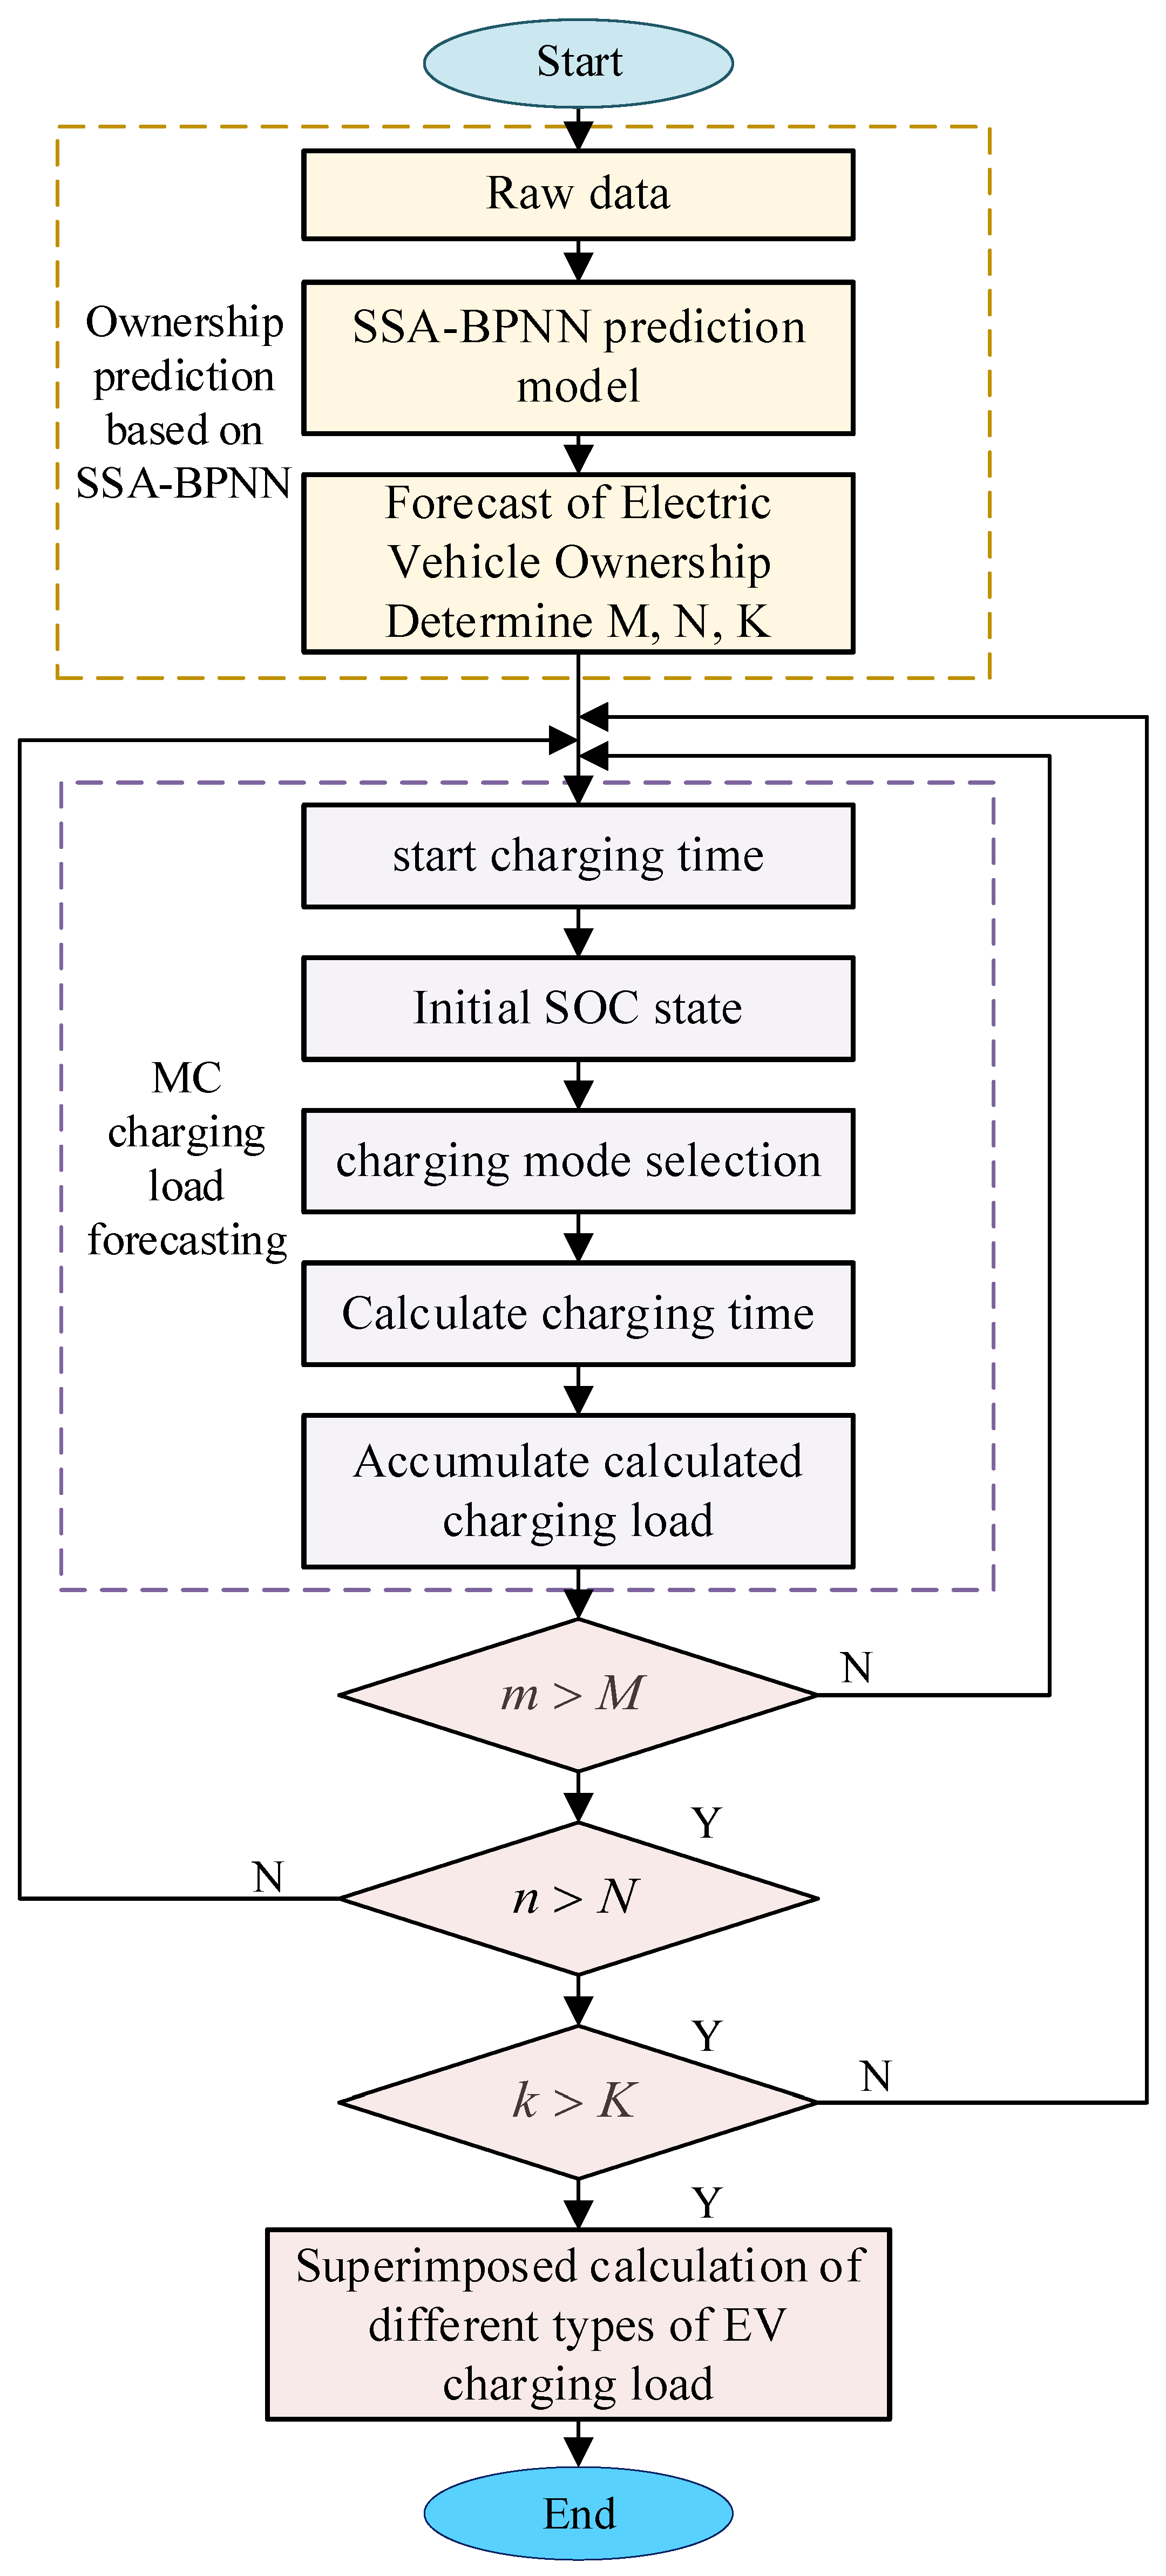
indicates that the sparrow in the middle of the population is aware of the danger and needs to stay close to other sparrows to avoid being preyed on. In this paper, the SSA algorithm is used to optimize the BPNN. Threshold and weight are the parameters of the BPNN that need to be optimized. By using the SSA to optimize the parameters, the performance of BPNN can be effectively improved, and better prediction analysis can be made. The specific flow chart of the SSA-BPNN model is shown in
Figure 4.
2.1.3. Data and Prediction Results
By referring to the
China Automobile Industry Yearbook,
Statistical Bulletin of National Economic and Social Development, the China Electric Vehicle Charging Infrastructure Promotion Alliance, the statistical data of the China Automobile Industry Association, the statistical data of the National Bureau of Statistics, and the relevant statistical yearbooks of a certain region, this paper summarizes the data of GDP per capita, average government subsidies, average sustainable mileage of electric vehicles, the number of public charging piles, and the percentage of electric vehicle ownership in the region’s car ownership from 2011 to 2020, as shown in
Table 1.
Because of the limited amount of sample data, a direct prediction may be prone to error, so for this paper, we used a data enhancement method to increase the number of effective samples in order to better carry out small sample feature learning. Data enhancement refers to a data expansion technology, which creates more equivalent data through limited data so as to solve the problem of using a small amount of data and improve the accuracy and stability of the prediction.
In addition, due to the different nature of the above indicators, they have different dimensions and orders of magnitude. To ensure the accuracy of the prediction results, dimensionless processing is needed. Therefore, we chose to normalize all indicators. The normalization method used was the Z-score standardization method, and its formula is as follows:
where
denotes the normalized data,
represents the mean of the overall data,
represents the standard deviation of the overall data, and
denotes the observed value of the individual.
When the proposed SSA-BPNN model is used for prediction, the five influencing factors mentioned above are taken as independent variables, and the number of EVs is taken as the dependent variable. The parameter settings of the SSA-BPNN prediction model are shown in
Table 2. Based on the historical data of EV ownership and its enhanced data from 2011 to 2020, SPSS was used to fit the data of the five influencing factors from 2021 to 2030 by linear regression. Among them, it is expected that the subsidy policy for EVs will be abolished by 2026, so the subsidy setting for 2026–2030 is 0. Then, based on the data of the above influencing factors, the SSA-BPNN model was established to predict the number of EVs in the region from 2021 to 2030. The specific data obtained from the prediction are shown in
Figure 5.
According to
Figure 5, the predicted value from 2011 to 2020 is the prediction result obtained during the model training process. It can be seen that the predicted value of electric vehicle ownership from 2011 to 2020 has a high degree of fit with the actual ownership situation, and the fitting error is small, indicating that the training process of the prediction model is good and the reliability of the prediction data is high. The data from 2021 to 2030 are predicted. The results show that the number of EVs will maintain a relatively stable growth trend from 2021 to 2026. After 2027, with the advancement of technology, the continuous improvement of vehicle mileage, and the further improvement of charging facilities, the number of EVs will increase. It is predicted that the number of EVs in the region will be 3.1775 million in 2030.
2.2. Analysis of Electric Vehicle Charging Behavior
Parameters such as the number of EVs, charging power, and available battery capacity determine the charging demand level in the regional power grid. However, the charging behavior of different types of EVs is quite different. The charging load curve is affected by many factors, including user travel time, parking time, charging time, battery capacity, and charging power [
36]. Based on the survey results from relevant institutions on the travel behavior rules of various electric vehicle users in Beijing, Hangzhou, and other demonstration cities, this paper mainly analyzes the charging behavior of electric buses, electric taxis, and electric private cars, and establishes the following charging behavior models of different types of EVs.
- (1)
Electric bus
According to the relevant travel planning, the daily travel time and route of the bus are relatively regular. The average daily mileage of the bus is about 150–200 km. Without considering the night bus, the first electric bus generally starts at 0530–0630 in the morning, and the last bus generally leaves at 2130–2230 in the evening. The peak hours of bus operation are from 0630 to 0900 and from 1630 to 1830 every day. The average departure interval is 5 min, and the departure interval in other periods is about 10–15 min. At present, the average rated driving range of the electric buses in operation is about 200 km, and the rated capacity of the electric buses in full power state is set to 160 kWh. Therefore, in general, charging once a day can meet the needs of the operation. Considering that the bus needs to run in the daytime and the low cost of electricity price at night, it is assumed that the average daily mileage of the electric bus is 150 km, and the electric energy is supplemented once a day during the night. The DC constant charging power of 40 kW is used for charging, and the charging time interval is from 2200 to 0530 the next day. The initial charging time and the initial state of charge (SOC) are both subject to the normal distribution of N (22, 1.032) and N (0.4, 0.12).
- (2)
Electric taxi
According to the survey results, the average daily mileage of electric taxis in cities is about 300–400 km, and the operation mode is generally two people and one car working in shifts day and night, alternating every 12 h. It is necessary to fully charge the vehicle during the shift (0530–0630 in the morning and 1630–1730 in the afternoon). The driving mode of the electric taxi assumes that the daily driving range is about 350 km. The performance parameters of the electric taxi mainly refer to the current mainstream BAIC BJEV EU260 pure electric taxi. In the fully charged state and considering the actual road conditions, the range is set to 200 km, and the rated capacity of the power battery is 40 kWh. Therefore, due to the significant mileage covered by electric taxis in a single day and the influence of many factors such as shift change, meal rests, and night operation, electric taxis should be charged at least twice a day, with a constant charging power of 40 kW in the daytime and a constant charging power of 10 kW in the nighttime. The initial charge time and the initial state of charge (SOC) are both normally subject to the normal distribution of N (2, 2.5), N (0.3, 0.1) and N (16, 2.5), N (0.3, 0.1), respectively.
- (3)
Electric private car
The morning and evening rush hours from 0700 to 0900 and from 1700 to 1900 are the main times for private car travel. The charging locations for private cars mainly include residential areas, workplaces, shopping malls, supermarkets, and other large parking lots with charging functions. The charging time is mainly the time between arrival at the place of work and leaving, and between returning home after work and leaving the next morning, that is, 0800–1700 and 1800–0700. Therefore, the main concentrated charging period for private cars is overnight, which is mostly carried out in the form of AC slow charging. However, due to the need to travel, DC fast charging is occasionally used to supplement some of the electricity required during the day. Referring to the mainstream electric private car models in the current market, assuming that the rated capacity of the electric car batteries in the study area is uniformly set at 60 kWh, for most families, charging once a day can meet the needs of daily travel. Considering that the time-sharing peak–valley electricity price has a certain guiding effect on the charging behavior of private car users, most users will choose the starting time of 10 kW AC slow charging at night from their own energy costs, which obeys the normal distribution of N (20, 1.062). The starting time of charging at 40 kW DC in a fast manner occasionally during the day follows a uniform distribution.
Considering the maturity of the current EV charging technology and the increasingly improved construction of charging facilities, the charging efficiency of all kinds of EVs in the simulation process is 90%, and the simulation parameters of the charging behavior modes of different EVs are shown in
Table 3.
2.3. Electric Vehicle Charging Load Prediction Model Based on SSA-BPNN-MC
In this paper, the prediction of the future charging load of EVs in this area is based on the disorderly charging state without optimization guidance, in which the EV users only consider their own driving mileage requirements and begin charging immediately upon reaching the charging location. In the previous section, the charging period, charging start time distribution, initial SOC distribution, and charging mode selection of different EV types were analyzed. In this section, based on the prediction of future EV ownership and the analysis of charging behavior, the initial charging time and initial SOC state of the electric vehicle are simulated using the Monte Carlo method, which is a random simulation method based on probability and mathematical statistics. Computer simulation and sampling are performed using random numbers to obtain the closest solution to the problem. Then, the charging time of each EV is calculated according to the rated capacity of the EV battery and the selected charging power, and finally, the charging load curves of the EVs of different vehicle types are superposed to obtain the total charging load curve of the region. Specifically, it can be expressed by Equation (5):
where
denotes the total load of EV charging in the regional power grid at the
th moment,
represents the electric bus charging load in the regional power grid at the
th moment,
represents the electric taxi charging load in the regional power grid at the
th moment, and
denotes the electric private car charging load in the regional power grid at the
th moment.
denotes the total number of electric buses in the regional power grid,
is the total number of electric taxis in the regional power grid, and
represents the total number of private EVs in the regional power grid.
The charging duration
of the different EVs is calculated by considering the rated capacity of the electric vehicle, the SOC state at the beginning of charging, and the choice of charging power mode:
where
denotes the time required for EV charging,
represents the rated capacity of EVs,
represents the initial charging state of the EV,
represents the rated charging power of the EVs, and
denotes the charging efficiency of the EVs.
Through the SSA-BPNN model, the number of EVs is predicted, and the total number of electric vehicles is determined. By analyzing the charging behavior of different types of vehicles, the charging time and SOC state are simulated using the Monte Carlo method to calculate the charging load. The flow chart of the EV charging load prediction based on SSA-BPNN-MC is shown in
Figure 6.
In 2020, the numbers of buses and taxis in the region were 23,948 and 74,875, respectively. According to the historical data and the average growth rate, it is estimated that the number of buses and taxis will increase to 35,710 and 118,471, respectively, by 2030. According to the forecast of 3.1775 million EVs in the region in 2030 in
Section 2.1, the remaining vehicles are estimated to be private cars. Therefore, it is assumed in this paper that the charging load is calculated according to the above three types of EVs. According to the prediction results, the maximum charging load of the total charging load of different types of EVs in this area from 2021 to 2030 is shown in
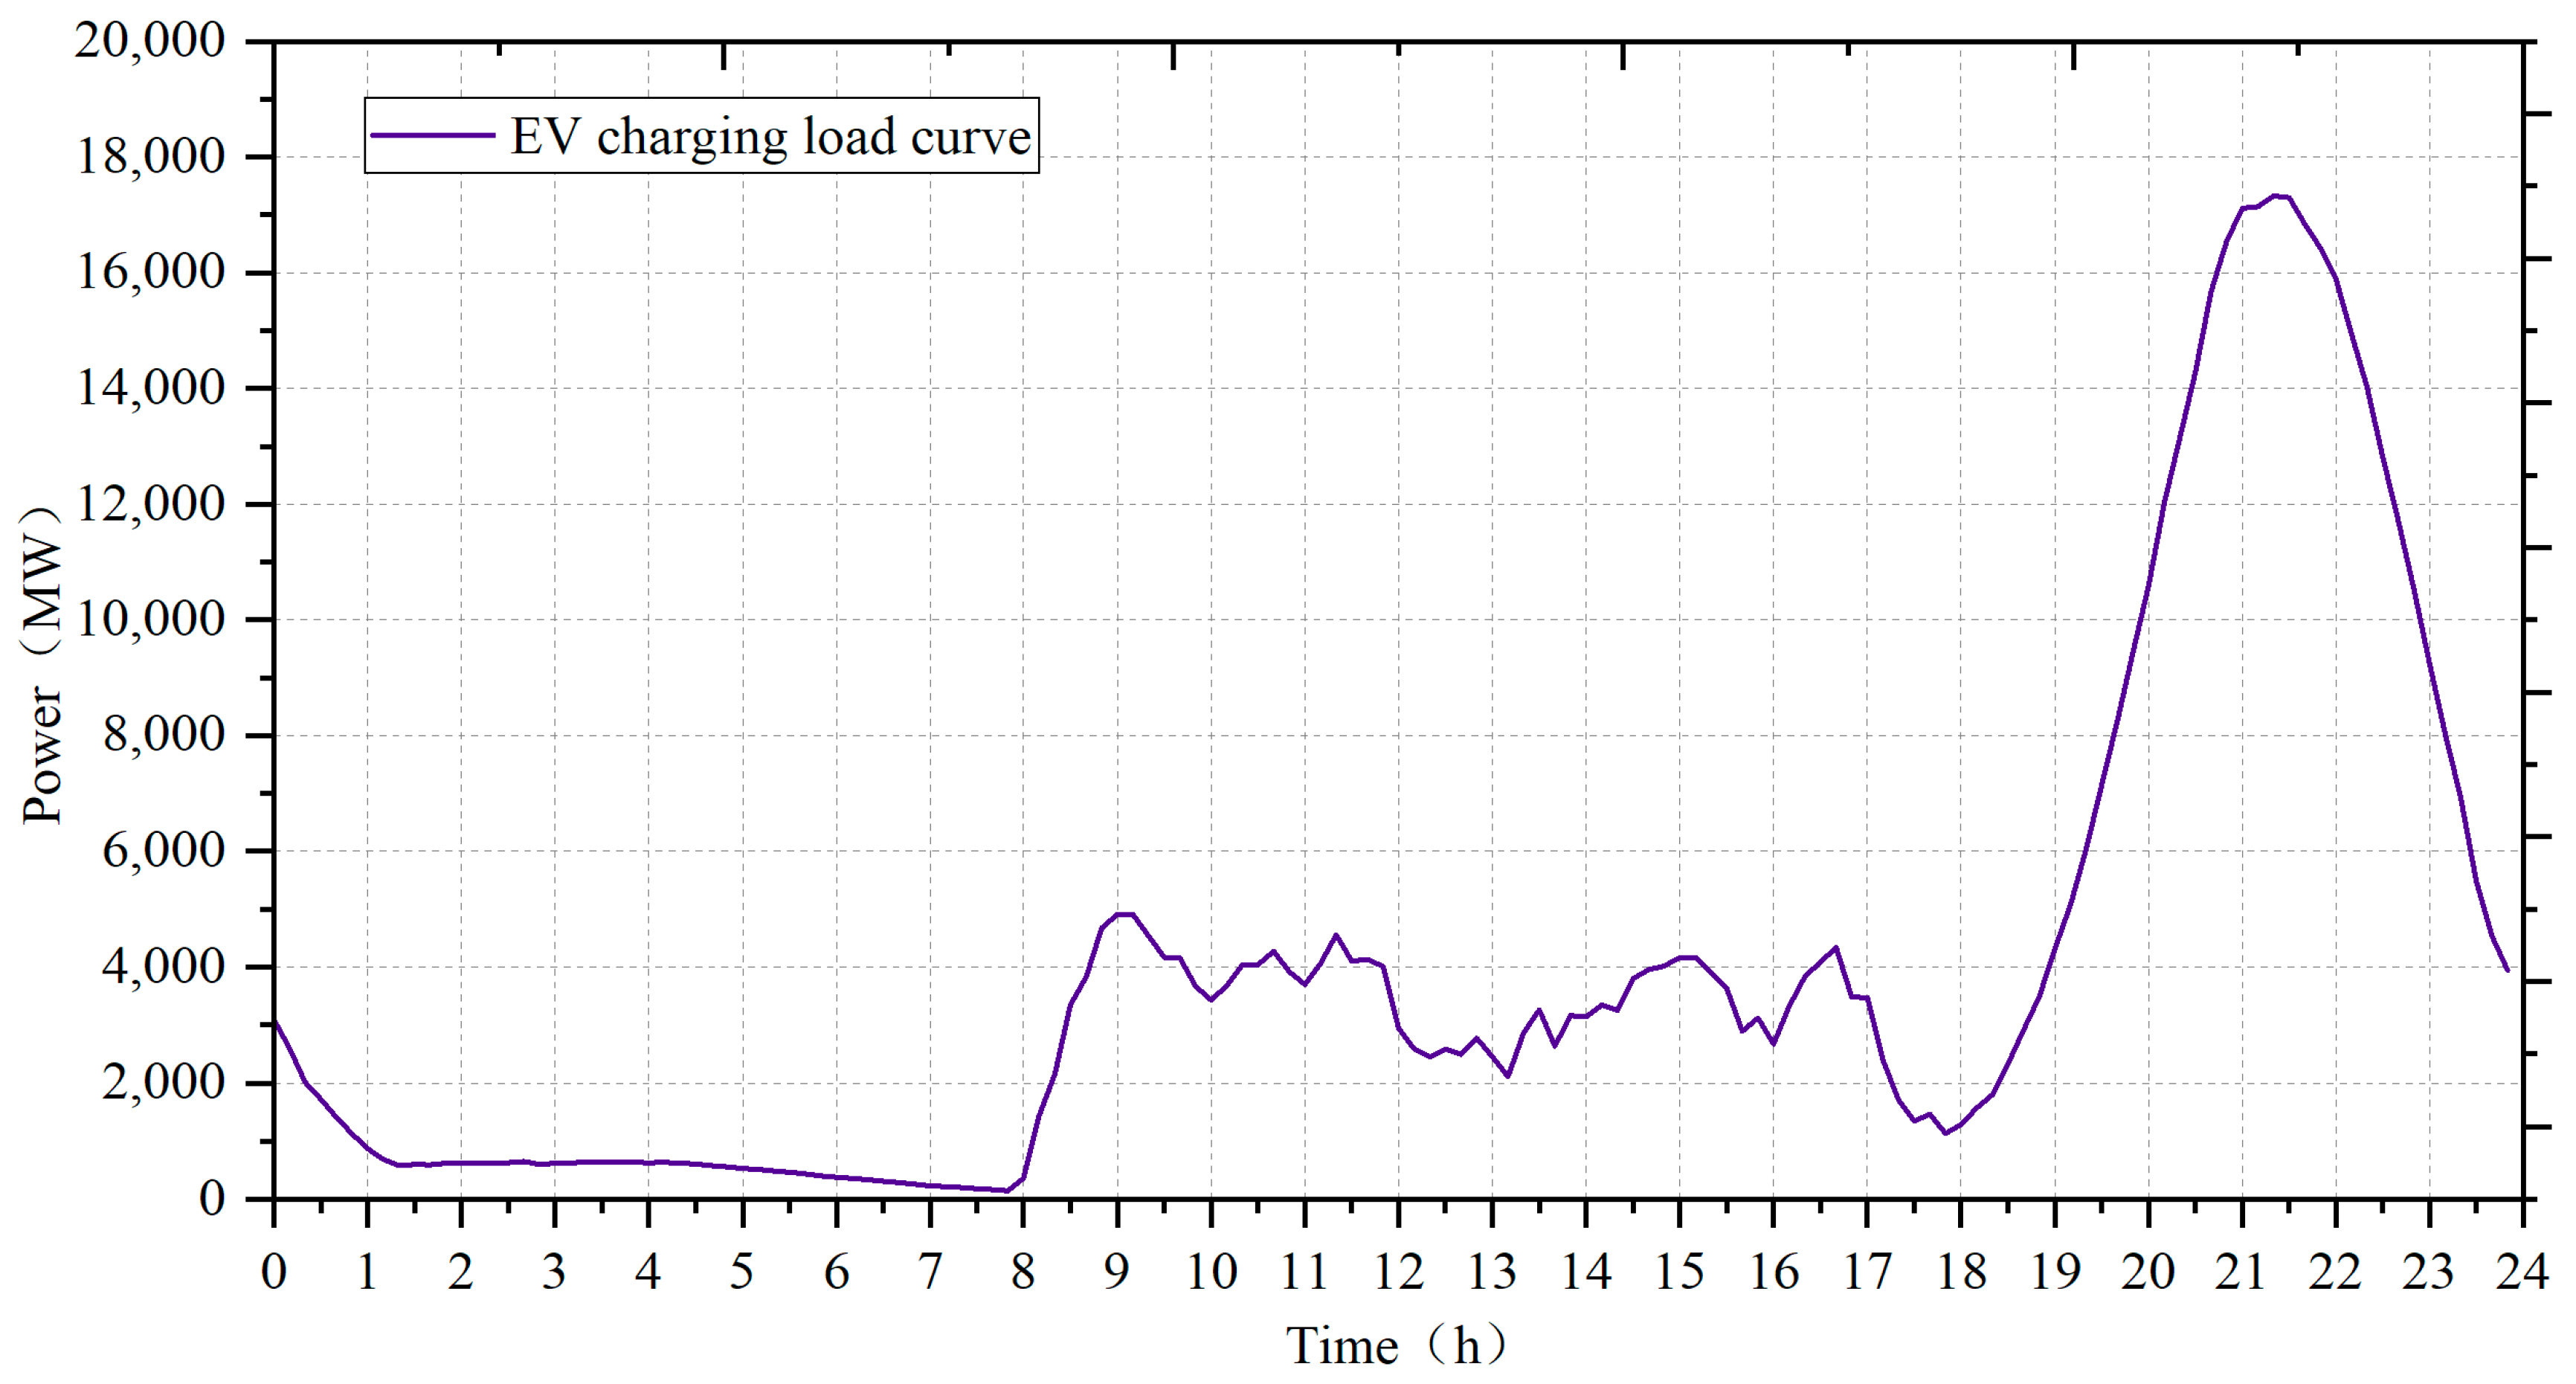
Table 4. The total charging load curve of a single day was analyzed by taking 2030 as an example. See
Figure 7 for details.
As shown in
Table 4, with the number of EVs in the region increasing year by year, the maximum charging load after superposition also increases year by year. As shown in
Figure 7, under this condition, by 2030, users will charge according to their own charging behavior and without optimal control of the charging load, and buses basically choose to charge at night; the charging load of EVs in this area is mainly concentrated after work, and the peak value of the charging load is 17,330.53 MW, which appears at around 2130 in the evening. According to the travel needs of different vehicles, DC fast charging is occasionally used to supplement some electric energy in the daytime, so the charging load distribution of EVs in the daytime is relatively uniform, and a small peak of charging is formed around 0900, with a charging load of about 4500 MW.
3. Potential Analysis of EVs Participating in Regional Power Grid Demand Response
In the above section, we analyzed the charging behavior characteristics of different types of vehicles, such as electric private cars, buses, and taxis, and modeled them to predict their charging load. In order to ensure better coordination and interaction and benign development between EVs and the regional power grid and to make full use of the demand-side response resources of EVs’ transferable charging load and interruptible charging load, we further analyze the potential of the EV charging load to participate in regional power grid demand response on the basis of the prediction results.
Since the beginning of summer this year, the maximum load of the regional power grid was 21580 MW, which occurred on 21 June 2022. According to the Annual Development Report of China’s Electric Power Industry 2022 issued by the China Electricity Council, the annual average growth rate of power load is 5.1%, and the maximum load of the power grid is expected to be 0.22 MW 32,127 by 2030. As shown in
Figure 8, the peak value of the total charging load of EVs in this area is estimated to be 0.54 MW 17,330, and the charging load of EVs will account for 53.94% of the maximum load of the regional power grid. Therefore, the rapid development of EVs will have a greater impact on the power grid. In addition, in the case of disorder and no optimal control, the charging load of EVs has a certain degree of superposition with the basic load of the regional power grid in the daytime peak period, which will lead to a certain increase in the load of the regional power grid. Although the charging load of EVs lags behind in the second peak period at night, it is still not within the low load period of the regional grid. Therefore, it is necessary to implement the demand response business of EVs and optimize the guidance control of their charging load.
According to the relevant rules and regulations, the bus’s daily travel time and route are relatively regular, so its charging load is relatively easy to control. In general, buses are charged at night and supplemented with some electric energy at an appropriate time during the day. The regularity of charging meets the current needs of peak shaving and valley filling in China, and the load margin that can be optimized and controlled is small. On the premise of meeting the needs of the next day’s operation, the charging optimization control can be carried out to a certain extent at different times of the night. In terms of taxi operation, taxis use EVs as their operating tools, pursuing more efficient operation, and cannot choose their charging schedule according to the different peak hours of passenger capacity, so the space for optimization is relatively limited. In terms of the response potential of private cars, firstly, private cars account for a high proportion of the total number of EVs and are the main contributors to the charging load. Secondly, private cars have strong randomness in terms of travel demand and driving routes, and most of the time, they are in a stagnant state in the parking lot, so there is a large margin for optimizing regulation and control [
37].
The power grid dispatching center determines the time period, the responding load power, and the responding total electric quantity of the demand response according to the power generation data of the power generation side and the change condition of the power grid load. Then, the resources on the demand side respond according to the actual situation. From the perspective of objective factors, if EVs want to participate in the demand response of the grid, first of all, electric vehicles should be in a state of access to the grid in order to achieve energy interaction with it. Here, the vehicle state of the EV participating in the regional power grid demand response can be expressed by Equation (7):
where
denotes the state of the
th EV connected to the grid during the
th period; when
, it means that the EV and the charging pile are connected, and
indicates that the EV and the charging pile are in a state of separation and cannot interact with the grid.
denotes the EV has a state of charging from the grid to increase the grid load,
denotes the EV has the state of discharging and feeding the electric energy to the power grid, and
denotes the state in which an EV cannot interact with the grid for an energy response.
When EV users participate in grid demand response, in addition to the state in which the EV vehicles are connected to the grid, they are also affected by the subjective participation of EV users in response decision-making factors. When users decide whether to participate in the demand response of the power grid, they first need to consider whether the mileage of the remaining power of the current vehicle can meet the needs of the next minimum driving distance. If it cannot be met, they need to supplement the power and cannot wait until the demand response period. On the other hand, when the discharge is carried out in the process of participating in the peak shaving of the power grid, the remaining state of charge of the EV should also be kept above the minimum expected value to determine the demand response of the participating power grid.
In addition, although EVs can be used as response resources on the demand side, the primary role is still to meet the needs of their owners’ travel behavior. The uncertainty of the travel behavior of private EV users leads to the uncertainty of vehicle dwell time. Therefore, when EV users participate in the grid demand response, they need to make decisions on travel demand and vehicle dwell time, i.e., if the dwell time is not enough to complete the grid demand response, whether the dwell time can be extended to meet the needs of the grid response.
Finally, it is also affected by the charging price and the income of participating in the demand response compensation of the power grid. After the power grid dispatching center determines the response time period according to the load situation, the EV aggregator or virtual power plant will determine the charging price and discharging supplementary price of each response time period according to the operation of the ancillary service market, and the EV users, as participants in the demand response of the power grid, will make decisions based on their own economic interests and time value, thus affecting the overall participation of EVs in the grid demand response. Considering the influence of EV users’ subjective participation on response potential and other factors, the specific response potential state is shown in Equation (8):
where
denotes the potential state of the
th EV participating in the grid demand response during the
th period,
denotes the
th EV has a state of charging from the grid to increase the grid load during the
th period,
denotes the
th EV has the state of discharging and feeding the electric energy to the power grid in the
th period, and
denotes the state in which the
th EV cannot interact with the grid for an energy response during the
th period.
represents the th EV participating in the grid demand response potential function at the th period, represents the decision-making factor of the th EV participating in the grid demand response in the th period, and the value of represents the number of decision-making factors affecting the participation in the demand response. When , is the EV state of charge (SOC) decision factor, which determines the demand response capacity; when , is the decision factor of the charging and discharging duration of the access grid, which determines the specific period of demand response. When , is the charging price and the benefit decision factor of participating in the grid demand response supplement, which affects whether the EV user should participate in the response, and determines the response capacity and the load level of the period.
Therefore, the charging load that EVs can use to participate in grid demand response in the regional grid is shown in Equation (9):
where
represents the total charging power of all EVs participating in the demand response in the
th period,
represents the rated charging power of the
th EV in the
th time period, and
denotes the response potential function of the charging demand of the
th EV in the
th time period.
On the other hand, the discharge load at which EVs can participate in the grid demand response in the regional grid is shown in Equation (10):
where
denotes the total discharge power of all EVs participating in the demand response in the
th time period,
represents the discharge rated power of the
th EV in the
th time period, and
represents the response potential function of discharge demand of the
th EV in the
th time period.
In addition, what affects the demand response potential of EVs participating in the regional power grid is the response rate of EV users. In this paper, it is assumed that the number of charging piles is sufficient, and scenarios with different response rates
were set for comparative analysis. Based on the
Section 2 EV charging load forecasting model, the predicted 3.1775 million EVs in 2030 were used as the demand response potential analysis object, and the transferable load and transferable power of EVs under different response rates were analyzed. This can be seen in
Table 5. If, through effective price guidance and policy incentives in accordance with the response rate of 20%, the maximum peak load can be reduced by 1733.05 MW, the maximum daily transfer of 4406.38 MWh of electricity can be achieved. If, through effective price guidance and policy incentives in accordance with the response rate of 40%, the maximum peak load can be reduced by 6932.22 MW, the maximum daily transfer of 17,625.53 MWh electricity can be achieved, which can obviously reduce the peak–valley difference of the regional power grid load. The results are shown in
Table 5.
4. Dataspace-Based Demand Response Architecture for EVs Participating in Regional Power Grids
At present, under the situation of the overall balance of power supply and demand in China, there are still serious contradictions between power supply and demand in some regional distribution networks at certain periods. In addition, with the continuous advancement of the energy revolution and the dual-carbon target, the power system will face a series of new operational characteristics in the process of energy and power development due to the high proportion of renewable energy connected to the grid and its strong intermittence and volatility. From the perspective of the beginning of the 14th Five-Year Plan, facing the new changes in the internal and external situation of the power system, the challenges brought by the mismatch between the output of new energy and the load curve are also escalating. These new challenges and tasks of energy and power development require DSM to be repositioned to play a role in ensuring the safe operation of the power system, promoting the consumption of renewable energy and optimizing the energy consumption structure, and improving the quality of power economic development.
In recent years, with the rapid development of EVs and their charging and switching technology, equipment, and management systems, a new path for power demand response has been provided. The EV has the characteristics of dual attributes of load and power supply. As a power load, it can flexibly adjust the power consumption period. As a power supply, its own power battery can be used as an ideal energy storage device to feed back electric energy to the grid system for peak shaving, valley filling, and offsetting the intermittency of clean energy output. By coordinating and controlling the charging and discharging process, it can also effectively weaken the negative impact of the large-scale development of electric vehicles on the power system.
However, with the progress and development of the smart grid, Internet of Vehicles, Internet of Things, and mobile communication technology, in the process of EVs participating in the demand response of regional power grids, it is necessary to collect massive and multi-source heterogeneous data from the power market, auxiliary service market, regional power grid, and EV vehicles to support the optimal scheduling decisions of EV charging load and demand response management. As an emerging data storage and management technology, data space provides a new idea for solving the data processing problem of EVs participating in regional power grid demand response.
In the process of EVs participating in regional power grid demand response, both charging load optimization control and demand response optimization decisions need to use massive, multi-source, heterogeneous, multi-value chain data collected from the electricity market, ancillary services market, regional power grid, vehicles, and other aspects. Therefore, based on the data space management concept mentioned above, we planned a four-level architecture including a data source layer, data processing layer, knowledge model layer, and business application layer. This architecture will be used as the basis for EVs to participate in regional power grid demand response management research. The data space-based EV participation in power demand response architecture is shown in
Figure 9, and its logical order is progressive from the bottom to the top. The following paragraphs will explain each layer and introduce the functions and connections between them.
- (1)
Data source layer
As the bottom layer of the whole demand response architecture, the data source layer constitutes the original multi-source data source of the data space, including the regional power grid load in the power grid data, the power supply output in the regional power grid, the charging price in different periods, the charging load of EVs, and the facility information of charging piles. The vehicle data include the vehicle’s mileage, state of charge, specification, time taken to access and leave the grid, and so on. Electricity price information in the electricity spot market is also included, along with data regarding the regional power grid demand response power, demand response period, and response supplement price in the auxiliary service market. There are other associated data related to the participation of EVs in regional grid demand responses.
- (2)
Data processing layer
The data processing layer centralizes the data with different sources, formats, and characteristics logically or physically, providing comprehensive data sharing and analysis services for EVs participating in regional power grid demand response. It mainly includes data acquisition, data cleaning, data extraction, data aggregation, data storage, and other processes. The data processing layer is mainly designed to solve the problem of data distribution and heterogeneity for the next layer to prepare the database.
- (3)
Knowledge model layer
The knowledge model layer is the core driving force for EVs to participate in the demand response of the regional power grid. In the data space-based EV participation in the power demand response architecture, the knowledge model layer is based on big data resources. Aimed at the management issues involved in EVs’ participation in the demand response of the regional power grid, the EV charging load optimization model under the real-time electricity price, the participation in the demand response optimization decision model under the battery swapping mode, and the auxiliary thermal power unit peaking optimization scheduling decision model are proposed to provide intellectual support for the demand response of EVs participating in the regional power grid.
- (4)
Business application layer
The business application layer is the specific aspect of the function and management decision realized in the architecture proposed in this paper. Through the data collection and processing and the decision support of the knowledge model, it can effectively improve the management of EVs participating in the demand response of the regional power grid, improve the efficiency of the regional power grid, load aggregators, and EV users, and promote the coordinated development of the power system and EV industry.


