1. Introduction
In the context of carbon neutrality goals, photovoltaic (PV) projects, as clean energy projects with very low environmental impact, are now widely implemented [
1]. However, the increase in quantity has not led to an increase in the sustainability of development. The development situation has been more or less problematic, and the sustainability of PV project development has faced many tests [
2]. In particular, in the development of PV projects in the context of carbon neutrality goals from the emphasis on project scale to the direction of improving project quality, it is necessary to implement the concept of sustainable development [
3]. To further promote the sustainable development of PV projects and better play a positive role for PV projects to the carbon neutrality target, it is necessary to conduct a scientific evaluation of their sustainability, to provide references and suggestions for PV projects to identify the problems in their sustainable development and improve their sustainability. Sustainability is a process or state that can be maintained over time. The sustainability of a PV project consists of five interrelated and inseparable components: geographic resource sustainability, technical sustainability, economic sustainability, social sustainability, and environmental sustainability.
Studies on the sustainability evaluation of PV projects in the context of carbon neutrality goals are relatively rare, and most researchers evaluate the overall benefits of PV projects from an economic perspective. For example, Chang and Starcher [
4] focused on assessing the economic benefits of solar and wind energy, and then identified economic investment locations for wind and solar energy in Texas, considering economic parameters including payback periods. The calculations showed that the mean payback period for solar PV systems is 2–20 years, as the payback period for PV systems on a large scale is heavily influenced by incentives. This is in contrast to wind energy, which is the most important factor in a region. The payback period (federal tax credit) for installed wind systems in Texas is determined to be approximately 13 years. Lu, Chen, and Fan [
5] refined the cost of PV based on the traditional levelized cost of energy (LCOE) assessment model, taking into account the shortcomings of previous LCOE assessment models. Tax costs for calculating depreciation, losses, and Clean Development Mechanism (CDM) income are considered. A more scientifically accurate and holistic LCOE model is proposed, and by merging additional investment indicators, a PV power generation efficiency evaluation model that corresponds to the current development status is proposed. Kim, Kim, and Kim [
6] developed a project-level solar PV investment and financial factors evaluation model. The approach emphasizes financial aspects, such as access to cash and exit plans after initial investment, in order to select relevant investment evaluation indicators. Additionally, by estimating the risk of each market participant, the relative importance of each stakeholder indicator is determined, and the stakeholder analysis is contrasted. Through the above combing, it can be seen that the research on the evaluation of economic benefits of PV projects has gradually matured and the importance of PV project evaluation has become increasingly obvious. In fact, planning PV projects is much more than an economic problem. It also involves understanding the technical parts, such as how to connect the PV park to the network. For instance, it has been shown in the literature that the integration of small and large PV systems can generate network problems, making infeasible projects due to curtailments [
7,
8]. However, research on the evaluation of other aspects of PV projects has yet to be performed in-depth, especially concerning the lack of systematic and comprehensive scientific research on the sustainability evaluation of PV projects. The sustainability evaluation of PV projects in the context of carbon neutrality targets is even rarer. Therefore, this paper proposes to develop an evaluation system that can quantitatively analyze the sustainability of PV projects in the context of carbon neutrality targets.
The assessment techniques primarily employed in the current sustainability evaluation study include hierarchical analysis, ideal solution method, and gray correlation method [
9,
10,
11]. The objectivity of the sustainability review process and the outcomes of PV projects cannot be entirely guaranteed by these methodologies, which are mostly impacted by subjective variables [
12]. The objective evaluation methods do not assign different weights to various assessment items; rather, they only take into account how much the various indicators vary from one another in the total index and how much they influence other indicators [
13]. Defined as the use of artificial intelligence algorithms in evaluation, the intelligent evaluation approach is thus introduced in this study [
14]. Benefits of this approach include the lack of human involvement, ability to entirely rule out human variables, and significant learning capacity to satisfy the self-adaptability of the assessed item, increasing assessment relevance [
15,
16]. The accuracy of the LS-WSVM model is increased by using wavelet kernel functions to translate the input variables into a high-dimensional space and locate the ideal hyperplane there [
17]. In the LSSVM model, the wavelet kernel function is used mainly because the wavelet kernel function has the excellent characteristic of describing data information step by step, and it can model arbitrary functions with very high accuracy. In addition, its nonlinear processing ability is better than other kernel functions, which can improve the generalization ability and robustness of the LSSVM regression model. By merging several weak LS-WSVM regressors, the AdaBoost method creates a powerful LS-WSVM regressor [
18], so the AdaBoost-LS-WSVM model has higher learning efficiency and stronger computing performance. The Spark platform can partition the entire data to form multiple sub-data models to improve the data processing efficiency by parallel computing [
19]. As a result, the AdaBoost-LS-WSVM intelligent evaluation model with Spark as the platform is constructed.
The main contributions of this paper are the following:
- (1)
The sustainability evaluation index system for PV projects in the context of carbon neutrality target is constructed from five levels: geographic resource sustainability, technical sustainability, economic sustainability, social sustainability, and environmental sustainability. It is explained which indicators influence the sustainability of PV projects in the context of carbon neutrality targets.
- (2)
The wavelet kernel function is applied to the LSSVM model to form the LS-WSVM regression model with stronger nonlinear fitting ability. The learning and training of training samples are completed by the AdaBoost model, and multiple weak LS-WSVM regressors are weighted to provide a strong LS-WSVM regressor.
- (3)
The AdaBoost-LS-WSVM intelligent evaluation model is applied to the sustainability assessment of PV projects in combination with Spark big data runtime platform.
Overall, this research builds a system that can quantitatively assess the sustainability of PV projects in the context of carbon neutrality targets. The remainder of the article is organized as follows:
Section 2 designs the sustainability evaluation index system of PV projects in the context of carbon neutrality target from five aspects: geographic resource sustainability, technical sustainability, economic sustainability, social sustainability, and environmental sustainability, and explains each evaluation index.
Section 3 constructs the AdaBoost-LS-WSVM intelligent evaluation model based on the Spark platform.
Section 4 selects practical cases to verify the accuracy and validity of the model proposed in this paper.
Section 5 summarizes the research results of the article.
2. Construction of Sustainability Evaluation Index System for PV Projects in the Context of Carbon Neutrality Target
Considering the target background of carbon neutrality, according to the basic theories of sustainability analysis and comprehensive project evaluation of PV power plant projects, combined with the actual situation of PV power plant projects, this paper forms a framework of sustainability evaluation indexes for PV projects in the context of carbon neutrality target. A total of five dimensions (first-level indicators) are considered: geographical resource sustainability, technical sustainability, economic sustainability, social sustainability and environmental sustainability [
20,
21,
22] along with 20 secondary indicators, as shown in
Table 1. References [
20,
21,
22] were consulted in designing the index system, and its main findings are shown in
Table 2.
2.1. Geographic Resource Sustainability
When evaluating the sustainability of PV power plants, the first consideration is the selection of the plant site. The geographical conditions and resource status of the area where the PV plant will be located are important influencing factors for the reasonable selection of the plant site. These include three secondary indicators, namely solar radiation level, meteorological conditions, and engineering geological conditions.
The quantity of solar radiation, sunshine hours, and peak sunlight hours are the key indicators of the intensity of solar radiation. The better the solar radiation conditions are, the better the sustainability of the PV project will be.
- (2)
Meteorological conditions
Meteorological conditions refer to the hydrothermal conditions of various weather phenomena. The analysis of meteorological conditions in the area where the PV power project is located in this paper mainly includes annual average wind speed, historical maximum instantaneous wind speed, annual average temperature, extreme maximum temperature, extreme minimum temperature, annual average rainfall, annual average relative humidity, annual frost-free period, annual average evaporation, the annual number of thunderstorm days, and special climate effects.
- (3)
Engineering geological conditions
Engineering geological conditions refer to the geological conditions related to the project, mainly the basic topography, basic geological structure, groundwater conditions, and the existence of negative geological influences.
2.2. Technical Sustainability
Technical sustainability evaluation is an assessment of the scientificity, rationality, and reliability of the PV power generation system technology. Its specific secondary indicators are mainly PV module selection, PV array operation mode, inverter selection, PV array design, and annual expected power generation.
The core component of the photovoltaic power plant is a solar panel. Since the solar panel is the basic unit of collecting solar energy synthesized by the photovoltaic group, the selection of photovoltaic module is also the selection of solar panel.
- (2)
Photovoltaic array operation mode
The photovoltaic array operation mode can directly affect the total solar radiation acceptance degree, and therefore the photovoltaic power plant’s power generation efficiency is affected. The photovoltaic array operation mode can be divided into fixed operation mode, tilt quarterly adjustment operation mode, and automatic tracking operation mode. The automatic tracking mode can be further divided into “single-axis tracking” and “dual-axis tracking”.
The inverter is also called a power regulator. According to the specific role of the inverter in the photovoltaic power plant, it can be divided into categories of independent power and grid-connected power. The grid-connected inverter can be classified into transformer inverter and transformerless inverter according to the presence of transformers. According to the waveform modulation method, they can be classified into four types: sine wave inverter, square wave inverter, combined three-phase inverter, and step wave inverter.
- (4)
PV array system planning
The photovoltaic array contains several solar panels, which are combined in a specific way to form a DC power generation system. Its production principle is to apply the photovoltaic principle to transform light energy into electric energy solar panels in a unified assembly on brackets. After emitting electricity, through the inverter, these devices will either send the emitted electric energy to the demand side or will first be connected to the grid and then reach the demand side. The network connection is also taken into account in the PV array system planning.
- (5)
Annual power generation
The main factors affecting the power generation of PV plants are the amount of solar radiation, the tilt angle of solar modules, the efficiency of solar modules, temperature characteristics, dust loss, and line loss. The higher the annual power generation capacity, the better its sustainability.
2.3. Economic Sustainability
PV power plants can generate economic benefits for operators. Thinking from the perspective of economic sustainability and considering the background of carbon neutrality target, the economic sustainability evaluation indexes of PV power projects include carbon emission reduction investment return, profitability, ability to settle debts, and investment cost.
- (1)
Return on investment for carbon emission reduction
The return generated by CO2, SO2, NOX, soot, etc. from the investment in power generation projects reflects the carbon emission reduction return generated after the investment in wind power projects in the form of monetary value, which is an important indicator to judge the intensity of emission reduction of low-carbon power generation projects. The calculation is mainly based on the sum of the economic value of the annual emission reduction of pollutants from the PV project and the sum of the total investment in the PV project, and the two reflect the carbon emission reduction yield of the investment in the form of a ratio.
The main purpose of PV power plant construction and operation is to obtain profits, so the investigation of its profitability is an integral part of the project sustainability evaluation. Profitability is the value-added level of the project’s invested capital. When examining the economics of a photovoltaic power plant, the main consideration is the project operator’s financial condition, and the amount of profit to be made from the operation of the project after construction is completed. In addition, the impact of the project on the overall operation of the project business can be examined, and the possible future operating conditions can be analyzed. In evaluating this indicator, it is also necessary to consider the costs and benefits of carbon trading in the context of the carbon neutrality target.
Solvency is the level of debt repayment of PV power plant operation projects, and the general financial evaluation analysis usually considers both short-term and long-term time dimensions. However, the source of funds for PV power plant projects usually does not include short-term liabilities, so in the evaluation and analysis of the solvency of PV power plant projects, only long-term solvency can be analyzed.
The main components of investment costs are decision management costs, planning costs, purchase costs of equipment and materials, construction costs, labor costs, other costs, and unpredictable costs. Compared with other power generation entities, the cost of photovoltaic power plants is relatively high, so when evaluating the feasibility of photovoltaic power plant projects, we should focus on analyzing the operator’s investment capital and costs, to maintain the healthy operation of the company’s other business premise can also increase the investment in photovoltaic power plant projects.
2.4. Environmental Sustainability
In the context of the world’s overall pursuit of a low-carbon economy, governments around the world are placing unprecedented emphasis on environmental protection. Our government has also put forward the goal of carbon neutrality for carbon peaking. In relation to the carbon neutrality goal, the development of clean energy generation has become an unstoppable historical trend. Therefore, the environmental impact of solar power generation, which is the most widely used, mature, and representative clean energy source, should not be ignored, and the environmental sustainability of the project should be a priority when evaluating the sustainability of PV power plant projects. In accordance with the relevant literature, the environmental evaluation indexes of this paper are selected from carbon dioxide emission reduction, dust pollution, pollutant emission treatment, noise pollution, and other evaluation indexes.
- (1)
Carbon dioxide emission reduction
The higher the CO2 emission reduction, the better the sustainability of the project in the context of the carbon neutrality target.
Dust is generally solid particles suspended in the air, and the particle size of such particles usually does not exceed 75 microns. The construction phase of photovoltaic power plants usually generates some dust, which will negatively impact human health if inhaled; if the dust adheres to the surface of plants, it will prevent photosynthesis and affect plant growth; dust will also corrode other buildings to a certain extent.
- (3)
Pollutant emission treatment
Pollutant discharge refers to the process of construction and operation of photovoltaic power plants. Some pollutants are released into the external environment, thus negatively impacting the external environment. To reduce the degree of pollutant damage to the environment, pollutant emissions from the construction and operation of PV power plant projects should be controlled to a certain degree. The pollutants generated by the PV power plant mainly include waste equipment and materials during the construction phase and wastewater and sewage discharged during production and use.
Noise pollution is sound that can affect normal life and work of the residents. It can be divided into two scenarios according to the decibel level of the sound: normal environment (30 to 40 decibels) and noisy environment (more than 50 decibels). Noise affects the physical and mental health of the inhabitants through its effect on their physiological and psychological conditions. The construction phase of a photovoltaic power plant is likely to create a noisy environment, which will be harmful to some extent.
3. AdaBoost-LS-WSVM Intelligent Evaluation Model Based on Spark Platform
3.1. AdaBoost Algorithm
AdaBoost is an advanced procedure that can be utilized to integrate several weak regressors into a single strong regressor by allocating weights to the weak regressors that were trained on the same training set. Prior to updating the weights based on the regression accuracy of the samples in each training, the method first sets each sample’s weight to be the same. The lower the regression accuracy, the greater the weights are, and the new sample distribution is created. The samples are then chosen for the subsequent training according to the size of the new samples’ weights, and the sample weights are continuously updated to produce multiple weak regression machines. These machines are then superimposed in accordance with the updated weights to produce the final strong regression [
23].
The following are the precise steps used to implement the AdaBoost algorithm [
24].
Adjust the practice sample set , the maximum number of cycles T, and the relative error threshold for regression estimation.
- (1)
Initialize the weights of the samples, i.e., the initial probability distribution of each training sample , and the error rate .
- (2)
Go to (3) when the number of iterations , otherwise;
- (1)
Regression with training samples with weights .
- (2)
Calculate each training sample’s relative error.
- (3)
Determine the regression model’s error rate
.
- (4)
Update the sample weights
that
where
is the constant to renormalize the weights and
- (5)
Let .
- (6)
Go to (2).
- (3)
After completing the training, the strongest regressor is acquired. For a given test sample, output test regression results.
3.2. LS-WSVM Model
LSSVM is an extension of SVM, which is a nonlinear projection of the input vector into a high-dimensional space. It constructs the optimal decision surface, and then applies the risk minimization principle to transform the inequality operation of SVM into the solution operation of a system of equations, thus reducing the computational complexity and speeding up the operation [
25].
Let the given sample set
, where
N is the total number of samples; then the regression model for the samples is [
26]:
where
is the training sample projected onto a high-dimensional space,
w is the weighted vector, and
b is the bias;
For LSSVM, the optimization problem becomes:
To solve the above problem, establishing the Lagrange function yields
where
X is the Lagrange multiplier. Deriving each variable of the function and making it zero gives:
Eliminating
and
translates into the following problem:
Solving the above system of linear equations yields:
In this paper, the wavelet kernel function is selected:
In place of the conventional radial basis kernel function, the kernel function of the LSSVM model is taken into the regression equation as follows:
Then the LS-WSVM regression equation can be written as:
3.3. LS-WSVM Model with AdaBoost Optimization
No matter how the kernel function and its parameters are changed, the single LS-WSVM model does not perform well in regression calculations on high-dimensional domain data, hence it can be referred to as a “weak regression machine.” The AdaBoost algorithm can increase the accuracy of any weak regressor, but it struggles when dealing with high-dimensional data, whereas LS-WSVM deftly gets around this issue by using the kernel method. As a result, the two work well together to solve the problem of regression prediction using high-dimensional data [
27].
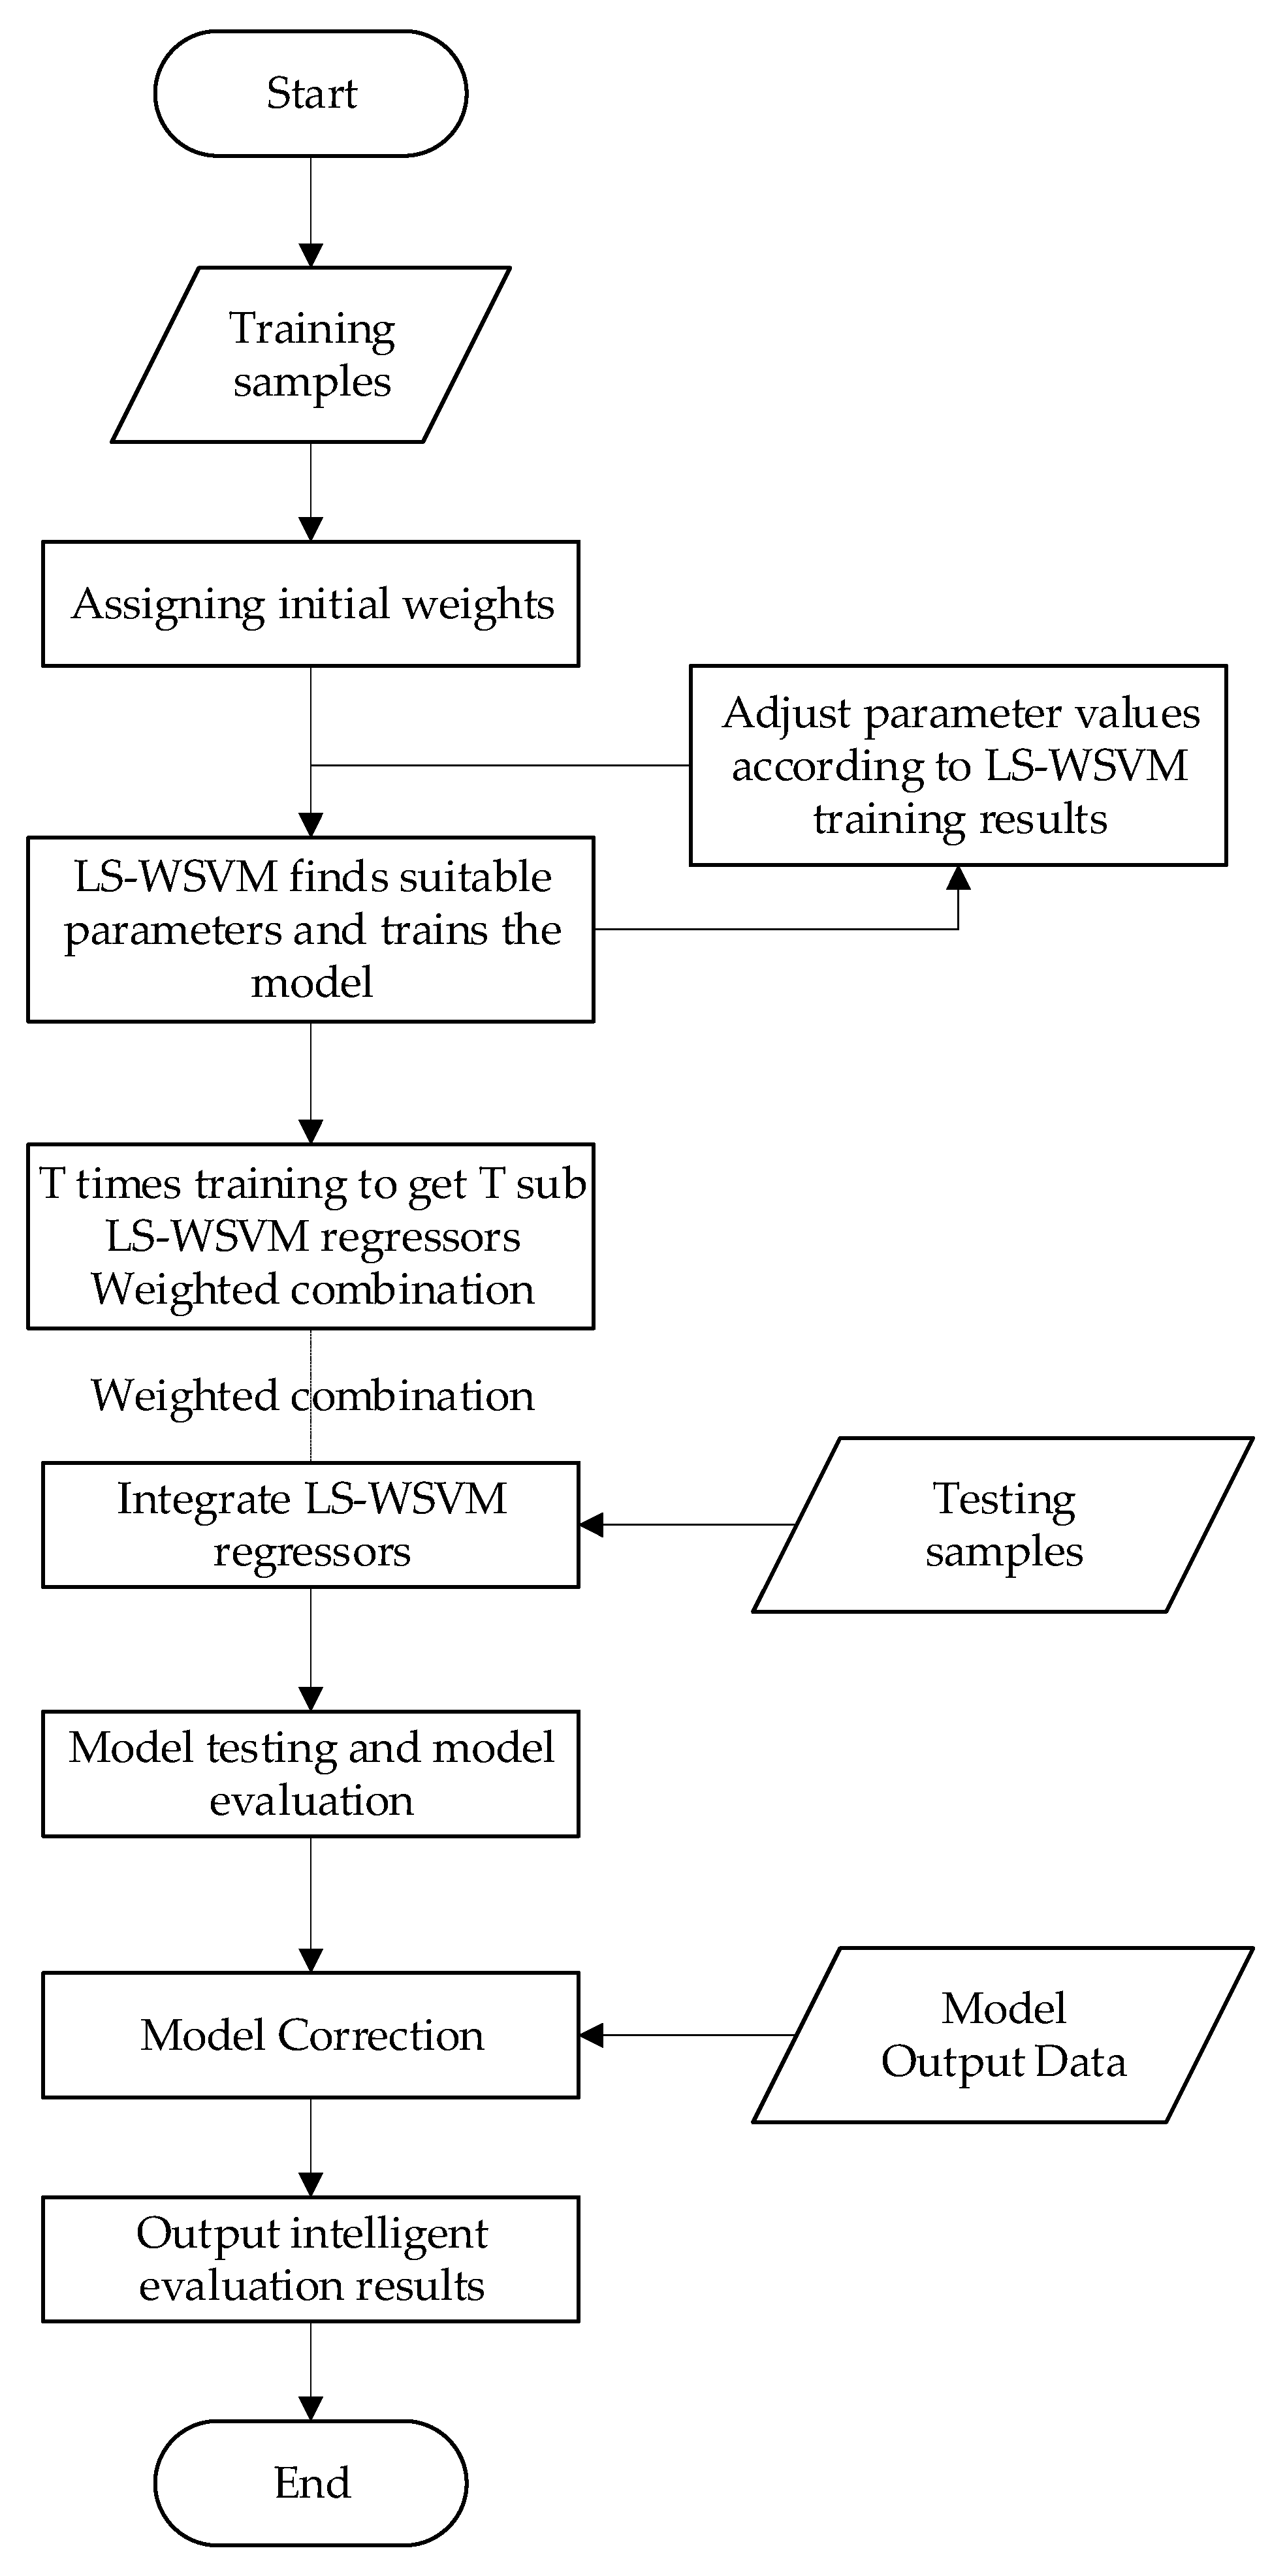
The following is the precise construction algorithm for the AdaBoost-LS-WSVM strong regression machine [
28].
Step 1. The training set
,
,
is selected; the maximum number of iterations
T is given; the threshold
to judge whether the forecast value is correct or not is given; the weight distribution
of the training data is initialized when the number of iterations
t = 1, and the initialization error
.
Step 2. Train the LS-WSVM weak regression machine based on the weight distribution, build the regression model
, and calculate the training set errors at the error rate of
.
Calculate
,
n = 1, 2, 3, and update the weights
Dt according to the following equation:
where
is the normalization factor.
Step 3. t = t + 1, return to Step 2 until the end of the iteration.
Step 4. Give the output of the strong regressor.
According to the above algorithm of AdaBoost-LS-WSVM strong regression machine, its flow is shown in
Figure 1.
3.4. Intelligent Evaluation Process of AdaBoost-LS-WSVM Based on Spark Platform
With all the benefits of Hadoop MapReduce, the Spark platform is a new generation of big data analysis framework that was suggested. However, unlike MapReduce, Spark keeps the calculation results directly in memory, which increases computation efficiency. According to tests, Spark platform outperforms Hadoop MapReduce by more than 100 times [
29]. However, Hadoop MapReduce requires writing multiple parallel or serial MR tasks when executing data tasks, and the data between tasks cannot be shared, leading to issues like low performance and lengthy analysis times. In contrast, Spark plate form can perform online machine learning, interactive data analysis, etc., and each threaded task can directly retrieve the required data from memory, achieving a high degree of data sharing and increasing computing speed. This study combines the AdaBoost-LS-WSVM model with the Spark data analysis framework to realize the intelligent evaluation of PV project sustainability. The development of new power systems makes the effective mining and deployment of first-time online big data increasingly significant.
In order to support numerous iterative procedures, the Spark platform provides two important concepts: (1) resilient distributed datasets (RDDs), which have the fault-tolerant performance of data flow models like MapReduce and are capable of performing computations that run memory-based on large clusters. (2) Shared memory, where each RDD is read-only and can be created by batch operations on other RDDs, and variables are shared between tasks and between tasks and drivers in parallel operations. RDDs provide four important operators that enable the Spark platform to provide richer interfaces and operations based on MR [
30].
Input arithmetic: In Spark programs, data is input to the Spark platform from external space, such as reading data directly from HDFS, etc.; data enters the Spark runtime data space, which is then transformed into operational data blocks and managed by Block Manager.
Transformation operator: After the Spark data is input to form an RDD dataset, the data can be operated by transformation operator (such as filter, etc.), and the RDD is transformed into a new RDD dataset. The Spark submission job is triggered by the action operator.
Cache operator: The data in Spark can be shared because the data that need to be reused can be cached with memory through Cache operator to avoid the trouble of re-calling data to improve the efficiency of computing.
Action arithmetic: Tasks are assigned in each RDD region through the data management center, and executed in each region through parallel computation; after the program runs, the data is output to the Spark runtime space and stored in the distributed storage space or Scale data collection.
Based on the techniques introduced above, the parallel intelligent evaluation algorithm flow is designed in this paper as shown in
Figure 2. As shown in the figure, the data related to the sustainability smart evaluation of PV projects are collected and stored in the memory space through RDD transformation, the data are chunked by the cluster manager, and then each chunked task is assigned to
N worker nodes for parallel processing. Among the assigned data processing tasks, this paper uses the Neville method for missing data processing and improved subtractive clustering for bad data classification.
- (1)
Missing data processing based on Neville’s method
Let
be the evaluation sample data set,
n be the number of nodes, and
z be the interpolation point. Let
,
, where
,
, then the Lagrangian interpolation polynomial is calculated as follows
Determine whether holds, if it does, output ; if it does not, continue the calculation.
- (2)
Bad data classification based on improved subtractive clustering
External faults and other reasons can cause the sample data to be anomalous, so that most of the observations are inconsistent. In addition, the occurrence of external special events can also trigger data anomalies, which interferes with the changes in the evaluation sample law to a certain extent, causing large evaluation errors that have an impact on the model’s accuracy. Therefore, there is a need for necessary classification and processing of bad data. In this paper, an improved fuzzy C-mean clustering method is used to effectively classify the bad data, and the procedure is as follows.
- (1)
Calculate the number of clusters and the cluster center using the subtractive clustering method.
- (2)
Calculate the affiliation degree.
where
N is the iteration counter and
;
- (3)
Calculate the objective function value.
- (4)
Determine whether
reaches the minimum value. If so, output the clustering category lose
z with the clustering center matrix
P; otherwise, make
to update the clustering center matrix and recalculate the affiliation degree. The clustering center matrix update formula is
In the specific implementation of Spark framework, the collected dataset is first encapsulated in the class Datapoint, which consists of vector x and vector y, where x represents the model input vector and y represents the evaluation result. The entire training dataset is RDD processed once and transformed into an RDD set, called RDD1, by the parallelize function in Spark.Context. Secondly, RDD1 is buffered with memory, and Spark parallel processing is called for iterative computation. The computation results are returned to the feature set, which is again RDD transformed and called RDD2. Next, the data in RDD2 is parallelized by using the map operator to construct the input vector weights. The vector values in each module are summed by using the reduce operator to calculate the total weight vector for each iteration, and stored with the set weights, which is called RDD3. Finally, the optimal weights are selected to construct AdaBoost-LS-WSVM. The intelligent evaluation model is constructed by selecting the optimal weights, and the test set is brought into the model to complete all the evaluation work.
4. Case Study
To evaluate the viability and efficiency of the suggested approach, 100 PV projects were selected as sample data, with a total of 100 sets of data. Part of these data are shown in
Table 3. The first 80 sets of data were chosen to serve as model training samples, and the last 20 sets of data were used as test data to verify the effectiveness of the model.
The evaluation indicators of the evaluation results use the maximum and minimum relative error (Maximum/Minimum RE), mean absolute percentage error (MAPE) and mean square error (MSE), and each indicator was calculated as follows:
where
represents the real value and
the outcome of an evaluation. In the above equation, the smaller the values of MAPE, RE, and MSE, the more accurate the intelligent evaluation results.
The training samples were brought into the AdaBoost-LS-WSVM regression model construction process for learning to obtain the strong LS-WSVM regressor, and then the test samples were brought into the strong regressor for computational validation. In addition, for the sake of comparison, the test samples were also calculated using the common LS-SVM model, support vector machine model, and BP neural network model. The calculation results of each model are shown in
Figure 3, the evaluation index results of each model were calculated as shown in
Table 4, and the relative error comparison of each model is shown in
Figure 4.
The parameters of each model were set as follows:
LS-SVM model: LS-SVM model was created using LS-SVMLabv1_8 toolbox, setting , , the regularization parameter and the kernel parameter were obtained by cross-validation.
SVM model: svmdark software was used to format the sample data for training, and the parameters C = 33.617, ε = 0.7302, and σ = 0.6892 of SVM were obtained by cross-validation.
BP model: three layers of BP neural network were set: the hidden layer transfer function used function, the output layer transfer function was function, the learning function used function. The learning rate was set to 0.005 and the training number was set to 5000.
As seen in
Table 4, the values of MaxRE and MinRE of the AdaBoost-LS-WSVM model are smaller than the other three models, which again indicates that the AdaBoost-LS-WSVM model is more accurate than the LS-SVM, SVM, and BP models in terms of intelligent evaluation. This is due to the improvement of the LS-WSVM model by the AdaBoost algorithm to obtain the strong regressor of LS-WSVM. The calculation results from MAPE also show that the average absolute error of the AdaBoost-LS-WSVM model of 2.47% is smaller than the other three models of 5.80%, 7.72% and 10.78%, demonstrating that the AdaBoost-LS-WSVM model has the highest level of overall accuracy, while the algorithm is more capable of nonlinear mapping, making it more appropriate for intelligent evaluation. From the calculation results of MSE, it can be seen that the mean squared error of 5.32% of the AdaBoost-LS-WSVM model is smaller than 24.29%, 39.58% and 75.86% of the other three models, indicating that the calculated results of the AdaBoost-LS-WSVM model have the smallest deviation from the actual results, and the test results are more stable and have the strongest accuracy.
Figure 3 shows the comparison of the actual values of the test samples with the calculated results of each model. As can be seen from the figure, the calculated result curves of the AdaBoost-LS-WSVM model are closer to the actual values than the other models, while the calculated result curves of the other three algorithms show large fluctuations and have relatively low adherence to the actual values. The intelligent evaluation result curves further prove that the AdaBoost-LS-WSVM algorithm shown in this paper performs better.
Figure 4 compares the absolute values of the relative errors of the test results of the four algorithms. The absolute values of the relative errors of the AdaBoost-LS-WSVM, LS-SVM, SVM and BP models are the largest at 7.52%, 10.33%, 11.18% and 22.06%, respectively, which indicates that the AdaBoost-LS-WSVM model has the highest level of accuracy and the most accurate calculation as well as the strongest robustness. As can be seen from the figure, the AdaBoost-LS-WSVM model has the least overall relative error, the LS-SVM and SVM algorithms are next, and the BP model has the largest relative error, indicating that the AdaBoost-LS-WSVM model has the highest level of overall accuracy as well as better nonlinear mapping ability of the algorithm, which is more suitable for the intelligent evaluation of PV project sustainability.
In addition, this paper also uses the Hadoop platform in combination with the AdaBoost-LS-WSVM model for intelligent evaluation and compares the parallel computational efficiency with the Spark-AdaBoost-LS-WSVM model shown in this paper.
Figure 5 shows the comparison of the parallel computation efficiency of the two algorithms. As can be seen from the figure, when the sample data is smaller than a certain value, the computational efficiency of the two parallel algorithms does not differ much, but as the data volume increases further, the computational efficiency of the Spark-AdaBoost-LS-WSVM algorithm becomes more and more efficient, and the time required for the same computational volume is much smaller than that of the Hadoop-AdaBoost-LS-WSVM algorithm. This is because Spark platform stores the RDD set obtained from data transformation directly in memory, which enables data sharing among parallel structures and makes data extraction more convenient and efficient, avoiding the trouble of returning to HDFS and then extracting data in Hadoop.
5. Conclusions
The sustainable development of PV projects can better serve the realization of the carbon neutrality target and also provide a reference meaning for the sustainable development of other new energy projects. Therefore, in order to improve the sustainability of PV project development, this paper designs a sustainability evaluation system for PV projects in the context of carbon neutrality target, which mainly includes a set of evaluation index systems and a new intelligent evaluation method.
Firstly, the sustainability evaluation index system of PV projects is constructed in five aspects: geographical resource sustainability, technical sustainability, economic sustainability, social sustainability, and environmental sustainability, which solves the problem of what aspects of PV project sustainability are mainly reflected in the context of carbon neutrality target. Then, an intelligent evaluation model based on Spark platform with AdaBoost-LS-WSVM is established based on the use of missing data processing and bad data classification. The scientificity and accuracy of the intelligent evaluation model proposed in this paper are verified through the analysis of arithmetic cases, which can reduce the subjectivity in the comprehensive evaluation process and facilitate a more objective and comprehensive evaluation of the target; at the same time, it can achieve a fast and accurate evaluation.
In summary, the research results of this paper can provide a decision basis for proposing a more sustainable and healthy PV project development model. In addition, the model proposed in this paper can provide a useful tool for the development and implementation of policies related to PV projects in the context of carbon neutrality targets. It can also help government managers to quickly and accurately assess the sustainability of projects. However, there are some limitations in this paper. For example, the applicability of the model proposed in this paper to the sustainability evaluation of other new energy projects deserves further validation; the applicability of other intelligent evaluation algorithms to the sustainability evaluation of PV projects also deserves further study.


