Article

The Impact of Officials’ Off-Office Accountability Audit of Natural Resource Assets on Firms’ Green Innovation Strategies: A Quasi-Natural Experiment in China

1
School of Government Audit, Nanjing Audit University, Nanjing 211815, China
2
Business School, University of International Business and Economics, Beijing 100029, China
3
School of Economics and Management, North China Electric Power University, Beijing 102206, China
*
Author to whom correspondence should be addressed.
Sustainability 2023, 15(3), 2640; https://doi.org/10.3390/su15032640
Submission received: 19 December 2022 / Revised: 24 January 2023 / Accepted: 30 January 2023 / Published: 1 February 2023
(This article belongs to the Special Issue Sustainability, Accounting, and Business Strategies)

Abstract

:
It is important to assess the factors that affect firms’ strategies for environmental improvement. Taking China’s pilot of officials’ off-office accountability audit of natural resource assets (hereafter accountability audit) that commenced in 2014 as an exogenous shock to government audits of leading officials, we use a difference-in-differences method (DID) to examine the impact of government audits on firms’ green innovation strategies. Our results show that the accountability audit increases the proximity between firms’ previous and present green innovation fields and enhances incremental rather than radical green innovation. Furthermore, these influences are stronger in the case of pressure from local governments for firms to adopt environmental protection measures, government control of firms, and market performance pressures than in other cases. In addition, the accountability audit drives investment in environmental protection toward green innovation in existing fields. Finally, the accountability audit increases firms’ economic value added and disclosure of social responsibility information. Overall, our study provides evidence that firms conduct similar and known green innovations in response to government audits.

1. Introduction

Since the Industrial Revolution, many of the world’s economies have developed tremendously at the cost of serious environmental pollution and natural resource overuse. According to The Global Risks Report 2022, environmental risks, including climate action failure, extreme weather, biodiversity loss, human environmental damage, and natural resource crises, are perceived as the five most critical long-term threats globally and are most likely to have devastating effects on people and the planet. China’s rapid industrial growth has caused severe environmental pollution. To address this issue, the Chinese government has initiated a series of environmental governance laws and regulations. However, the effect has been unsatisfactory [1], as local governments have aimed to achieve basic targets rather than solving problems at the source [2]. They are more concerned with economic growth than environmental performance under China’s promotion tournament model, which has been oriented toward economic performance and the growth of gross domestic product (GDP) [3].
In response to this situation, the Chinese central government proposed to implement officials’ off-office accountability audit of natural resource assets (hereafter accountability audit) in 2013 and formulated an accountability audit pilot in 2014. The accountability audit meant that officials’ achievements were no longer purely based on the economic performance of their jurisdiction but also based on the environmental performance reflected in their accountability audit results. In addition, officials need to adopt appropriate strategies to avoid being held accountable for any environmental damage. Therefore, local officials will transfer the pressure to achieve both economic and environmental targets to the firms in their jurisdictions, causing firms to select environmental strategies that can achieve these targets. The pilot ended with the extension of the accountability audit program nationwide in 2018. Does it mean that it is effective in environmental protection? Since firms are the main party causing pollution, how has it changed corporate behaviors toward environmental protection, such as green innovation strategies?
Green innovation is defined as a technology, process, or product intended to reduce pollution and the overuse of scarce resources [4]. Conducting green innovation allows firms to improve environmental performance [5,6] as well as improve their economic performance [7,8]. Therefore, firms are willing to adopt green innovation strategies under the pressure of environmental governance [9,10,11]. According to the ambidextrous innovation classification, an innovation strategy is composed of incremental innovation, which requires less investment and a shorter time to achieve a more predictable outcome, and radical innovation, which requires more investment, takes longer, and has more unpredictable results [12]. Whether a firm chooses incremental or radical innovation strategies after the pilot indicates whether government audits can promote firms’ green innovation activities from the root and long-term perspective.
The implementation of the accountability audit pilot in China provides a quasi-natural experimental scenario to study how government audits affect firms’ selection of green innovation strategies. Therefore, we empirically examine the impact of the pilot on firms’ green innovation strategies using a multi-period difference-in-differences (DID) model. We use the patent data of firms listed on the Shanghai and Shenzhen stock exchanges from 2010 to 2017 as our initial research sample and match this sample with the data of pilot cities. Our main results show that the audit pilot leads to more proximity between firms’ green innovations and enhances firms’ incremental rather than radical green innovation. We conduct several robustness checks, including a parallel trend test, placebo test, entropy balancing, propensity score matching (PSM), controlling for additional city-level variables, excluding special cities, using a balanced panel regression test, and controlling for other confounding events. We find that our main results remain unchanged after this series of tests.
We further explore the role of government pressure for environmental protection, government control of firms, and market performance pressure in influencing the relationship between the audit pilot and firms’ green innovation strategies. First, we find that after the pilot, higher levels of regional air pollution and increased concern for environmental protection lead to higher green innovation proximity and more incremental green innovation than before the pilot, suggesting that pressure from local governments to protect the environment transfers to firms. Second, we find that firms with a higher proportion of state-owned shares and higher tax preferences result in higher green innovation proximity and more incremental green innovation than other firms, suggesting that government control over firms influences their green innovation strategies under the pilot. Third, we find that higher analyst coverage and a higher percentage of institutional shareholding increase green innovation proximity and incremental green innovation, suggesting that capital market performance pressure plays an important role in firms’ green innovation strategy selection after the pilot. In addition, we find that the audit pilot drives an increasing proportion of environmental protection investment toward green innovation in known rather than unknown fields. Finally, we test other economic consequences of the accountability audit pilot and find that it increases the economic value added (EVA) of firms and their social responsibility information disclosure.
Our study makes several contributions. First, it adds to the literature on the environmental consequences of government audits from the perspective of green innovation strategies. Empirical research shows that government audits improve environmental performances from the perspective of water quality [13,14], pollutant emissions [15], and air pollution [16]. Few studies have examined the impact of government audits on green innovation, focusing on its quantity [17,18]. However, none has explored how government audits impact firms’ decisions to adopt different types of green innovation strategies, which reflect potential tension or trade-offs. As innovation is risky, firms may choose green innovation strategies that cater to the government’s motives and preferences. Merely analyzing the quantity of green innovation does not capture such behavior. Therefore, we explore the impact of government audits on green innovation strategies.
Second, our study extends research on the determinants of green innovation strategies from the perspective of government audits. Existing studies explore how dynamic capability, coordination capability, social reciprocity, foreign customers, green entrepreneurial orientation, supply chain learning, proactive boundary-spanning search, carbon tax, innovation subsidy, consumers’ green preferences, and manufacturers’ capabilities to absorb and adopt new technologies influence different types of green innovations under different classifications [4,19,20,21]. However, no studies have yet investigated the role of government audits in green innovation strategies. We adopt the ambidextrous innovation classification to explore the relationship between accountability audit and the adoption of incremental and radical green innovation by firms.
Third, we add to the literature on ambidextrous innovation strategies from the environmental perspective. A large number of studies explore factors that influence ambidextrous innovation strategies and the consequences of such strategies from various aspects [22,23,24,25,26,27]. However, little of the available literature touches on the environmental perspective, which has become one of the most important types of innovation with the increasing importance of environmental protection. A few studies use questionnaire survey methods to distinguish between incremental and radical green innovations [4,20,21,28], which lack objectivity and accuracy. We adopt the more refined method of Byun et al. to measure incremental and radical innovations from the environmental perspective [29].

2. Institutional Background and Literature Review

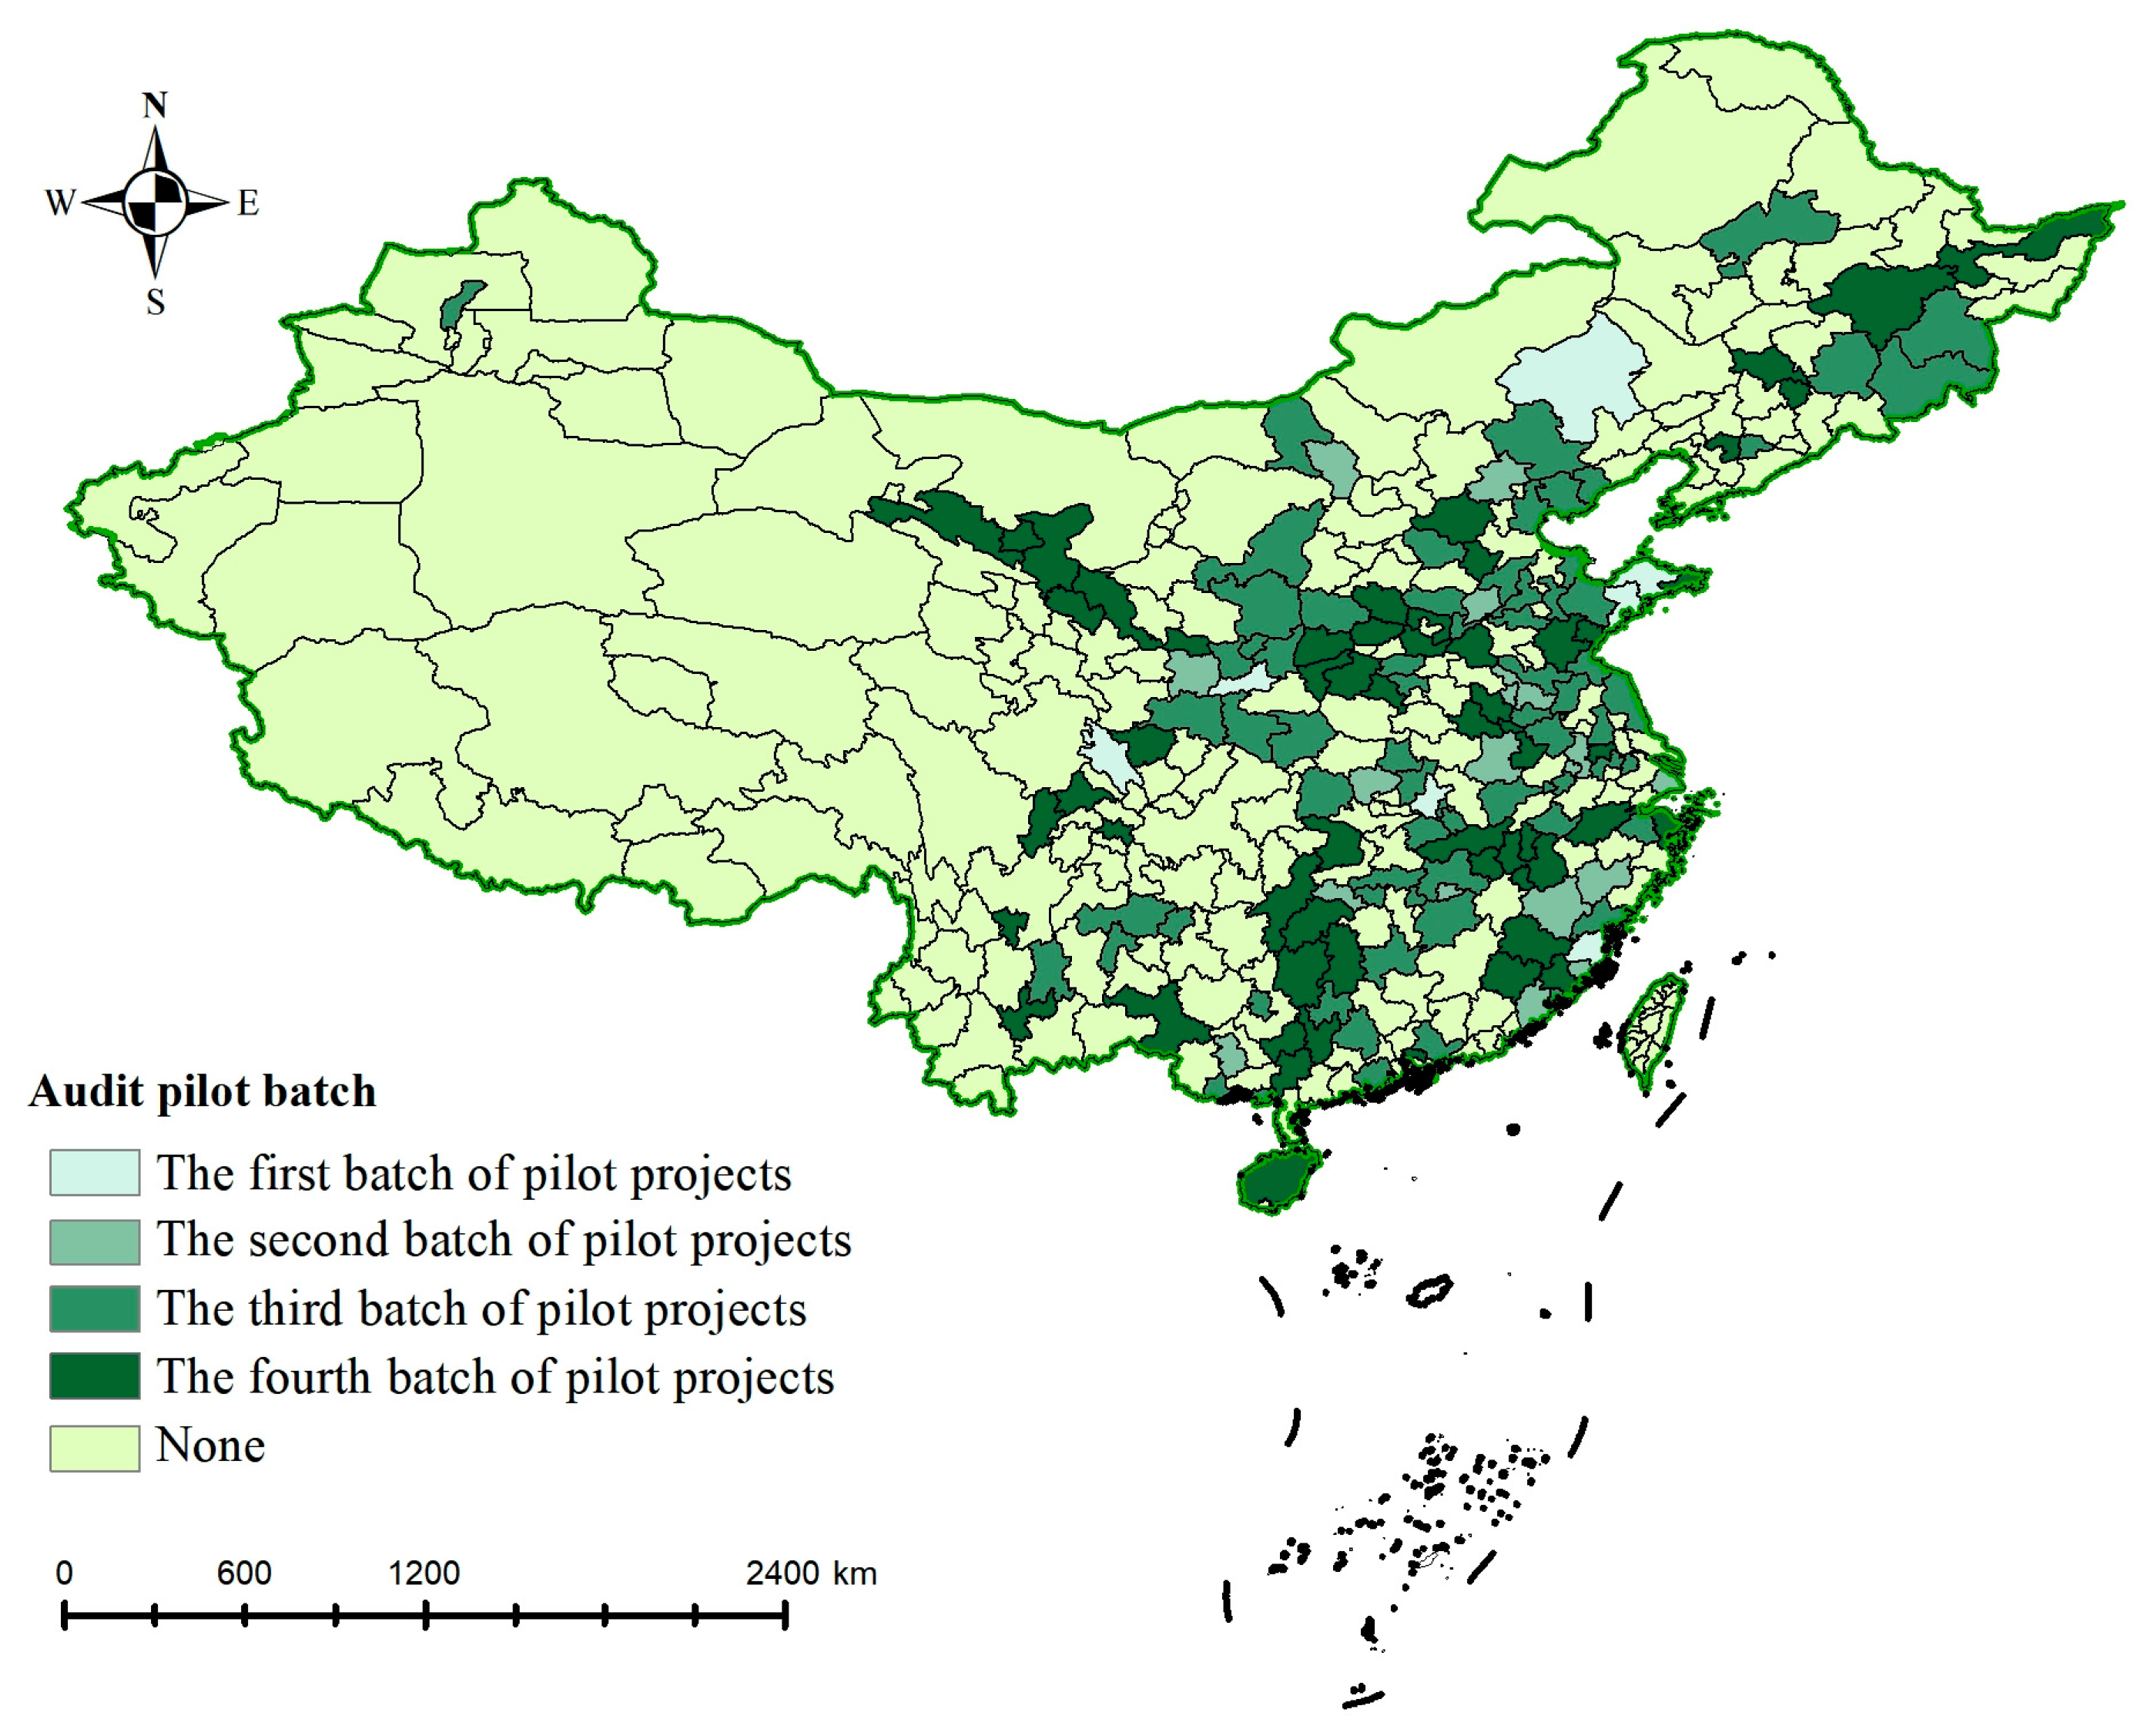
2.1. Institutional Background

Since its reform and opening up, China’s economy has experienced rapid and sustained development, and its scale has expanded dramatically. However, high environmental costs have accompanied China’s economic development [30]. The quality of the environment continues to deteriorate, and environmental problems are a major constraint on China’s ability to build a moderately prosperous society. To achieve the “Beautiful China Initiative” plan for sustainable development, the Chinese government has changed its ways of evaluating the performance of officials, turning away from competition for GDP growth to evaluation based on the ability of officials to achieve environmental protection. As noted, the Third Plenary Session of the 18th Central Committee clarified that officials were responsible for strengthening the construction of an “ecological civilization” and proposed to explore the preparation of natural resource balance sheets and conduct the accountability audit pilot. Since then, accountability audits have gradually entered into Chinese government audits.
The accountability audit pilot was issued by the General Office of the Central Committee of the Communist Party of China (CPC) and the General Office of the State Council in 2014, with the plan that it would be fully rolled out in 2018. In the pilot phase, the National Audit Office organized provincial audit institutions in Inner Mongolia, Shandong, Guizhou, and some other provinces to conduct audits on grasslands, oceans, forests, minerals, land, and water resources. The accountability audit covers the following three aspects: (1) management, development, and utilization of land, water, forests, grasslands, minerals, oceans, and other natural resource assets; (2) environmental protection and improvement of the atmosphere, water, and soil; and (3) the protection and restoration of forests, grasslands, deserts, rivers, lakes, wetlands, oceans, and other ecosystems. The object of the accountability audit is to make the relevant persons in charge of a certain unit responsible for the management and utilization of natural resources; these relevant persons include the local executive leaders, heads of the Ministry of Resources and Environment, and heads of state-owned enterprises (SOEs). The accountability audit is a new audit model that aims to comprehensively evaluate officials’ responsibility for the ecological environment and economic development [31].
As clarified in the government guidelines, the accountability audit results are an important indicator of the assessment, appointment or removal, and the rewards or punishments of leading officials. As a result, as of early 2018, more than 180,000 local officials were punished for failing to fulfill their environmental governance responsibilities [32]. The literature suggests that before the implementation of the accountability audit, the political promotion system of China was based purely on economic performance, forcing local government officials to focus on developing the economy at the expense of the environment [16]. After the implementation of the accountability audit, this has changed to a more balanced focus on both economic development and environmental protection, requiring local officials to change their behavior accordingly. Therefore, it can be predicted that local officials will pay more attention to balancing economic development and environmental protection after the introduction of the accountability audit than before. As Xie et al. point out [33], China’s environmental regulations are largely command-and-control-based in that the government forces firms to change some of their business behaviors by imposing strict administrative orders and/or providing environmental protection subsidies.

2.2. Literature Review

2.2.1. Economic Consequences of Government Audits

Government audits play an important role in public management and can greatly improve the performance of governance functions [15]. Nearly three decades of rapid economic development in China have led to ecological deterioration, and increasingly serious environmental problems have led to calls for environmental protection regulations. As one of the government audit functions, environmental auditing has grown in importance. Environmental audits have several important effects, such as avoiding the risk of environmental pollution in advance [34], improving ecological efficiency [15], and improving the natural resource asset situation [35]. The literature suggests that external regulatory pressure influences firms’ governance strategies [36,37], encouraging them to increase their investment in environmental governance. The methods and tools that local governments use to stimulate environmental protection actions by firms include taxation and environmental subsidies. Using the pilot of the audit reform as an exogenous event, Cao et al. empirically find that government audits can strengthen environmental governance by increasing the provision of funds, but the effect varies depending on the government’s independence [15].
The introduction of the accountability audit to the government’s audit function accompanied the Chinese government’s increasing emphasis on environmental protection. However, only a few studies have investigated the actual impact of this policy. From a macro-level perspective, Feng et al. find that the accountability audit program reduces air pollution and that this positive impact occurs not only in the pilot cities but also in the cities nearby [16]. They provide an insight into the relationship between officials’ new political promotion mechanism and the accountability audit and suggest that the coordination between economic development and environmental protection deserves further discussion. From a firm-level perspective, after the introduction of the accountability audit pilot, firms are increasing their environmental investments either due to receiving local government subsidies or the promulgation of stricter regulations than before the pilot. Zeng et al. find that heavily polluting firms are more likely to adopt a source prevention strategy than an end-of-pipe governance strategy after the implementation of the accountability audit. Their results indicate that firms’ environmental strategies are based on local officials’ promotion expectations [18].

2.2.2. The Debate on Green Innovation

Whether environmental regulations promote green innovation is a topic of long debate in the literature. Studies that pre-date the development of the Porter hypothesis tend to suggest that environmental regulations are likely to limit firms’ competitiveness, which inhibits their willingness to adopt green innovation [38]. Conversely, the Porter hypothesis argues that environmental regulations increase firms’ competitiveness [39]. Jaffe and Palmer further distinguish the strong and weak Porter hypotheses, arguing that environmental regulations can improve firms’ R&D expenditure, but do not have a significant effect on innovation output [40]. Most empirical studies show that environmental regulations promote firms’ green innovation. Du et al. find that establishing automatic air monitoring stations significantly promotes green innovation by firms [41]. However, some studies find that the relationship between government policies and green innovation is nonlinear. Du et al. suggest that when the level of economic development is low (high), environmental regulations inhibit (promote) green technology innovation [42].
Green innovation contains both economic development and environmental protection features. Pursuing economic development remains an important goal for governments and firms, and actions to save resources and reduce environmental pollution conform with the Party’s concept of development. Therefore, green innovation is an appropriate choice for firms to deal with environmental problems [31]. Studies often measure green innovation by the number of green patents applied for and authorized, firms’ R&D expenditure, and other research expenses [15,17,18]. However, these studies merely focus on the quantity of green innovation, ignoring the different types of green innovation strategies.
Some studies do argue for the need to distinguish green innovation strategies. As noted, one of the classification methods divides green innovation into green product and green process innovations. Green product innovation focuses on the improvement of existing products or the development of new products, whereas green process innovation focuses on the production process of products. The empirical results of Huang et al. show that dynamic capability, coordination capability, and social reciprocity influence both types of innovations [43]. However, an increasing number of studies find that innovations cannot be clearly classified as either process or product innovations, as they are interdependent [44,45].
Another strand of studies divides green innovation strategies into incremental and radical innovations based on the ambidextrous innovation classification. Radical innovation mainly enters into new technological fields through the wide acquisition of new knowledge and skills, whereas incremental innovation mainly expands the existing technology field through existing knowledge reserves [29,46,47]. Wang et al. demonstrate that both radical and incremental green innovations have inverted U-shaped relationships with boundary-spanning search [31]. Guo et al. show that the development of both radical and incremental green innovations is affected by green entrepreneurial orientation and supply chain learning [4]. Zhang et al. find that appropriate environmental policies, such as carbon taxes and innovation subsidies, promote the adoption of radical green innovation and thereby reduce carbon emissions [20]. However, these studies use questionnaire survey methods to distinguish between incremental and radical green innovations, which lack objectivity and accuracy.

3. Hypothesis Development

For the purpose of promotion and political career, government officials encourage firms in their jurisdictions to conduct green innovation, a long-term strategy, after the pilot. Under the traditional political tournaments of Chinese government officials, officials’ assessment and promotion mechanisms focus on GDP as the core indicator [3]. Accordingly, local governments focus on local economic development and lack incentives to consider environmental governance. In general, governments only achieve the basic goal of accountability for environmental regulations rather than solving the pollution problem at the source [2]. Therefore, firms bear low environmental penalty costs and have little motivation to conduct green innovation activities.
With China’s increasing attention to environmental protection, the accountability audit pilot was implemented, aiming to strengthen officials’ responsibility for environmental governance and thereby enhancing the environmental protection efforts within their jurisdictions. The assessment mechanism for officials is no longer an “economic account” based solely on their region’s GDP but an “ecological account”, which increases the weight given to environmental governance. The assessment results of the accountability audit are the main basis of officials’ evaluation and appointment. To improve their assessment results, government officials are motivated to increase environmental supervision and investment and increase the requirements for firms in their jurisdictions to implement corporate environmental responsibility [48]. However, the accountability audit conducts an overall assessment and evaluation of the natural resource asset management and ecological and environmental protection actions performed by local government officials during their tenure and implements a lifelong accountability mechanism for behaviors that damage the ecological environment. To reduce the risk of being held accountable for environmental damage, government officials tend to adopt long-term strategies to improve local environmental governance.
Firms are the main source of environmental pollution and an important force for the promotion of green development. Hence, to achieve pollution prevention and control and fulfill their responsibilities for natural resource asset management and ecological environment protection, government officials need to actively encourage firms in their jurisdictions to conduct environmental protection activities. However, as their political performance is determined by both economic and environmental performance in their jurisdictions, government officials cannot seek to achieve environmental performance through measures that reduce economic performance, such as shutting down polluting firms. Carrying out green innovation activities not only prevents pollution at the source but also promotes economic development [39], and thus such activities are an important means for government officials to improve their environmental performance [49].
Firms are willing to adopt green innovation strategies after the pilot, as it not only improves the firm’s environmental performance but also improves its economic performance. Green innovation is an important method for improving environmental performance. It can reduce firms’ environmental violations, lower pollutant emissions, reduce air pollution, and improve overall environmental performance [5,6,19,42,50,51]. Conducting green innovation allows firms to meet the government’s environmental requirements and improve their economic performance [7,8].
By adopting green innovation strategies, firms can meet the needs of different stakeholders. Therefore, firms will adopt corresponding environmental strategies to meet the environmental protection needs of stakeholders [10,52], which include governments, consumers, investors, banks, competitors, and the media [53,54,55]. Among these stakeholders, the government is most important to firms, and pressure from the government will encourage firms to take actions to enhance environmental protection and assume environmental responsibility [56]. To maintain their relationship with and win support and protection from the government, firms will evaluate the intensity of government pressure and weigh the cost of environmental governance against the possible penalty for ignoring environmental governance. When the environmental governance pressure exerted by local governments on firms reaches a certain level, the rational decision for firms is to alter and improve their production process and resource allocation to produce cleaner and more environmentally friendly products and improve their technological processes, actions that are ultimately reflected in the promotion of green innovation [10].
Local governments transfer the pressure they experience from the central government to achieve environmental governance to firms through environmental regulations [57], environmental subsidies [18], and pollution charges and taxes [2]. Adopting green innovation allows a firm to comply with relevant policies and regulations, mitigate pollution penalties, and receive policy support and government subsidies.
First, based on institutional theory, under the pressure of regulatory legitimacy, firms will comply with the rules and regulations made by regulatory agencies. According to the Porter hypothesis, appropriate environmental regulations can induce firms to increase their R&D expenditure and alter their production processes to reduce environmental damage; the tightening of policies and regulations may also force firms to increase their investment in green innovation [39]. Since the implementation of the accountability audit pilot, the environmental policies of local governments have been strengthened, increasing pressure on the firms in their jurisdictions to achieve environmental legitimacy. Such pressure has a positive impact on firms’ environmental strategies [58]. It encourages them to comply with environmental policies, enhances their environmental awareness and responsibilities, embeds environmental protection in their corporate strategic plans, and increases their investment in technology and equipment to improve energy utilization and successful innovation [2,59].
Second, environmental legal costs can be lowered if firms engage in green innovation activities that reduce pollution [11,60]. The accountability audit strengthens the pressure of environmental governance on local governments. Therefore, local government officials will seek to inhibit firms’ activities that harm the environment by increasing emission charges and charging green compensation fees, forcing firms to carry out environmental protection strategies. The increase in pollution penalties will increase firms’ costs and thereby lower their income. To reduce the cost of environmental regulations, firms will increase their investment in environmental management [37].
Finally, firms gain government support and subsidies by implementing green innovation. Following the implementation of the accountability audit, local governments provide more policy support and government subsidies to firms with environmental governance [18]. As government subsidies alleviate firms’ financing constraints, firms can more easily adopt green innovation strategies [9,61]. At the same time, based on resource-dependence theory, the survival of firms depends on the resources provided by the external environment, and firms that invest more in environmental protection are more likely to obtain other resources from local governments, such as financial subsidies and tax incentives, compared with other firms that invest less in environmental protection. Therefore, firms are willing to reduce pollution by adopting green innovation strategies.
However, what are the characteristics of the green innovation strategies that the firms are more willing to adopt after the pilot? The Interim Provisions on the Implementation of the Accountability System for the Leaders of the Party and Government clearly stipulate that an official’s term is five years and that they can hold the same position for no more than two consecutive terms. However, the latest statistics show that the average tenure of each official is only about four years [31,62]. Under the pressure of tenure constraints, officials tend to maximize their returns during their tenure for promotion purposes [63]. As green innovation tends to be costly and involves high levels of uncertainty [64], officials are not inclined to choose green innovation strategies that cost more, require longer time frames, and are less likely to be perceived as beneficial by the public, audit institutions, and superior authorities compared with other green innovation strategies [14].
From a firm’s perspective, they need to satisfy the government’s environmental protection demands without compromising performance. Therefore, to show their positive commitment to the government’s appeal and/or request, firms need to adopt green innovation strategies that have higher certainty and are realized faster than other strategies. The implementation of green innovation based on existing knowledge and ideas can be completed within a short period at a relatively low cost and has a reasonably high probability of achieving positive results to meet the government’s environmental requirements. This type of green innovation strategy results in the increased proximity of green innovation outcomes to existing innovations. Therefore, firms are more likely to adopt green innovation strategies that are more proximate to their existing innovations.
Based on the above analysis, we propose the following hypothesis:
Hypothesis 1.
(H1). The implementation of the accountability audit increases firms’ green innovation proximity.
According to the ambidextrous innovation classification, there are two types of firm innovations: incremental and radical innovations. Incremental innovation expands the existing technology field with minimal changes to the technological base of a product and has controllable costs and predictable and positive returns. Conversely, radical innovation enters into a new technology field by acquiring extensive new knowledge and new skills and has uncertain returns that are distant and may often be negative [12,29,47]. Radical innovation involves the exploration of unknown knowledge, which requires both tolerance for failure and expensive resource inputs [29]. Consequently, radical innovation may not yield significant environmental improvements during an official’s period of tenure but may even lead to a loss of GDP, thus adversely affecting the official’s career. Incremental innovation, which has lower levels of technology investment, lower risk, and a shorter time frame to completion [12] than radical innovation, is more likely to yield improvements in environmental performance during an official’s tenure. Therefore, a firm will tend to reduce radical innovation resources and supplement its incremental innovation resources when facing external environmental pressure [29], such as that imposed by the accountability audit.
Based on the above analysis, we propose the following hypothesis:
Hypothesis 1.
(H2). The implementation of the accountability audit improves firms’ incremental green innovation.

4. Research Design

4.1. Data and Sample Selection

The information on the accountability audit was manually collected from the official websites of the National Audit Office of the People’s Republic of China, Provincial and Municipal People’s Governments, Audit Bureaus, and various official media reports. We identified pilot cities using the following keywords: “audit of off-office officials’ natural resource asset management”, “the annual audit plan”, and “the audit work report”. The accountability audit pilot was implemented in stages and steps, as illustrated in Figure 1. The first wave officially began in 2014 and covered 12 cities, including Fuzhou, Huanggang, Wuhan, Chifeng, Ordos, Nantong, Qingdao, Yantai, Chishui, Mianyang, Wuyishan, and Xi’an. Then, beginning in 2015, the second wave covered an additional 18 cities, such as Huaibei, Suzhou, and Nanping. The third wave, which began in 2016, added 78 more cities. By the end of 2017, 173 cities in China were included in the accountability audit pilot.
The data on green innovation were sourced from the Chinese Research Data Services–Green Patent Research Database (CNRDS-GPRD). CNRDS-GPRD is a professional database that combines the data on Chinese patents disclosed by the State Intellectual Property Office and the green patent classification standards issued by the World Intellectual Property Organization, which is widely used in the field of green innovation research [65]. The database screens green patents from different patent categories and provides various forms of patent information, including firms applying for patents, application date, patent classification number, and patent number, which enables us to identify firms’ green innovation strategies. Our sample consists of all A-share firms listed on the Shanghai and Shenzhen stock exchanges from 2010 to 2017, as the initial year of the implementation was 2014, and the pilot ended with the extension of the accountability audit program nationwide in 2018. We obtain other financial data and office addresses from the China Stock Market and Accounting Research (CSMAR) database. The CSMAR Solution supplies firms’ economic characteristics and has been widely used for economics and business management research on Chinese listed firms since 1990 [66,67].
Our data screening process involved the following steps: (1) to avoid abnormal financial data, we deleted 985 firm years with abnormal listing statuses; (2) due to the particularity of reporting requirements in the financial industry, we excluded 389 observations for firms operating in this industry; (3) to obtain the true ownership structure information of the firms, we removed 1166 observations for cross-listing firms; and (4) we removed 2037 observations missing the data required to calculate the control variables to ensure data integrity. After this screening process, our final sample contained 16,789 firm-year observations. Table 1 shows our sample selection process. We winsorized all continuous variables at the 1st and 99th percentiles to reduce the influence of outliers.

4.2. Dependent Variables

Patents are widely used in innovation research as a proxy for innovation activities. Studies often use the number of green patents to measure green technology innovation [41,68,69]. To further test firms’ green innovation strategies, we calculate the following proxies.
(1) TECH _ PROXIMITY. This variable measures the extent to which a firm stays in or deviates from its current research field. It is defined as the proximity between the technical field of a firm’s patent application in year t − 1 and the technical field of its patent portfolio in year t. Specifically, this measure is calculated as follows:
TECH _ PROXIMITY i , t , j , c = X i , t , j , c X i , t 1 , j , c ( X i , t , j , c X i , t , j , c ) 0 . 5 ( X i , t 1 , j , c X i , t 1 , j , c ) 0 . 5
where Xi,t,j,c = (Xi1,t,j,c, Xi2,t,j,c,…, Xiτ,t,j,c,…, XiT,t,j,c) is a vector that represents the proportion of patents of firm i in city c and industry j in the technology classification τ = 1,2,…, T. Xi,t−1,j,c represents the proportion of patents in each technology category of the firm as of year t − 1, and j and c represent the industry and city, respectively. The value of TECH_PROXIMITY indicates the correlation between a firm’s latest technology field and existing green technology fields. A higher value of TECH _ PROXIMITY suggests that the firm adopts a narrower path of green innovation, whereas a lower value suggests that it undertakes more exploration in new technology fields [29].
(2) KNOWN (UNKNOWN). To test whether a firm’s green innovation strategy belongs to exploration or exploitation, i.e., incremental versus radical green innovation, in the context of the accountability audit pilot, we would ideally directly identify the allocation of a firm’s R&D to different types of green innovations. However, this allocation is only indirectly observable in the data. March provides us with a method for indirectly identifying firms’ green innovation strategies, which is widely used in innovation research [12]. Specifically, we use the analytical framework of March [12] and adopt measures based on existing research [29,46] to differentiate green innovation types and identify firms’ green innovation strategies. The known (unknown) patent category refers to the patent category that has (has not yet) been applied for by the firm. We take the number of patents applied for in a firm’s known fields as the proxy for incremental innovation and the number of patents in unknown fields as the proxy for radical innovation. Specifically, we use the International Patent Classification (IPC) to differentiate incremental green innovation activities and radical green innovation activities in the following way. First, we take the first four IPC characters as the benchmark for the division of green innovation fields. The IPC divides the technical field into five levels (Section; Class; Subclass; Group; and Complete classification symbol). The first four characters of the IPC codes used in this paper are accurate to the “Group” level. If the green patent category applied for by the sample firm in year t involves a new technology field, it is classified as radical green innovation; otherwise, it is classified as incremental green innovation [29,46]. The definition of a new technology field is that if the IPC technology field marked by a patent has not appeared in the firm’s patent applications in the past 5 years (t − 1 to t − 5), the IPC technology field is considered a new field. Then, following existing research [70,71], we use the logarithm of the number of green innovations to standardize the data. Finally, we use a 5-year window to evaluate the technology types, as most technologies lose their technical and economic relevance within 5 years [72].
We use the number of green patent applications to identify firms’ green innovation strategies based on the following considerations. First, the allocation of firms’ R&D to develop different types of green innovations is not directly observable in the data. Green patents most intuitively reflect the output of firms’ green innovation activities and have a clear technical classification compared with R&D investment, which enables us to distinguish incremental and radical innovations [68,73]. Second, the patent application process takes a long time, and there is a time lag before patents are granted. Therefore, we use patent application data instead of patent authorization data to more accurately estimate the impact of the accountability audit pilot on green innovation activities. Finally, not all innovation inputs successfully obtain patents, so the number of patents obtained may underestimate innovation output. Therefore, compared with green patents obtained, green patent applications more fully reflect firms’ efforts in green technology innovation [72].

4.3. Baseline Regression Model

The DID model is commonly used in policy evaluation [41,65,74]. We build on the model of Chen et al. [74] and estimate the following DID model to examine our hypotheses:
TECH _ PROXIMITY i , t , j , c / KNOWN i , t , j , c / UNKNOWN i , j , t , c = a 0 + β 1 POST t + γ CONTROLS i , t , j , c + u i + λ t + δ j + η c + ε i , t , j , c
POSTt is a dummy variable representing the treatment of the accountability audit pilot; if city c, where the firm is located, implements the accountability audit program in year t, POSTt is defined as 1 from then on and 0 otherwise. CONTROLi,t,j,c is a set of control variables, ui represents individual fixed effects, λt is time fixed effects, δj and ηc denote industry and city fixed effects, respectively, and εi,t,j,c is the error term. We cluster the standard errors by the firm. Our coefficient of the policy effect is β1, which measures the average treatment effect of the accountability audit pilot.
Following the literature, we control for variables that influence firms’ green innovation strategies. We control for firm size (SIZE; EMENUM), which affects firms’ willingness to innovate, as large firms have more human resources, capital, and anti-risk capabilities than small firms [75,76]. We also control for firms’ asset–liability ratio (LEV) and return on assets (ROA) in line with evidence that firms with stronger financial situations are more capable of implementing green innovation [77]. In addition, the life cycle is related to innovation activities, and growing firms often choose to undertake more technological innovation than established firms [78,79]. Tangible assets reflect the perfection of infrastructure required for innovation [80] and intangible assets reflect the importance that firms attach to technology, so tangible assets ratio and intangible assets ratio should impact firms’ green innovation. Exports make firms face more pressure from clients, which will influence firms’ innovation motivation [67]. Firms with a high concentration of equity are more likely to convert R&D into product innovation [81], which may be a confounding variable affecting green innovation strategy. With the increasingly decentralized innovation activities, subsidiaries play an increasingly important role in the innovation process [82], so the number of subsidiaries is also an important factor affecting green innovation. Therefore, we also control for firms’ growth rate (GROWTH), firm age (AGE), tangible assets (TANG), intangible assets (INTANG), the proportion of overseas business income (FGNSALE), the concentration of equity (Top), and the number of subsidiaries (SEG). Moreover, we follow He et al. [83] and Usman et al. [84] to control the book-to-market ratio (BM) and the proportion of independent directors (INDB). All of the variables in the baseline regression are defined in Appendix A, Table A1.

5. Empirical Results and Analysis

5.1. Descriptive Statistics

Table 2 presents the description of the variables used in the baseline regression. Only a few firms have either incremental or radical green innovation patents, which is consistent with previous research [6,69,76]. One reason for this data feature may be that firms have adopted protective measures for trade secrets, reducing the number of green patent applications. Considering the potential for technology spillovers, firms may choose more confidential methods than patent applications. Another reason may be that green technology patent applications are mainly made by firms specializing in environmental protection technology or firms in heavily polluting industries, which means that only a small number of firms have applied for green patents. Third, many green innovations are too small to apply for green patents, or it is not cost-effective to apply for such patents. In any case, the characteristics of the green patent data do not affect our analysis because firms’ green innovation strategies are reflected in the number of green patent applications. The standard errors of KNOWN and UNKNOWN are 0.648 and 0.455, respectively, showing significant differences in the adoption of incremental and radical innovations among firms. The mean value of KNOWN is significantly higher than that of UNKNOWN, indicating that firms are more inclined to adopt incremental than radical green innovations, which corresponds to a high level of TECH_PROXIMITY.

5.2. Baseline Regression Results

Table 3 presents the results from estimating Equation (2). The results in columns (1) and (2) reveal positive and significant relationships between POST and both TECH_PROXIMITY (β = 0.016; p-value < 0.01) and KNOWN (β = 0.046; p-value < 0.01), suggesting that the accountability audit pilot increases the proximity of green innovation by around 1.6% and encourages the firm to conduct incremental green innovation. Conversely, we find no evidence that there is a significant correlation between the accountability audit pilot and radical green innovation. As discussed, the accountability audit pilot means that firms face more stringent environmental supervision than before, which drives more green innovation resources toward incremental rather than radical green innovations.

5.3. Robustness Tests

Although the DID model can solve endogeneity problems to some extent, potential endogeneity problems remain a concern. In particular, the selection of the accountability audit pilot may be related to the city’s level of economic development or pollution, and its environmental policy, which may lead to fundamental differences between pilot and non-pilot cities. Similarly, firms’ green innovation strategies may be associated with city development and environmental policies. To enhance the reliability of our main findings, we conduct the following robustness checks: (1) we run a parallel trend test to ensure that using the DID method is valid; (2) we use a placebo test, entropy balancing, and PSM to address endogeneity concerns introduced by non-random treatment assignment [85]; (3) we control for additional city-level variables to mitigate concerns about correlated omitted variables; (4) we exclude special cities and re-estimate Equation (2); (5) we use a balanced panel regression test; and (6) we control for other confounding events during the sample period to strengthen our interpretation.

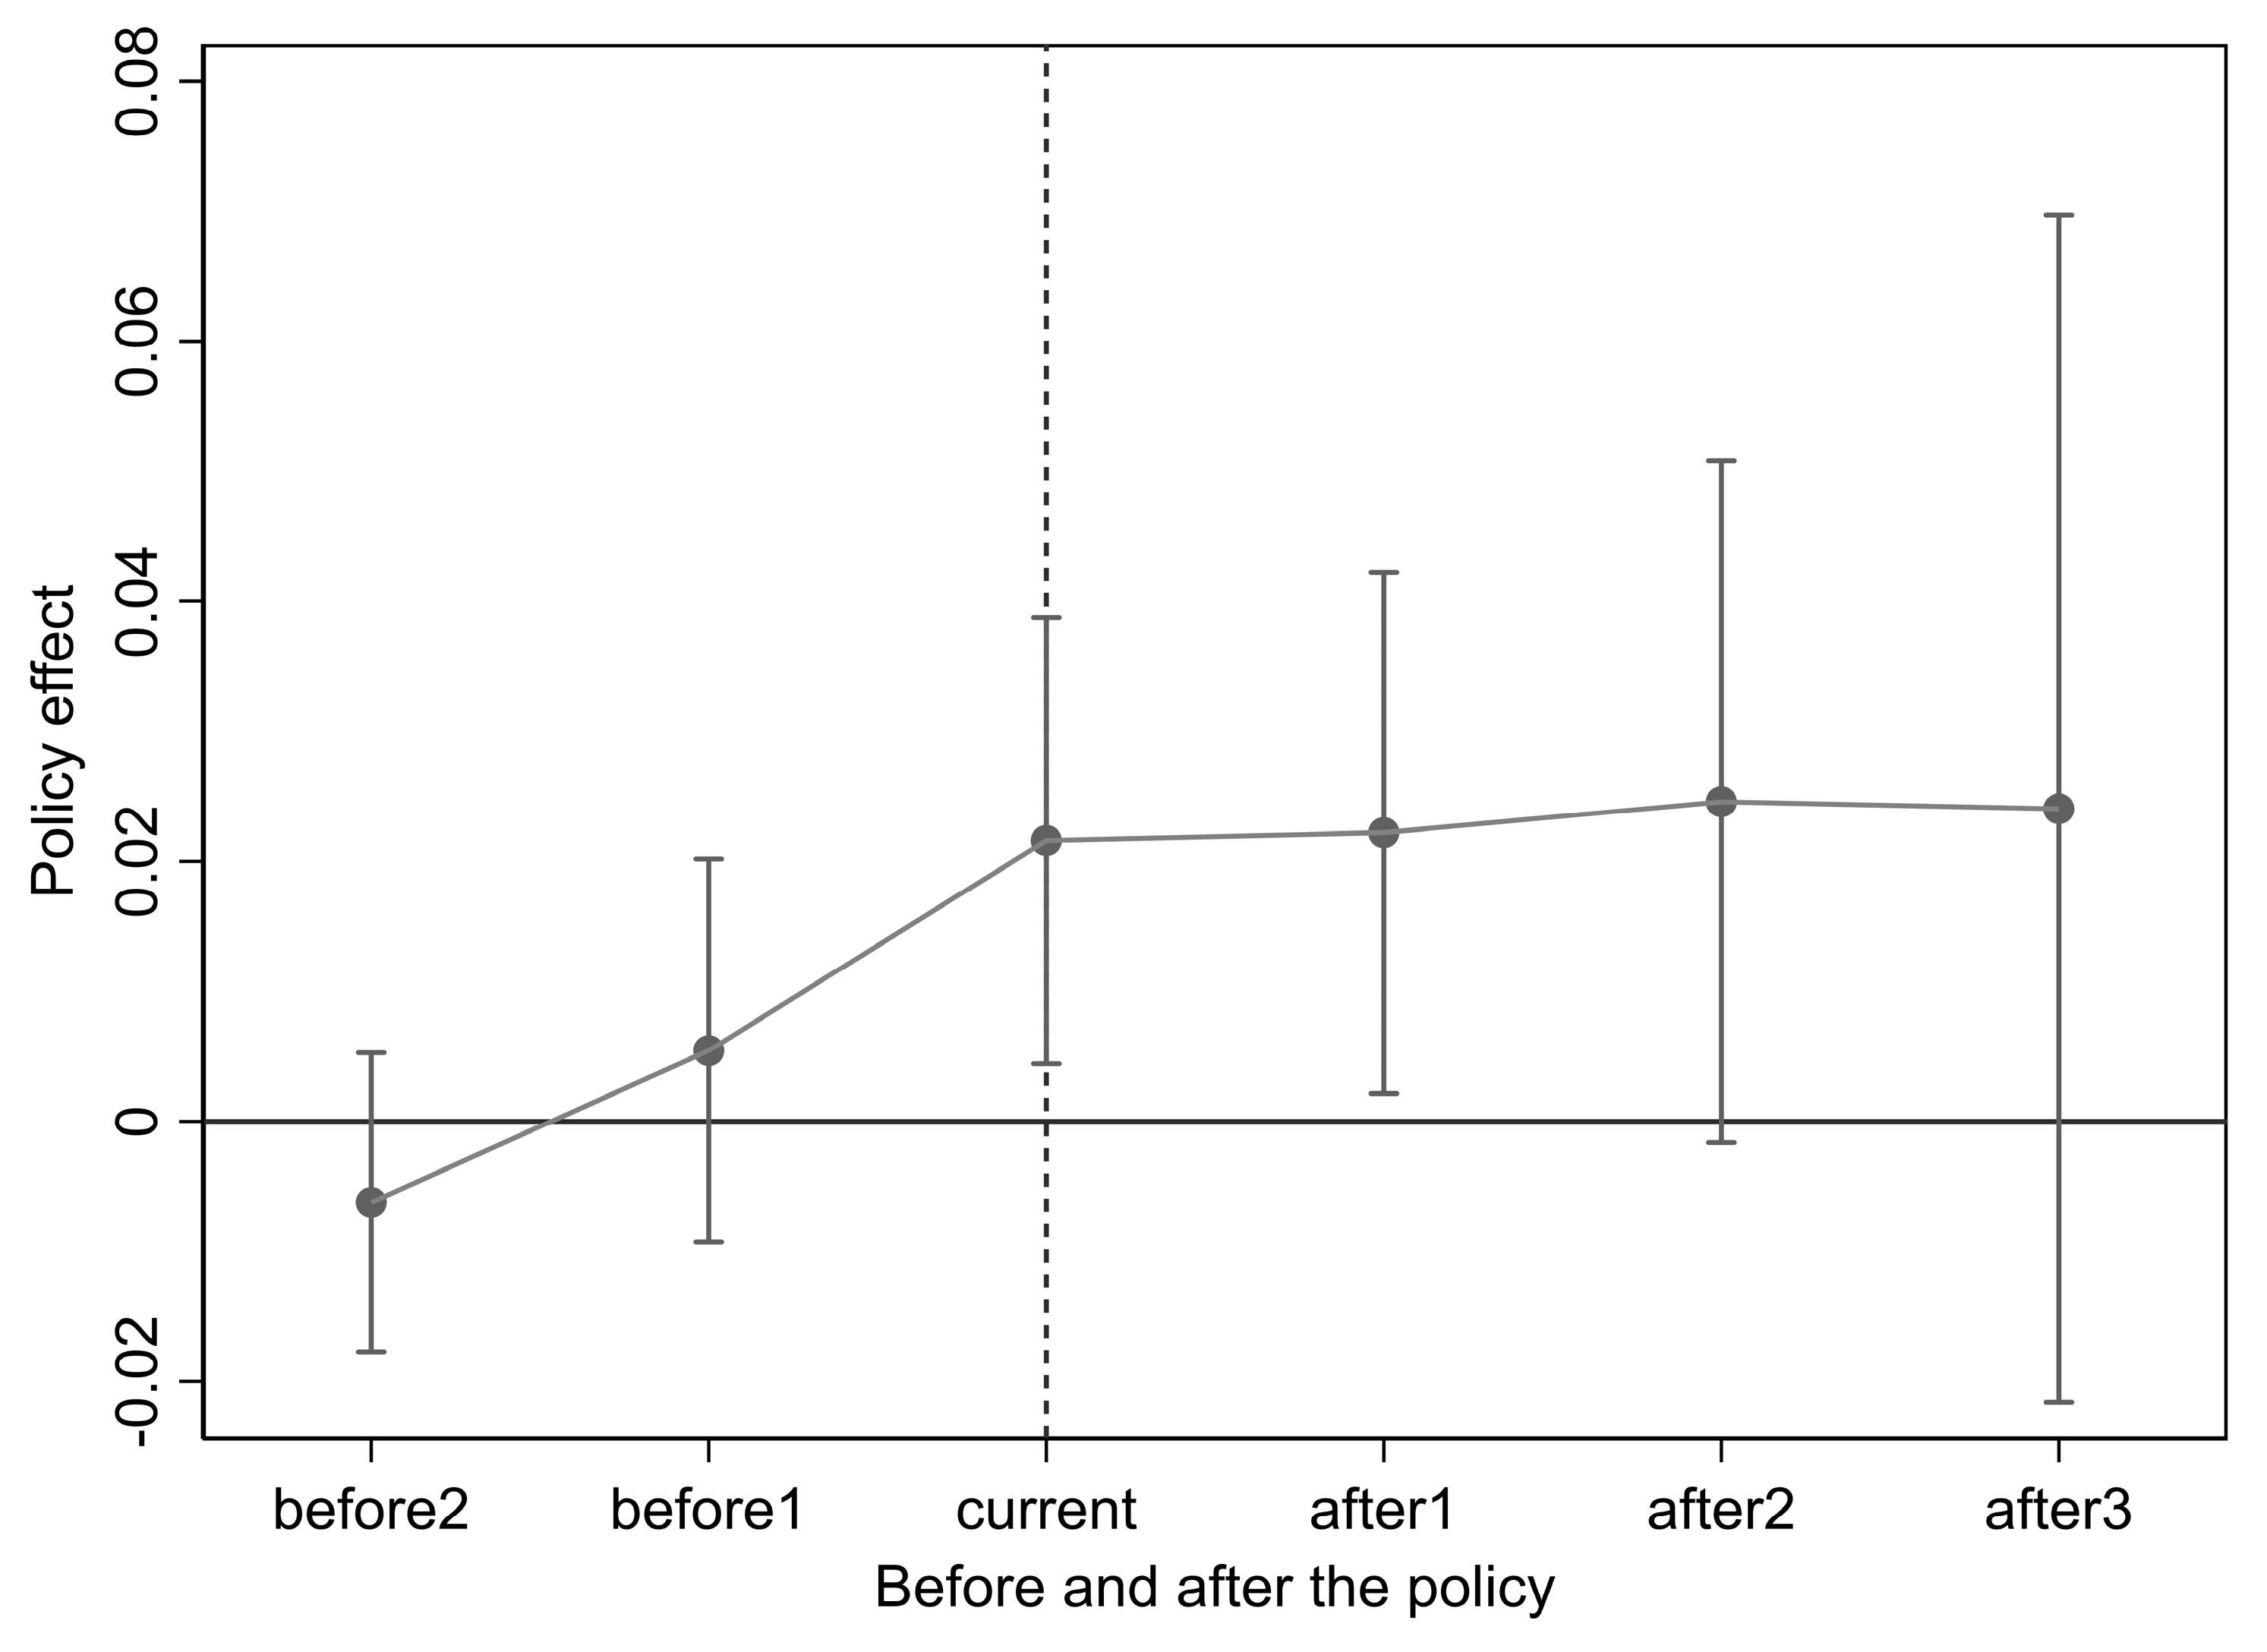
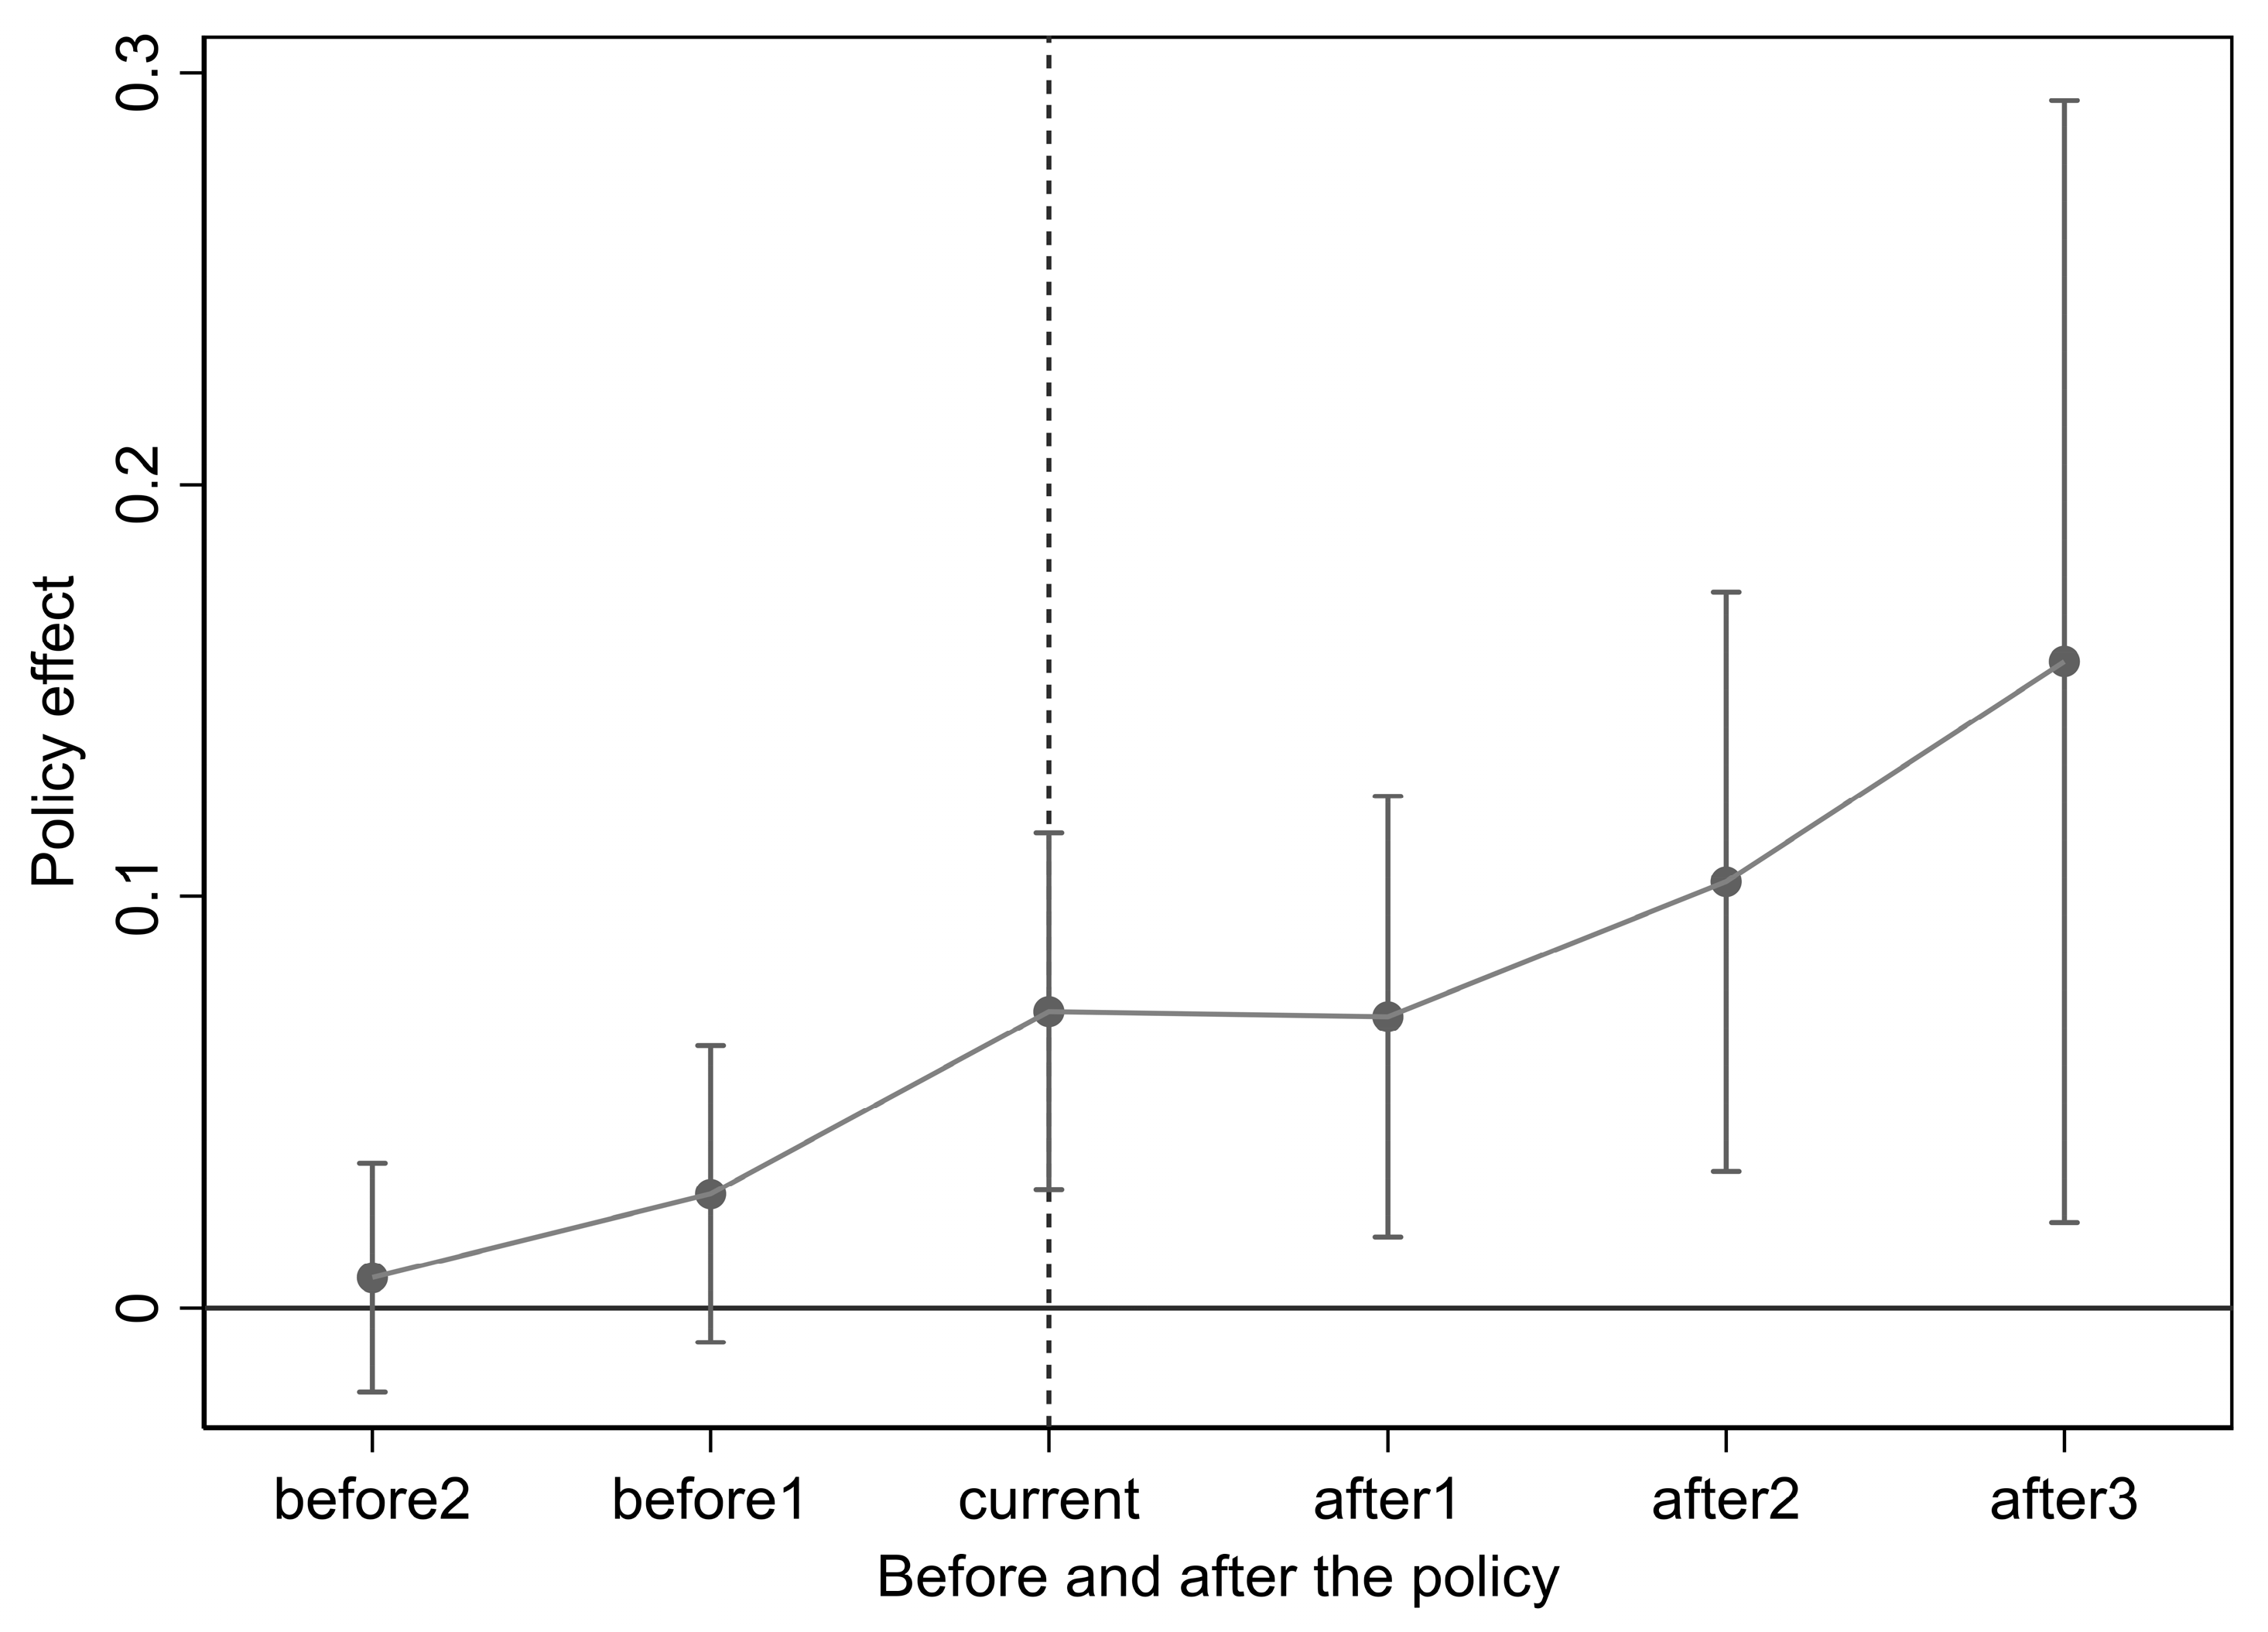
5.3.1. Parallel Trend Test
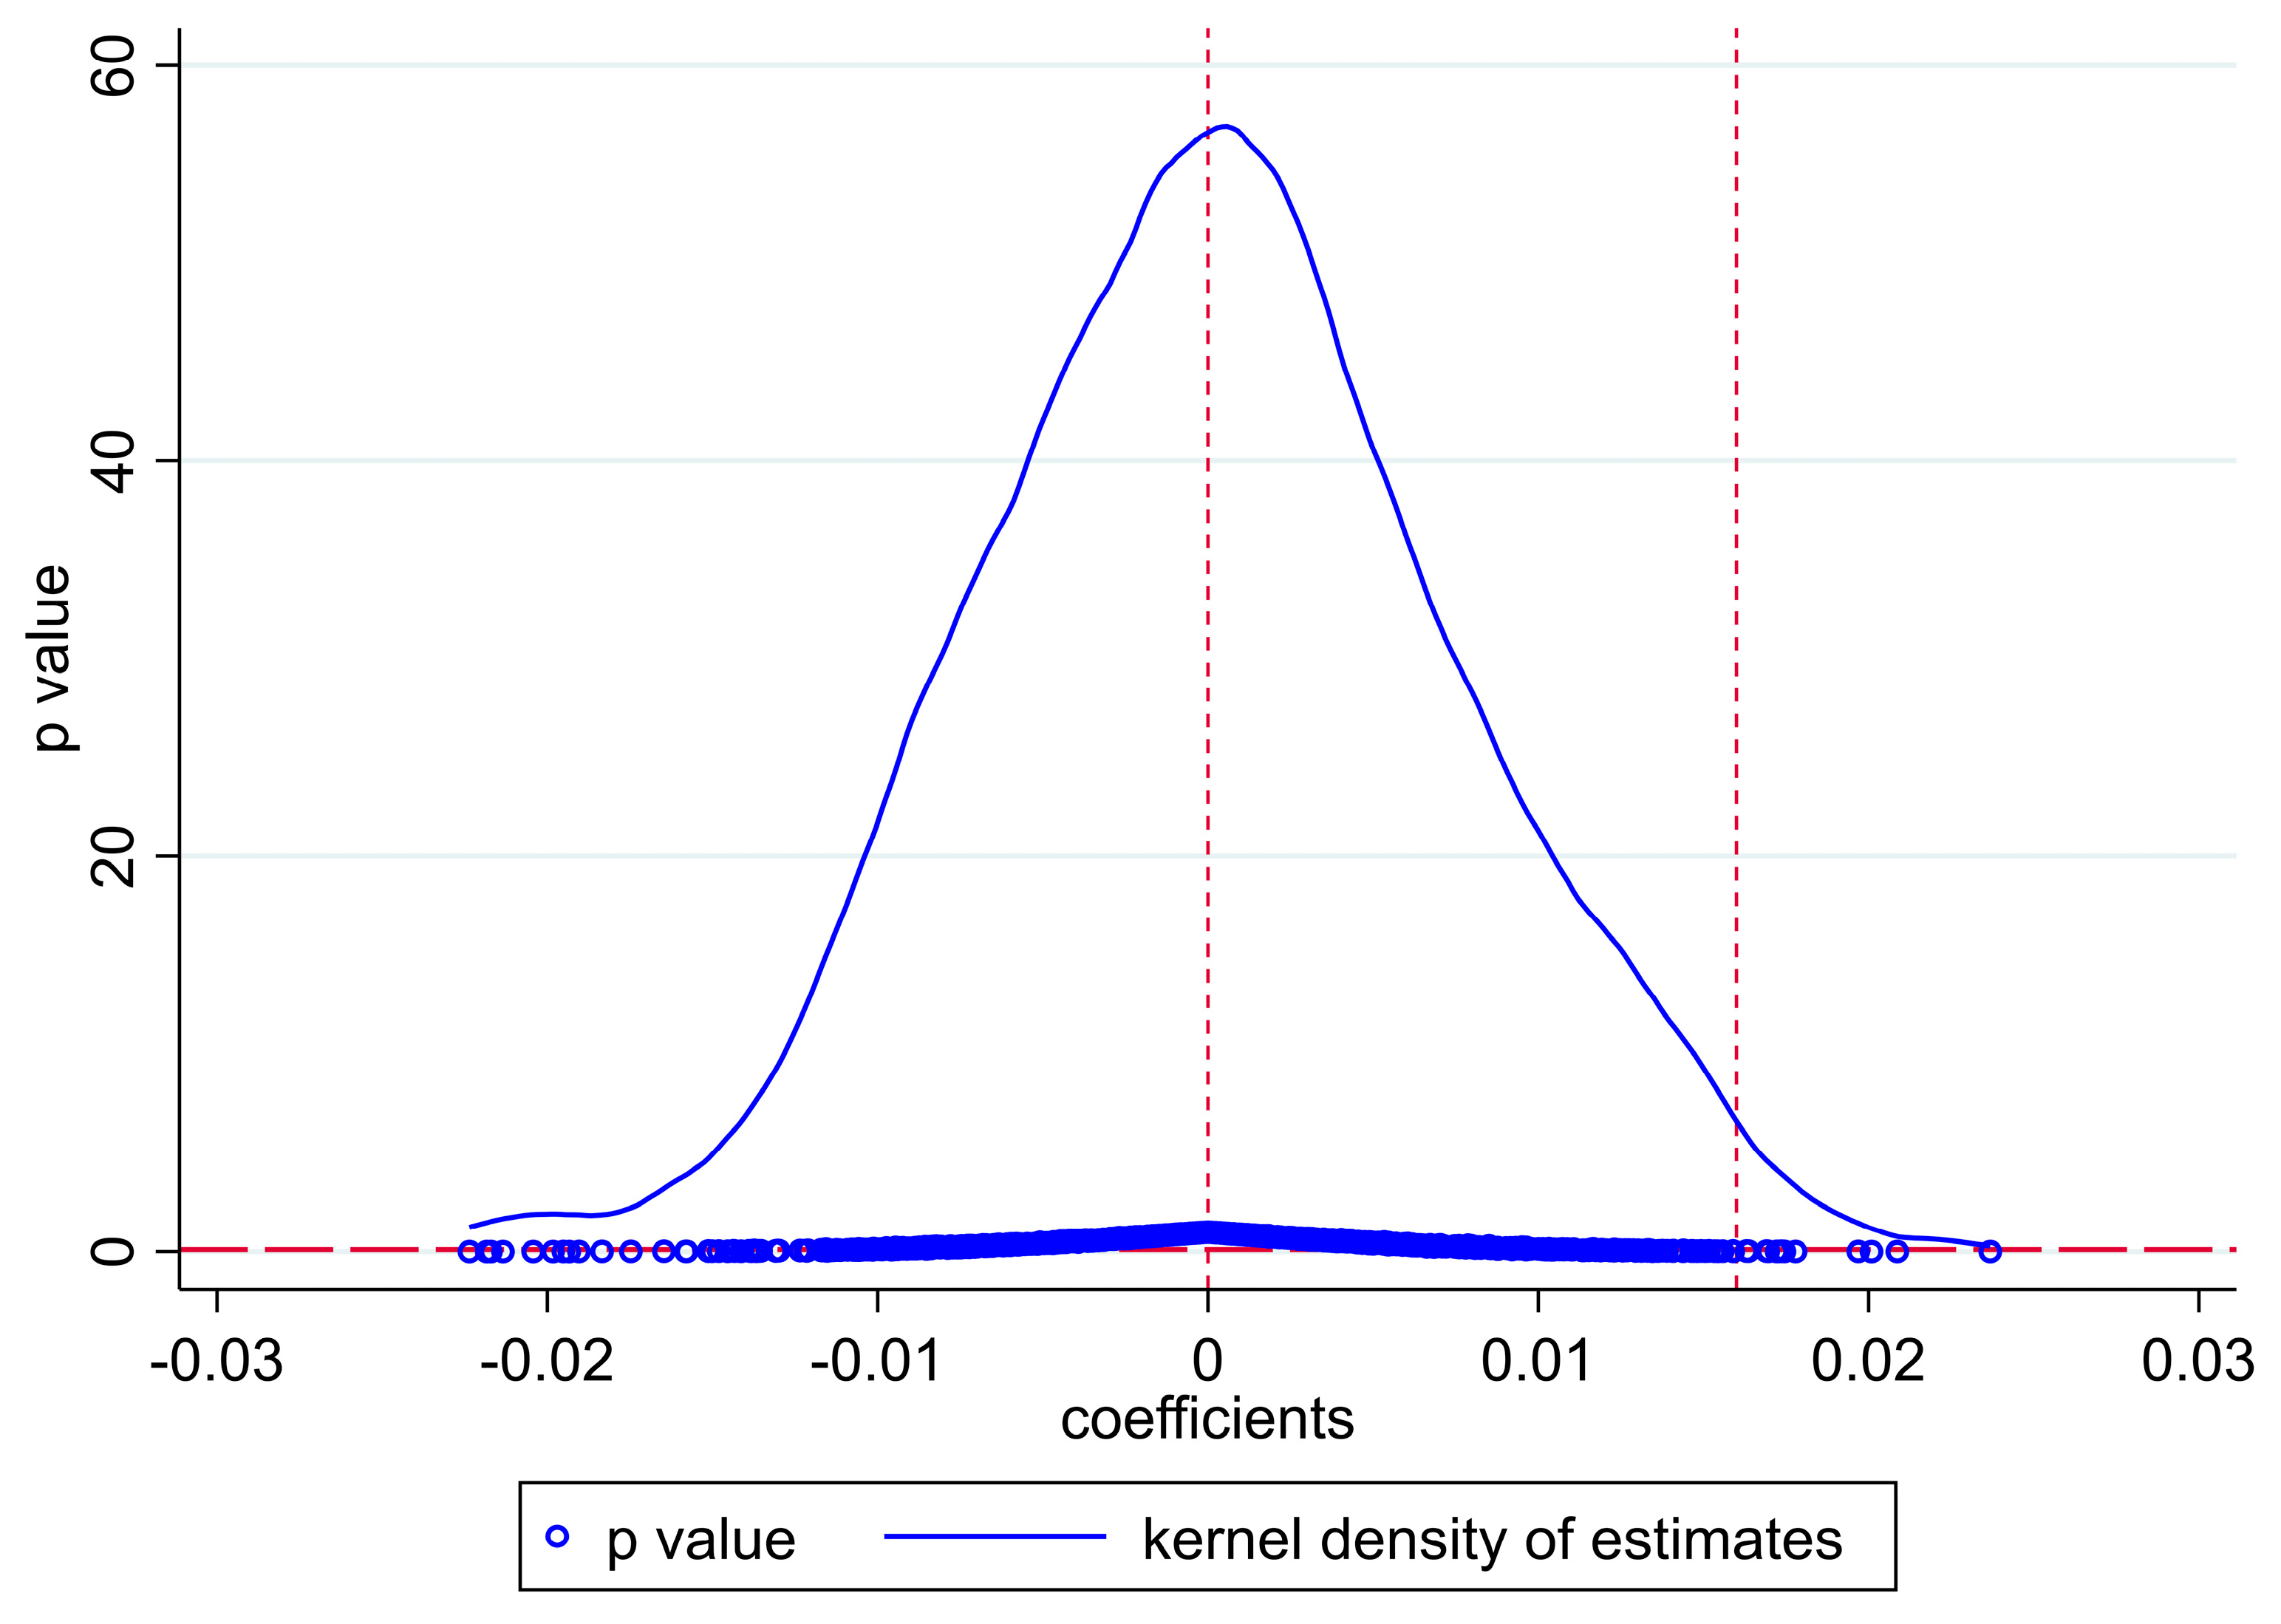
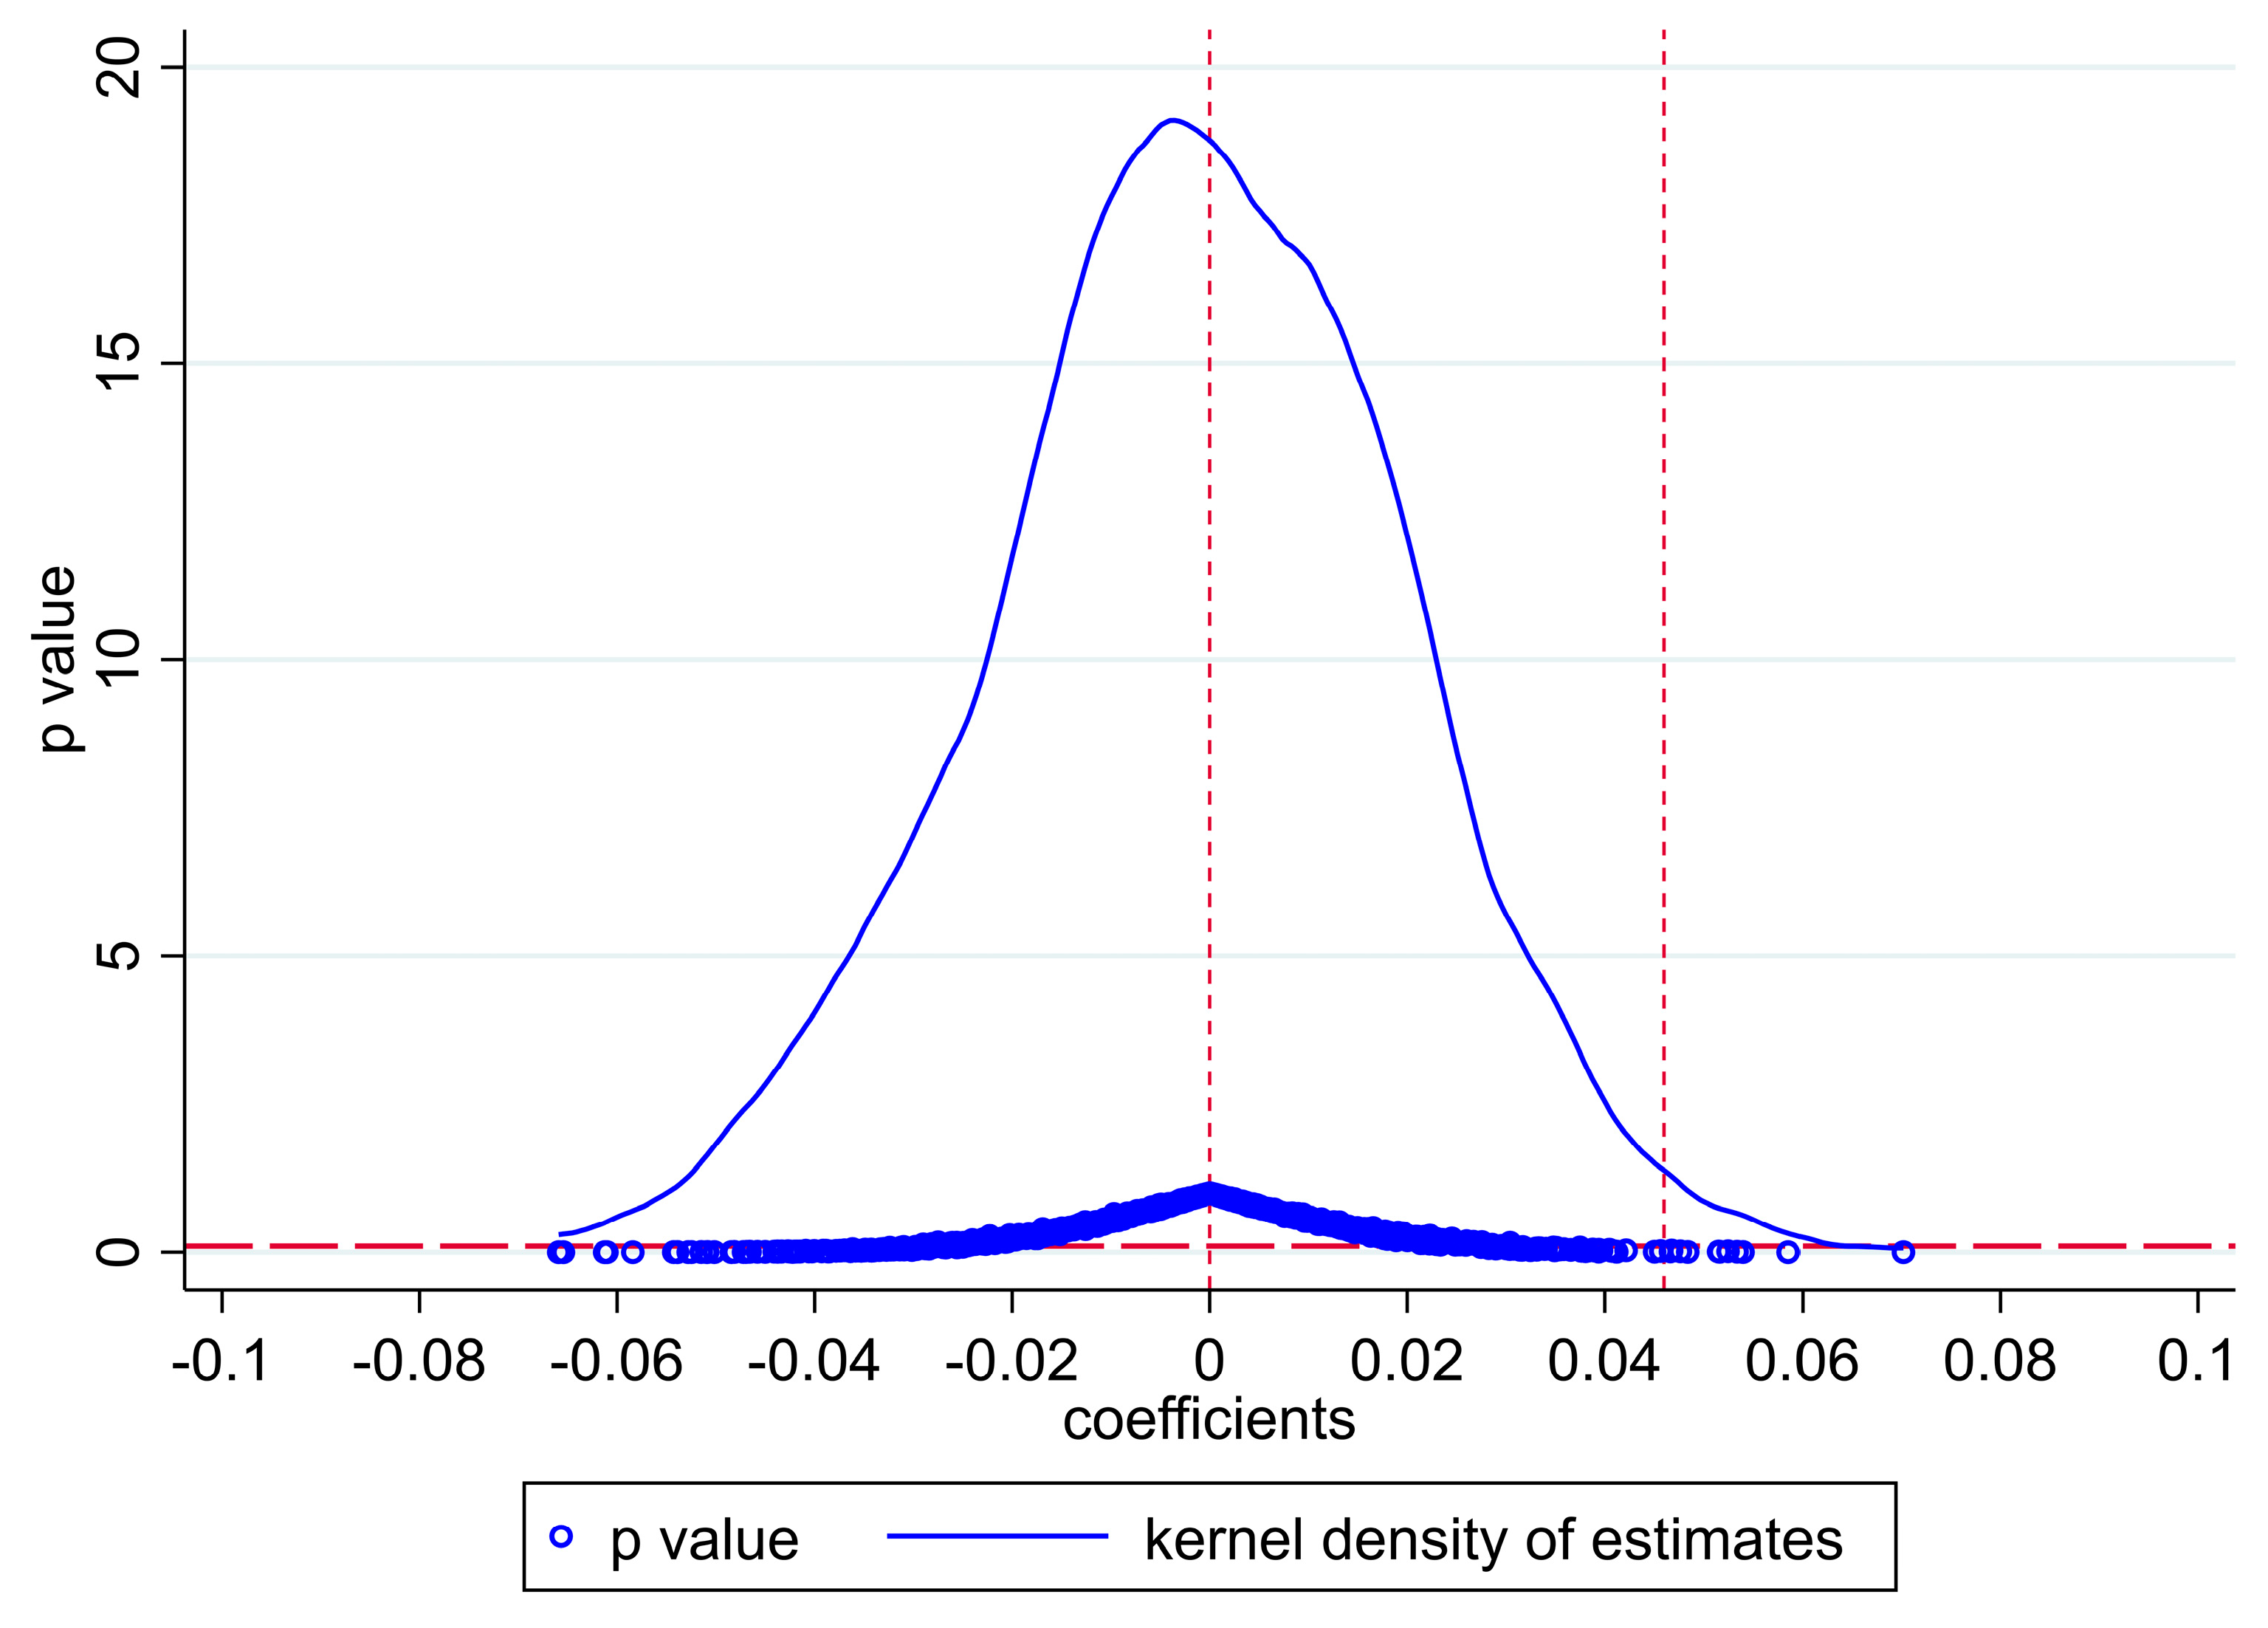
The DID design relies on the parallel trend assumption, such that in the absence of policy intervention, the green innovation behavior of the treatment and control groups would follow a parallel trend [65]. The exogeneity and the only through conditions will be credible only if the treatment and control groups are similar before the shock [86]. Otherwise, our results may be biased. To ensure that the post-policy differences are attributable to the accountability audit pilot, we follow Zhang et al. [65] and Du et al. [41] to construct the following equation to check the pre-policy parallel trend.
TECH _ PROXIMITY i , t , j , c / KNOWN i , t , j , c / UNKNOWN i , j , t , c = a 0 + β 1 BEFORE 2 t + β 2 BEFORE 1 t + β 3 CURRENT t + β 4 AFTER 1 t + β 5 AFTER 2 t + β 6 AFTER 3 t + γ CONTROLS i , t , j , c + u i + λ t + δ j + η c + ε i , t , j , c
where the dummy variables BEFORE2, BEFORE1, CURRENT, AFTER1, AFTER2, and AFTER3 represent the year relative to the implementation year of the accountability audit pilot in city c. Among these, CURRENT represents the policy year and is defined as 1 if t is the policy year; 0 otherwise. BEFORE2, BEFORE1, AFTER1, AFTER2, and AFTER3 represent 2 years before, 1 year before, 1 year after, 2 years after, and 3 years after, respectively, and the definitions are similar to CURRENT. β measures the changes in a firm’s green innovation strategy in year t compared with the benchmark year. The results from the parallel trend test analysis, reported in Table 4 and Figure 2 and Figure 3, reveal that β1 and β2 related to TECH_PROXIMITY (KNOWN) are approximately 0 and not significant. However, after the implementation of the accountability audit pilot, β3 is positive and significant (β = 0.021; p-value < 0.05 or better) and increases sharply. This implies that the treatment and control groups have a parallel trend in green innovation before the treatment. Hence, our sample passes the parallel trend test.

5.3.2. Placebo Test

To further ensure that random factors do not drive the main results, we follow the literature [65,87] to assess the effects of placebo shocks and test whether placebo outcomes predict the actual shock. Specifically, we randomly assign the treatment status of each city based on the actual number of accountability audit pilot cities in each year and then estimate the coefficient of POST. We repeat this process 1000 times to avoid contamination by any rare events. As the falsification treatment status is randomly generated, we expect POST to have no impact on firms’ green innovation strategies. Figure 4 and Figure 5 show the interest coefficient distribution of the 1000 regressions. The non-zero vertical dotted line in Figure 4 represents the coefficient of POST related to TECH_PROXIMITY (β = 0.016) in Table 3, and the non-zero vertical dotted line in Figure 5 represents the coefficient of POST related to KNOWN (β = 0.046) in Table 3. The horizontal dotted line represents the 0.1 significance level. We find that the distribution of estimates from random assignments is centered around 0, and most coefficients are less than 0.016 in Figure 4, and most coefficients are less than 0.046 in Figure 5, suggesting that our outcomes are driven by the policy effect of the accountability audit pilot after excluding unobserved random factors.
This figure plots the discretized p-values of the placebo coefficients. The red dotted line is added for the coefficients based on Equation (2).
Figure 5. Placebo test of KNOWN.
Sustainability 15 02640 g005
This figure plots the discretized p-values of the placebo coefficients. The red dotted line is added for the coefficients based on Equation (2).

5.3.3. PSM Test

Although the DID method can overcome the endogeneity problem to some extent, the large regional differences among cities and the non-random choices of the treatment and control groups may have an impact on our main results. The PSM technique alleviates endogeneity problems, especially functional form misspecification (FFM), by decreasing the reliance on the specification of the relationships among the variables [85,88]. To alleviate concerns that initial bias might be driving our main results, we adopt the PSM method to solve the problems of sample selection bias and heterogeneity. Specifically, we first establish a logit model to calculate the propensity score, and covariates include all control variables. Then, we match the treatment and control groups based on these propensity scores and obtain a feasible control group. Finally, we re-estimate Equation (2). The results are reported in Table 5. We still find a positive and significant (β = 0.016; p-value < 0.01) relationship between POST and TECH_PROXIMITY (KNOWN). Thus, our main results are robust after using the PSM approach.

5.3.4. Entropy Balancing Test

Next, we use entropy balancing, an approach that involves reweighting the control observations [89,90] to address issues related to FFM. Specifically, we use entropy balancing to balance the mean, variance, and skewness of the control variables across the two samples to mitigate significant post-weighting differences in the three moments across the two samples. Then, we use the balanced sample to re-estimate Equation (2). The results are reported in columns (1)–(3) of Table 6, indicating that the coefficients on TECH_PROXIMITY and KNOWN remain positive and significant (β = 0.046; p-value < 0.01). Therefore, our main results remain robust after balancing the distribution of the pre-treatment confounders across the treatment and control groups.

5.3.5. Balanced Panel Regression Test

Some studies [91,92] use balanced panel data to analyze the impact of environmental regulations on innovation activities. To ensure the continuity of data analysis and provide further support, we screen the balanced sample from the total sample and re-estimate Equation (2). Table 7 presents the regression results of the balanced panel data. Our results continue to hold.

5.3.6. Excluding Special Cities

In China, there are four municipalities (cities with the same rank as provinces in China’s administrative system), including Beijing, Shanghai, Chongqing, and Tianjin, that have particularities in many respects [65] and that play important roles in national politics, culture, and the economy. These particular municipalities are more likely to be selected as accountability audit pilot cities than other municipalities, which may result in bias in our estimation of the policy effect. As a robustness test, we eliminate these four municipalities from our sample and re-estimate Equation (2). Table 8 reports the results. Consistent with Table 3, we find that POST is positively and significantly related to TECH_PROXIMITY (KNOWN) (β = 0.027; p-value < 0.01). Thus, our results remain qualitatively the same.

5.3.7. Additional Controls

To address the potential confounding effects of omitted variables bias and provide further support for our main results, we re-estimate Equation (2) after including additional city-level controls that might affect firms’ green innovation strategies. Specifically, our additional city-level variables are based on recent studies [65,67] and include the natural logarithm of GDP per capita (LNGDP _ PC), the natural logarithm of urban population size (LNPOPULATION), the city fiscal deficit (DEFICIT), the marketization index (MKT), the natural logarithm of CO2 emissions (LNCO2), the natural logarithm of industrial wastewater discharges (LNIWW), the natural logarithm of industrial SO2 emissions (LNSO2), and the natural logarithm of industrial smoke and dust emissions (LNISD). After including these additional controls, the results of these analyses, reported in columns (1)–(3) of Table 9, are consistent with our inferences.

5.3.8. Excluding Other Concurrent Policies

Although the results reported above help mitigate concerns that our findings are driven by confounding factors, other environmental protection policies in the same period may have an impact on firms’ green innovation strategies, which may lead to biased estimates. Therefore, we control for other policy dummy variables to address this issue.
China’s most stringent environmental protection law to date, the EPL, came into effect on 1 January 2015 [93]. It is the concurrent policy that we are most concerned may influence our results. Another potential influence is the Carbon Emissions Trading (CET) pilot, which included the seven provinces of Beijing, Tianjin, Shanghai, Chongqing, Hubei, Guangdong (Shenzhen), and Fujian. We add dummy variables to control for the EPL and the CET and estimate the following DID regression model to separate the accountability audit pilot effect from the effects of these other environmental protection policies.
TECH _ PROXIMITY i , t , j , c / KNOWN i , t , j , c / UNKNOWN i , j , t , c = a 0 + β 1 POST t + β 2 POST 2 t × INDU i , t , c + β 3 POST 3 t + γ CONTROLS i , t , j , c + u i + λ t + δ j + η c + ε i , t , j , c
POST2t is a dummy variable reflecting the treatment of the EPL, defined as 1 for 2015 and all subsequent years and 0 otherwise. INDUi,t,c represents heavily polluting industries. We refer to the Guidelines for Environmental Information Disclosure of Listed Companies (Draft for Comments) issued by the Environmental Protection Administration in September 2010 and the Guidelines for Industry Classification of Listed Companies revised by the Chinese Securities Regulatory Commission in 2012 to identify heavily polluting industries. If firm i belongs to a heavily polluting industry, INDUi,t,c equals 1 and 0 otherwise. POST3t is a dummy variable for the pilot policy of the CET, defined as 1 from year t onward if city c, where the company is located, implements the CET program in year t and 0 otherwise. As shown in Table 10, after controlling for other concurrent policy shocks, our results remain robust.

5.4. Further Analyses

5.4.1. Cross-Sectional Tests

To shed further light on the mechanism through which the accountability audit pilot affects firms’ green innovation strategies, we conduct three cross-sectional analyses: (1) we use regional air pollution and environmental concerns to test whether local environmental protection pressures transmit to firms, and thus tip the trade-off between incremental and radical green innovations toward the former rather than the latter; (2) we use the state shareholding ratio and tax preferences to test whether firms with greater government control will choose to implement more incremental green innovation than other firms; and (3) we use analyst coverage and institutional shareholding to test whether firms choose more stable incremental green innovation over radical green innovation when capital market pressure increases.
  • Local environmental protection pressure
First, we test whether our results are driven by local environmental protection pressure. Studies show that green innovation has an inhibitory effect on regional air pollution [21,94]. Green innovation is an important means of competition in environmental protection among different regions. Therefore, in areas with poor air quality, government officials will pay more attention to the role of green innovation in improving air quality, which will further promote firms’ green innovation behavior to “cater to the government” and its preferences. In addition, the decentralized environmental supervision system provides local governments with greater discretion in environmental governance than a more centralized system [95], and different cities attach different degrees of importance to environmental protection. The government work reports, which are the annual work reports of governments at all levels in China, include a summary of the government work that occurred in the previous year and the work plans for the current year. These reports transmit the signal of government development planning and resource allocation to firms, which affect firms’ strategies and resource allocation. The frequency of environment-related words in the report reflects the government’s emphasis on environmental protection [96]. We expect firms in areas with more severe air pollution and greater environmental concerns to apply for more incremental green innovation patents, leading to higher green technology proximity.
To examine whether our expectations are accurate, we test the moderating effects of air pollution and local environmental concerns. AIRi,j,t,c represents the regional air pollution levels, which equal 1 if the city’s PM2.5 concentration (micrograms/cubic meter) where firm i is located is greater than the annual median and 0 otherwise. ECi,j,t,c represents local environmental concerns, which equals 1 if local environmental concern (defined by the frequency of environment-related words in government work reports divided by total word frequency) is above the annual median in year t and 0 otherwise. Table 11 represents the results. The coefficient on POST*AIR is positive and significant in columns (1) and (2), as is the coefficient on (POST*EC) (columns (4) and (5)). Consistent with our expectations, in areas with severe air pollution and strong environmental concerns, firms choose stable green innovation strategies in response to severe environmental regulatory pressure.
b.
Government control over firms
Second, we test whether government control over firms affects firms’ green innovation strategies after the pilot. From the perspective of the government’s ownership over firms, firms with different equity characteristics behave differently when facing environmental supervision [97,98]. SOEs have more policy functions imposed on them than other firms, and their objectives go beyond the pursuit of profits [99]. Therefore, they usually play a more active role in environmental protection than other firms. Conversely, non-SOEs face fierce market competition, and profit is their main purpose. Hence, their green innovation strategies are market-oriented rather than catering to government policies [100]. Government subsidies and tax preferences are the two main measures used by the government to stimulate firm innovation [14,101,102]. Tax preferences tend to be preferred by firms over subsidies because they are more wide-ranging, non-discriminatory, and enable firms to retain their decision-making power [103]. Firms that receive more tax preferences than others are more motivated to comply with the government’s environmental protection policies. Thus, overall, SOEs and firms with more tax preferences apply for more incremental green innovation than other firms.
We use two moderating variables, the state shareholding ratio and tax preferences, to test our assumption. The moderating variable SOEPi,j,t,c captures the proportion of a firm’s state-owned shares and is defined as 1 if firm i’s proportion of state-owned shares is greater than the median and 0 otherwise. TFi,j,t,c represents tax preferences, and it equals 1 if the tax refund received by firm i is greater than the median and 0 otherwise. Columns (1)–(3) of Table 12 report the results for the moderating effect of SOEPi,j,t,c. Columns (1)–(2) show that the relationship between SOEPi,j,t,c and TECH_PROXIMITY (KNOWN) is positive and significant, confirming our assumption that a higher (lower) proportion of state-owned shares leads to a higher (lower) adoption of incremental green innovation strategies by firms. Columns (4)–(6) of Table 12 show that TFi,j,t,c and TECH_PROXIMITY (KNOWN) are positively and significantly correlated, suggesting that the accountability audit pilot plays a more significant role in promoting incremental green innovation for firms with high tax preferences. In summary, the results in Table 12 show that the government’s control over firms strengthens firms’ willingness to engage in incremental green innovation under the effect of the accountability audit pilot.
c.
Capital market performance pressure
Third, as greater information transparency results in more pressure on firms in terms of economic performance, we use analyst coverage and institutional shareholding to test the impact of capital market performance pressure on firms’ green innovation strategies after the commencement of the accountability audit pilot. As a key market intermediary, analysts have an important influence on firms’ behavior and decisions. The uncertainty involved and the level of experience and professionalism required for innovation activities have increased the difficulty of earnings forecasts, leading to obvious gaps between internal and external expectations of firm performance [104]. Analyst coverage improves information transparency, increases firms’ short-term performance pressure, limits or prevents management’s short-sighted behavior, and weakens managers’ willingness to implement innovation activities [105], leading firms to reduce R&D expenses [106], which may impede their investment in radical green innovation projects. In addition, because institutional investors have more information, talent and resource advantages, and more experience than other investors [107], they can influence other potential investors through their investment decisions [108]. The higher the shareholding ratio of institutions, the greater the external performance pressure that firms may face, driving firms to choose low-risk incremental green innovation over high-risk radical green innovation. Overall, greater analyst coverage and institutional shareholding result in firms experiencing greater pressure regarding their capital market performance. To balance environmental and economic performance, firms may be more willing to implement incremental green innovation than radical green innovation.
Given the above analyses, we add analyst coverage (AC) and institution shareholding (ISR) and the interaction terms between POST and AC and between POST and ISR in Equation (2). ACi.j.t.c equals 1 if firm i has high analyst coverage (above the median) and 0 otherwise. ISRi,j,t,c is an indicator variable that equals 1 when a firm’s institutional shareholding ratio is above the median and 0 otherwise. Table 13 reports the results. In columns (1), (2), (4), and (5), the coefficients on POST*AC and POST*ISR are positive and significant, indicating that the effect of the accountability audit pilot on firms’ green innovation strategies is more pronounced for firms with higher analyst coverage and institutional investor shareholding, that is, firms that face greater capital market pressure.

5.4.2. The Impact of the Accountability Audit Pilot on the Allocation of Environmental Protection Investment

According to endogenous growth theory, most green technological progress requires intentional green investment by profit-maximizing firms [109,110]. The literature argues that environmental protection expenditure is closely related to R&D investment [111] and that R&D intensity has a positive impact on the growth of green innovation [112]. Hence, firms are required to implement adequate environmental protection investment to respond properly to increasing environmental needs. However, environmental protection investment remains a “black box” in that it is difficult to determine how firms manage these resources, especially for green innovation, which is often not entirely cost-efficient, and when there are trade-offs among different types of green innovations. As such, an important question is whether an increase in environmental protection investment positively affects firms’ green innovation strategies under the accountability audit pilot. We investigate this research question by constructing the following two equations:
KNOWN i , j , t , c / UNKNOWN i , j , t , c = a 0 + β 1 EPI i , j , t , c + γ CONTROLS i , j , t , c + u i + λ t + δ j + η c + ε i , j , t , c
KNOWN i , j , t , c / UNKNOWN i , j , t , c = a 0 + β 1 EPI i , j , t , c + β 2 EPI i , j , t , c POST t + β 3 POST t + γ CONTROLS i , j , t , c + u i + λ t + δ j + η c + ε i , j , t , c  
where EPIi,j,t,c represents firms’ environmental protection investment (defined as total environmental protection investment divided by total assets). We determine EPI based on firms’ financial statements (e.g., construction in progress, management costs, and other accounts payable) by searching for the keywords “environmental protection”, “waste water”, “waste residue”, “waste gas”, “remove dust”, “energy conservation”, “emission reduction”, “ecological restoration”, “resource compensation”, and similar terms. We estimate Equation (5) to verify the relationship between environmental protection investment and incremental and radical green innovations. Then, we estimate Equation (6) to test the moderating effect of the accountability audit pilot.
Table 14 presents the results. In columns (1) and (3), the positive and significant coefficients on EPI and POST*EPI suggest that environmental protection investment encourages firms to apply green innovation in known fields and that the accountability audit pilot drives environmental protection investment toward green innovation in known fields. Conversely, in column (2), the nonsignificant coefficients on EPI indicate that environmental protection investment does not appear to significantly influence radical green innovation. The negative and significant coefficients on POST*EPI related to UNKNOWN show that the synergy between the accountability audit pilot and environmental protection investment hinders the growth of radical green innovation. These results imply that the accountability audit pilot, as an exogenous shock, highlights the distinctions between incremental and radical green innovations in the allocation of environmental protection investment. Hence, we provide further corroborating evidence on how the accountability audit pilot impacts the allocation of green innovation resources.

5.4.3. Economic Consequences

Our findings so far provide evidence that the accountability audit pilot encourages incremental green innovation. To provide a more nuanced picture of the policy effect of the accountability audit pilot, we analyzed other economic consequences of the accountability audit pilot.
Externalities arising from environmental governance are a widespread topic of concern. As an extension analysis, we investigate whether the accountability audit pilot affects firms’ economic performance. The Porter hypothesis states that firms can obtain “innovation offsets” from properly designed environmental regulations, which not only improve firms’ environmental performance but also partially or completely offset the costs of compliance with environmental regulations and may even lead to firms gaining competitive advantages, thus improving their economic performance [40,113,114]. However, others suggest that strict environmental regulations lead firms to adopt costly pollution control methods, which improve their environmental performance but hinder their economic performance [39,115].
To examine this controversial issue in our context, we change the dependent variable to firms’ economic performance and re-estimate the regression. We use EVAi.j.t.c to represent firms’ economic performance, which is measured as EVA divided by operating income. In column (1) of Table 15, the coefficient on POST is positive and significant (β = 0.046, p-value < 0.1), indicating that the accountability audit pilot enhances firms’ economic performance. Thus, our results support the Porter hypothesis.
Another economic consequence of concern is corporate social responsibility (CSR) disclosure. Studies show that regulatory pressure is one of the factors influencing CSR disclosure [116,117]. Legitimacy theory suggests that firms disclose CSR information based on their legitimacy needs, as well as to protect their reputation [118]. Stakeholder theory considers that CSR disclosure is a management tool that can gain stakeholder recognition [119]. Both theories imply that firms actively disclose CSR information to cater to social legitimacy, present a socially responsible image, improve their reputation, and meet the environmental protection needs of stakeholders in the context of the accountability audit pilot.
We take CSR disclosure as a new dependent variable to test our prediction and re-estimate the model. CSRIDi,j,t,c equals 1 if firm i discloses its social responsibility report in year t and 0 otherwise. Column (2) of Table 15 presents the results. We find that the coefficient on POST is positive and significant at the 1% level (β = 0.019, p-value < 0.01). The coefficient suggests that the accountability audit pilot leads to a 1.9% increase in the probability of firms disclosing social responsibility information.

6. Conclusions and Policy Implications

6.1. Conclusions

As environmental protection has become increasingly important around the world, green innovation has received more and more attention. This paper highlights “ambidextrous innovation” and explores how government audits impact firms’ green innovation strategies. We find a positive and significant relationship between China’s accountability audit pilot and incremental green innovation and green technology proximity; these results still remain based on a series of robustness tests. In addition, these relationships are stronger when local officials face greater environmental pressure, firms are more affected by the government, and firms face greater external pressure for short-term performance. Moreover, we find that the accountability audit pilot further drives environmental protection investment toward incremental green innovation and that it promotes the economic performance of firms and their CSR disclosure.
These results indicate that although the accountability audit pilot encourages incremental green innovation, it leads to an imbalance between incremental and radical green innovations. In addition, pressure from local governments for firms to address environmental protection, government control over firms, and external short-term performance pressure may further aggravate this imbalance. Economic performance and environmental performance are not completely competitive but can achieve win–win results under appropriate environmental regulations. These findings may make people rethink the healthy and sustainable development of green innovation, pay attention to the rational investment of radical green innovation and incremental green innovation, and rethink the relationship between economic performance and environmental performance.

6.2. Policy Implications

To ensure the high-quality development of green innovation, provide a decision-making basis for the formulation of environmental protection policies of the government, provide a new perspective for the healthy development of the capital market, and provide a reference for the micro-decision of enterprises, we propose several policy suggestions. From the perspective of the government, the government should refine the evaluation methods for the performance of local officials’ environmental responsibilities, pay attention to the quality of environmental protection, and scientifically formulate environmental protection incentive policies to avoid the phenomenon of incremental green innovation “squeezing out” radical green innovation. For the capital market, the governance mechanism of the capital market needs to be constantly improved; analysts should increase the time window of firms’ earnings forecasts and consider their long-term development to guide firms to make scientific green innovation decisions. As for the firms, firms should rationally allocate environmental protection investment to achieve a balance between incremental and radical green innovations for short- and long-term effectiveness and the sustainable development of green innovation.

6.3. Research Limitations

Overall, our paper highlights the tensions between incremental and radical green innovations and complements the literature, which, in general, argues that there is a positive effect of environmental regulations on green innovation. Our analyses are subject to several caveats. First, although we realize that there may be an appropriate balance between incremental and radical green innovations, we cannot accurately calculate the optimal proportions of each type of innovation. Second, because our research context is China, our results may not be generalizable to developed countries. Finally, our study does not provide qualitative evidence for firms’ allocation of green innovation resources and the trade-offs between incremental and radical green innovations (e.g., survey or interview-based methods). These limitations offer fruitful avenues for future research.

Author Contributions

Methodology, X.T.; writing—original draft preparation, J.O., X.T. and Q.Y; writing—review and editing, Q.Y.; supervision, X.C.; funding acquisition, X.C. All authors have read and agreed to the published version of the manuscript.

Funding

This research was funded by National Natural Science Foundation of China [71772089, 71932003], Beijing Municipal Social Science Foundation [22JCC093], Jiangsu Postgraduate Scientific Research Innovation Plan [KYCX22_2174], and Project of National Audit Institute of Nanjing Audit University in 2021 [21XSJB03].

Institutional Review Board Statement

Not applicable.

Informed Consent Statement

Not applicable.

Data Availability Statement

Some data were obtained from the Chinese Research Data Services Platform at https://www.cnrds.com/Home/Index#/ and the China Stock Market & Accounting Research Database at https://cn.gtadata.com/. Please contact the corresponding author for other data.

Conflicts of Interest

The authors declare no conflict of interest.

Appendix A

Table A1. Definition of the main variables.
VariableDefinition
TECH_PROXIMITYGreen innovation technology proximity, calculated by formula (1), indicates the extent to which firms’ green innovations are similar or close to existing green innovations
KNOWNIncremental green innovation, calculated as the natural logarithm of incremental green innovation
UNKNOWNRadical green innovation, calculated as the natural logarithm of radical green innovation
SIZEFirm size, calculated as the natural logarithm of total assets
EMENUMFirm size, calculated as the natural logarithm of the number of employees
LEVLeverage ratio, defined as the book value of debt to the book value of total assets
ROAReturn on assets, defined as net profit to net assets at the end of the period
BMBook-to-market ratio, defined as the book value of equity to the market value of equity
GROWTHGrowth rate of total operating revenue, defined as the increase in gross operating income to gross operating income in the previous year
TANGProportion of fixed assets, defined as fixed assets to total assets
INTANGProportion of intangible assets, defined as intangible assets to total assets
FGNSALEProportion of overseas business income, measured as firms’ export ratio over sales in each year
AGEFirm age, calculated as the natural logarithm of firm age
TOPShares held by the largest shareholder, measured as the number of shares held by the largest shareholder to the total number of shares
INDBProportion of independent directors, calculated as the number of independent directors to the total number of directors
SEGNumber of subsidiaries, calculated as the natural logarithm of the number of subsidiaries
LNGDP_PCGDP per capita, calculated as the natural logarithm of the GDP per capita of the city in which the firm is located
LNPOPULATIONPopulation size, calculated as the natural logarithm of the population size of the city in which the firm is located
DEFICITFiscal deficit, measured by the ratio of fiscal income to fiscal expenses of the city in which the firm is located
MKTMarket development, using the Marketization Index of the province in which the firm is located
LNCO2City CO2 emissions, calculated as the natural logarithm of the number of CO2 emissions of the city in which the firm is located
LNIWWIndustrial wastewater discharges, calculated as the natural logarithm of the amount of industrial wastewater of the city in which the firm is located
LNSO2Industrial SO2 emissions, calculated as the natural logarithm of the amount of industrial SO2 emissions of the city in which the firm is located
LNISDIndustrial smoke and dust emissions, calculated as the natural logarithm of the amount of industrial smoke and dust emissions of the city in which the firm is located
AIRRegional air pollution, an indicator variable that equals 1 if the average annual concentration of PM2.5 is above the median and 0 otherwise
GPAGreen production attention, an indicator variable that equals 1 if the frequency of green production-related words divided by total word frequency is above the median and 0 otherwise
SOEPState shareholding ratio, an indicator variable that equals 1 if firm i’s proportion of state-owned shares is above the median and 0 otherwise
TFTax preferences, an indicator variable that equals 1 if the tax refund received by firm i is above the median and 0 otherwise
ACAnalyst coverage, an indicator variable that equals 1 if firm i has high analyst coverage (above the median) and 0 otherwise
ISRInstitutional shareholding ratio, an indicator variable that equals 1 if the fund’s shareholding ratio is above the median and 0 otherwise
EPIEnvironmental protection investment, calculated as total environmental protection investment to total assets
EVAEnterprise economic performance, measured as EVA to operating income
CSRIDCSR disclosure, defined as 1 if firm i discloses its social responsibility report in year t and 0 otherwise

References

  1. Hao, Y.; Deng, Y.X.; Lu, Z.N.; Chen, H. Is environmental regulation effective in China? Evidence from city-level panel data. J. Clean. Prod. 2018, 188, 966–976. [Google Scholar] [CrossRef]
  2. Wang, C.; Wu, J.; Zhang, B. Environmental regulation, emissions, and productivity: Evidence from Chinese COD–emitting manufacturers. J. Environ. Econ. Manag. 2018, 92, 54–73. [Google Scholar] [CrossRef]
  3. Li, H.; Zhou, L. Political turnover, and economic performance: The incentive role of personnel control in China. J. Public. Econ. 2005, 89, 1743–1762. [Google Scholar] [CrossRef]
  4. Guo, R.; Lv, S.; Liao, T.; Xi, F.; Zhang, J.; Zuo, X.; Cao, X.; Feng, Z.; Zhang, Y. Classifying green technologies for sustainable innovation and investment. Resour. Conserv. Recycl. 2020, 153, 104580. [Google Scholar] [CrossRef]
  5. Chen, Y.; Ma, Y. Does green investment improve energy firm performance? Energy Pol. 2021, 153, 112252. [Google Scholar] [CrossRef]
  6. Lin, B.; Ma, R. Green technology innovations, urban innovation environment, and CO2 emission reduction in China: Fresh evidence from a partially linear functional-coefficient panel model. Technol. Forecast. Soc. 2022, 176, 121434. [Google Scholar] [CrossRef]
  7. Long, X.; Chen, Y.; Du, J.; Oh, K.; Han, I. Environmental innovation and its impact on economic and environmental performance: Evidence from Korean–owned firms in China. Energy Pol. 2017, 107, 131–137. [Google Scholar] [CrossRef]
  8. Wang, M.; Li, Y.; Li, J.; Wang, Z. Green process innovation, green product innovation, and its economic performance improvement paths: A survey and structural model. J. Environ. Manag. 2021, 297, 113282. [Google Scholar] [CrossRef]
  9. Yang, X.; He, L.; Xia, Y.; Chen, Y. Effect of government subsidies on renewable energy investments: The threshold effect. Energy Pol. 2019, 132, 156–166. [Google Scholar] [CrossRef]
  10. Seroka-Stolka, O.; Fijorek, K. Enhancing corporate sustainable development: Proactive environmental strategy, stakeholder pressure, and the moderating effect of firm size. Bus. Strat. Env. 2020, 29, 2338–2354. [Google Scholar] [CrossRef]
  11. Sharma, S.; Prakash, G.; Kumar, A.; Mussada, E.K.; Antony, J.; Luthra, S. Analyzing the relationship of adaption of green culture, innovation, green performance for achieving sustainability: Mediating role of employee commitment. J. Clean. Prod. 2021, 303, 127039. [Google Scholar] [CrossRef]
  12. March, J. Exploration and exploitation in organizational learning. Organ. Sci. 1991, 2, 71–87. [Google Scholar] [CrossRef]
  13. Ma, X.; Shahbaz, M.; Song, M. Off–office audit of natural resource assets and water pollution: A quasi–natural experiment in China. J. Enterp. Inf. Manag. 2022. ahead-of-print. [Google Scholar] [CrossRef]
  14. Xu, J.; Hong, J.; Zhou, Z. Local attention to environment and green innovation: Evidence from listed manufacturing companies in 120 cities in China. Emerg. Mark. Financ. Trade. 2022. ahead-of-print. [Google Scholar] [CrossRef]
  15. Cao, H.; Zhang, L.; Yu, Q.; Yang, Z.; Li, X. Government auditing and environmental governance: Evidence from China’s auditing system reform. Environ. Impact Assess. Rev. 2022, 93, 106705. [Google Scholar] [CrossRef]
  16. Feng, Y.; Wang, X.; Liang, Z. How does environmental information disclosure affect economic development and haze pollution in Chinese cities? The mediating role of green technology innovation. Sci. Total Environ. 2021, 775, 145811. [Google Scholar] [CrossRef]
  17. Liu, Y.; She, Y.; Liu, S.; Tang, H. Can the leading officials’ accountability audit of natural resources policy stimulate Chinese heavy-polluting enterprises’ green behavior? Environ. Sci. Pollut. Control Ser. 2022, 29, 47772–47799. [Google Scholar] [CrossRef] [PubMed]
  18. Zeng, H.; Li, X.; Zhou, Q.; Wang, L. Local government environmental regulatory pressures and corporate environmental strategies: Evidence from natural resource accountability audits in China. Bus. Strat. Env. 2022. ahead-of-print. [Google Scholar] [CrossRef]
  19. Huang, J.; Li, Y. Green innovation and performance: The view of organizational capability and social reciprocity. J. Bus. Ethics. 2017, 145, 309–324. [Google Scholar] [CrossRef]
  20. Zhang, S.; Yu, Y.; Zhu, Q.; Qiu, C.; Tian, A. Green innovation mode under carbon tax and innovation subsidy: An evolutionary game analysis for portfolio policies. Sustainability 2020, 12, 1385. [Google Scholar] [CrossRef] [Green Version]
  21. Wang, D.; Zhang, Z.; Shi, R. Fiscal decentralization, green technology innovation, and regional air pollution in China: An investigation from the perspective of intergovernmental competition. Int. J. Environ. Res. Public Health 2022, 19, 8456. [Google Scholar] [CrossRef] [PubMed]
  22. Beerepoot, M.; Beerepoot, N. Government regulation as an impetus for innovation: Evidence from energy performance regulation in the Dutch residential building sector. Energy Pol. 2007, 35, 4812–4825. [Google Scholar] [CrossRef]
  23. Beck, M.; Lopes-Bento, C.; Schenker-Wicki, A. Radical or incremental: Where does R&D policy hit? Res. Policy 2016, 45, 869–883. [Google Scholar] [CrossRef]
  24. Forés, B.; Camisón, C. Does incremental and radical innovation performance depend on different types of knowledge accumulation capabilities and organizational size? J. Bus. Res. 2016, 69, 831–848. [Google Scholar] [CrossRef]
  25. Foucart, R.; Li, Q. The role of technology standards in product innovation: Theory and evidence from UK manufacturing firms. Res. Policy 2021, 50, 104157. [Google Scholar] [CrossRef]
  26. Freixanet, J.; Rialp, J. Disentangling the relationship between internationalization, incremental and radical innovation, and firm performance. Glob. Strateg. J. 2021, 12, 57–81. [Google Scholar] [CrossRef]
  27. Ismail, M.; Bello-Pintado, A.; Garcia-Marco, T. How many to be different? The role of number and the partner type on innovation performance. Innov-Organ. Manag. 2022. ahead-of-print. [Google Scholar] [CrossRef]
  28. Shu, C.; Zhou, K.; Xiao, Y. How green management influences product innovation in China: The role of institutional benefits. J. Bus. Ethics. 2016, 133, 471–485. [Google Scholar] [CrossRef]
  29. Byun, S.K.; Oh, J.M.; Xia, H. Incremental vs. breakthrough innovation: The role of technology spillovers. Manag. Sci. 2021, 67, 1779–1802. [Google Scholar] [CrossRef]
  30. Feng, Y.; Wang, X.; Du, W.; Wu, H.; Wang, J. Effects of environmental regulation and FDI on urban innovation in China: A spatial Durbin econometric analysis. J. Clean. Prod. 2019, 235, 210–224. [Google Scholar] [CrossRef]
  31. Wang, C.; Qi, T.; Lin, S. A Summary of the research on natural resource assets departure audit on leading cadres. IOP Conf. Ser. Earth Environ. Sci. 2020, 555, 012096. [Google Scholar] [CrossRef]
  32. Yan, B.; Wu, L.; Wang, X.; Wu, J. How can environmental intervention work during rapid urbanization? Examining the moderating effect of environmental performance–based accountability in China. Environ. Impact Assess. Rev. 2021, 86, 106476. [Google Scholar] [CrossRef]
  33. Xie, R.; Yuan, Y.; Huang, J. Different types of environmental regulations and heterogeneous influence on “green” productivity: Evidence from China. Ecol. Econ. 2017, 132, 104–112. [Google Scholar] [CrossRef]
  34. Patriarca, R.; Di Gravio, G.; Costantino, F.; Tronci, M. The functional resonance analysis method for a systemic risk based environmental auditing in a sinter plant: A semi-quantitative approach. Ecol. Econ. 2017, 63, 72–86. [Google Scholar] [CrossRef]
  35. Xiong, H.; Li, Y.; He, J. Construction and Application of the Evaluation System of Natural Resources Asset Accountability Audit of Officials: A Case Study of Jiangxi, China. Sustainability 2022, 14, 528. [Google Scholar] [CrossRef]
  36. Liao, X.; Shi, X. Public appeal, environmental regulation, and green investment: Evidence from China. Energy Pol. 2018, 119, 554–562. [Google Scholar] [CrossRef]
  37. Yang, L.; Qin, H.; Gan, Q.; Su, J. Internal control quality, enterprise environmental protection investment, and finance performance: An empirical study of China’s A-share heavy pollution industry. Int. J. Environ. Res. Public Health 2020, 17, 6082. [Google Scholar] [CrossRef]
  38. Palmer, K.; Oates, W.E.; Portney, P.R. Tightening environmental standards: The benefit–cost or the no–cost paradigm? J. Econ. Perspect. 1995, 9, 119–132. [Google Scholar] [CrossRef]
  39. Porter, M.E.; van der Linde, C. Toward a new conception of the environment competitiveness relationship. J. Econ. Perspect. 1995, 9, 97–118. [Google Scholar] [CrossRef]
  40. Jaffe, A.B.; Palmer, K. Environmental regulation and innovation: A panel data study. Rev. Econ. Stat. 1997, 79, 610–619. [Google Scholar] [CrossRef]
  41. Du, L.; Lin, W.; Du, J.; Jin, M.; Fan, M. Can vertical environmental regulation induce enterprise green innovation? A new perspective from automatic air quality monitoring station in China. J. Environ. Manag. 2022, 317, 115349. [Google Scholar] [CrossRef] [PubMed]
  42. Du, K.; Cheng, Y.; Yao, X. Environmental regulation, green technology innovation, and industrial structure upgrading: The road to the green transformation of Chinese cities. Energy Econ. 2021, 98, 105247. [Google Scholar] [CrossRef]
  43. Huang, C.; Wang, Q.; Wang, S.; Ren, M.; Ma, R.; He, Y. Air pollution Prevention and control policy in China. Adv. Exp. Med. Biol. 2017, 1017, 243–261. [Google Scholar] [CrossRef] [PubMed]
  44. Li, D.; Zheng, M.; Cao, C.; Chen, X.; Ren, S.; Huang, M. The impact of legitimacy pressure and corporate profitability on green innovation: Evidence from China top 100. J. Clean. Prod. 2017, 141, 41–49. [Google Scholar] [CrossRef]
  45. Xie, X.; Huo, J.; Zou, H. Green process innovation, green product innovation, and corporate financial performance: A content analysis method. J. Bus. Res. 2019, 101, 697–706. [Google Scholar] [CrossRef]
  46. Balsmeier, B.; Fleming, L.; Manso, G. Independent boards and innovation. J. Financ. Econ. 2017, 123, 536–557. [Google Scholar] [CrossRef]
  47. Gao, H.; Hsu, P.H.; Li, K. Innovation strategy of private firms. J. Financ. Quant. Anal. 2018, 53, 1–32. [Google Scholar] [CrossRef]
  48. Chen, X.; Zhang, J.; Zeng, H. Is corporate environmental responsibility synergistic with governmental environmental responsibility? Evidence from China. Bus. Strat. Env. 2020, 29, 3669–3686. [Google Scholar] [CrossRef]
  49. Zhang, Y.; Wang, J.; Xue, Y.; Yang, J. Impact of environmental regulations on green technological innovative behavior: An empirical study in China. J. Clean. Prod. 2018, 188, 763–773. [Google Scholar] [CrossRef]
  50. Zhang, Y.; Peng, Y.; Ma, C.; Shen, B. Can environmental innovation facilitate carbon emissions reduction? Evidence from China. Energy Pol. 2017, 100, 18–28. [Google Scholar] [CrossRef]
  51. Xu, H.; Qiu, L.; Liu, B.; Liu, B.; Wang, H.; Lin, W. Does regional planning policy of Yangtze River Delta improve green technology innovation? Evidence from a quasi–natural experiment in China. Environ. Sci. Pollut. Control Ser. 2021, 28, 62321–62337. [Google Scholar] [CrossRef] [PubMed]
  52. González-Benito, J.; González-Benito, Ó. A study of determinant factors of stakeholder environmental pressure perceived by industrial companies. Bus. Strat. Env. 2010, 19, 164–181. [Google Scholar] [CrossRef]
  53. Hart, S.L. A Natural-Resource-Based View of the Firm. Acad. Manag. Rev. 1995, 20, 986–1014. [Google Scholar] [CrossRef]
  54. Du, X.; Chang, Y.; Zeng, Q.; Du, Y.; Pei, H. Corporate environmental responsibility (CER) weakness, media coverage, and corporate philanthropy: Evidence from China. Asia. Pac. J. Manag. 2016, 33, 551–581. [Google Scholar] [CrossRef]
  55. Issa, J.S.; Abbaszadeh, M.R.; Salehi, M. The Impact of Islamic Banking Corporate Governance on Green Banking. Adm. Sci. 2022, 12, 190. [Google Scholar] [CrossRef]
  56. Lee, J.W.; Kim, Y.M.; Kim, Y.E. Antecedents of adopting corporate environmental responsibility and green practices. J. Bus. Ethics. 2018, 148, 397–409. [Google Scholar] [CrossRef]
  57. Zhao, X.; Yin, H.; Zhao, Y. Impact of environmental regulations on the efficiency and CO2 emissions of power plants in China. Appl. Energy 2015, 149, 238–247. [Google Scholar] [CrossRef]
  58. Kang, Y.; He, X. Institutional forces and environmental management strategy: Moderating effects of environmental orientation and innovation capability. Manag. Organ. Rev. 2018, 14, 577–605. [Google Scholar] [CrossRef]
  59. Testa, F.; Iraldo, F.; Frey, M. The effect of environmental regulation on firms’ competitive performance: The case of the building and construction sector in some EU regions. J. Environ. Manag. 2011, 92, 2136–2144. [Google Scholar] [CrossRef]
  60. Sun, H.; Edziah, B.K.; Sun, C.; Kporsu, A.K. Institutional quality, green innovation, and energy efficiency. Energy Pol. 2019, 135, 111002. [Google Scholar] [CrossRef]
  61. Howell, S.T. Financing innovation: Evidence from R&D grants. Am. Econ. Rev. 2017, 107, 1136–1164. [Google Scholar] [CrossRef]
  62. Li, X.; Shao, X.; Chang, T.; Albu, L.L. Does digital finance promote the green innovation of China’s listed companies? Energy Econ. 2022, 114, 106254. [Google Scholar] [CrossRef]
  63. Wang, F.; Feng, L.; Wang, L. Environmental regulation, tenure length of officials, and green innovation of enterprises. Int. J. Environ. Res. Public Health 2020, 17, 2284. [Google Scholar] [CrossRef] [PubMed]
  64. Hart, S.L.; Ahuja, G. Does it pay to be green? An empirical examination of the relationship between emission reduction and firm performance. Bus. Strat. Environ. 1996, 5, 30–37. [Google Scholar] [CrossRef]
  65. Zhang, S.; Zhang, M.A.; Qiao, Y.; Li, X.; Li, S. Does improvement of environmental information transparency boost firms’ green innovation? Evidence from the air quality monitoring and disclosure program in China. J. Clean. Prod. 2022, 357, 131921. [Google Scholar] [CrossRef]
  66. Dai, J.; Cui, J.; Zhao, X. Does environmental regulation induce green innovation? Evidence from Chinese listed firms. Acad. Manag. Ann. 2020, 1, 12378. [Google Scholar] [CrossRef]
  67. Qi, G.; Jia, Y.; Zou, H. Is institutional pressure the mother of green innovation? Examining the moderating effect of absorptive capacity. J. Clean. Prod. 2021, 278, 123957. [Google Scholar] [CrossRef]
  68. Bendig, D.; Kleine-Stegemann, L.; Schulz, C.; Eckardt, D. The effect of green startup investments on incumbents’ green innovation output. J. Clean. Prod. 2022, 376, 134316. [Google Scholar] [CrossRef]
  69. Chen, Y.; Yao, Z.; Zhong, K. Do environmental regulations of carbon emissions and air pollution foster green technology innovation: Evidence from China’s prefecture-level cities. J. Clean. Prod. 2022, 350, 131537. [Google Scholar] [CrossRef]
  70. Cheng, C.; Li, S.; Liu, S.; Zhang, S. Origin matters: The institution imprint effect and green innovation in family businesses. Financ. Res. Lett. 2022, 50, 103324. [Google Scholar] [CrossRef]
  71. Sun, Y.; Razzaq, A.; Sun, H.; Irfan, M. The asymmetric influence of renewable energy and green innovation on carbon neutrality in China: Analysis from nonlinear ARDL model. Renew. Energy 2022, 193, 334–343. [Google Scholar] [CrossRef]
  72. Belderbos, R.; Faems, D.; Leten, B.; Looy, B.V. Technological activities and their impact on the financial performance of the firm: Exploitation and exploration within and between firms. J. Prod. Innovat. Manag. 2010, 27, 869–882. [Google Scholar] [CrossRef]
  73. Wagner, M. On the relationship between environmental management, environmental innovation and patenting: Evidence from German manufacturing firms. Res. Policy 2007, 36, 1587–1602. [Google Scholar] [CrossRef]
  74. Chen, L.; Liu, S.; Liu, X.; Wang, J. The carbon emissions trading scheme and corporate environmental investments: A Quasinatural experiment from China. Emerg. Mark. Financ. Trade 2022, 58, 2670–2681. [Google Scholar] [CrossRef]
  75. Santoro, G.; Bresciani, S.; Papa, A. Collaborative modes with cultural and creative industries and innovation performance: The moderating role of heterogeneous sources of knowledge and absorptive capacity. Technova 2020, 92, 102040. [Google Scholar] [CrossRef]
  76. Huang, L.; Wang, C.; Chin, T.; Huang, J.; Cheng, X. Technological knowledge coupling and green innovation in manufacturing firms: Moderating roles of mimetic pressure and environmental identity. Int. J. Prod. Econ. 2022, 248, 108482. [Google Scholar] [CrossRef]
  77. Frondel, M.; Horbach, J.; Rennings, K. End–of–pipe or cleaner production? An empirical comparison of environmental innovation decisions across OECD countries. Bus. Strat. Environ. 2007, 16, 571–584. [Google Scholar] [CrossRef]
  78. Kock, C.J.; Santalo, J.; Diestre, L. Corporate governance and the environment: What type of governance creates greener companies? J. Manag. Stud. 2012, 49, 492–514. [Google Scholar] [CrossRef]
  79. Wolf, J. The relationship between sustainable supply chain management, stakeholder pressure, and corporate sustainability performance. J. Bus. Ethics 2014, 119, 317–328. [Google Scholar] [CrossRef]
  80. Li, Z.; Si, X.; Zhang, W.; Feng, Z.; Li, T.; Guo, Y. Official tenure and governance effectiveness of China’s basic pension insurance system: An inverted U–shaped curve. Front. Public Health 2022, 10, 975459. [Google Scholar] [CrossRef]
  81. Deng, Z.; Hofman, P.S.; Newman, A. Ownership concentration and product innovation in Chinese private SMEs. Asia Pac. J. Manag. 2013, 30, 717–734. [Google Scholar] [CrossRef]
  82. De Marchi, V.; Cainelli, G.; Grandinetti, R. Multinational subsidiaries and green innovation. Int. Bus. Rev. 2022, 31, 102027. [Google Scholar] [CrossRef]
  83. He, F.; Yan, Y.; Hao, J.; Wu, J.G. Retail investor attention and corporate green innovation: Evidence from China. Energy Econ. 2022, 115, 106308. [Google Scholar] [CrossRef]
  84. Usman, M.; Javed, M.; Yin, J. Board internationalization and green innovation. Econ. Lett. 2020, 197, 109625. [Google Scholar] [CrossRef] [PubMed]
  85. Shipman, J.E.; Swanquist, Q.T.; Whited, R.L. Propensity score matching in accounting research. Account. Rev. 2017, 92, 213–244. [Google Scholar] [CrossRef]
  86. Atanasov, V.; Black, B. The trouble with instruments: The need for pretreatment balance in shock–based instrumental Variables designs. Manag. Sci. 2021, 67, 1270–1302. [Google Scholar] [CrossRef]
  87. Hong, Q.; Cui, L.; Hong, P. The impact of carbon emissions trading on energy efficiency: Evidence from quasi–experiment in China’s carbon emissions trading pilot. Energy Econ. 2022, 110, 106025. [Google Scholar] [CrossRef]
  88. Rosenbaum, P.R.; Rubin, D.B. The central role of the propensity score in observational studies for causal effects. Biometrika 1983, 70, 41–55. [Google Scholar] [CrossRef]
  89. Hainmueller, J. Entropy balancing for causal effects: A multivariate reweighting method to produce balanced samples in observational studies. Polit. Anal. 2012, 20, 25–46. [Google Scholar] [CrossRef]
  90. McMullin, J.; Schonberger, B. When good balance goes bad: A discussion of common pitfalls when using entropy balancing. J. Financ. Rep. 2022, 7, 167–196. [Google Scholar] [CrossRef]
  91. Zhu, Y.; Sun, Z.; Zhang, S.; Wang, X. Economic policy uncertainty, environmental regulation, and green innovation—An empirical study based on Chinese high-tech enterprises. Int. J. Environ. Res. Public Health 2021, 18, 9503. [Google Scholar] [CrossRef] [PubMed]
  92. Xia, L.; Gao, S.; Wei, J.; Ding, Q. Government subsidy and corporate green innovation—Does board governance play a role? Energy Pol. 2022, 161, 112720. [Google Scholar] [CrossRef]
  93. Fang, Z.; Kong, X.; Sensoy, A.; Cui, X.; Cheng, F. Government’s awareness of environmental protection and corporate green innovation: A natural experiment from the new environmental protection law in China. Econ. Anal. Policy 2021, 70, 294–312. [Google Scholar] [CrossRef]
  94. Chen, F.; Wang, M.; Pu, Z. The impact of technological innovation on air pollution: Firm–level evidence from China. Technol. Forecast. Soc. 2022, 177, 121521. [Google Scholar] [CrossRef]
  95. Wu, H.; Li, Y.; Hao, Y.; Ren, S.; Zhang, P. Environmental decentralization, local government competition, and regional green development: Evidence from China. Sci. Total Environ. 2020, 708, 135085. [Google Scholar] [CrossRef] [PubMed]
  96. Chen, Z.; Kahn, M.E.; Liu, Y.; Wang, Z. The consequences of spatially differentiated water pollution regulation in China. J. Environ. Econ. Manag. 2018, 88, 468–485. [Google Scholar] [CrossRef]
  97. Wu, H.; Guo, H.; Zhang, B.; Bu, M. Westward movement of new polluting firms in China: Pollution reduction mandates and location choice. J. Comp. Econ. 2017, 45, 119–138. [Google Scholar] [CrossRef]
  98. Kao, W.C. Innovation quality of firms with the research and development tax credit. Rev. Quant. Financ. ACC 2018, 51, 43–78. [Google Scholar] [CrossRef]
  99. Liu, M.; Li, Y. Environmental regulation and green innovation: Evidence from China’s carbon emissions trading policy. Financ. Res. Lett. 2022, 48, 103051. [Google Scholar] [CrossRef]
  100. Hu, J.; Pan, X.; Huang, Q. Quantity or quality? The impacts of environmental regulation on firms’ innovation—Quasi–natural experiment based on China’s carbon emissions trading pilot. Technol. Forecast. Soc. 2020, 158, 120122. [Google Scholar] [CrossRef]
  101. Guceri, I. Will the real R&D employees please stand up? Effects of tax breaks on firm–level outcomes. Int. Tax. Public Financ. 2018, 25, 1–63. [Google Scholar] [CrossRef]
  102. Guo, Y.; Xia, X.; Zhang, S.; Zhang, D. Environmental regulation, government R&D funding, and green technology innovation: Evidence from China provincial data. Sustainability 2018, 10, 940. [Google Scholar] [CrossRef]
  103. Huang, Z. Whether tax preference promotes innovation in enterprises? Mod. Econ. 2019, 10, 371. [Google Scholar] [CrossRef]
  104. He, J.; Tian, X. Do Short Sellers Exacerbate or Mitigate Managerial Myopia? Evidence from Patenting Activities; University of Georgia work: Athens, GA, USA, 2016. [Google Scholar] [CrossRef]
  105. He, J.J.; Tian, X. The dark side of analyst coverage: The case of innovation. J. Financ. Econ. 2013, 109, 856–878. [Google Scholar] [CrossRef]
  106. Guo, B.; Pérez-Castrillo, D.; Toldrà-Simats, A. Firms’ innovation strategy under the shadow of analyst coverage. J. Financ. Econ. 2019, 131, 456–483. [Google Scholar] [CrossRef]
  107. Li, D.; Shen, W. Can corporate digitalization promote green innovation? The moderating roles of internal control and institutional ownership. Sustainability 2021, 13, 13983. [Google Scholar] [CrossRef]
  108. Belev, B. Institutional investors in Bulgarian corporate governance reform: Obstacles or facilitators? J. World. Bus. 2003, 38, 361–374. [Google Scholar] [CrossRef]
  109. Romer, P.M. Endogenous technological change. J. Polit. Econ. 1990, 98, S71–S102. [Google Scholar] [CrossRef]
  110. Romer, P.M. Increasing returns and long-run growth. J. Polit. Econ. 1986, 94, 1002–1037. [Google Scholar] [CrossRef] [Green Version]
  111. Kim, T.H.; Kim, B. Firm’s environmental expenditure, R&D intensity, and profitability. Sustainability 2018, 10, 2071. [Google Scholar] [CrossRef]
  112. Triguero, Á.; Cuerva, M.C.; Álvarez-Aledo, C. Environmental innovation and employment: Drivers and synergies. Sustainability 2017, 9, 2057. [Google Scholar] [CrossRef]
  113. Ramanathan, R.; He, Q.; Black, A.; Ghobadian, A.; Gallear, D. Environmental regulations, innovation and firm performance: A revisit of the Porter hypothesis. J. Clean. Prod. 2017, 155, 79–92. [Google Scholar] [CrossRef]
  114. Ramanathan, R.; Ramanathan, U.; Bentley, Y. The debate on flexibility of environmental regulations, innovation capabilities, and financial performance—A novel use of DEA. Omega 2018, 75, 131–138. [Google Scholar] [CrossRef]
  115. Filbeck, G.; Gorman, R.F. The relationship between the environmental and financial performance of public utilities. Environ. Resour. Econ. 2004, 29, 137–157. [Google Scholar] [CrossRef]
  116. Sun, W.; Zhao, C.; Wang, Y.; Cho, C.H. Corporate social responsibility disclosure and catering to investor sentiment in China. Manag. Decis. 2018, 56, 1917–1935. [Google Scholar] [CrossRef]
  117. Ali, W.; Wilson, J.; Husnain, M. Determinants/motivations of corporate social responsibility disclosure in developing economies: A survey of the extant literature. Sustainability 2022, 14, 3474. [Google Scholar] [CrossRef]
  118. Garde Sánchez, R.; Rodríguez Bolívar, M.P.; López Hernández, A.M. Corporate and managerial characteristics as drivers of social responsibility disclosure by state–owned enterprises. Rev. Manag. Sci. 2017, 11, 633–659. [Google Scholar] [CrossRef]
  119. Hussainey, K.; Achek, I. The effect of national culture on the association between profitability and corporate social and environmental disclosure: A meta–analysis. Meditari. Account. Res. 2015, 23, 296–321. [Google Scholar] [CrossRef] [Green Version]
Figure 1. The distribution of officials’ off-office accountability audit of natural resource assets pilot cities.
Sustainability 15 02640 g001
Figure 2. Parallel trend test of TECH_PROXIMITY.
Sustainability 15 02640 g002
Figure 3. Parallel trend test of KNOWN.
Sustainability 15 02640 g003
Figure 4. Placebo test of TECH_PROXIMITY.
Sustainability 15 02640 g004
Table 1. Sample selection.
Initial Sample of A-Share Listed Firms, 2010–2017 21,366
Observations from ST/PT firms(985)
Observations from financial and insurance firms(389)
Observations from cross-listed firms(1166)
Observations with missing data for the control variables in the main test(2037)
Final sample 16,789
Table 2. Descriptive statistics.
VariableSample SizeMeanStandard DeviationMinimum Value25thMaximum Value75thMax
TECH_
PROXIMITY
16,7890.0680.2310.0000.0000.0000.0001.040
KNOWN16,7890.2150.6480.0000.0000.0000.0003.296
UNKNOWN16,7890.1560.4550.0000.0000.0000.0002.197
SIZE16,78922.0081.16619.72221.15721.87722.71725.401
LEV16,7890.5720.2120.1030.4080.5800.7450.952
ROA16,7890.0390.050−0.1550.0140.0360.0650.187
BM16,7890.5740.2330.1100.3930.5710.7531.061
GROWTH16,7890.2120.476−0.542−0.0090.1260.3023.133
TANG16,7890.2200.1640.0020.0930.1860.3140.709
INTANG16,7890.0460.0490.0000.0160.0340.0580.304
EMENUM16,7897.5701.2134.2906.7787.5418.36810.636
AGE16,7892.7730.3491.6092.5652.8332.9963.401
FGNSALE16,7890.1200.2020.0000.0000.0090.1570.875
TOP16,7890.3500.1510.0880.2310.3300.4520.750
INDB16,7890.3730.0530.3330.3330.3330.4290.571
SEG16,7890.0210.0120.0000.0160.0230.0290.048
Table 3. Baseline regression results.
(1)(2)(3)
VariableTECH_PROXIMITYKNOWNUNKNOWN
POST0.016 ***0.046 ***−0.006
(2.59)(2.95)(−0.46)
SIZE0.019 ***0.070 ***0.051 ***
(2.76)(3.69)(3.23)
LEV−0.025−0.0700.005
(−1.32)(−1.44)(0.12)
ROA0.020−0.0280.164
(0.44)(−0.25)(1.48)
BM0.0180.0210.007
(1.11)(0.53)(0.18)
GROWTH−0.009 ***−0.032 ***−0.016 **
(−3.17)(−4.47)(−2.26)
TANG0.0050.1000.011
(0.23)(1.59)(0.20)
INTANG0.0600.153−0.254 *
(0.84)(0.93)(−1.70)
EMENUM0.0070.0170.011
(1.60)(1.55)(1.25)
AGE0.0250.156−0.009
(0.62)(1.37)(−0.11)
FGNSALE0.0240.037−0.095 *
(1.06)(0.67)(−1.95)
TOP−0.009−0.136−0.039
(−0.28)(−1.55)(−0.56)
INDB0.0470.0220.087
(0.86)(0.16)(0.73)
SEG0.019−0.163−1.106 *
(0.07)(−0.22)(−1.80)
Constant−0.502 ***−1.857 ***−1.006 ***
(−2.94)(−4.03)(−2.66)
FirmFEYesYesYes
InduFEYesYesYes
YearFEYesYesYes
CityFEYesYesYes
N16,78916,78916,789
Adj. R20.4780.5960.137
Note: ***, **, and * indicate statistical significance at the 1%, 5%, and 10% levels, respectively.
Table 4. Parallel trend test.
(1)(2)(3)
VariableTECH_PROXIMITYKNOWNUNKNOWN
BEFORE2−0.0060.010−0.004
(−0.98)(0.74)(−0.30)
BEFORE10.0050.0290.002
(0.71)(1.60)(0.11)
CURRENT0.021 **0.074 ***−0.005
(2.44)(3.33)(−0.24)
AFTER10.021 **0.071 ***−0.010
(2.03)(2.60)(−0.45)
AFTER20.0220.098 ***0.032
(1.61)(2.74)(1.00)
AFTER30.0220.154 **−0.007
(0.95)(2.24)(−0.14)
SIZE0.019 ***0.069 ***0.050 ***
(2.74)(3.63)(3.20)
LEV−0.025−0.0710.005
(−1.32)(−1.47)(0.13)
ROA0.020−0.0240.165
(0.45)(−0.22)(1.49)
BM0.0180.0220.006
(1.09)(0.53)(0.16)
GROWTH−0.009 ***−0.031 ***−0.015 **
(−3.16)(−4.39)(−2.15)
TANG0.0060.1030.012
(0.25)(1.64)(0.21)
INTANG0.0580.152−0.258 *
(0.81)(0.92)(−1.74)
EMENUM0.0070.0170.011
(1.59)(1.53)(1.24)
AGE0.0280.170−0.007
(0.67)(1.49)(−0.08)
FGNSALE0.0230.034−0.096 *
(1.03)(0.61)(−1.95)
TOP−0.009−0.134−0.040
(−0.26)(−1.53)(−0.56)
INDB0.0490.0290.087
(0.90)(0.21)(0.74)
SEG0.018−0.149−1.092 *
(0.07)(−0.20)(−1.77)
Constant−0.509 ***−1.890 ***−1.001 ***
(−2.97)(−4.09)(−2.65)
FirmFEYesYesYes
InduFEYesYesYes
YearFEYesYesYes
CityFEYesYesYes
N16,78916,78916,789
Adj. R20.4780.5960.137
Note: ***, **, and * indicate statistical significance at the 1%, 5%, and 10% levels, respectively.
Table 5. Propensity score matching test.
(1)(2)(3)
VariableTECH_PROXIMITYKNOWNUNKNOWN
POST0.016 ***0.047 ***−0.006
(2.59)(2.99)(−0.46)
SIZE0.020 ***0.071 ***0.051 ***
(2.77)(3.71)(3.23)
LEV−0.025−0.0690.005
(−1.31)(−1.41)(0.13)
ROA0.020−0.0320.165
(0.44)(−0.29)(1.49)
BM0.0180.0200.007
(1.12)(0.49)(0.19)
GROWTH−0.009 ***−0.032 ***−0.016 **
(−3.19)(−4.48)(−2.27)
TANG0.0050.1000.011
(0.23)(1.58)(0.20)
INTANG0.0600.153−0.254 *
(0.84)(0.93)(−1.70)
EMENUM0.0070.0170.012
(1.58)(1.54)(1.25)
AGE0.0250.155−0.011
(0.60)(1.36)(−0.12)
FGNSALE0.0240.037−0.095 *
(1.06)(0.68)(−1.95)
TOP−0.009−0.131−0.041
(−0.28)(−1.49)(−0.58)
INDB0.0460.0190.087
(0.85)(0.14)(0.73)
SEG0.021−0.152−1.105 *
(0.08)(−0.21)(−1.79)
Constant−0.503 ***−1.867 ***−1.004 ***
(−2.94)(−4.05)(−2.65)
FirmFEYesYesYes
InduFEYesYesYes
YearFEYesYesYes
CityFEYesYesYes
N16,77916,77916,779
Adj. R20.4780.5960.137
Note: ***, **, and * indicate statistical significance at the 1%, 5%, and 10% levels, respectively.
Table 6. Entropy balancing test.
(1)(2)(3)
VariableTECH_PROXIMITYKNOWNUNKNOWN
POST0.020 ***0.059 ***−0.003
(2.99)(3.23)(−0.19)
SIZE0.028 ***0.086 ***0.043 **
(3.37)(3.87)(2.25)
LEV−0.045 **−0.097 *−0.016
(−2.29)(−1.88)(−0.31)
ROA0.0190.0530.066
(0.37)(0.42)(0.42)
BM0.0230.0400.002
(1.18)(0.83)(0.04)
GROWTH−0.012 ***−0.035 ***−0.012
(−4.04)(−4.03)(−1.36)
TANG0.0350.142 *0.004
(1.21)(1.88)(0.06)
INTANG0.1140.246−0.336 **
(1.19)(1.11)(−1.97)
EMENUM0.0030.0110.023 *
(0.47)(0.88)(1.80)
AGE0.0140.153−0.077
(0.37)(1.30)(−0.68)
FGNSALE0.0280.059−0.071
(1.14)(0.93)(−1.15)
TOP−0.014−0.174 *−0.067
(−0.43)(−1.66)(−0.72)
INDB0.017−0.1100.163
(0.30)(−0.80)(1.08)
SEG−0.369−0.974−1.748 **
(−1.11)(−1.02)(−2.00)
Constant−0.602 ***−2.087 ***−0.722
(−3.14)(−4.20)(−1.44)
FirmFEYesYesYes
InduFEYesYesYes
YearFEYesYesYes
CityFEYesYesYes
N16,78916,78916,789
Adj. R20.4920.6080.143
Note: ***, **, and * indicate statistical significance at the 1%, 5%, and 10% levels, respectively.
Table 7. Balanced panel regression test.
(1)(2)(3)
VariableTECH_PROXIMITYKNOWNUNKNOWN
POST0.022 **0.046 **0.005
(2.40)(2.00)(0.24)
SIZE0.021 *0.101 ***0.072 ***
(1.68)(2.99)(2.81)
LEV−0.0060.050−0.002
(−0.16)(0.56)(−0.02)
ROA−0.011−0.2340.313 *
(−0.15)(−1.17)(1.84)
BM0.0410.036−0.031
(1.61)(0.55)(−0.53)
GROWTH−0.010 **−0.029 **−0.017 *
(−1.98)(−2.25)(−1.69)
TANG0.0290.1280.056
(0.72)(1.16)(0.63)
INTANG0.1160.289−0.131
(0.98)(1.02)(−0.60)
EMENUM0.017 **0.035 *0.015
(2.16)(1.84)(1.12)
AGE0.0120.054−0.124
(0.19)(0.33)(−0.99)
FGNSALE0.0110.031−0.166 *
(0.27)(0.32)(−1.89)
TOP−0.109 *−0.399 **−0.243 **
(−1.86)(−2.43)(−1.97)
INDB0.043−0.0310.278
(0.49)(−0.15)(1.54)
SEG−0.071−0.611−1.693 *
(−0.18)(−0.56)(−1.92)
Constant−0.568 *−2.337 ***−1.166 *
(−1.94)(−2.82)(−1.87)
FirmFEYesYesYes
InduFEYesYesYes
YearFEYesYesYes
CityFEYesYesYes
N782478247824
Adj. R20.4870.6320.134
Note: ***, **, and * indicate statistical significance at the 1%, 5%, and 10% levels, respectively.
Table 8. Excluding special provinces and cities.
(1)(2)(3)
VariableTECH_PROXIMITYKNOWNUNKNOWN
POST0.027 ***0.071 ***−0.009
(3.59)(3.67)(−0.51)
SIZE0.023 ***0.074 ***0.058 ***
(2.65)(3.31)(3.11)
LEV−0.024−0.0530.022
(−1.09)(−0.96)(0.47)
ROA0.024−0.0440.219 *
(0.46)(−0.35)(1.81)
BM0.0210.038−0.001
(1.15)(0.83)(−0.02)
GROWTH−0.012 ***−0.040 ***−0.017 **
(−3.37)(−4.81)(−2.08)
TANG0.0010.0690.010
(0.04)(0.97)(0.16)
INTANG0.0970.250−0.420 **
(1.07)(1.25)(−2.36)
EMENUM0.011 *0.036 **0.018
(1.87)(2.49)(1.54)
AGE−0.0000.054−0.041
(−0.00)(0.44)(−0.45)
FGNSALE0.0410.076−0.057
(1.46)(1.18)(−1.02)
TOP−0.005−0.159−0.051
(−0.13)(−1.61)(−0.65)
INDB0.0780.0530.237 *
(1.25)(0.36)(1.78)
SEG−0.028−0.425−1.916 ***
(−0.09)(−0.51)(−2.72)
Constant−0.552 ***−1.815 ***−1.174 ***
(−2.77)(−3.46)(−2.67)
FirmFEYesYesYes
InduFEYesYesYes
YearFEYesYesYes
CityFEYesYesYes
N13,39613,39613,396
Adj. R20.4640.5810.108
Note: ***, **, and * indicate statistical significance at the 1%, 5%, and 10% levels, respectively.
Table 9. Additional controls.
(1)(2)(3)
VariableTECH_PROXIMITYKNOWNUNKNOWN
POST0.027 ***0.068 ***−0.016
(3.39)(3.32)(−0.88)
LNGDP_PC−0.0070.018−0.028
(−0.57)(0.64)(−1.01)
LNPOPULATION0.0660.208−0.092
(1.10)(1.19)(−0.67)
DEFICIT0.0050.0200.032
(0.11)(0.17)(0.29)
MKT−0.014 *−0.0250.006
(−1.74)(−1.39)(0.38)
LNCO2−0.016−0.001−0.008
(−1.05)(−0.03)(−0.24)
LNIWW0.0110.047 *0.019
(0.99)(1.80)(0.87)
LNSO2−0.006−0.019−0.003
(−0.79)(−1.09)(−0.17)
LNISD−0.007−0.023 *0.007
(−1.24)(−1.83)(0.58)
Constant−0.577−2.980 **−0.941
(−1.31)(−2.53)(−0.83)
ControlsYesYesYes
FirmFEYesYesYes
InduFEYesYesYes
YearFEYesYesYes
CityFEYesYesYes
N11,22811,22811,228
Adj. R20.4760.5960.110
Note: ***, **, and * indicate statistical significance at the 1%, 5%, and 10% levels, respectively.
Table 10. Excluding other concurrent policies.
(1)(2)(3)
VariableTECH_PROXIMITYKNOWNUNKNOWN
POST0.015 **0.044 ***−0.006
(2.46)(2.86)(−0.41)
POST2*INDU−0.012−0.039 *0.019
(−1.51)(−1.90)(1.08)
POST3−0.003−0.003−0.000
(−0.36)(−0.11)(−0.02)
SIZE0.019 ***0.068 ***0.052 ***
(2.67)(3.57)(3.31)
LEV−0.024−0.0680.004
(−1.29)(−1.40)(0.09)
ROA0.024−0.0140.157
(0.55)(−0.12)(1.41)
BM0.0200.0270.004
(1.21)(0.68)(0.10)
GROWTH−0.009 ***−0.032 ***−0.016 **
(−3.17)(−4.47)(−2.26)
TANG0.0070.106 *0.008
(0.31)(1.69)(0.14)
INTANG0.0600.153−0.254 *
(0.84)(0.93)(−1.70)
EMENUM0.0070.0170.012
(1.55)(1.49)(1.30)
AGE0.0250.155−0.009
(0.62)(1.37)(−0.10)
FGNSALE0.0230.035−0.094 *
(1.03)(0.64)(−1.93)
TOP−0.009−0.136−0.039
(−0.29)(−1.55)(−0.56)
INDB0.0470.0240.086
(0.87)(0.18)(0.72)
SEG0.028−0.141−1.116 *
(0.10)(−0.19)(−1.81)
Constant−0.485 ***−1.803 ***−1.033 ***
(−2.85)(−3.91)(−2.74)
FirmFEYesYesYes
InduFEYesYesYes
YearFEYesYesYes
CityFEYesYesYes
N16,78916,78916,789
Adj. R20.4780.5960.137
Note: ***, **, and * indicate statistical significance at the 1%, 5%, and 10% levels, respectively.
Table 11. Regional air pollution and environmental concerns.
(1)(2)(3)(4)(5)(6)
VariableTECH_
PROXIMITY
KNOWNUNKNOWNTECH_
PROXIMITY
KNOWNUNKNOWN
Regional Air Pollution (PM2.5)Environmental Concerns
POST0.0030.0090.0380.0060.0180.001
(0.24)(0.32)(1.12)(0.79)(0.97)(0.07)
POST*AIR0.031 *0.102 **−0.061
(1.81)(2.56)(−1.53)
AIR0.0030.0090.038
(0.24)(0.32)(1.12)
POST*EC 0.022 **0.055 **−0.015
(2.46)(2.46)(−0.72)
EC −0.001−0.0060.011
(−0.36)(−0.66)(1.15)
SIZE0.0120.063 ***0.070 ***0.020 ***0.074 ***0.053 ***
(1.25)(2.58)(3.16)(2.82)(3.83)(3.28)
LEV−0.030−0.0440.046−0.025−0.0650.014
(−1.28)(−0.72)(0.90)(−1.26)(−1.27)(0.31)
ROA0.0540.0610.241 *0.012−0.0660.142
(0.99)(0.48)(1.81)(0.26)(−0.57)(1.25)
BM0.036 *0.055−0.0220.009−0.002−0.000
(1.82)(1.16)(−0.47)(0.55)(−0.05)(−0.01)
GROWTH−0.009 **−0.033 ***−0.017 **−0.009 ***−0.032 ***−0.016 **
(−2.33)(−3.66)(−2.05)(−3.11)(−4.39)(−2.26)
TANG0.0080.095−0.040−0.0020.088−0.003
(0.29)(1.37)(−0.62)(−0.07)(1.33)(−0.05)
INTANG0.1230.369 *−0.471 **0.0540.165−0.201
(1.17)(1.76)(−2.28)(0.75)(0.99)(−1.30)
EMENUM0.016 ***0.039 ***0.0090.008 *0.0180.010
(2.78)(2.78)(0.67)(1.67)(1.60)(1.05)
AGE−0.0120.051−0.0750.0250.1570.002
(−0.25)(0.39)(−0.76)(0.61)(1.34)(0.02)
FGNSALE0.021−0.003−0.0210.0200.017−0.093 *
(0.69)(−0.04)(−0.33)(0.89)(0.32)(−1.85)
TOP0.008−0.099−0.053−0.010−0.141−0.040
(0.19)(−1.02)(−0.58)(−0.30)(−1.57)(−0.55)
INDB0.063−0.0690.390 ***0.0550.0590.105
(0.95)(−0.47)(2.71)(0.97)(0.43)(0.85)
SEG0.239−0.381−2.250 ***0.036−0.142−1.274 **
(0.74)(−0.48)(−2.89)(0.13)(−0.19)(−2.03)
Constant−0.334−1.589 ***−1.305 ***−0.518 ***−1.945 ***−1.073 ***
(−1.54)(−2.84)(−2.62)(−2.96)(−4.14)(−2.77)
FirmFEYesYesYesYesYesYes
InduFEYesYesYesYesYesYes
YearFEYesYesYesYesYesYes
CityFEYesYesYesYesYesYes
N11,22711,22711,22716,21816,21816,218
Adj. R20.4670.5830.0990.4800.5970.140
Note: ***, **, and * indicate statistical significance at the 1%, 5%, and 10% levels, respectively.
Table 12. State shareholding ratio and tax preferences.
(1)(2)(3)(4)(5)(6)
VariableTECH_
PROXIMITY
KNOWNUNKNOWNTECH_
PROXIMITY
KNOWNUNKNOWN
State shareholding ratioTax preferences
POST0.012 *0.031 **−0.0120.003−0.007−0.012
(1.86)(1.98)(−0.84)(0.36)(−0.39)(−0.72)
POST*SOEP0.032 **0.118 ***0.046
(1.96)(2.73)(1.31)
SOEP−0.010−0.0260.003
(−1.47)(−1.47)(0.18)
POST*TF 0.025 **0.102 ***0.010
(2.56)(4.13)(0.45)
TF −0.004−0.0130.009
(−0.77)(−0.97)(0.64)
SIZE0.020 ***0.070 ***0.049 ***0.020 ***0.071 ***0.050 ***
(2.78)(3.65)(3.13)(2.79)(3.71)(3.18)
LEV−0.025−0.076−0.003−0.024−0.0670.006
(−1.31)(−1.57)(−0.06)(−1.28)(−1.38)(0.14)
ROA0.020−0.0280.1650.016−0.0410.164
(0.44)(−0.25)(1.49)(0.37)(−0.36)(1.48)
BM0.0180.0190.0030.0170.0170.006
(1.10)(0.47)(0.09)(1.05)(0.42)(0.16)
GROWTH−0.009 ***−0.032 ***−0.016 **−0.009 ***−0.031 ***−0.015 **
(−3.10)(−4.41)(−2.28)(−3.09)(−4.33)(−2.22)
TANG0.0030.0920.0080.0050.0980.011
(0.13)(1.46)(0.15)(0.20)(1.55)(0.19)
INTANG0.0600.152−0.258 *0.0580.146−0.255 *
(0.85)(0.92)(−1.73)(0.82)(0.89)(−1.71)
EMENUM0.0070.0160.0110.0070.0160.011
(1.53)(1.45)(1.20)(1.55)(1.46)(1.20)
AGE0.0280.165−0.0050.0250.154−0.010
(0.68)(1.45)(−0.06)(0.61)(1.35)(−0.11)
FGNSALE0.0240.038−0.094 *0.0240.039−0.098 **
(1.07)(0.70)(−1.92)(1.09)(0.71)(−2.00)
TOP−0.011−0.139−0.038−0.008−0.128−0.037
(−0.33)(−1.59)(−0.54)(−0.23)(−1.47)(−0.53)
INDB0.0470.0270.0920.0430.0080.087
(0.87)(0.21)(0.78)(0.79)(0.06)(0.73)
SEG0.025−0.148−1.107 *0.016−0.181−1.121 *
(0.09)(−0.20)(−1.80)(0.06)(−0.25)(−1.82)
Constant−0.508 ***−1.853 ***−0.977 **−0.500 ***−1.844 ***−0.989 ***
(−2.97)(−4.00)(−2.57)(−2.94)(−4.01)(−2.61)
FirmFEYesYesYesYesYesYes
InduFEYesYesYesYesYesYes
YearFEYesYesYesYesYesYes
CityFEYesYesYesYesYesYes
N16,78916,78916,78916,78916,78916,789
Adj. R20.4790.5970.1370.4790.5970.137
Note: ***, **, and * indicate statistical significance at the 1%, 5%, and 10% levels, respectively.
Table 13. Analyst coverage and institutional shareholding ratio.
(1)(2)(3)(4)(5)(6)
VariableTECH_
PROXIMITY
KNOWNUNKNOWNTECH_
PROXIMITY
KNOWNUNKNOWN
Analyst coverageInstitutional shareholding ratio
POST−0.003−0.016−0.019−0.0020.002−0.023
(−0.44)(−0.93)(−1.20)(−0.25)(0.12)(−1.34)
POST*AC0.036 ***0.122 ***0.025
(3.75)(4.84)(1.15)
AC−0.013 ***−0.036 ***−0.012
(−2.74)(−3.11)(−1.04)
POST*ISR 0.031 ***0.079 ***0.030
(3.34)(3.30)(1.41)
ISR −0.008 **−0.037 ***−0.020 **
(−1.98)(−3.53)(−2.00)
SIZE0.019 ***0.067 ***0.051 ***0.019 ***0.072 ***0.053 ***
(2.62)(3.46)(3.18)(2.67)(3.77)(3.34)
LEV−0.025−0.0710.006−0.025−0.0690.006
(−1.31)(−1.45)(0.14)(−1.34)(−1.42)(0.15)
ROA0.029−0.0040.1750.021−0.0180.171
(0.66)(−0.03)(1.57)(0.47)(−0.16)(1.53)
BM0.0150.0120.0030.014−0.002−0.007
(0.88)(0.29)(0.07)(0.82)(−0.06)(−0.18)
GROWTH−0.008 ***−0.030 ***−0.015 **−0.009 ***−0.030 ***−0.015 **
(−2.94)(−4.16)(−2.18)(−2.96)(−4.21)(−2.12)
TANG0.0000.0850.0070.0040.0940.008
(0.02)(1.35)(0.13)(0.17)(1.49)(0.14)
INTANG0.0560.141−0.257 *0.0590.154−0.252 *
(0.78)(0.85)(−1.73)(0.83)(0.94)(−1.70)
EMENUM0.0070.0160.0110.0070.0160.011
(1.49)(1.41)(1.21)(1.50)(1.45)(1.20)
AGE0.0150.122−0.0170.0220.144−0.015
(0.36)(1.08)(−0.20)(0.54)(1.27)(−0.17)
FGNSALE0.0230.036−0.096 *0.0230.036−0.096 *
(1.04)(0.65)(−1.95)(1.04)(0.65)(−1.96)
TOP−0.007−0.129−0.037−0.007−0.137−0.042
(−0.21)(−1.48)(−0.53)(−0.23)(−1.56)(−0.59)
INDB0.0470.0230.0870.0460.0220.088
(0.86)(0.17)(0.74)(0.84)(0.17)(0.74)
SEG0.022−0.152−1.104 *0.038−0.127−1.096 *
(0.08)(−0.21)(−1.79)(0.14)(−0.17)(−1.78)
Constant−0.448 ***−1.652 ***−0.983 **−0.471 ***−1.833 ***−1.017 ***
(−2.59)(−3.56)(−2.55)(−2.78)(−4.01)(−2.67)
FirmFEYesYesYesYesYesYes
InduFEYesYesYesYesYesYes
YearFEYesYesYesYesYesYes
CityFEYesYesYesYesYesYes
N16,78916,78916,78916,78916,78916,789
Adj. R20.4790.5970.1370.4790.5970.137
Note: ***, **, and * indicate statistical significance at the 1%, 5%, and 10% levels, respectively.
Table 14. Moderating effect of firms’ environmental protection investment.
(1)(2)(3)(4)
VariableKNOWNUNKNOWNKNOWNUNKNOWN
EPI0.784 **−0.3880.431−0.107
(2.12)(−1.35)(1.24)(−0.35)
POST*EPI 2.022 *−1.660 ***
(1.81)(−2.65)
POST 0.039 **−0.001
(2.49)(−0.04)
SIZE0.068 ***0.052 ***0.069 ***0.051 ***
(3.61)(3.28)(3.66)(3.26)
LEV−0.0690.004−0.0690.005
(−1.41)(0.09)(−1.41)(0.12)
ROA−0.0250.165−0.0330.167
(−0.22)(1.48)(−0.29)(1.51)
BM0.0250.0060.0220.006
(0.62)(0.15)(0.55)(0.17)
GROWTH−0.032 ***−0.016 **−0.032 ***−0.015 **
(−4.40)(−2.28)(−4.48)(−2.22)
TANG0.0980.0120.0960.015
(1.56)(0.20)(1.51)(0.26)
INTANG0.162−0.259 *0.159−0.256 *
(0.99)(−1.74)(0.97)(−1.72)
EMENUM0.019 *0.0110.018*0.011
(1.70)(1.21)(1.65)(1.19)
AGE0.154−0.0100.157−0.009
(1.35)(−0.12)(1.38)(−0.10)
FGNSALE0.042−0.096 **0.038−0.096 **
(0.76)(−1.96)(0.69)(−1.97)
TOP−0.130−0.041−0.125−0.047
(−1.49)(−0.58)(−1.43)(−0.67)
INDB0.0180.0870.0250.085
(0.13)(0.74)(0.19)(0.72)
SEG−0.209−1.094 *−0.211−1.072 *
(−0.28)(−1.78)(−0.29)(−1.74)
Constant−1.823 ***−1.014 ***−1.853 ***−1.007 ***
(−3.96)(−2.68)(−4.03)(−2.67)
FirmFEYesYesYesYes
InduFEYesYesYesYes
YearFEYesYesYesYes
CityFEYesYesYesYes
N16,78916,78916,78916,789
Adj. R20.5960.1370.5970.137
Note: ***, **, and * indicate statistical significance at the 1%, 5%, and 10% levels, respectively.
Table 15. Economic value added and corporate social responsibility.
(1)(2)
EVACSRID
POST0.046 *0.019 ***
(1.70)(2.68)
SIZE0.082 *0.074 ***
(1.65)(6.87)
LEV0.252 ***0.116 ***
(3.79)(4.58)
BM−0.145 ***−0.023
(−3.03)(−1.09)
GROWTH0.113 ***−0.021 ***
(4.11)(−5.18)
TANG−0.0750.014
(−1.04)(0.45)
INTANG−0.250−0.163
(−1.22)(−1.44)
EMENUM0.041 **0.013 *
(2.42)(1.92)
AGE−0.245−0.010
(−0.88)(−0.19)
FGNSALE−0.059−0.031
(−1.37)(−1.20)
TOP0.525−0.011
(0.99)(−0.23)
INDB0.1040.011
(0.39)(0.17)
SEG1.497−0.734 **
(1.40)(−2.01)
Constant−1.787 **−1.489 ***
(−2.33)(−5.49)
FirmFEYesYes
InduFEYesYes
YearFEYesYes
CityFEYesYes
N16,78916,789
Adj. R20.0710.804
Note: ***, **, and * indicate statistical significance at the 1%, 5%, and 10% levels, respectively.
Disclaimer/Publisher’s Note: The statements, opinions and data contained in all publications are solely those of the individual author(s) and contributor(s) and not of MDPI and/or the editor(s). MDPI and/or the editor(s) disclaim responsibility for any injury to people or property resulting from any ideas, methods, instructions or products referred to in the content.

