Article

Study on the Influence Mechanism of Sample Preparation Method on the Shear Strength of Silty Soil

1
School of Civil Engineering, Central South University, Changsha 410075, China
2
China Airport Planning & Design Institute Co., Ltd., Beijing 101312, China
3
Airport Engineering Safety and Long-Term Performance Field Scientific Observation and Research Base of Transportation Industry, Beijing 100029, China
4
National Engineering Research Center of High-Speed Railway Construction Technology, Changsha 410075, China
5
Zhongyan Technology Co., Ltd., Beijing 100029, China
*
Author to whom correspondence should be addressed.
Sustainability 2023, 15(3), 2635; https://doi.org/10.3390/su15032635
Submission received: 23 December 2022 / Revised: 20 January 2023 / Accepted: 20 January 2023 / Published: 1 February 2023

Abstract

:
During the compaction of silty soil subgrade, different filling methods are adopted, which will significantly impact the subgrade performance, but few studies have been applied to quantify this influence. To explore the influence mechanism of dry density and sample preparation method (compaction and static compression method) on the shear strength of silty soil, the consolidated undrained shear test (CU test), dynamic triaxial test, and nuclear magnetic resonance microscopic test on silty soil were carried out in this study. The test results show that the shear strength of the sample is positively correlated with the dry density. The influence of the sample preparation method on shear strength is mainly reflected in the cohesion. The pore size distributions obtained by different sample preparation methods had smaller differences before the CU test. However, significant differences were observed after the CU test, indicating that the influence of the sample preparation method on the shear strength of the sample is not on the initial pore distribution but on the residual stress and overall uniformity. The dynamic triaxial tests show that a differential settlement may occur when multiple sample preparation (soil-filling method in subgrade practice) methods are adopted.

1. Introduction

In North and Northwest China and other regions, a large amount of silty soil is often used as filler in road and airport subgrades according to their local conditions. The subgrade compaction methods include heavy tamping, impact rolling, conventional rolling, and various combinations. Different subgrade compaction methods may lead to the differential settlement during the long-term serviceable period, which then results in the degradation of the sustainability of the airport runway. In order to investigate the influence of the compaction processing method on the shear strength of silty soil, a series of tests were conducted on different compaction methods (sample preparation methods). The heavy tamping and conventional rolling compaction processing methods used in the field were simplified into two sample preparation methods: static compression and compaction methods.
The influence of sample preparation methods on the mechanical properties of soil samples is one of the current research focuses [1,2]. In the study of sandy soil, Park [3] explored the evolution trends of the initial structure of “ASTM graded sand” and the internal structure in the shear process by the sand rain method (AP) and wet packing and tamping method (MT). It was found that the MT samples were more anisotropic, and the structure evolution in the shear process was dependent on the sample preparation method. Vincent [4] and Papadimitriou et al. [5] conducted the undrained shear tests, and Fumio et al. [6] performed the triaxial tests and torsional tests to find that the stress–strain response of the sandy soil samples prepared by different sample preparation methods was significantly different.
Many researchers have also carried out extensive research on clay and silty soil. Through the research on the shear strength of remolded clay samples, Li et al. [7] showed that the undisturbed sample had the highest shear strength, followed by the consolidated sample, whereas the punched and compacted sample had the lowest shear strength. Guo and Wang [8] studied the saturated samples of the Nantong silty soil and Dongying silty soil and found that the shear strength index of the undisturbed sample was greater than that of the dry-packed sample. The shear strength index of the wet-packed sample was the lowest. Zheng et al. [9] prepared the Lanzhou loess and Beiluhe clay samples by different sample preparation methods and demonstrated that the two-end compaction method could easily control the uniformity of the samples than the layered compaction and mud methods. The initial damage was found to be smaller. Lu [10] evaluated the silty soil of the Zhengzhou site and found that two sample preparation methods—the water addition method and the drying method—significantly affected the direct shear and triaxial shear test results of samples having a constant moisture content. Further, Li et al. [11] showed that the tensile strength of the statically pressed loess soil sample was significantly greater than that of the compacted soil sample. Ren et al. [12] studied the mechanical properties of the silty soil samples prepared by the static and dynamic compaction methods and found that the shear strength index of the statically pressed sample was higher than that of the dynamically compacted sample, while the test results were opposite in the triaxial test.
The studies discussed earlier have proved the influence of the sample preparation method and soil sample strength but have not revealed the internal mechanism of its influence. The mechanical properties of the remodeled samples are affected not only by the macroscopic parameters, such as effective stress and dry density, but also are closely related to their mesoscopic structural elements, such as particle arrangement, particle composition, and pore distribution. The mesoscopic structure of soil samples is controlled by the sample preparation conditions. The internal structures of silty soil samples prepared under different sample preparation conditions are different, thereby affecting their mechanical properties. Many researchers have studied the microstructure of soil samples under different sample preparation methods. Hu et al. [13] studied the microstructure of the clay compacted by heavy tamping through scanning electron microscopy and found that the changes in microstructure characteristics of soil during heavy tamping were correlated with the observed values of land subsidence. Gao et al. [14] studied the microstructure of saturated clay subjected to triaxial loading and found that the clay microstructure was related to the loading conditions. Liu [15] and Zhang et al. [16] used scanning electron microscopy (SEM) to observe the microstructural changes in the expansive and silty soils, respectively, revealing the particle arrangement of expansive soil and the mechanism of lignin improving the undrained shear strength of silty soil from a microscopic perspective. Pang et al. [17] used a CT-triaxial instrument to study the triaxial shear characteristics of the Yangling undisturbed loess and described the evolution trend of triaxial shear failure of the loess from a mesoscopic view. Ren et al. [18] showed that the pore size distribution curve of the pressed and compacted sample was shifted more towards the right than that of the punched and compacted sample, the peak pore size and distribution density were larger, and the content of larger pores in the agglomerate was higher. Lv [19] explored the macroscopic physical properties of Hangzhou silty soil and their relationship with the microstructure through the SEM tests on silty soil samples. In addition, studies have been carried out on the effect of dynamic properties caused by different sample preparation methods, including the study of critical dynamic stresses [20] and the prediction of deformation [21].
Although much research on soil microstructure affected by different compaction methods has been carried out earlier, the existing research lacks a comparative study on the mesostructure of samples before and after the strength test, resulting in a lack of a more systematic understanding of the mesostructure differences caused by different sample preparation methods, the mesostructure changes caused by shearing, the strength differences, and the permanent deformation under dynamic loading. In this paper, the Beijing silty soil was taken as the research focus. Under the same initial moisture content, the saturated samples of different dry densities were prepared by static compression and compaction methods. The consolidated undrained shear test was carried out to study the influence of sample preparation methods on the shear strength of silty soil. Nuclear magnetic resonance analysis (NMR) was carried out to compare and analyze the differences in the pore size distribution of the samples under the two sample preparation methods, as well as the evolution of the pore size distribution before and after the shear test. Further, the influence mechanism of sample preparation conditions on the static characteristics and pore size distribution of silty soil were explored. The findings of the above can be used to optimize the design of the subgrade, which then largely improve the sustainability of the airport runway.

2. Soil Sample Properties and Test Methods

2.1. Properties of Soil Samples

The experimental research object was the silty soil in the Beijing Daxing Airport area. The basic physical properties are shown in Table 1, and the particle size distribution curve is shown in Figure 1. It is classified as sandy-silty soil.

2.2. Test Scheme

In order to explore the influence of sample preparation methods on the static characteristics and the pore size distribution of silty soil samples before and after the test, the compaction and static compression methods were used for sample preparation. After drying, crushing, and sieving the soil samples on the site, wet soil was prepared according to the required dry density and initial moisture content. In terms of the compaction method for sample preparation, the compaction hammer was used to perform dynamic compaction on wet soil. For the static compression method for sample preparation, an isobaric static moment meter was used to compact wet soil through static pressure. The samples were prepared in five layers, each with the same mass and height. The prepared samples were pumped and saturated.
According to the regulations in the “Code for Geotechnical Engineering Design of Civil Airports” [22], the compaction degree should not be less than 96% within the range of 0.8 m below the road surface of the filling section, 94% within the range of 0.8 m below the road surface of the excavation section, and 92% within the range of 4 m below the road surface of the filling section. Due to the possibility of local leakage pressure in the actual project, the compaction degree K was taken as 89%, 92%, and 95%, corresponding to the dry density ρd = 1.66 g/cm3, 1.72 g/cm3, and 1.78 g/cm3, respectively. In the test, the optimal moisture content of the samples was uniformly 13.1%. Samples with different dry densities were prepared by the compaction method and the static compression method, respectively. The photographs of the sample prepared are shown as Figure 2. A fully automatic demolding device was used to reduce the disturbance. Under the same conditions, five samples/batches were prepared, which were used for the pore size measurement after saturation and consolidated undrained test (CU). A total of 30 samples were prepared. The confining pressures of CU were set to 100 kPa, 200 kPa, 300 kPa, and 400 kPa, respectively. After the tests, the pore diameters of the samples were measured. The specific test scheme is shown in Table 2. Specimen preparation and test procedures are in accordance with the standard methods of the American Society for Testing and Materials (ASTM) [23].
A fully automatic strain-controlled triaxial instrument was used in the consolidated undrained shear tests. The instrument used in the NMR tests was a Suzhou Niumai NMR microstructure analyzer. The samples of the NMR tests were taken from the triaxial saturated sample with a sampler. The sample diameter was 1 mm, and the height was 1 mm.
To avoid the errors, the sampling positions before and after triaxial tests are almost the same near the shear interface, which refers to the central part of the soil.

3. Test Results and Analysis

3.1. CU Test Results and Analysis

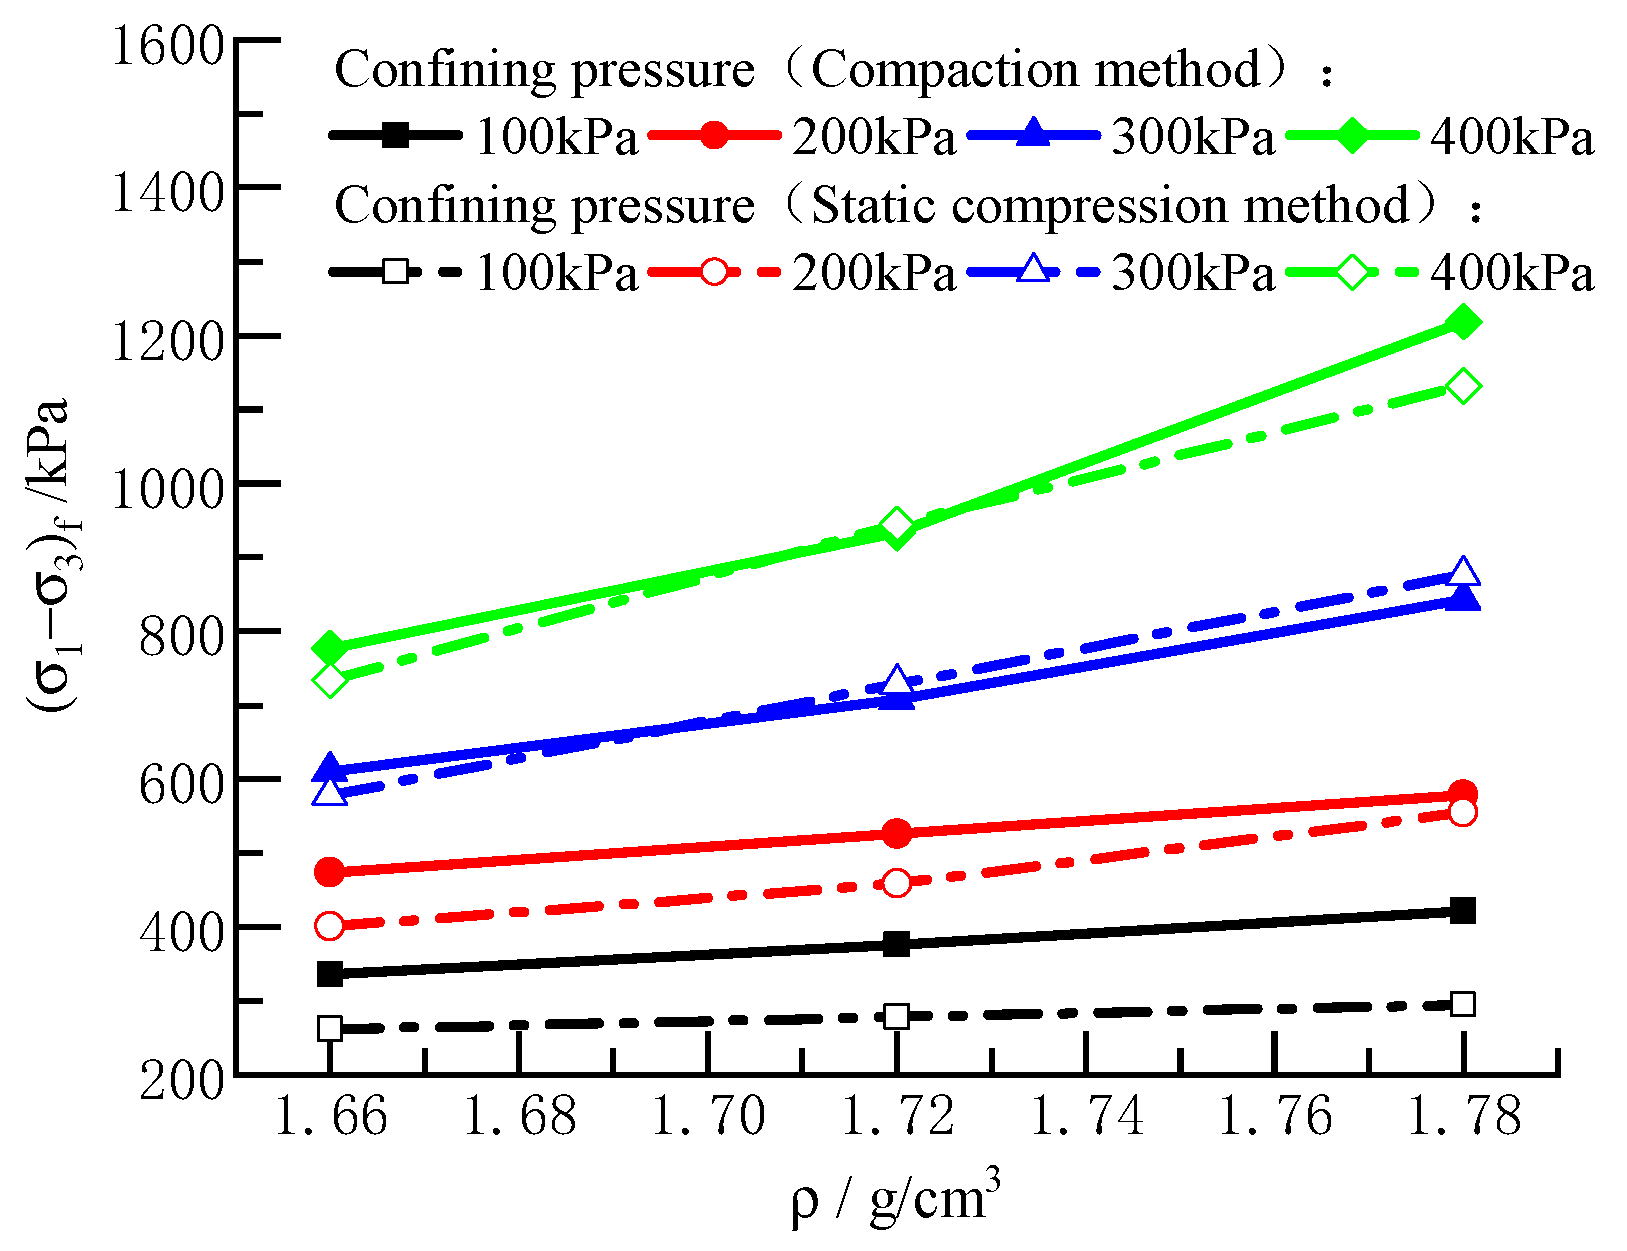
3.1.1. Stress–Strain Relationship Curve and Shear Strength

Under different dry densities, the shear stress–strain relationship curves of the samples by the compaction and static compression methods are shown in Figure 3. The stress–strain relationships in the CU tests are all continuous hardening type, and the evolution of the stress–strain relationship is related to the sample preparation method.
In the initial (elastic) shearing stage, when the confining pressure is relatively low, the stress development of the sample by the compaction method is faster. The stress development of the sample by the static compression method at larger confining pressures (200 kPa, 300 kPa, and 400 kPa) is greater than that of the compaction method.
This phenomenon is more likely due to soil structure of compaction samples is more regular than the static compression ones. In the compaction, the soil structure became uniform and fully contacted. Thus, the compaction samples have a higher shear strength. Another reason may attribute to the pre-consolidation pressure when preparing the samples. Although the samples have the same apparent dry density, they subjected to different pre-consolidation pressure when preparing the sample. This phenomenon is more obvious at low dry density.
Under the condition of high dry density, the duration of sample preparation by the compaction method is shorter than that of the static compression method, and it is not easy to eliminate the sealed pores formed in the sample. While the static compression samples have higher pre-consolidation pressure. It results in a lower uniformity than that in the case of the static compression method. Therefore, in this state, the stress development on the sample by the static compression method is lower than that by the compaction method sample. The sample prepared by the static compression method is more likely to reach the soil hardening stage.
As the curve enters the elastic–plastic or even plastic stage, the particles in the sample are continuously rearranged to form a more uniform soil particle skeleton to bear the load. Therefore, with the development of the tests, the difference value for principal stress gradually decreases.
The influence of the sample preparation method on the stress–strain relationship curve for silty soil is relatively complex. The summary of the difference in the shear strength of the samples caused by the sample preparation methods (the difference between the shear strength of the sample prepared by the compaction and static compression methods) is shown in Table 3. When the confining pressure is low (100 kPa and 200 kPa), the shear strength of the sample prepared by the compaction method is significantly higher than that of the sample prepared by the static compression method. When the confining pressure is 100 kPa, and the dry density is 1.72 g/cm3 and 1.78 g/cm3, the difference in shear strength caused by the sample preparation method is comparable to the confining pressure value. The higher the confining pressure, the smaller the difference in shear strength caused by the sample preparation method. Therefore, the effect of the sample preparation method on the shear strength needs to be further investigated.
The relationship between the shear strength value and the confining pressure is shown in Figure 4. As mentioned above, the interlayer contact is better for the sample prepared by the compaction method. In addition, the overall sample is more uniform, the residual strain is smaller, and the shear strength is larger under low confining pressure. With the increase in confining pressure, the difference in shear strength between different sample preparation methods gradually decreases, and the difference in shear strength under high confining pressure is not significant. Therefore, the growth rate of shear strength for the sample by the static compression method is greater than that by the compaction method.
The relationship between the shear strength and the dry density is shown in Figure 5. It can be seen that (i) the shear strength of the sample increases with the increase in its initial dry density; (ii) under low confining pressure, the difference in shear strength caused by the sample preparation method is more obvious, and under high confining pressure, the difference gradually decreases; and (iii) the smaller the dry density of the sample, the smaller the strength difference caused by the sample preparation method.

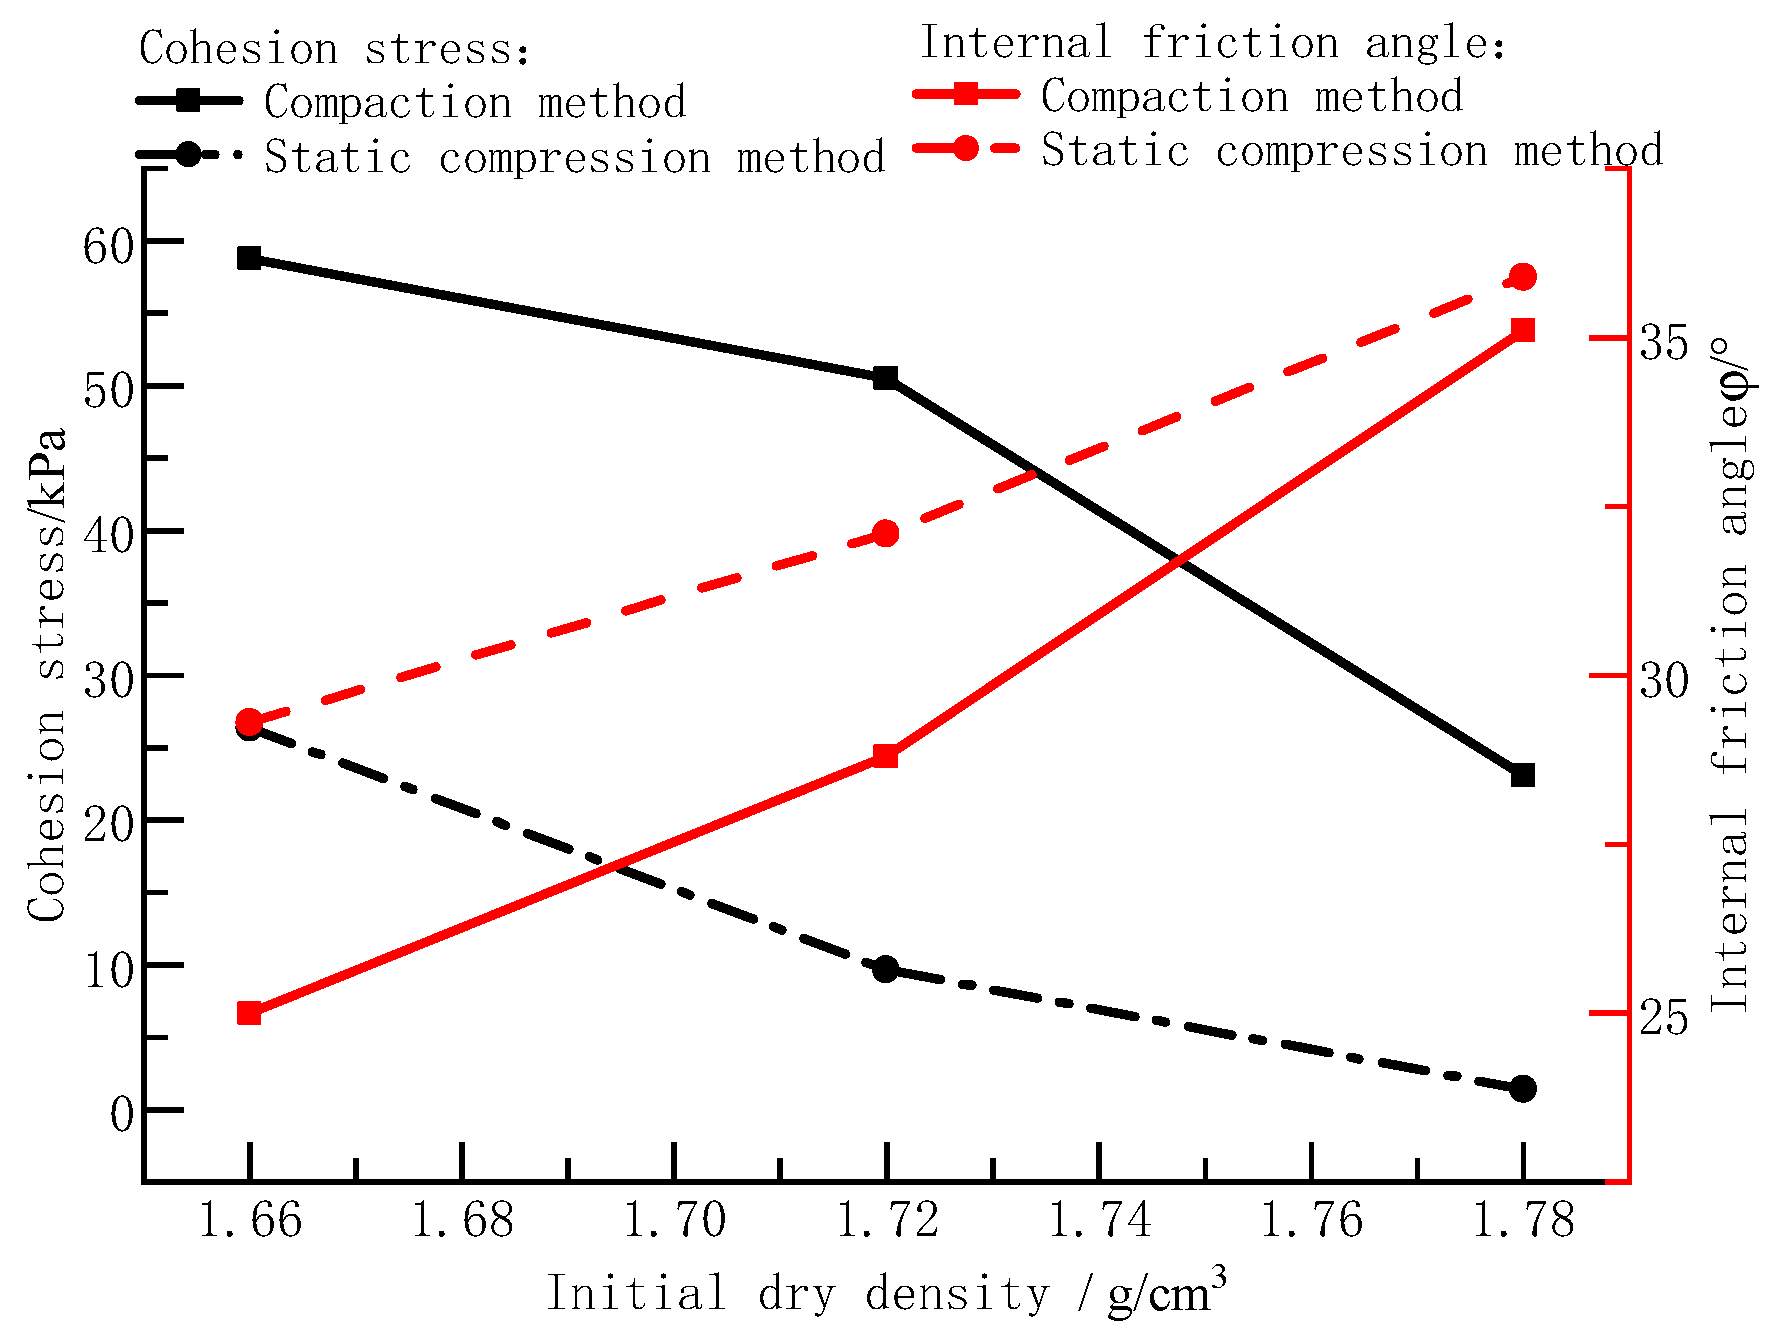
3.1.2. Shear Strength Parameters

The shear test results of the samples are shown in Table 4. As the dry density of the sample increases, the cohesion decreases while the internal friction angle increases. In addition, the difference in shear strength of the samples prepared by different sample preparation methods is mainly reflected in the cohesion, while the difference in the internal friction is not significant. The results are shown in Figure 6.

3.2. NMR Test Results and Analysis

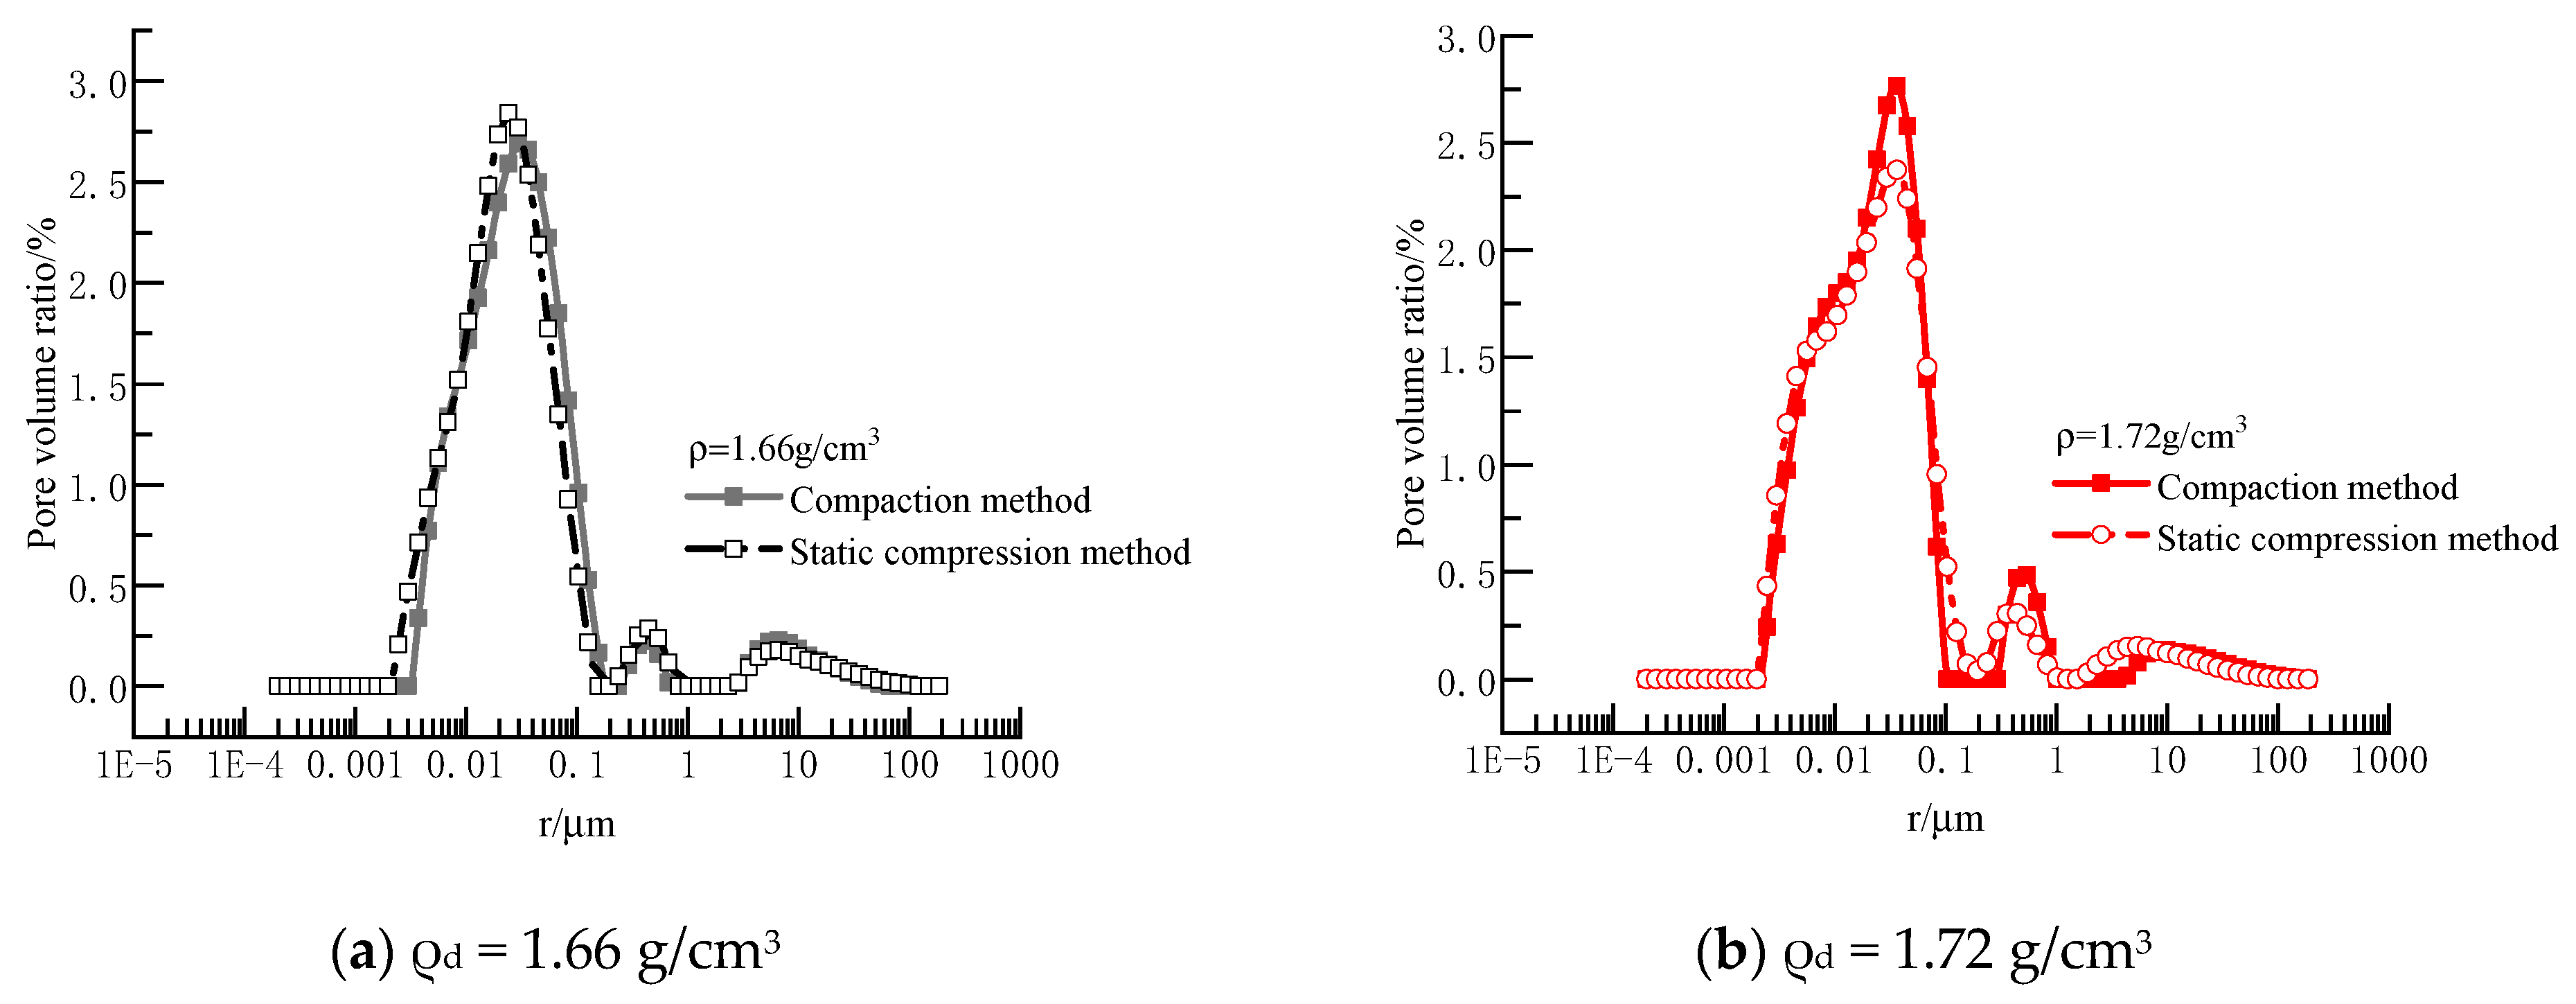
3.2.1. Pore Distribution Characteristics of the Saturated Samples

Before the shear tests, the pore distribution of the saturated samples was determined by NMR tests. Figure 7 shows the difference in pore distribution under different dry densities and sample preparation methods. The ranges of the main peaks of the pore radius of the samples by the compaction method are 0.002 m–0.2 m, 0.002 m–0.1 m, and 0.0015 m–0.008 m, respectively, while those by the static compression method are 0.001 m–0.2 m, 0.002 m–0.2 m, and 0.0015 m–0.15 m, respectively. The samples prepared by different preparation methods have the same trend of internal pore size distribution, and they only differ slightly in the pore volume ratio corresponding to the peak pore size.
The initial pore distribution in samples by different sample preparation methods has relatively small differences. Before the shear test, the pore distribution of the sample is mainly determined by the silty soil particle gradation and dry density. Different sample preparation methods only influence the overall uniformity and residual stress and have little impact on the pore distribution. However, due to the influence of the saturation process on pore structure, the pore structure of the sample tends to be homogenized [24]. Hence, the difference in the pore distribution of the sample is further reduced.

3.2.2. Pore Distribution Characteristics before and after the CU Test

The NMR test was performed on the triaxial samples after the CU test. The changes in the pore distribution before and after the CU test were compared. The results are shown in Figure 8. It can be seen that when the dry density is 1.66 g/cm3 and 1.72 g/cm3, the pore size distribution after the test has a 3-peak structure. The main peak is the middle peak, and the secondary peak is the left peak. The secondary peak occupies a considerable proportion of pore volume. Moreover, the proportion of secondary peak pore volume of the sample by the compaction method is larger than that by the static compression method sample. The overall left shift degree of the pore size distribution in the sample by the compaction method is greater than that by the static compression method. The pore size distribution curve shifts towards the left, indicating a denser sample. The sample prepared by the compaction method is denser than that prepared by the static compression method after the test, which is consistent with the fact that the macro strength of the sample by the compaction method is larger than that by the static compression method.
When the dry density of the sample is 1.78 g/cm3, the overall trend of the pore distribution in the sample before and after the CU test remains almost the same for the sample prepared by the compaction method. The difference is mainly reflected in the proportional change of the pore size at the peak. However, for the sample prepared by the static compression method, the overall trend of the pore distribution of the sample before and after the CU test changes significantly. After the CU test, the main peak of the pore size of the sample has a significant left shift relative to that before the test, and the pore size distribution shows a good consistency at the main peak. Current studies [25,26] showed that the difference mainly caused by the internal structure of the soil and the internal stresses. In the test, the pore structure significantly changes for the sample prepared by the static compression method, indicating that under the high dry density, the sample is not completely uniform before the test, and there is still a large residual stress inside. Therefore, the strength of the sample is lower, and the variation is larger during shear. The shear strength of the sample prepared by the static compression method is smaller than that of the compaction method in macroscopic strength.

4. Analysis of Cumulative Strain under Different Sample Preparation Methods

4.1. Dynamic Triaxial Test Scheme

In previous research studies, the effects of the sample preparation methods on the silty soil have been investigated from the shear strength and the microscopic perspectives. However, the silty soil subgrade is subjected to cyclic loading in the practical project studied in this work. The affected area is located within 3 m underground, corresponding to a confining pressure of 30 kPa–90 kPa. This scenario is different from the shear strength test in the previous investigations. Therefore, indoor dynamic triaxial tests with different sample preparation methods were carried out to verify that the influence of different sample preparation methods on the shear strength can be suitable for practical engineering. The test scheme is shown in Table 5. According to the existing studies [27,28,29] and the specification for civil airports [22], the confining pressure, dry density, dynamic stress, and loading frequency were taken as 60 kPa, 1.76 g/cm3, 60 kPa–220 kPa.
The vibration frequency is related to the taxi-ing weight, moving speed, and flight density of the aircraft. In general, the vibration frequency of regional airliners is about 1 Hz, while the vibration frequency of large intercontinental airliners and military transport aircraft varies from 3 to 5 Hz [30,31]. Considering the actual situation and the instrument accuracy, the half sine waveform and 1 Hz were adopted in the test. The test was stopped when the loading cycles reached 10,000 or the axial strain up to 10%. The test was performed under the consolidation and drainage conditions to simulate the actual situation.
It should be noted that because the soil is unsaturated, the samples volume will change in dynamic triaxial test. The undrained test means the drainage valve was turned off during the test. In addition, according to the pre-test, the volume change can be neglected compared to the axial deformation. In addition, the tests are mainly concerned with the axial deformation and strength, so it can be considered that the tests are performed under the undrained condition.
Before the dynamic loading, the samples are under isotropic consolidation until the strain growth rate is less than 10−8. Then, samples load by a static pressure (σs = 15kPa) to eliminate irregularities of samples, shown as Figure 9.

4.2. Test Results and Analysis

4.2.1. Accumulated Strain

Figure 10 shows the development of cumulative plastic strain under different sample preparation methods and Figure 11 shows the permanent strain. As shown in Figure 8, the development of the accumulated plastic strain with different sample preparation methods has a similar development trend. By increasing the number of cycles, the accumulated plastic strain grows rapidly (about 2000 times) and then gradually becomes stable. The accumulated plastic strain for the samples prepared by the compaction method is significantly smaller than that prepared by the static compression method; the difference increases with the dynamic stress amplitude, up to 46.1%. This is consistent with the findings presented in Table 3 that the strength of the compaction sample is higher at lower confining pressure (100 kPa), which validates that the study of shear strength in this paper also applies to the accumulated plastic strain of the roadbed.
It should be noted that the plastic strain predicted here is the strain at the time the test ends (i.e., 10,000 cycles), but since the sample strain is stable and the strain growth rate is extremely low, it can be considered as the permanent strain considering long-term effects.

4.2.2. Rebound Modulus

The dynamic resilient modulus in this paper is calculated as follows:
E d = σ d Δ ε
where σd is the value of the axial dynamic stress applied to the samples, and ∆ε is the maximum and minimum strain difference in the current cycle.
Figure 12 shows the resilient modulus of samples prepared by different methods. The rebound modulus of the samples has a similar trend with the increase in the number of cycles of the compaction and static compression methods, i.e., it increases rapidly first and gradually stabilizes after 2000 cycles, which is consistent with the trend of accumulated plastic strain. The rebound modulus at different dynamic stress amplitudes differed, especially at the beginning of the cycle. Then, the modulus becomes stabilized with the increase of the cycle number. This is because the specimen has a large deformation at the beginning. However, with the increase in the number of cycles, the strength of the specimen stabilizes, and the rebound modulus reaches a constant value.
The resilient modulus of the specimens prepared by the compaction method is significantly larger than that of the specimens by the static compression method, and the difference is more significant at larger dynamic stress.
The accumulated plastic strain development trend is consistent with the shear strength trend in the previous paper, validating that the research content of this paper is useful for studying permanent deformation under dynamic loading compacted by differ-rent methods.

5. Conclusions

In this paper, the effects of sample preparation methods on the shear strength of silty soil are explored through the consolidated undrained shear test. The influence mechanism of sample preparation methods on the strength was explained from the perspective of pore size distribution.
The shear strength of the sample is positively correlated with the dry density. With the increase in the initial dry density of the sample, the cohesion decreased, the internal friction angle increased, and the pore distribution was more uniform.
The sample preparation method significantly affected the shear strength and cohesion. The shear strength of the punched and compacted sample was much higher than that of the statically pressed sample, and with the increase of confining pressure, the difference in shear strength gradually decreased.
The pore size distribution of the samples before the CU test had no significant difference. However, a significant change was observed after the test, indicating that sample preparation methods did not directly affect the initial pore distribution. The uniformity of the samples by the static compression method was relatively poor, and there was residual stress during the static pressing, resulting in a lower shear strength of the sample. It is also in accordance with the current research [25,26] that the sample preparation process produces structural differences and residual stresses, and affects its strength.
The accumulated plastic strain development is consistent with the shear strength presented in the previous paper, corroborating that the current research can be used to determine the permanent deformation under dynamic loading compacted by different methods. Thus, the strength of the static compacted roadbed is lower, and its compaction degrees must be improved.

Author Contributions

Conceptualization, X.M. and M.X.; methodology, Q.Y. and X.Y.; validation, H.R. and X.M.; formal analysis, X.M., Q.Y. and M.X.; investigation, X.M. and M.X.; resources, X.M. and Q.Y.; data curation, X.M. and M.X.; writing—original draft preparation, X.M., M.X. and X.Y.; writing—review and editing, X.M. and X.Y.; visualization, B.L.; supervision, X.Y.; project administration, X.Y.; funding acquisition, X.M., Q.Y. and H.R. All authors have read and agreed to the published version of the manuscript.

Funding

This research received no external funding.

Institutional Review Board Statement

Not applicable.

Informed Consent Statement

Not applicable.

Data Availability Statement

The data are available in the paper; all the Figures and Tables in the paper are originally created by the authors with the result of the paper and can be used without any copyright constraints.

Conflicts of Interest

The authors declare no conflict of interest.

References

  1. Al-Rkaby, A.H.; Chegenizadeh, A.; Nikraz, H.R. An experimental study on the cyclic settlement of sand and cemented sand under different inclinations of the bedding angle and loading amplitudes. Eur. J. Environ. Civ. Eng. 2019, 23, 971–986. [Google Scholar] [CrossRef]
  2. Al-Rkaby, A.H.; Nikraz, H.R.; Chegenizadeh, A. Stress and deformation characteristics of nonwoven geotextile reinforced sand under different directions of principal stress. Int. J. Geosynth. Ground Eng. 2017, 3, 34. [Google Scholar] [CrossRef]
  3. Park, J.-Y. A Critical Assessment of Moist Tamping and its Effect on the Initial and Evolving Structure of Dilatant Triaxial Specimens. J. Semin. Thromb. Hemost. 1999, 16, 1–20. [Google Scholar]
  4. De Gregorio, V.B. Loading systems, sample preparation, and liquefaction. J. Geotech. Eng. 1990, 116, 805–821. [Google Scholar] [CrossRef]
  5. Papadimitriou Achilleas, G.; Dafalias Yannis, F.; Mitsutoshi, Y. Plasticity modeling of the effect of sample preparation method on sand response. Soils Found. 2004, 45, 109–123. [Google Scholar] [CrossRef]
  6. Tatsuoka, F.; Ochi, K.; Fujii, S.; Okamoto, M. Cyclic undrained triaxial and torsional shear strength of sands for different sample preparation methods. Jpn. Geotech. Soc. 1986, 26, 23–41. [Google Scholar] [CrossRef]
  7. Li, T.T.; Wang, L.; Wang, S. Comparision of the shear strength of remolded clay soil samples prepared by different methods. Saf. Environ. Eng. 2012, 19, 152–156. (In Chinese) [Google Scholar]
  8. Guo, Y.; Wang, Y.X. Comparative test on consolidation undrained shear characteristics of undisturbed and remolded silt. J. Hydraul. Eng. 2011, 42, 68–75. (In Chinese) [Google Scholar]
  9. Zheng, J.; Ma, W.; Zhao, S.; Pu, Y. Development of the specimen-preparing technique for remoulded soil samples. J. Glaciol. Geocryol. 2008, 30, 494–500. (In Chinese) [Google Scholar]
  10. Lu, T.Y. Study on Unsaturated Shear Mechanical Properties and Micro-Mechanism of Site Silt; Zhongyuan University of Technology: Zhengzhou, China, 2019. (In Chinese) [Google Scholar]
  11. Li, C.Q.; Liang, G.Q.; Wu, X.Y.; Wang, L.L.; Xu, C.S. Study on the test of tensile strength of remolded loess. China Earthq. Eng. J. 2014, 36, 233–238+248. (In Chinese) [Google Scholar]
  12. Ren, K.B. Effects of Dry-Wet Cycle on Silt Mechanical Properties of Guchengzhai and Response Characteristics of the Wall; Zhengzhou University: Zhengzhou, China, 2019. (In Chinese) [Google Scholar]
  13. Hu, R.L.; Yue, Z.Q.; Tham, L.G.; Wang, L.C. Digital image analysis of Dynamic Compaction Effects on clay fills. J. Geotech. Geoenviron. Eng. 2005, 131, 1411–1422. [Google Scholar] [CrossRef]
  14. Qian, F.G.; Jrad, M.; Hattab, M.; Fleureau, J.-M.; Ameur, L.I. Pore morphology, porosity, and pore size distribution in Kaolinitic Remolded Clays under triaxial loading. Int. J. Geomech. 2020, 20, 04020057. [Google Scholar]
  15. Liu, Z.N.; Zhang, R.; Tang, D.L.; Liu, Z.J.; Zhou, Y. Influence of microstructure of expansive soil on swelling behavior. J. Civ. Environ. Eng. 2022, 1–11. Available online: http://kns.cnki.net/kcms/detail/50.1218.TU.20220128.2336.006.html (accessed on 22 December 2022). (In Chinese).
  16. Zhang, T.; Cai, G.; Liu, S. Reclaimed lignin-stabilized silty soil: Undrained shear strength, atterberg limits, and microstructure characteristics. J. Mater. Civ. Eng. 2018, 30, 04018277. [Google Scholar] [CrossRef]
  17. Pang, X.Q.; Hu, Z.Q.; Li, H.R.; Jiao, L.J. Structure damage evolution and mechanical properties of loess by CT-triaxial test. J. Hydraul. Eng. 2016, 47, 180–188. (In Chinese) [Google Scholar]
  18. Ren, K.B.; Wang, B.; Li, X.M.; Yin, S. Influence of the compaction procedure on mechanical behaviors and pore characteristics of silts. Chin. J. Rock Mech. Eng. 2019, 38, 842–851. (In Chinese) [Google Scholar]
  19. Lv, X. The Influence of Fines Content on the Dynamic Characteristics and Microstructure of Silt; Zhejiang University of Technology: Zhejiang, China, 2016. (In Chinese) [Google Scholar]
  20. Ren, H.P.; Liu, X.Z.; Xuan, M.M.; Ye, X.Y.; Li, Q.; Zhang, S. Study on cumulative plastic deformation of compacted silt under cyclic loading. Rock Soil Mech. 2021, 42, 1045–1055. [Google Scholar]
  21. Lei, Y.; Zhang, S.; Ye, X.; Xuan, M.; Liu, X. Determination of the critical dynamic stress for airport subgrade based on the serviceable performance. Transp. Geotech. 2022, 37, 100832. [Google Scholar] [CrossRef]
  22. MH/T 5027-2013; Standard for Civil Aviation Administration of China, Code for Geotechnical Design of Civil Airports. China Civil Aviation Press: Beijing, China, 2013. (In Chinese)
  23. ASTM D4767-2011; Standard Test Method for Consolidated Undrained Triaxial Compression Test for Cohesive Soils. American Society for Testing and Materials: Philadelphia, PA, USA, 2020.
  24. Dean, S.; You, G. Water retention behaviour of soils with different preparations. Chin. J. Geotech. Eng. 2015, 37, 91–97. (In Chinese) [Google Scholar]
  25. Li, Z.; Chen, Y.; Zhou, Y.; Bian, X. Field Rebound and Recompression Curve of Soft Clay. Geotech. Test. J. 2021, 44, 67–86. [Google Scholar] [CrossRef]
  26. Della, N.; Arab, A.; Belkhatir, M. Drained and undrained shear strength of silty sand: Effect of reconstitution methods and other parameters. Geol. Croat. 2011, 64, 163–171. [Google Scholar] [CrossRef]
  27. Nie, R.S.; Sun, B.L.; Leng, W.M.; Li, Y.F.; Ruan, B. Resilient modulus of coarse-grained subgrade soil for heavy-haul railway: An experimental study. Soil Dyn. Earthq. Eng. 2021, 150, 106959. [Google Scholar] [CrossRef]
  28. Nguyen, T.T.; Indraratna, B.; Singh, M. Dynamic parameters of subgrade soils prone to mud pumping considering the influence of kaolin content and the cyclic stress ratio. Transp. Geotech. 2021, 29, 100581. [Google Scholar] [CrossRef]
  29. Wang, J.H.; Ling, X.Z.; Li, Q.L.; Zhang, F.; Li, Y. Accumulated permanent strain and critical dynamic stress of frozen silty clay under cyclic loading. Cold Reg. Sci. Technol. 2018, 153, 130–143. [Google Scholar] [CrossRef]
  30. Ling, D.S.; Zhang, F.; Zhao, Y.; Huang, B.; Zhou, Y.G. Dynamic Response analysis of non-uniform Foundation under Aircraft Load. China Civ. Eng. J. 2017, 50, 97–109. (In Chinese) [Google Scholar]
  31. Ling, D.S.; Wang, Y.L.; Zhao, Y.; Huang, B.; Zhou, Y.G. Analysis of the dynamic response of the roadbed under the moving load of the aircraft main landing gear. Chin. J. Geotech. Eng. 2018, 40, 64–73. (In Chinese) [Google Scholar]
Figure 1. Particle size distribution curve.
Sustainability 15 02635 g001
Figure 2. Sample preparation process.
Sustainability 15 02635 g002
Figure 3. Stress–strain relationship curves for the dry density of (a) 1.66 g/cm3, (b) 1.72 g/cm3 and (c) 1.78 g/cm3.
Sustainability 15 02635 g003aSustainability 15 02635 g003b
Figure 4. Relationship between the shear strength and confining pressure.
Sustainability 15 02635 g004
Figure 5. Relationship between shear strength and dry density.
Sustainability 15 02635 g005
Figure 6. Differences in the shear strength parameters caused by the sample preparation methods.
Sustainability 15 02635 g006
Figure 7. Pore size distribution of the samples under different sample preparation methods for the dry density of (a) 1.66 g/cm3, (b) 1.72 g/cm3 and (c) 1.78 g/cm3.
Sustainability 15 02635 g007aSustainability 15 02635 g007b
Figure 8. Comparison diagram of pore size distribution before and after the CU test under the dry density of (a) 1.66 g/cm3 for compaction method, (b) 1.66 g/cm3 for static compression method, (c) 1.72 g/cm3 for compaction method, (d) 1.72 g/cm3 for static compression method, (e) 1.78 g/cm3 for compaction method, (f) 1.78 g/cm3 for static compression method.
Sustainability 15 02635 g008
Figure 9. Schematic Diagram of Loading.
Sustainability 15 02635 g009
Figure 10. The permanent strain under the dry density of (a) 1.76 g/cm3 for compaction method and (b) 1.76 g/cm3 for static compression method.
Sustainability 15 02635 g010
Figure 11. Difference of permanent deformation under different sample preparation methods.
Sustainability 15 02635 g011
Figure 12. The rebound modulus under the dry density of (a) 1.76 g/cm3 for compaction method and (b) 1.76 g/cm3 for static compression method.
Sustainability 15 02635 g012
Table 1. Basic physical properties of silty soil.
Specific GravityLiquid Limit/%Plastic Limit/%Plasticity IndexMaximum Dry Density/g/cm3Optimum Water
Content/%
Size Composition
Sand Grain/%Powder
Particle/%
Clay
Particle/%
(2–0.075 mm)(0.075–0.005 mm)(<0.005 mm)
2.6715.423.07.61.8713.147.246.76.1
Table 2. Test scheme.
Dry Density/g/cm3Sampling MethodsQuantity for Aperture MeasurementQuantity for Aperture Measurement
(Off-Test)
1.66compaction method1 4
static compression method1 4
1.72compaction method14
static compression method14
1.78compaction method14
static compression method14
Table 3. Differences in the shear strength values caused by the sample preparation methods.
Initial Water
Content/%
SaturationDry Density/g/cm3Confining Pressure/kPa
%100200300400
13.157.51.6674.872.732.842.2
13.163.31.7297.267.3(20.4)(10.7)
13.170.01.78126.923.2(32.2)86.4
Note: The numbers in the parentheses are negative values.
Table 4. Shear strength index.
Initial Water
Content/%
Saturation
/%
Dry Density/g/cm3Compaction MethodStatic Compression Method
CohesionInternal Friction
Angle
CohesionInternal Friction Angle
c/kPac/kPa
13.157.51.6658.825.026.429.3
13.163.31.7250.528.89.732.1
13.170.01.7823.135.11.435.9
Table 5. Dynamic Triaxial Test Scheme.
Confining Pressure (kPa)Dry
Density (g/cm3)
Saturation
(%)
Dynamic Stress
Amplitude (kPa)
Sample Preparation Method
601.7667.460, 80, 100, 120, 140, 180, 220Compaction method, static compression method
Disclaimer/Publisher’s Note: The statements, opinions and data contained in all publications are solely those of the individual author(s) and contributor(s) and not of MDPI and/or the editor(s). MDPI and/or the editor(s) disclaim responsibility for any injury to people or property resulting from any ideas, methods, instructions or products referred to in the content.

