Article

Land Subsidence Characteristics and Numerical Analysis of the Impact on Major Infrastructure in Ningbo, China

1
Ningbo Administration and Service Centre for Marine and Ecological Restoration of Natural Resources, Ningbo 315000, China
2
School of Civil Engineering & Architecture, NingboTech University, Ningbo 315100, China
3
Institute of Wenzhou, Zhejiang University, Wenzhou 325000, China
*
Author to whom correspondence should be addressed.
Sustainability 2023, 15(1), 543; https://doi.org/10.3390/su15010543
Submission received: 7 November 2022 / Revised: 20 December 2022 / Accepted: 24 December 2022 / Published: 28 December 2022

Abstract

:
For the construction and safe operation of major infrastructure in coastal cities, the impact of regional land subsidence that has occurred or is slowly proceeding deserves attention. Previous studies have mainly focused on the surrounding land subsidence caused during construction or operation, as well as the superposition effect of land subsidence caused by groundwater extraction. However, research on the different impacts of damage due to land subsidence in the construction and operation of urban infrastructure needs to be carried out according to the actual geological environmental conditions, reflected in parameters such as the soil properties and common loads. Numerical simulation cannot fully reflect the details of reality; however, it can avoid the influence of other conditions to focus on different factors influencing land subsidence and thus highlight the contribution of a single factor influencing land subsidence. Therefore, in this paper, we adopt field measurement data and carry out a numerical simulation analysis of different influencing factors. First, taking the Ningbo Jiangdong subsidence center (now located in Yinzhou District) as an example, area growth, cumulative subsidence and the occurrence and development of the subsidence rate of a typical urban subsidence funnel area are analyzed. Then, taking the Ningbo Chunxiao–Meishan area as an example, based on the physical and mechanical characteristics of the main soil layers in the coastal reclamation area, a numerical analysis of the self-weight/backfill and surcharge consolidation settlement of the soil layer (considering the water permeability/impermeability of the bottom surface) and a numerical analysis of the nonuniform settlement caused by pile foundation engineering are carried out. Finally, the Ximenkou–Gulou area is taken as the analysis object. Numerical simulation of metro tunnel pipeline deformation is carried out considering uniform/nonuniform settlement. The results show that the comprehensive prohibition of groundwater exploitation is beneficial to slow the land subsidence rate, while the sedimentation of silty clay in Layer 4 (muddy clay) is the largest among all the soil layers. Compared with uniform settlement, nonuniform settlement is more likely to cause connection failure between tunnel segments. The above research results can provide references for the prevention and control of land subsidence and thus the safe operation of major infrastructure.

1. Introduction

Land subsidence refers to an environmental geological phenomenon caused by regional ground elevation reduction due to surface soil compression under the action of natural or anthropogenic factors [1], which has the characteristics of a long duration [2], wide range of influence [3], complex genetic mechanism and great difficulty in prevention and control [4]. The main causes of urban land subsidence are soil properties, external loads, the continuous decline in groundwater levels and engineering construction [5,6,7,8]. Under the combined action of these factors, the magnitude of land subsidence gradually accumulates.
As most cities in China take measures to limit or prohibit the exploitation of groundwater [9] and the scale of urban engineering construction continues to increase, the problem of land subsidence around engineering projects has become increasingly prominent. Ningbo is a Chinese city with serious land subsidence, which was initially attributed to the long-term massive exploitation of groundwater. However, with the prohibition of groundwater overuse, the continuous expansion of the urban construction scale, the formation of a large number of high-rise buildings and the rapid development of rail transit, land subsidence caused by ground loading and deep foundation pit engineering has become a new factor [10,11]. Additionally, the deep soft soil widely existing in Ningbo [12] has further aggravated land subsidence around engineering projects. The geotechnical properties of soils with different bearing values and plasticity [13,14] at different depths show different impacts on major infrastructure. Regarding the widespread soft soil in Ningbo, previous studies on specific research objectives have depended on empirical judgments of the soil properties.
Regarding land subsidence around engineering projects, previous studies have mainly focused on the surrounding land subsidence caused during construction or operation, as well as the superposition effect of land subsidence caused by groundwater extraction [15]. A comparison of land subsidence conditions based on previous studies is shown in Table 1.
However, more attention should be given to the impact of regional land subsidence that has occurred or is slowly proceeding on the safe operation of major urban engineering construction or major infrastructure. The occurrence and development of land subsidence will have varying degrees of impact on high-speed railways, rail transit, urban viaducts, trunk roads, urban flood dikes, etc. [22,23], and will even cause engineering disasters. Taking subway shield tunnels with long lines and considerable safety requirements as an example, nonuniform land subsidence will have an impact on both unfinished and completed subways [24]. When the deformation exceeds the range that the tunnel can bear, the subway tunnel cannot operate normally. Additionally, tunnel linings are prone to cracks, water leakage, large deformation and other hazards [25], and the most serious consequence is the overall damage of the tunnel.
During the 2021–2026 period, Ningbo will continue to build five rail transit projects, including Line 6 phase I, Line 7, Line 8 phase I, Line 1 west extension and Line 4 extension, with a total mileage of approximately 106.5 km. The number of metro lines passing through the urban core is becoming increasingly dense, and the number of metro lines leading to the coastal area has increased. Considering the realistic background of the acceleration of major infrastructure construction in Ningbo, in the future, corresponding prevention and control measures for land subsidence should be proposed from the level of government and social needs, which will help ensure the safety of major engineering construction and facility operation and provide a policy basis for the prevention and control management of land subsidence.
Combined with the current characteristics of land subsidence in Ningbo and its future development trend, this study intends to carry out research on the damage of land subsidence to the construction and operation of urban infrastructure according to the actual geological environment conditions. Field measurements can provide accurate data, but the mechanisms controlling different factors influencing land subsidence are lacking. Numerical simulation cannot fully reflect the details of reality; however, it can avoid the influence of other conditions to focus on different factors influencing land subsidence and thus highlight the contribution of a single factor influencing land subsidence. Therefore, in this paper, we adopt field measurement data and carry out numerical simulation analysis for different influencing factors. The main research content is to obtain the development of land subsidence under various factors, such as undersurface permeability/impermeability, dead weight and backfill, according to the physical and mechanical characteristics of the main soil layers in coastal areas. Furthermore, we aim to understand the influence of nonuniform land subsidence on the deformation of metro tunnel pipelines.

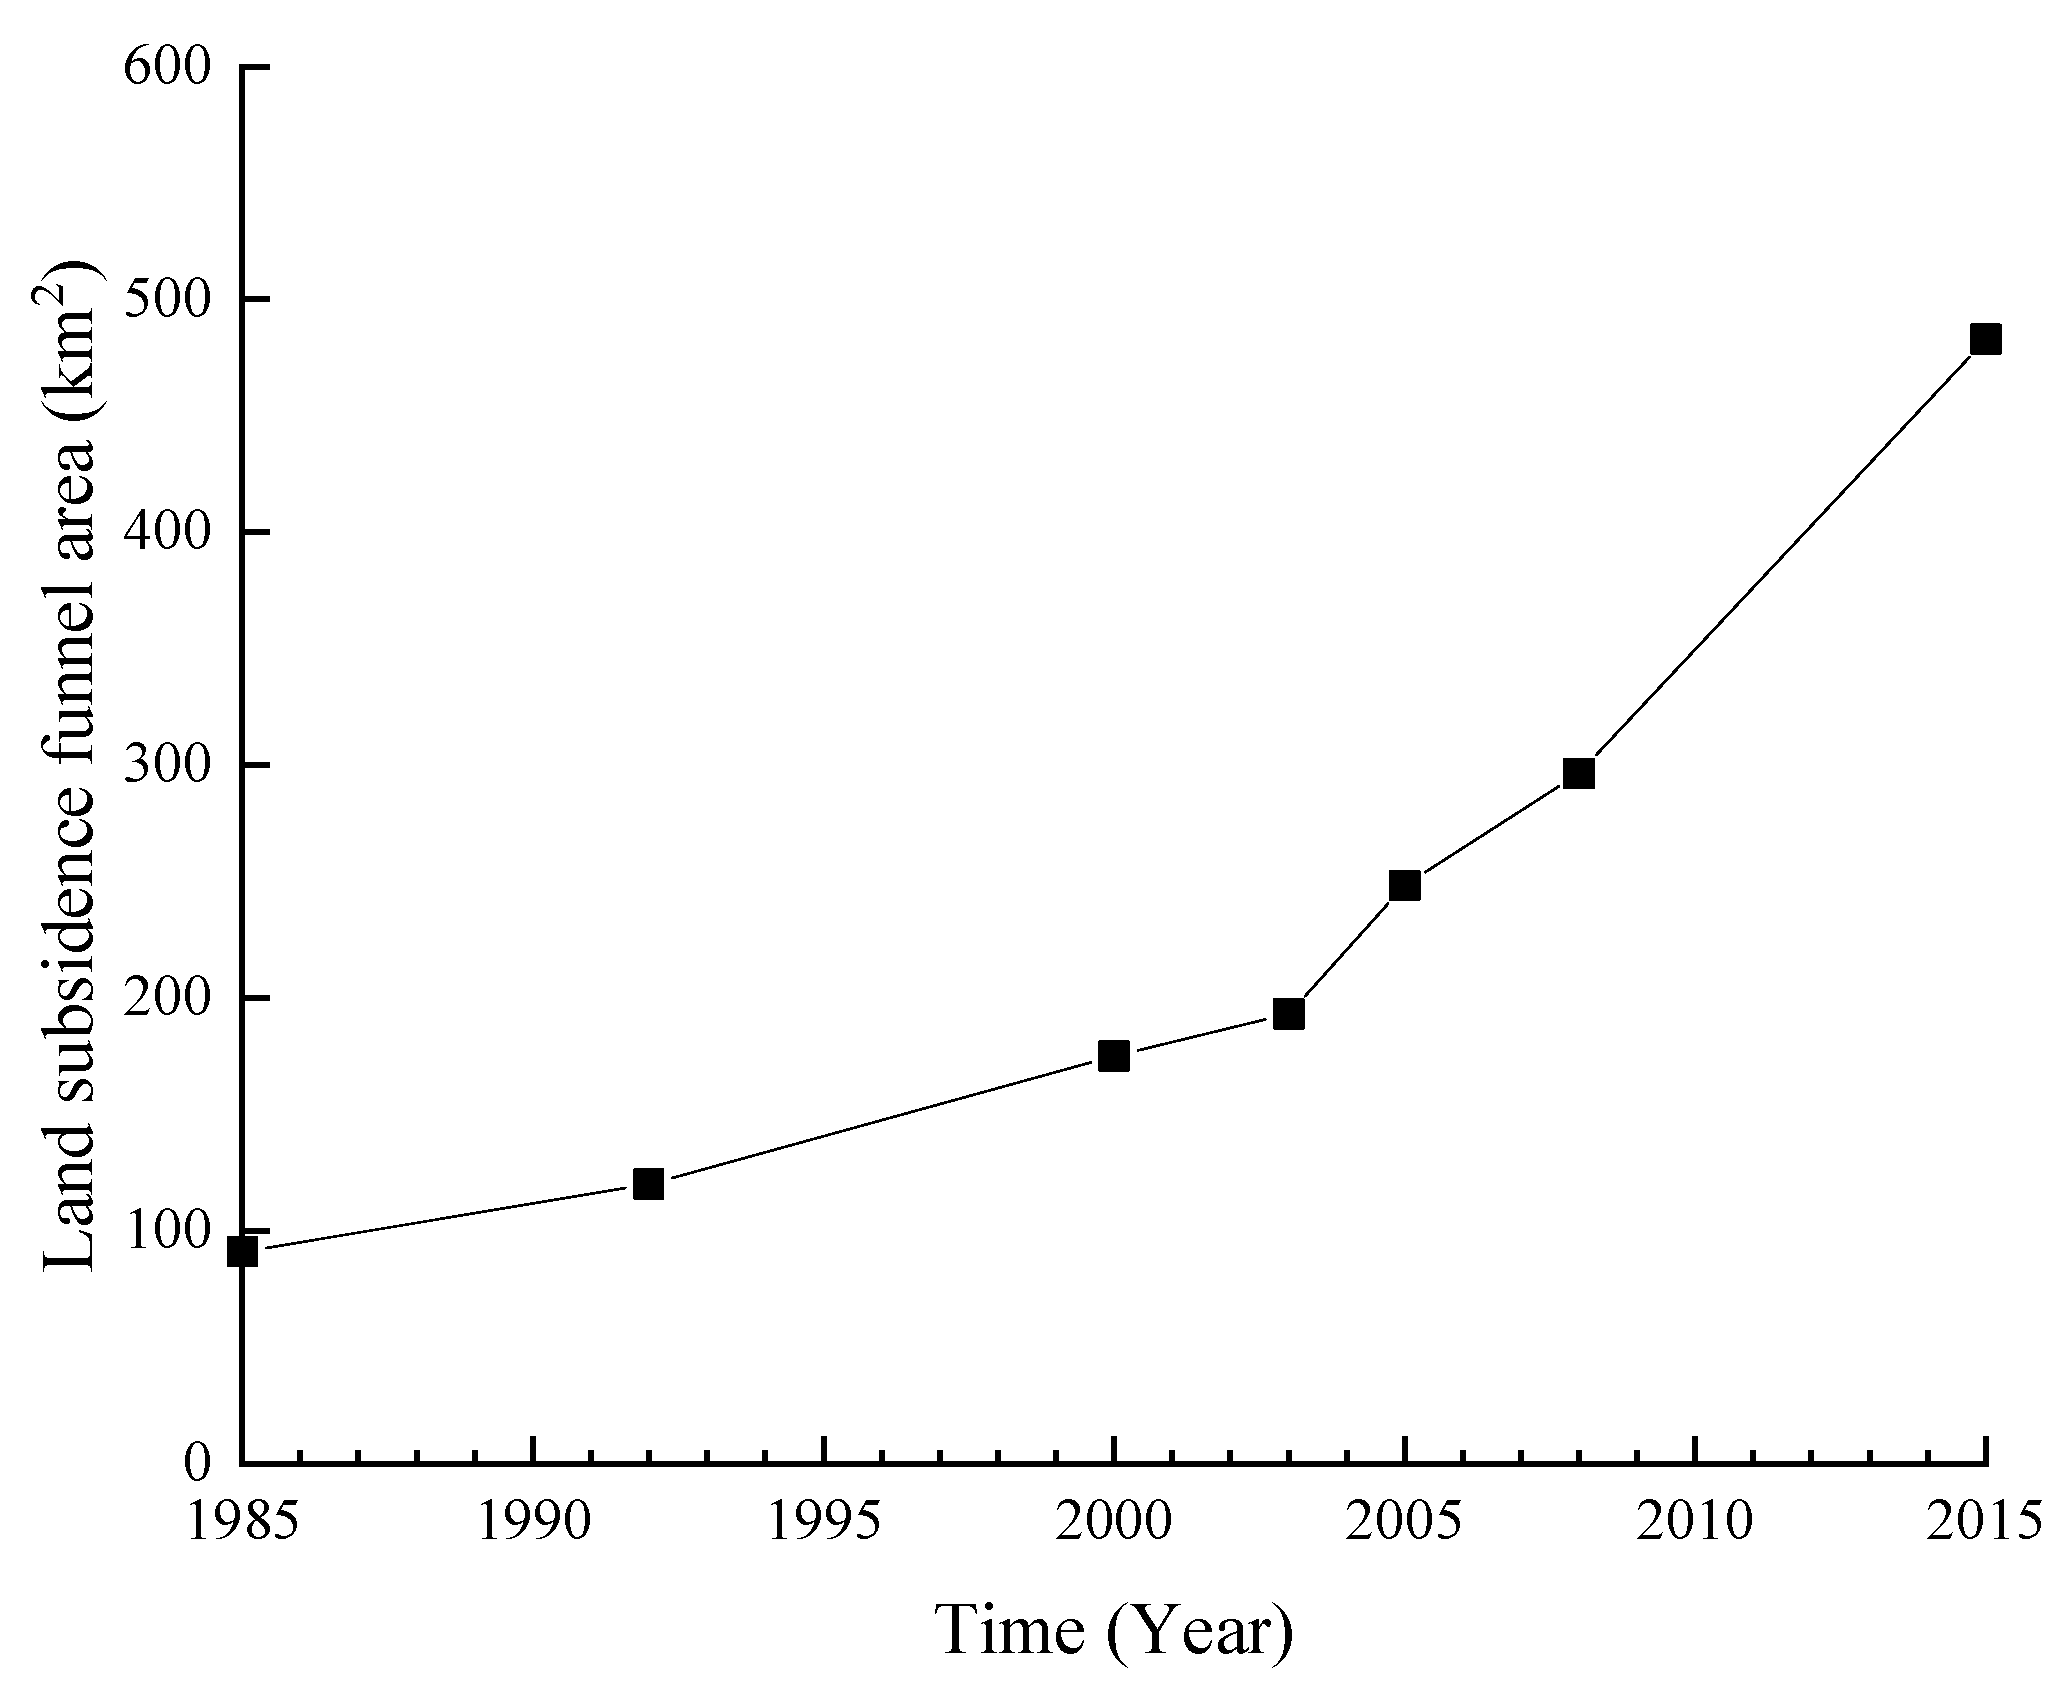
2. Analysis of the Regional Characteristics of Typical Subsidence Funnels in Urban Areas

Ningbo is one of the Chinese cities with serious land subsidence. In 1977, two obvious subsidence centers formed: the Jiangdong–Hefeng subsidence center and the Jiangbei–Kongpu subsidence center. The subsidence amounts are 161 mm and 175 mm, respectively, and the subsidence rate in each subsidence center area is greater than 15 mm/a. Since 1978, with the rapid increase in groundwater exploitation required by the urban industry, the exploitation scope has been expanding, the groundwater level has been declining and the land subsidence funnel and the cumulative subsidence have gradually increased. By 1985, groundwater exploitation had peaked, and the annual settlement rate of the Jiangdong subsidence center reached a maximum of 35.3 mm/a. Since 1986, the Ningbo Municipal Government has implemented measures such as groundwater exploitation limits and artificial groundwater recharge. Although the funnel area of land subsidence has gradually expanded and the cumulative value of land subsidence has also increased, the growth rate of land subsidence has begun to slow. By 2008, the collection of groundwater was completely prohibited in the Ningbo urban area, and the land subsidence caused by groundwater exploitation was gradually controlled.
The metro lines in operation and under construction near the Ningbo Jiangdong subsidence center are relatively dense, and land subsidence continues to develop, even after groundwater extraction prohibitions. According to the annual land subsidence monitoring data of Ningbo city, the Ningbo Jiangdong subsidence center is divided into three subsidence stages, and the characteristics of land subsidence in different stages are shown in Table 2.
The average subsidence rate in the central city is 7.2 mm/a, which is 0.5 mm/a less than that in 2017, and below 10 mm/a, which mainly shows a weak development characteristic, indicating that the land subsidence in the monitored urban areas has tended to be gentle overall. We extracted the land subsidence monitoring data of the Jiangdong subsidence center and plotted Figure 1 and Figure 2.
Figure 1 shows the growth of the land subsidence funnel area of the Jiangdong subsidence center. Although the cumulative subsidence has decreased, the urban subsidence funnel area has increased significantly due to the construction development brought about by urban expansion.
Figure 2 shows the variations in the cumulative subsidence and subsidence rate of the Jiangdong subsidence center since 1985.
Figure 2 illustrates that despite an increase in the overall amount of subsidence, the rate of subsidence has declined over time. The latter eventually decreased to 1.6 mm/a in 2021.

3. Numerical Analysis of Engineering Subsidence in Coastal Reclamation Areas

For the Ningbo coastal area, taking the Chunxiao–Meishan coastal plain as an example, its formation time is short, the soft clay layer is deeply distributed and the foundation is generally in a state of underconsolidation, which results in large consolidation subsidence under the action of its self-weight. To further clarify the mechanism of land subsidence in this area, the finite element software ABAQUS was used for modeling, and a numerical analysis of the self-weight consolidation subsidence of the soil layer, a numerical analysis of the backfill surcharge subsidence (considering the water permeability/impermeability of the bottom surface) and a nonuniform subsidence numerical analysis were carried out.

3.1. Self-Weight Consolidation Settlement

The Geely Chunxiao Apartment Project is located on Chunxiao Street, Beilun District, Ningbo city, which is a typical coastal area in Ningbo. Taking the area where the Geely Chunxiao Apartment Project is located as an example, each soil layer thickness and physical and mechanical property index are valued according to the ZK8 (Borehole No. 8) survey point, and the soil layers are sequentially numbered top-down, as shown in Table 3. The plane strain model is used to calculate the consolidation process of the soil layer under self-weight stress. The boundary conditions are fixed at the bottom, the horizontal displacement is limited at the left and right sides, the top surface is permeable and the bottom surface is permeable/impermeable.
Under the self-weight consolidation condition, the development processes of the total land subsidence and the subsidence of each soil layer with increasing consolidation time are shown in Figure 3 and Figure 4.
Figure 3 shows that the deep soft soil layer leads to a very long consolidation time, which is approximately 100 years when the bottom surface is impervious and approximately 25 years when the bottom surface is permeable. When the bottom surface is impervious, the land subsidence rates during 0–20 years, 20–40 years and 40–60 years are 32.5 mm/a, 16.5 mm/a and 5.8 mm/a, respectively. When the bottom surface is permeable, the land subsidence rates from 0 to 5 years, 5 to 10 years and 10 to 15 years are 130 mm/a, 66 mm/a and 23.2 mm/a, respectively.
Figure 4 shows the subsidence over time for impermeable and permeable surfaces. Among all the soil layers, the subsidence of the fourth layer is the largest, exceeding 600 mm, accounting for more than 50% of the total subsidence, while the subsidence of the other layers is below 10%. Therefore, the fourth layer is the main source of stratum subsidence in this area, and reasonable treatment methods should be proposed for this muddy clay layer during foundation treatment.

3.2. Consolidation Subsidence under Backfill and Surcharge

The original ground elevation of the study area is generally approximately 2.0 m, which is calculated according to the construction site elevation of 3.5 m after leveling; this area generally needs to be backfilled with approximately 1.5 m slag in this area (gravity was calculated to be 20 kN/m3). The same finite element model in Section 3.1 was used to calculate the consolidation process of the foundation after backfilling and loading.
Figure 5 shows that the total land subsidence increases by approximately 20% to 1.48 m after the slag is backfilled.
Figure 6 shows that the subsidence increases by 25 mm, 55 mm, 125 mm, 11 mm, 14 mm, 14 mm and 10 mm in each layer from top to bottom. The shallow soil layer (Layer 1, Layer 2 and Layer 4) has a large subsidence increase, accounting for 80% of the total subsidence increase, while the deep soil layer (Layer 5, Layer 6, Layer 7 and Layer 8) has a small subsidence increase. The surcharge on the underconsolidated foundation will cause a large range of additional subsidence in the shallow soil layer, and reasonable measures should be taken to reinforce the shallow soil layer.

3.3. Nonuniform Subsidence Caused by Pile Foundation Engineering

According to the site investigation, the buildings in the area are generally faced with serious nonuniform subsidence. In this project, φ600 bored piles were used (the properties of the pile were considered linear elastic, and the material parameters were those of C30 concrete), the bearing layer was Layer 8 (silty sand) and the characteristic value of the bearing capacity of a single pile was approximately 1200 kN. The plane strain finite element model and mesh division are shown in Figure 7. The width of the model is 100 m. The pile is located in the middle of the foundation. The soil layer is the same as in Section 3.1. The boundary condition is that the bottom is fixed. The horizontal displacement is limited on the left and right sides, and the top and bottom surfaces are permeable. It was assumed that the pile is driven 2.5 years after the foundation is consolidated. The calculation results of nonuniform subsidence caused by pile foundation engineering are shown in Figure 8 and Figure 9.
Figure 9 shows that when the pile enters Layer 8 (silty sand), the subsidence of the pile itself is small, while the soil layer around the pile produces large consolidation subsidence under the additional stress caused by the self-weight and pile side resistance, resulting in nonuniform subsidence between the pile and soil, and the final nonuniform subsidence reaches 560 mm. In the first five years after the pile is driven, the nonuniform subsidence of the pile and soil develops rapidly. The nonuniform subsidence reaches approximately 300 mm, and the nonuniform subsidence rate is approximately 60 mm/a. Then, the nonuniform subsidence rate slows and becomes stable.

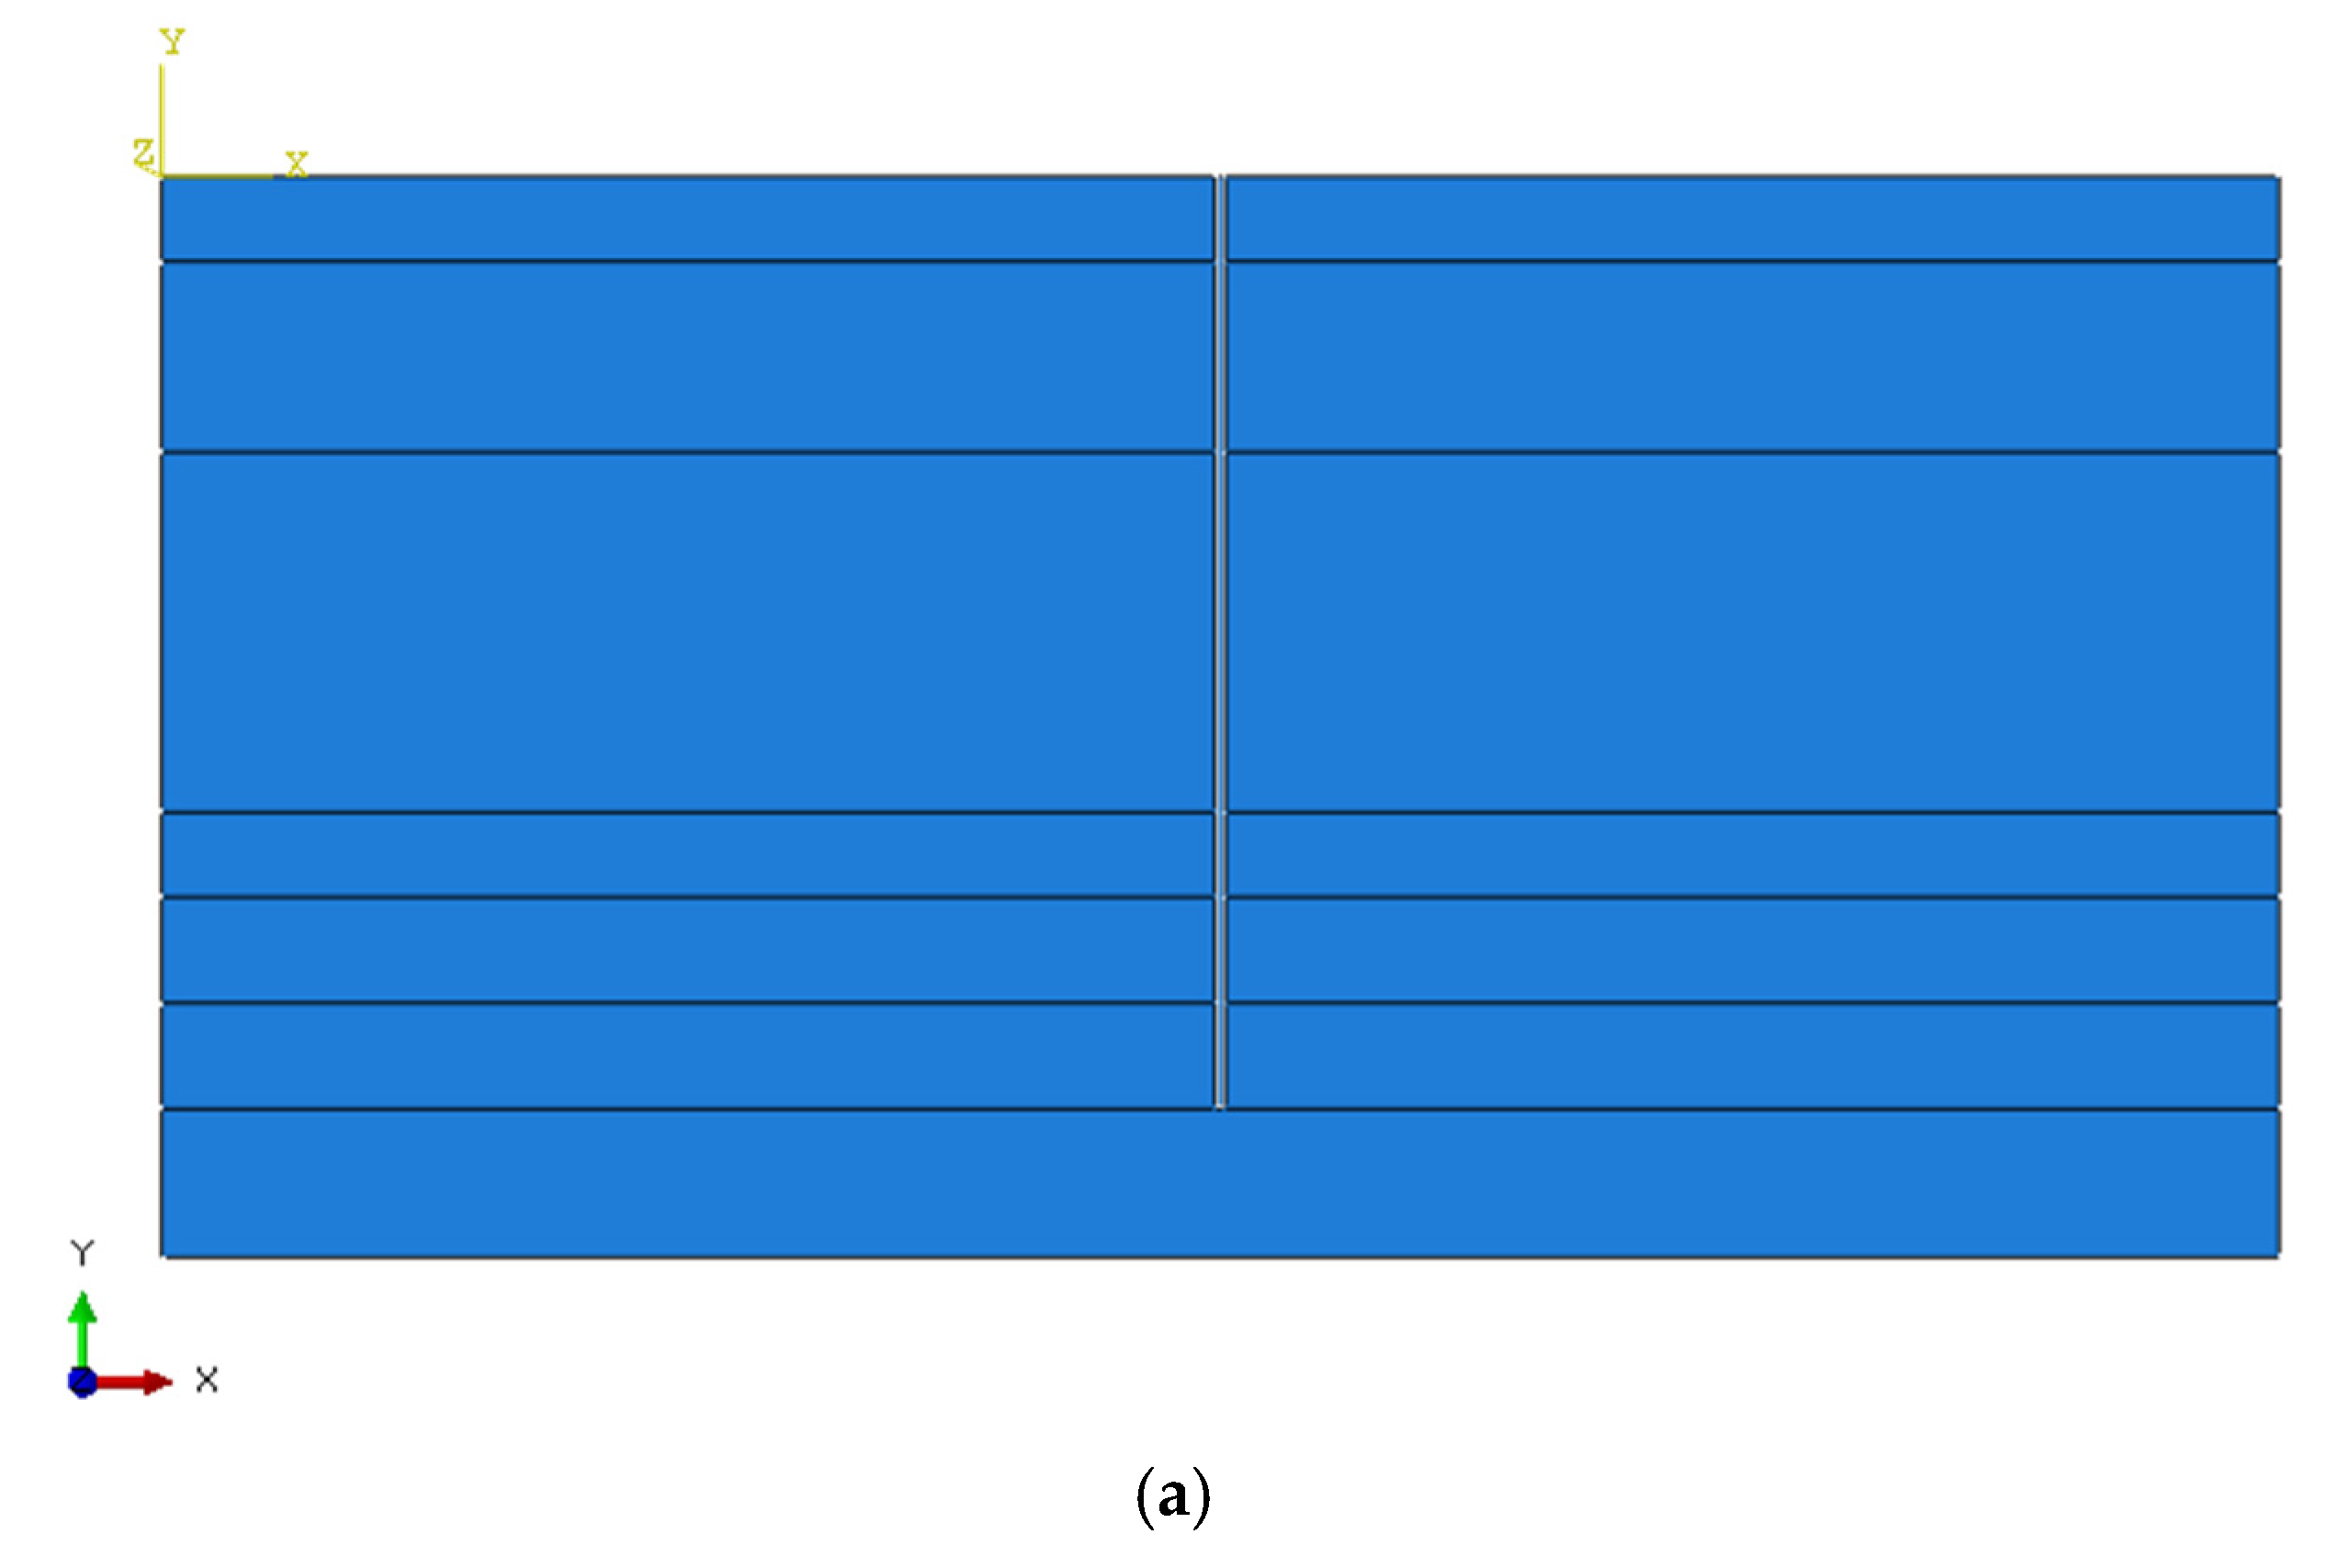
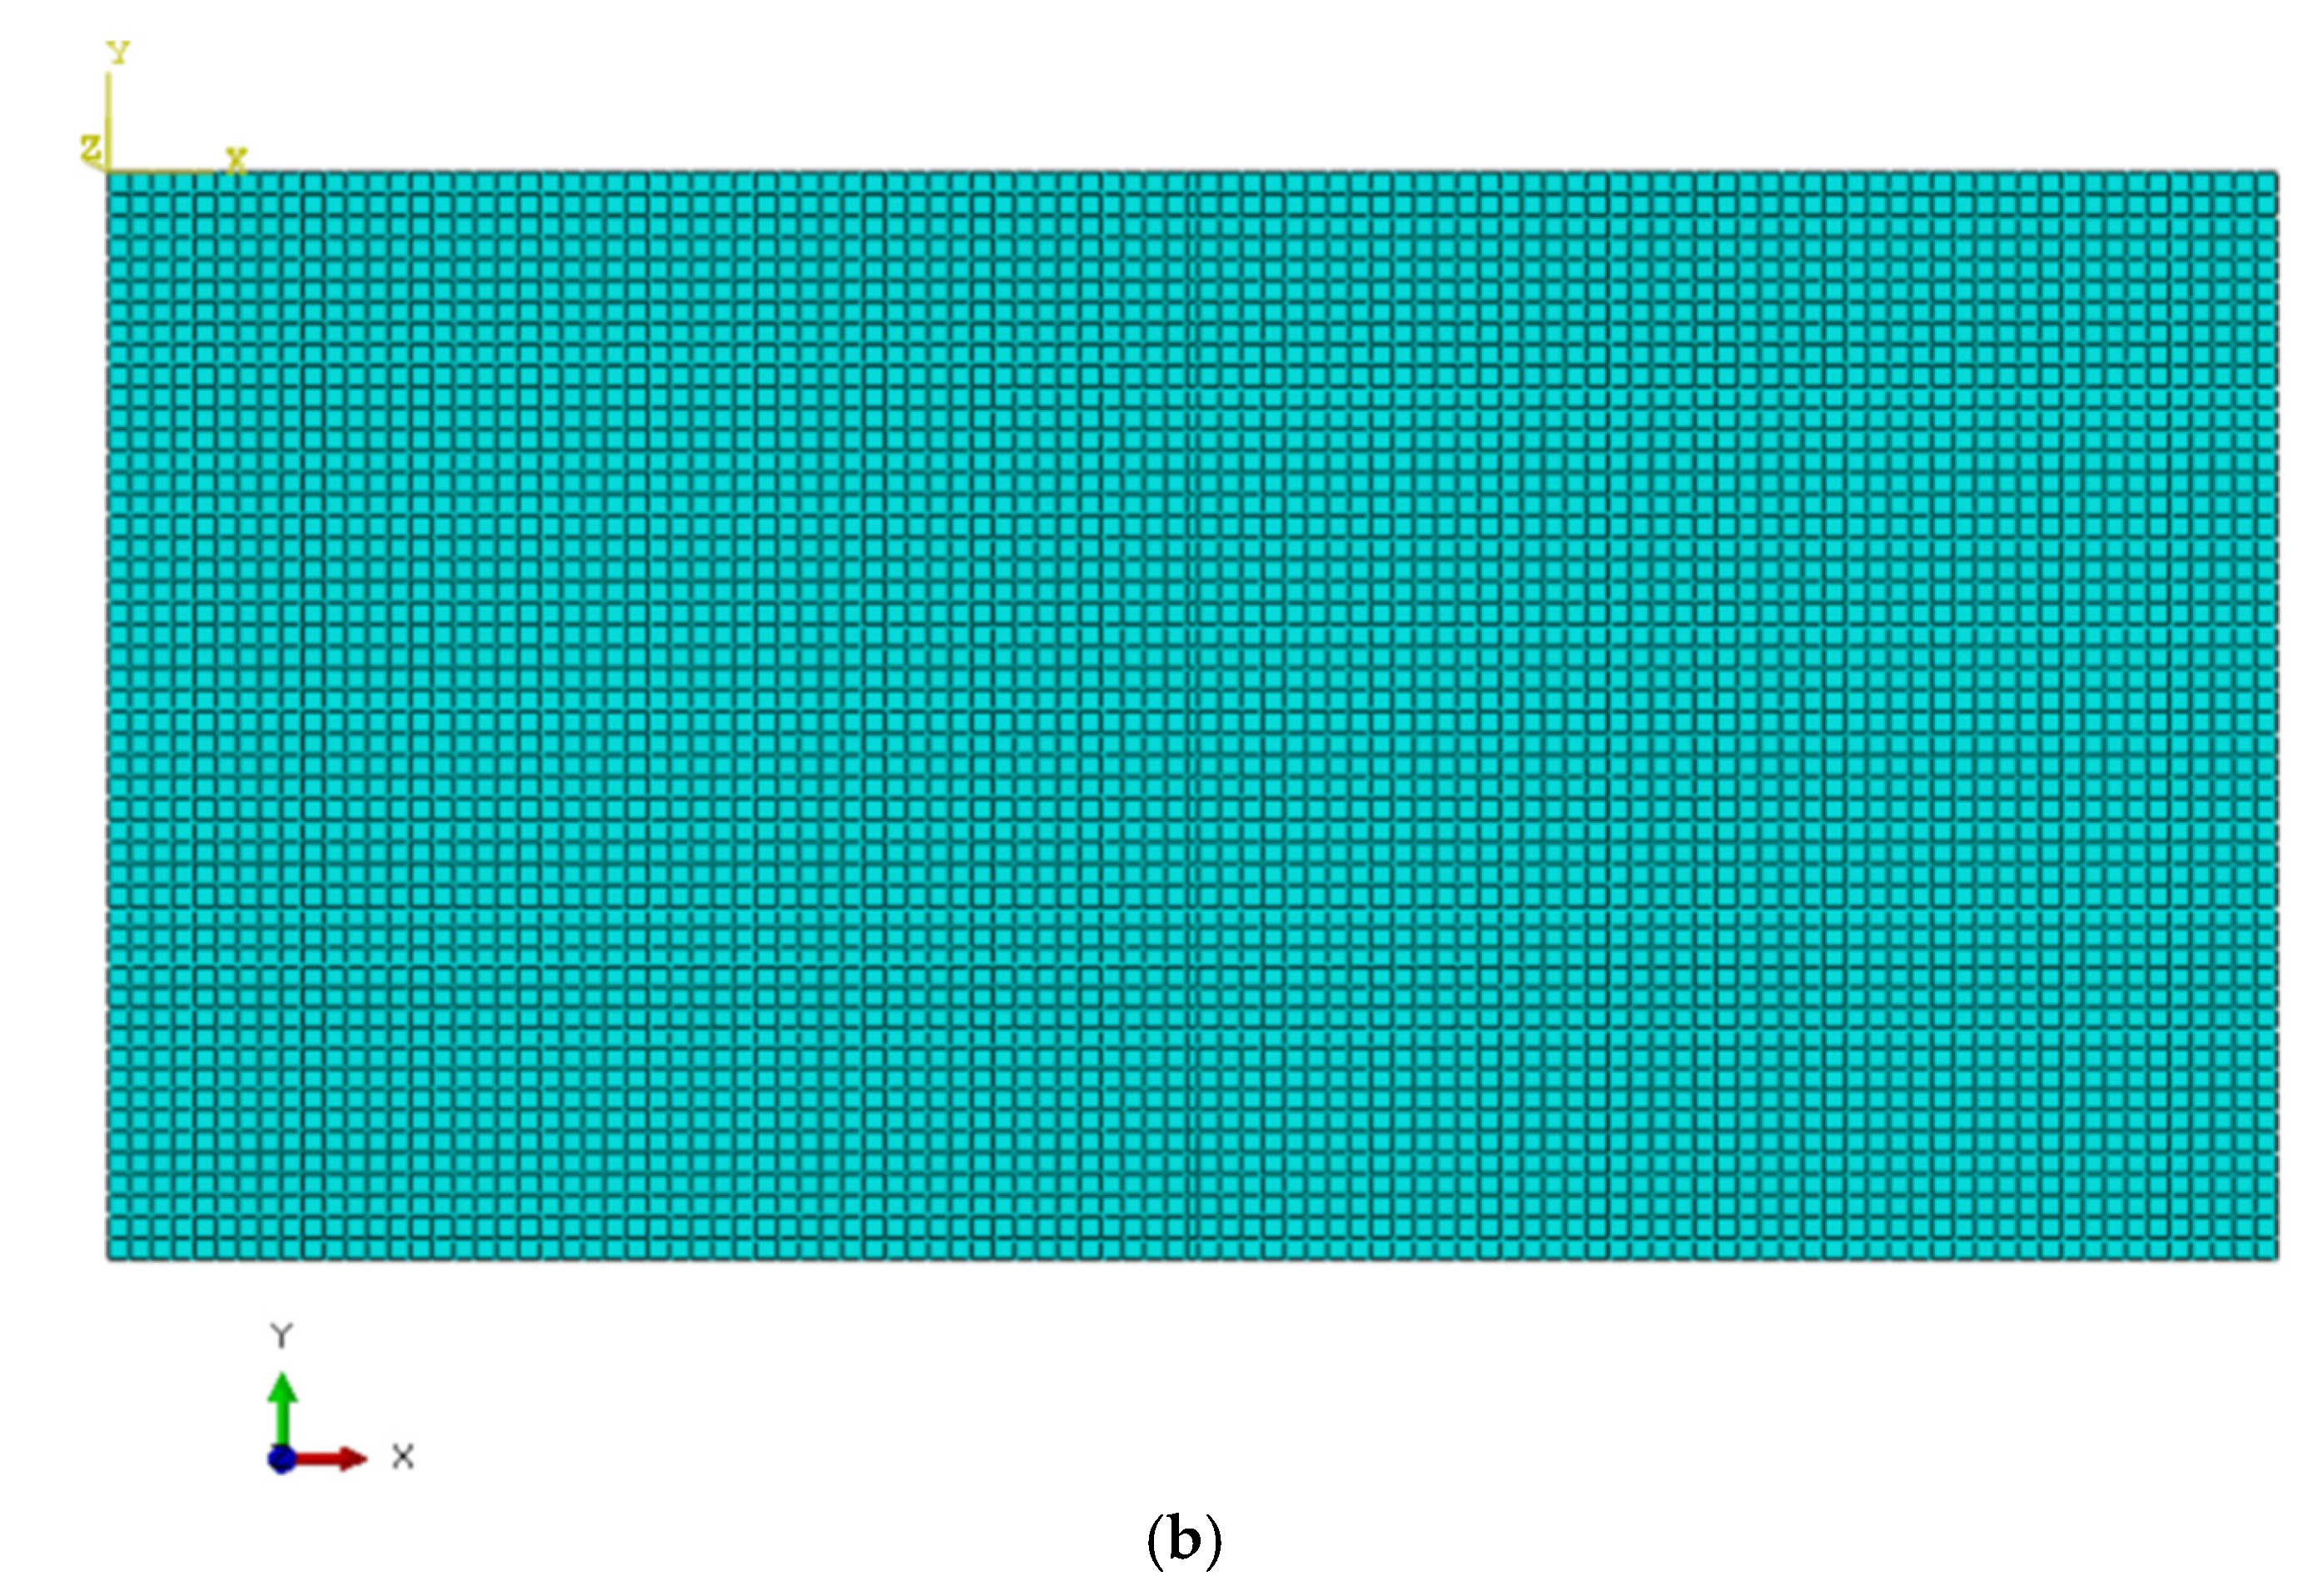
4. Numerical Analysis of the Impact of Land Subsidence on the Deformation of Metro Tunnel Pipelines

During the construction of rail transit, the excavation of underground shield tunnels is also likely to cause the development of land subsidence [26,27,28]. To clarify the mechanism of land subsidence in metro tunnels, this project takes the Ximenkou–Gulou section in the Ningbo urban area as the object to carry out numerical analysis of the impact of uniform/nonuniform land subsidence on the deformation of metro tunnel pipelines, providing a reference for the prevention and control of land subsidence around engineering projects.

4.1. Uniform Land Subsidence

According to the geotechnical engineering investigation report [29], the main soft soil layers in this area are Layer 2 (muddy clay) and Layer 4 (mucky silty clay), but the distribution of the soil layers varies greatly, as shown in Figure 10. Taking the XS-Z02 borehole data as a reference, the thickness and physical and mechanical property indices of each soil layer are shown in Table 4. The plane strain model was used to calculate the deformation and internal force of the metro tunnel when a large area of uniform land subsidence occurred. The finite element model and mesh division are shown in Figure 11. The burial depth of the tunnel center is 10.4 m, the inner diameter D is 6.2 m and the thickness of the segment and lining is 0.3 m, which is mainly located in Layer 2-2-2 (muddy clay). The segments are considered to be linearly elastic, and the material parameters are considered to be C50 concrete. The width of the whole calculation model is 10 times the diameter of the tunnel. The boundary conditions are as follows: fixed at the bottom and limited horizontal displacement at the left and right sides.
The relationship curve between the vertical shrinkage of the tunnel inner diameter and the land subsidence was calculated, as shown in Figure 12. In this range of land subsidence, the relationship between the tunnel inner diameter shrinkage and the land subsidence is basically linear. According to “Technical Specifications for Urban Rail Transit Engineering Inspection” (GB 50911-2013) [30], the control value of shield tunnel segment headroom shrinkage is 0.2% D. In this case, the corresponding land subsidence value was approximately 67 mm, which means that the shrinkage of the tunnel headroom reaches the upper limit of the specification.
Figure 13 shows that the tunnel inner diameter converges vertically and expands laterally under the formation pressure. At this time, the von Mises stress contour diagram of the tunnel segment shows that the von Mises stress peaks at both ends of the horizontal segment are at approximately 1.04 MPa, which is less than the tensile strength of the concrete. The segment does not crack, but the connection between segments may be damaged.

4.2. Nonuniform Land Subsidence

As mentioned in a previous study, nonuniform subsidence will have an impact on both unfinished and completed subways. There are many nonuniform subsidence areas in Ningbo city. When an underground pipeline passes through the nonuniform subsidence area, the surface will produce curvature deformation under the action of the nonuniform subsidence, and the pipeline and its auxiliary structure facilities will experience bending deformation. Therefore, the contact pressure is redistributed, and the bottom of the foundation changes from the horizontal plane to the curved surface, which leads to the bending or suspended state of the pipeline, resulting in an additional bending moment and shear force. In the area of positive curvature deformation of the ground, the pipeline bulges upward; in the negative curvature deformation area of the ground, the pipeline is depressed downward. This deformation will make it produce resistance to limit movement and deformation as with a cross brace, leading to structural damage or failure of the pipeline.
The soil layer parameters and tunnel geometric parameters used in the finite element model of nonuniform subsidence are the same as those in Section 4.1. The whole range of the calculation model is 124 m (20D) in the axial length and 62 m (10D) in the radial width of the tunnel. The boundary conditions are fixed on the bottom surface, and the four sides limit the displacement in the X and Y directions.
Figure 14 shows the vertical displacement of the stratum when 200 mm settlement occurs within a width of 1D at the axial center of the tunnel. Figure 15 shows the contour diagram of the vertical displacement and stress of the tunnel segment. The relationship curve between the shrinkage value of the tunnel inner diameter and land subsidence can be obtained as shown in Figure 16.
According to the tunnel clearance shrinkage limit of 0.2% D specified in “Technical Specifications for Urban Rail Transit Engineering Inspection” (GB 50911-2013) [30]. The corresponding ground settlement is 156 mm. At this time, the von Mises stress contour diagram of the tunnel segment is shown in Figure 15b. The von Mises stress of the segment at the center of the settlement trough is the largest, reaching approximately 5.1 MPa, which far exceeds the tensile strength of the concrete. This segment is likely to crack, and the connection between segments may also fail.

5. Conclusions

In this study, we analyzed the typical settlement funnel area and its characteristics in the central urban area of Ningbo and carried out numerical analyses of the self-weight/backfill consolidation settlement in the coastal reclamation area, the nonuniform subsidence caused by pile foundation engineering and the impact of land subsidence on the metro tunnel, especially the deformation of the tunnel inner diameter under uniform/nonuniform subsidence conditions. The main conclusions were as follows:
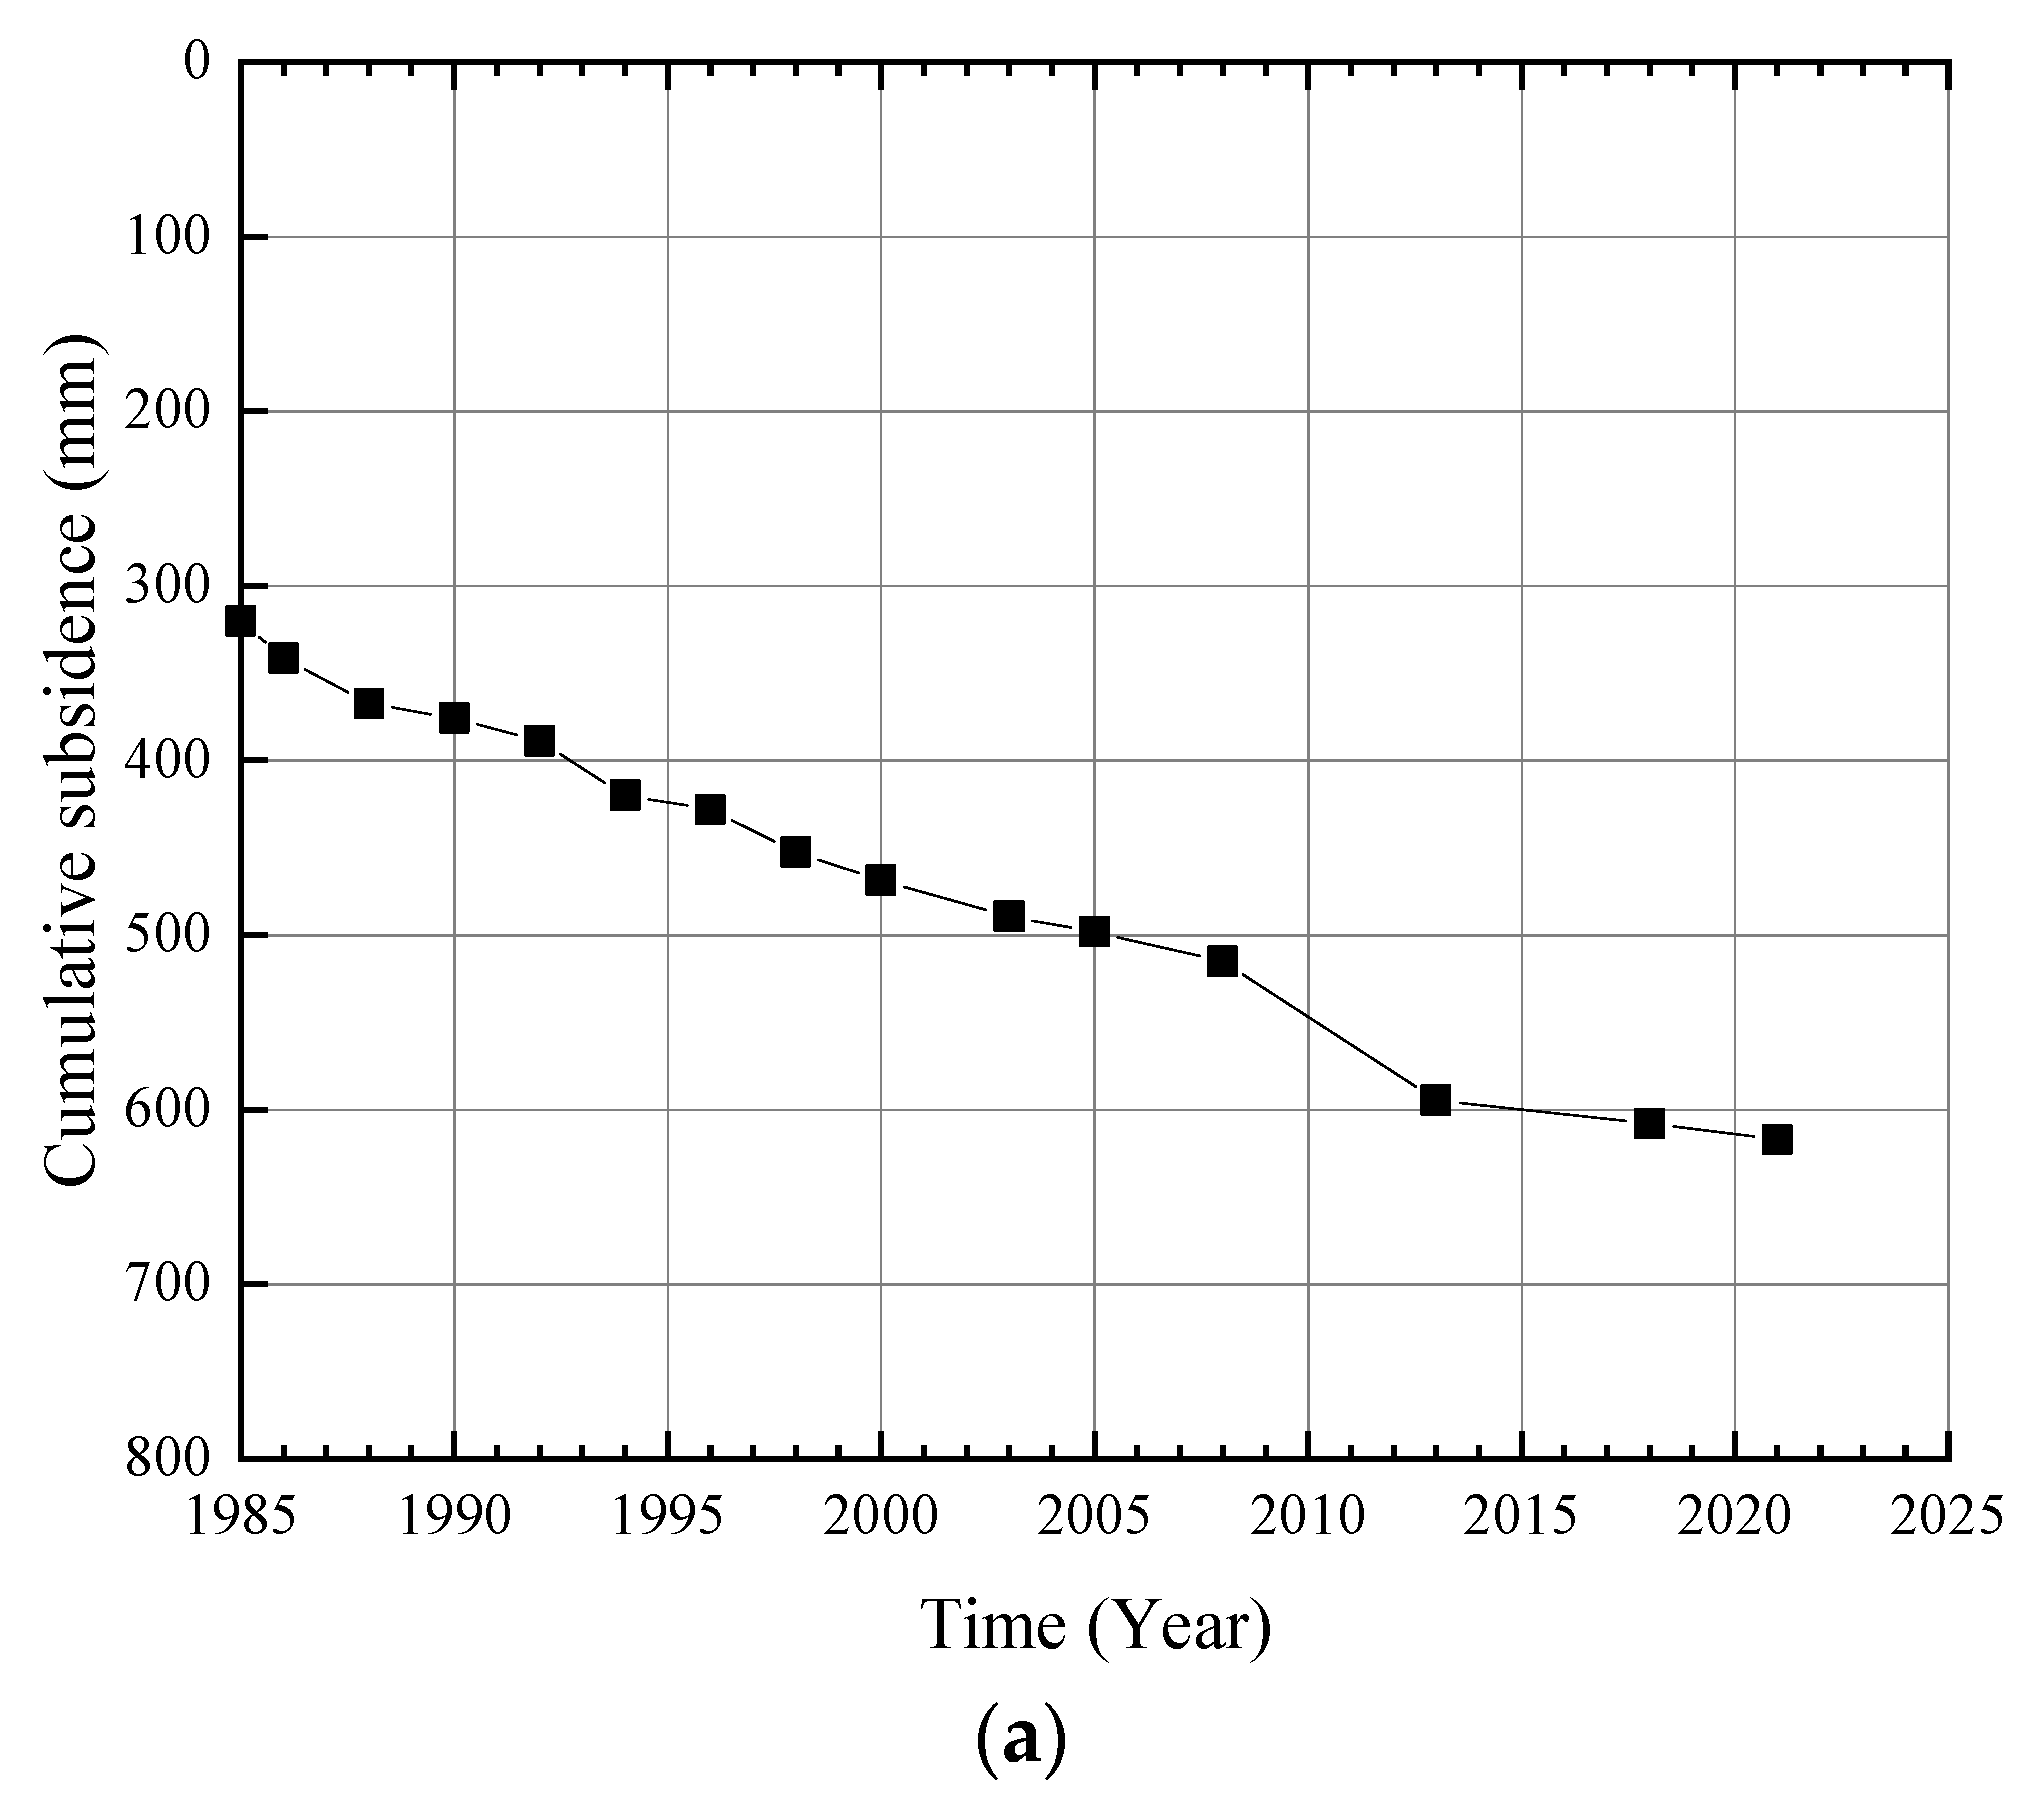
  • After the comprehensive prohibition of groundwater extraction in Ningbo city in 2008, the cumulative subsidence of the Jiangdong subsidence center in Ningbo city gradually slowed, and the annual subsidence rate decreased to 1.6 mm/a in 2021. However, for nearby areas with dense subway lines in operation and under construction, land subsidence will continue to occur and develop after groundwater extraction is prohibited, which requires attention.
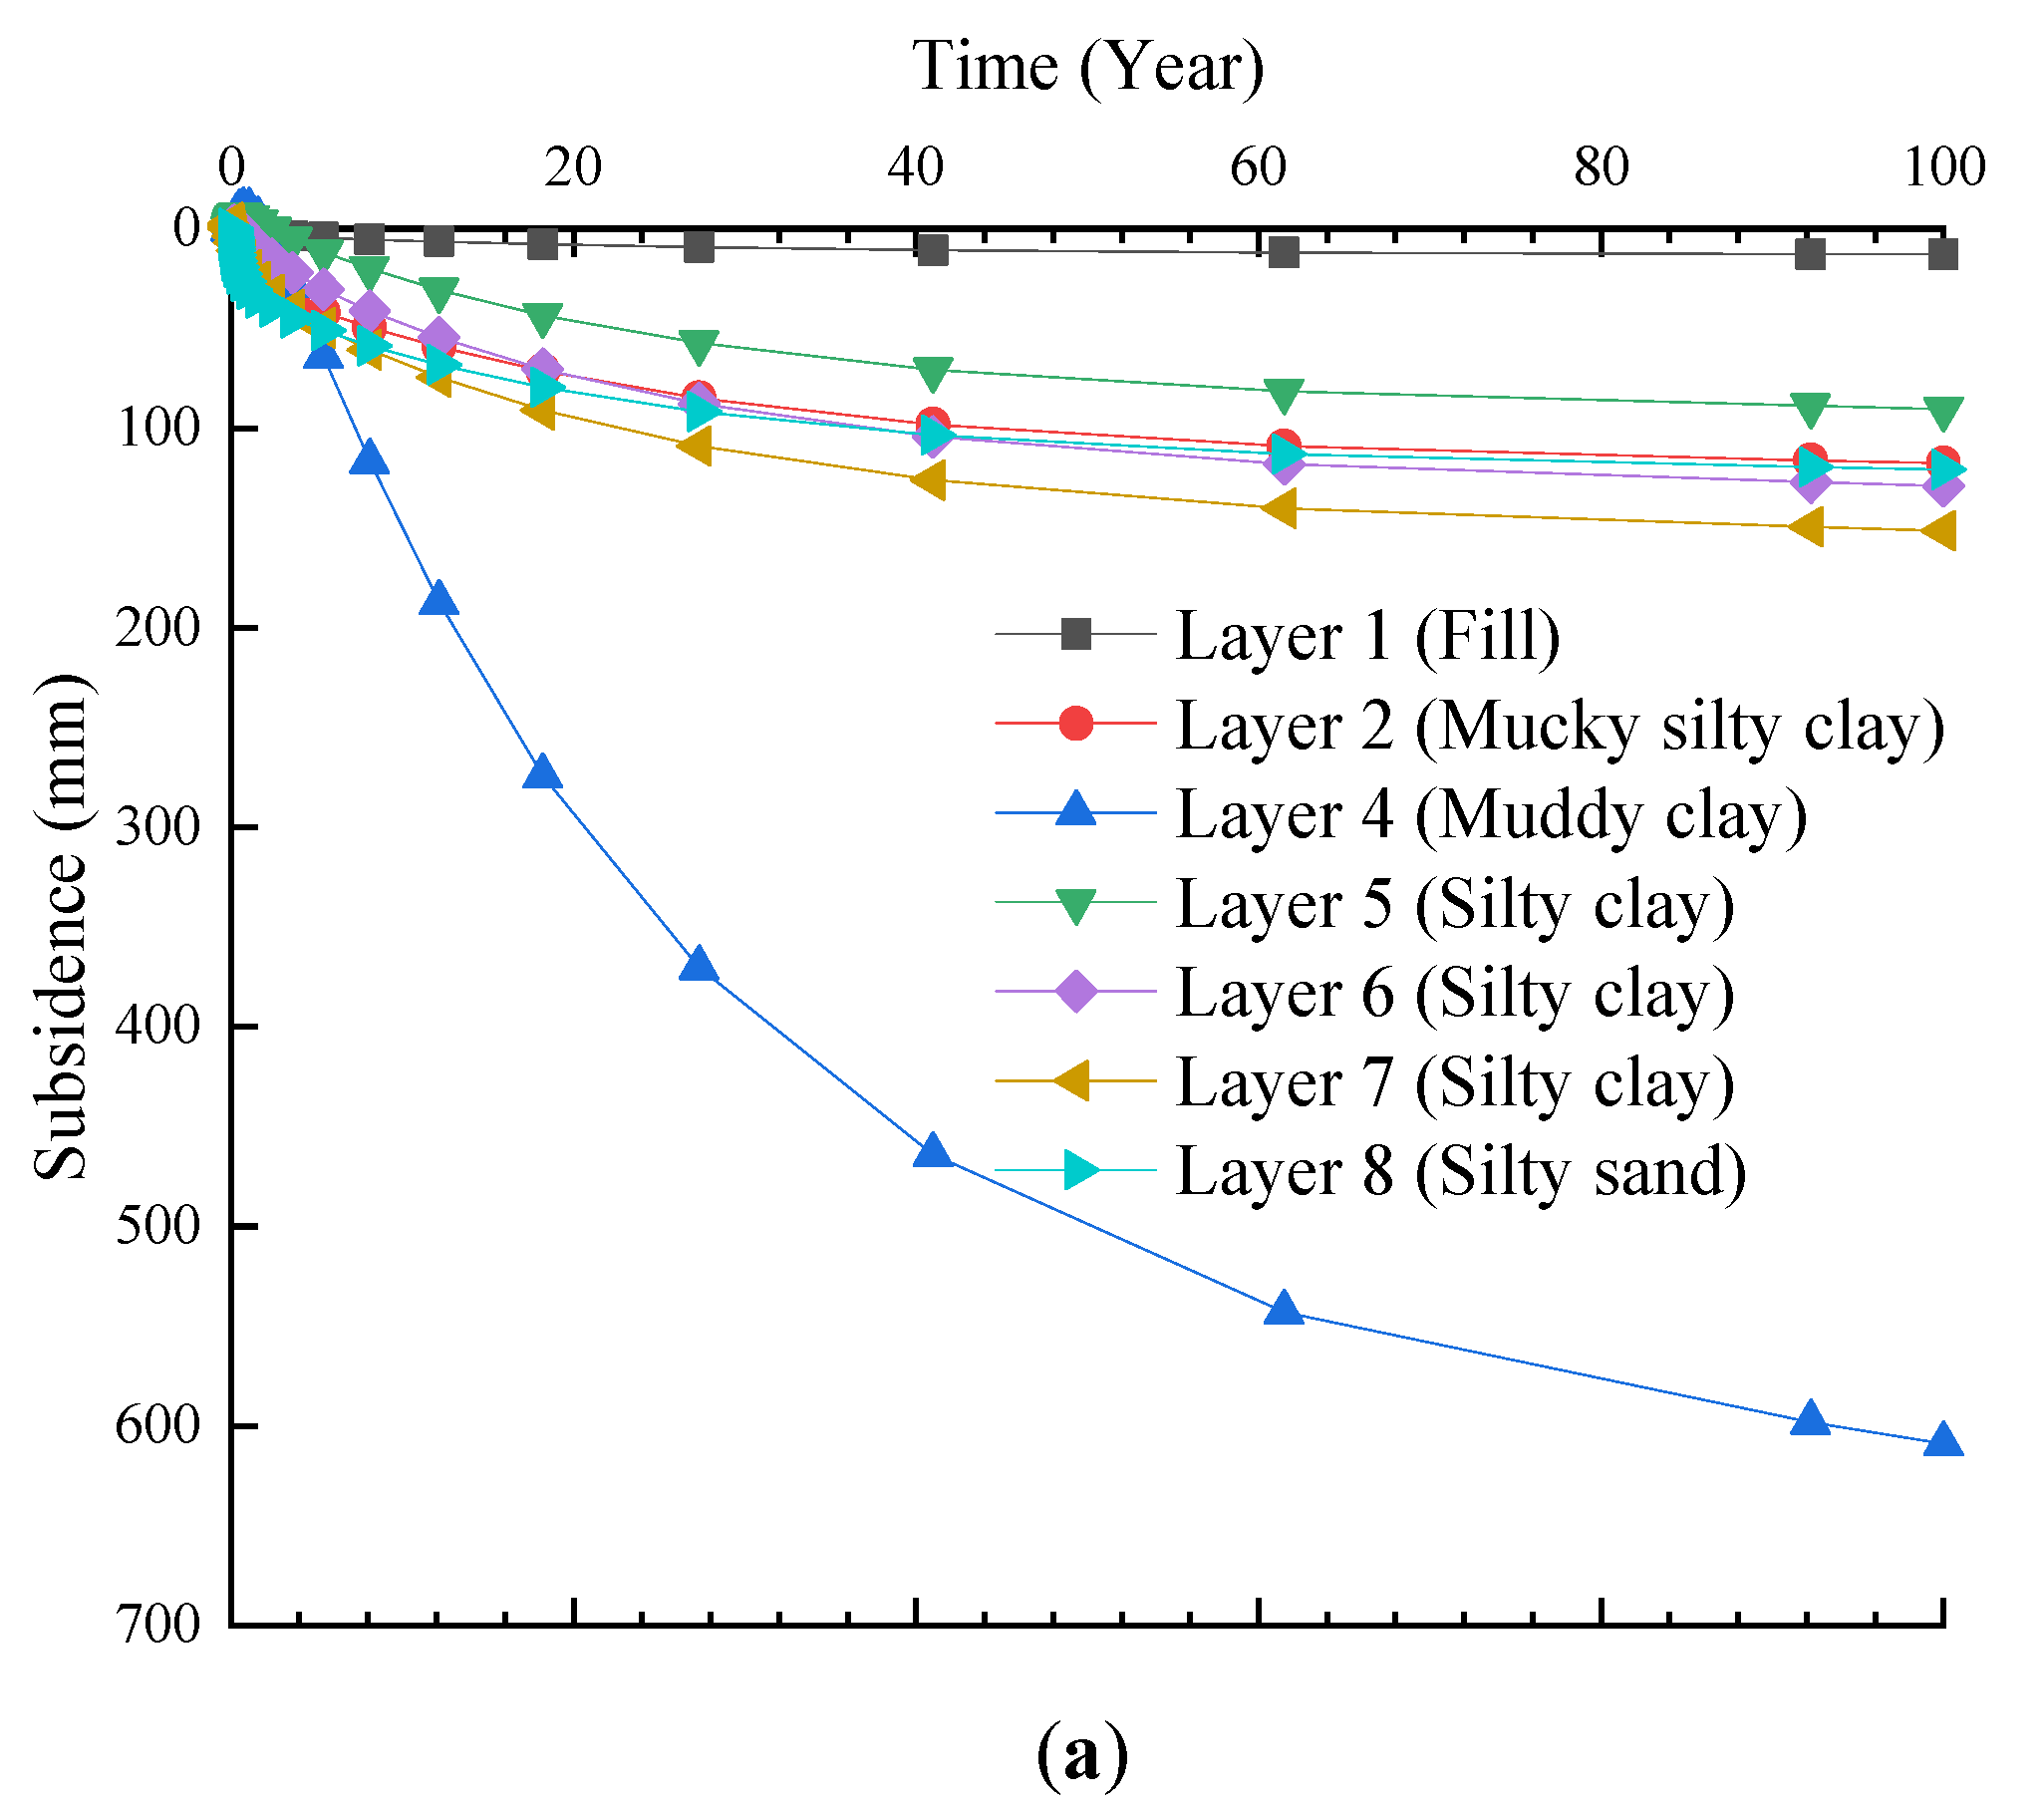
  • Among all the soil layers with subsidence, the sedimentation of silty clay in Layer 4 (muddy clay) was the largest, which was more than 600 mm, accounting for more than 50% of the total subsidence. A reasonable treatment method should be proposed for this layer during foundation treatment. When pile loading is carried out on an underconsolidated foundation, additional settlement of the shallow soil layer will occur over a large range.
  • After the pile foundation enters Layer 8 (silty sand), the subsidence of the pile itself is small, while the soil around the pile produces large consolidation subsidence under the additional stress caused by its self-weight and the pile side resistance, which leads to nonuniform subsidence between the pile and soil, and the final nonuniform subsidence is up to 560 mm. In the first five years after the pile is driven, the nonuniform subsidence of the pile and soil develops rapidly, the amount of nonuniform subsidence reaches approximately 300 mm and the nonuniform subsidence rate is approximately 60 mm/year. Then, the nonuniform subsidence rate slows and becomes stable.
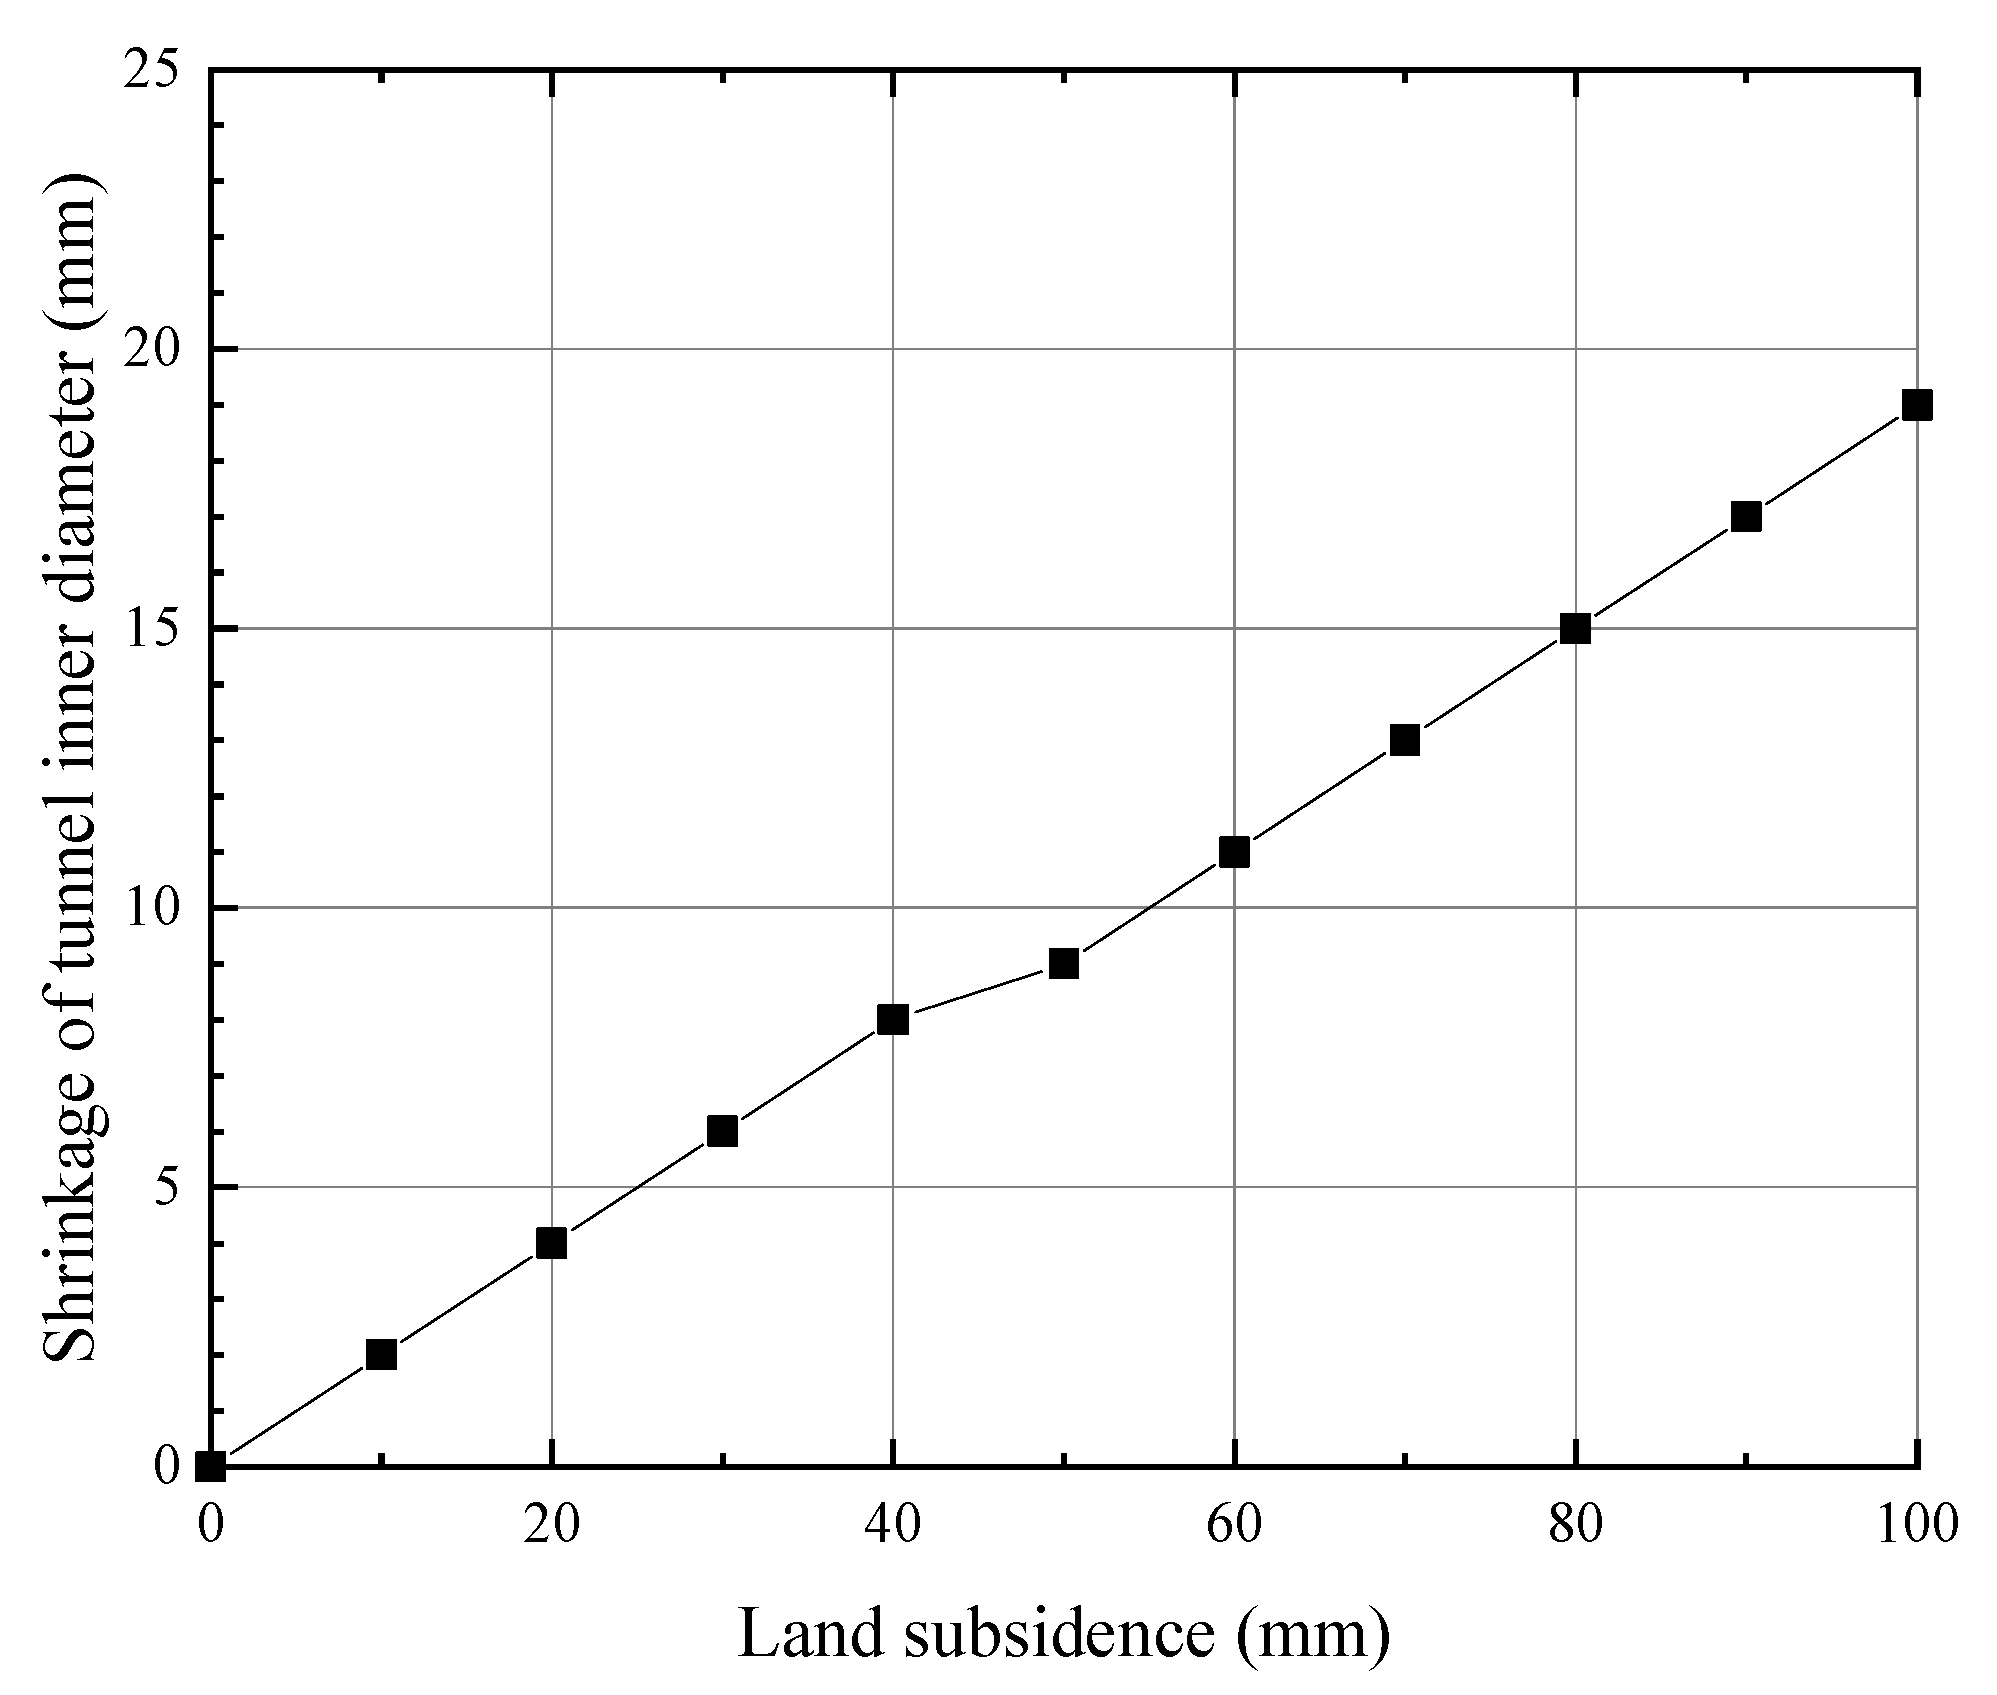
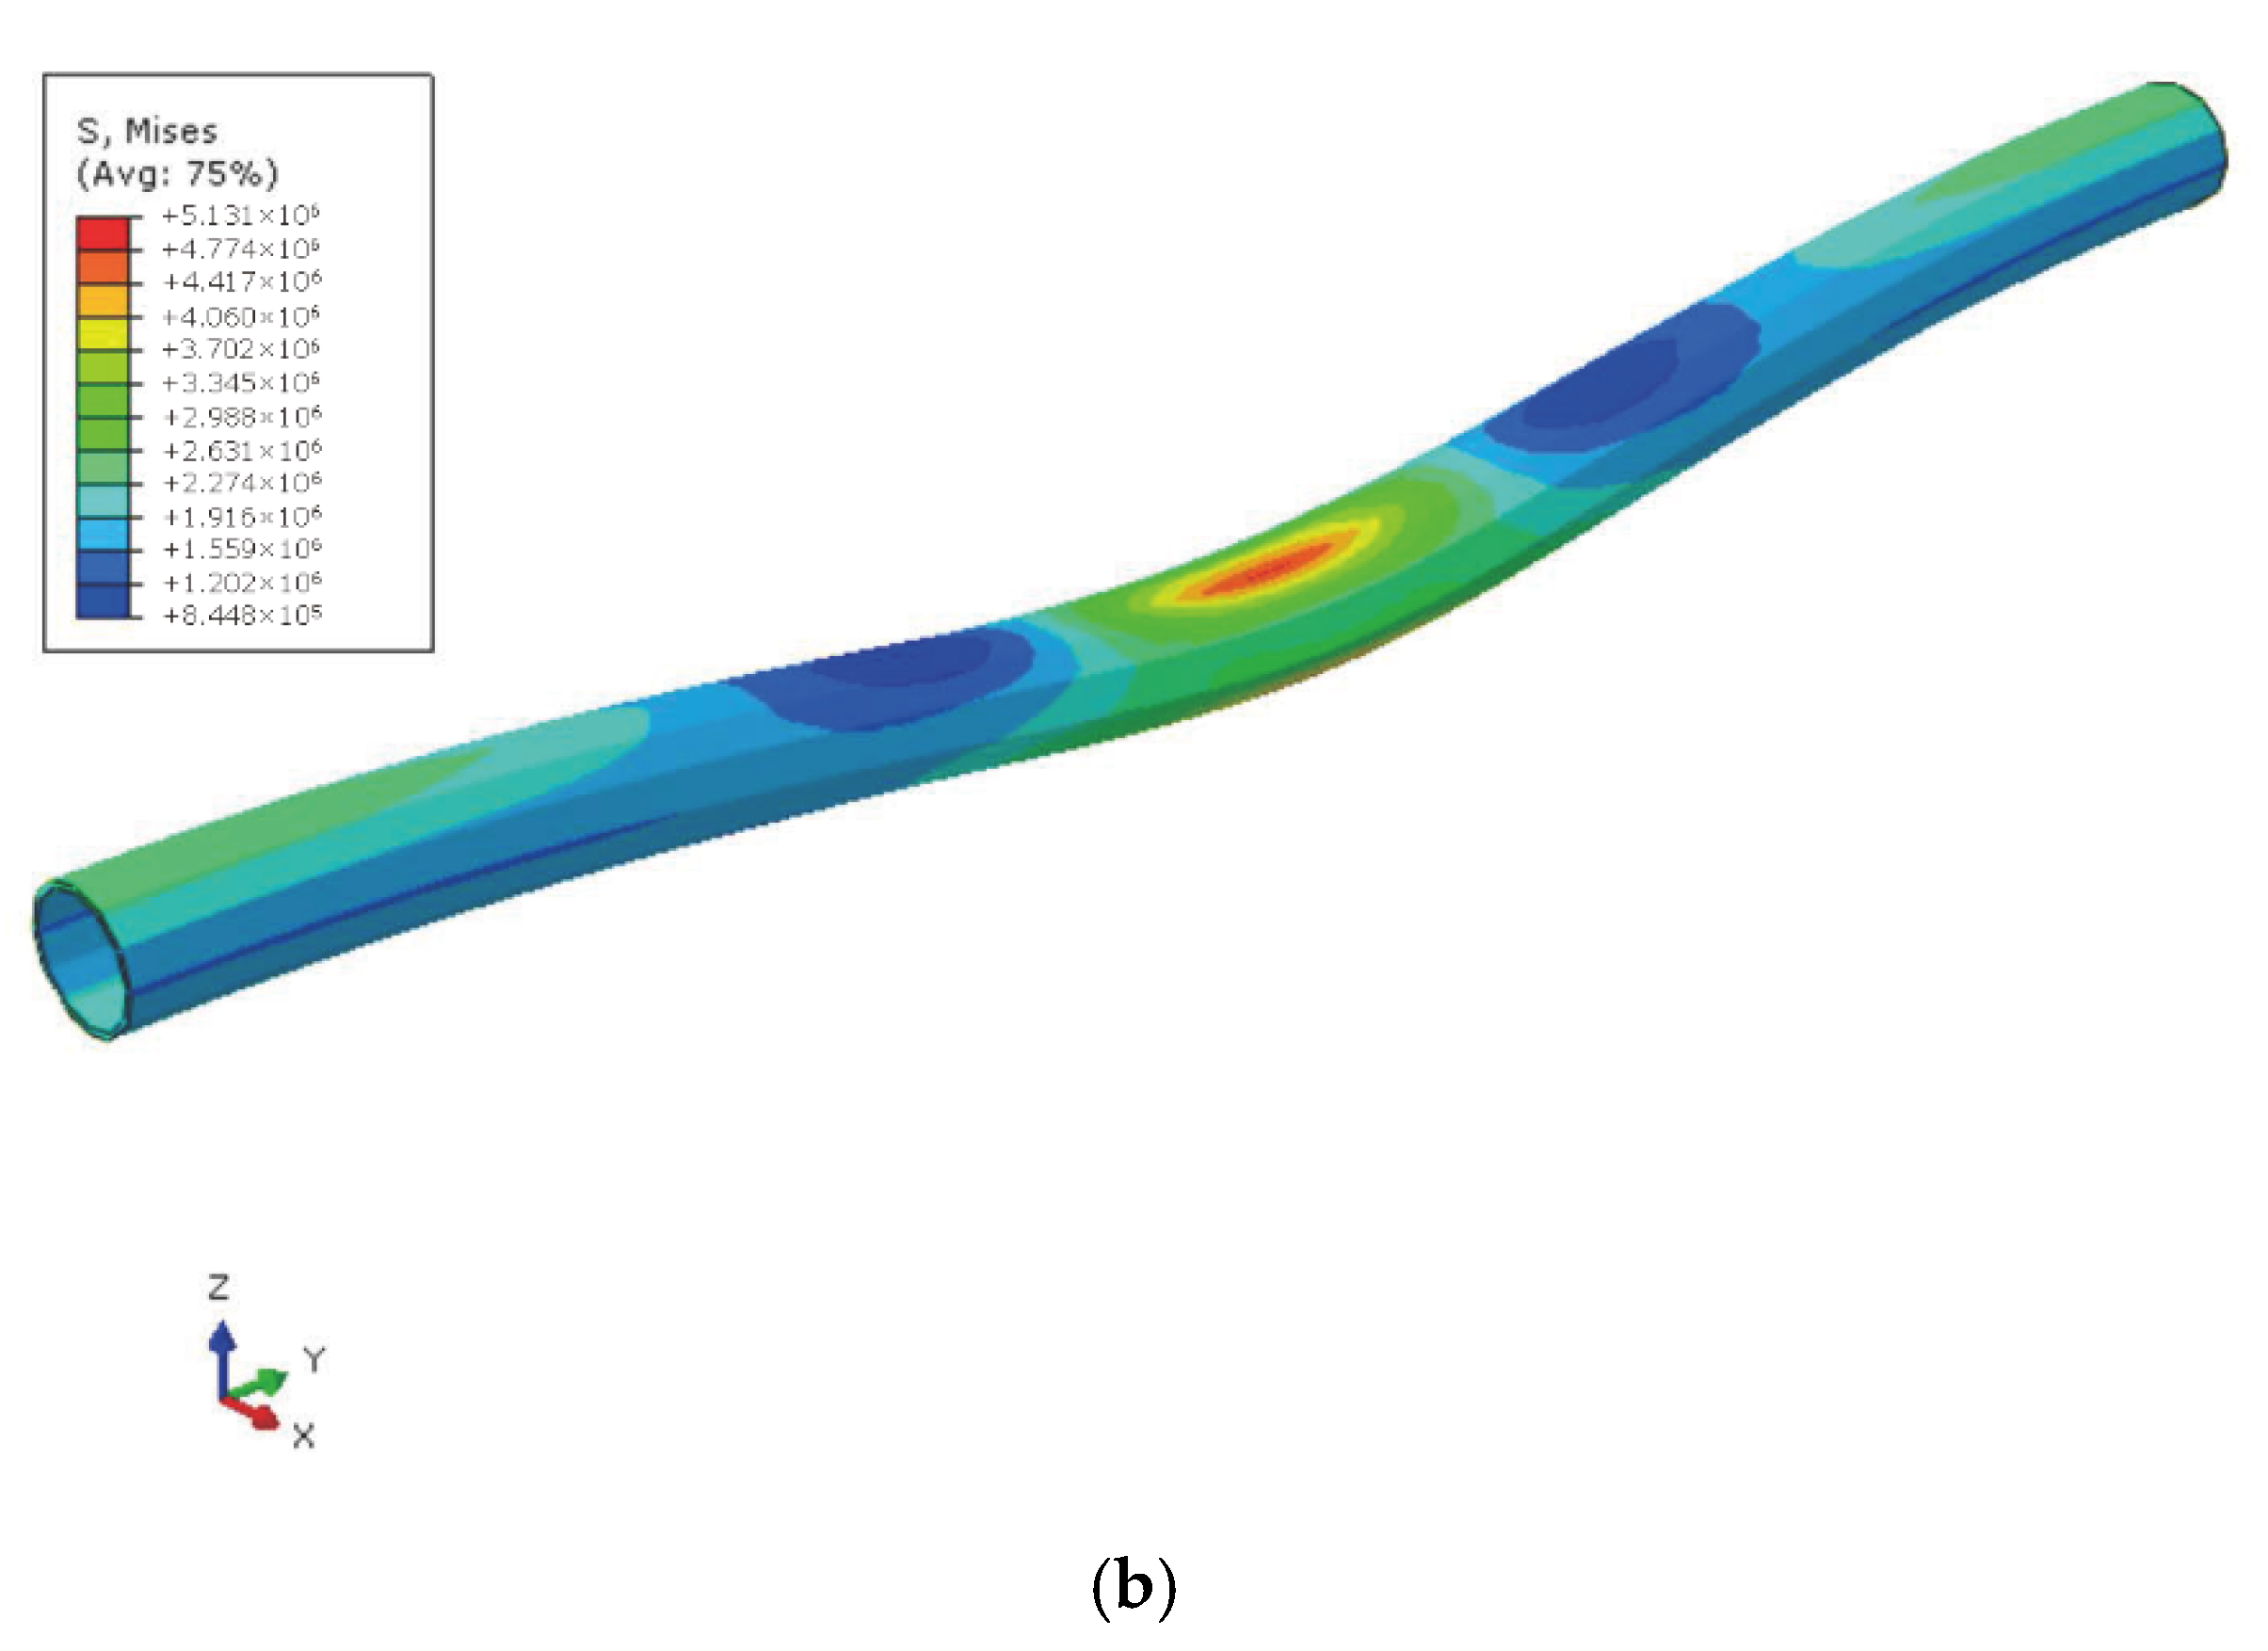
  • Under the action of formation pressure, the tunnel inner diameter converges vertically and expands laterally, and the relationship between the tunnel inner diameter shrinkage and the land subsidence is basically linear within the range of surface settlement. Taking the numerical analysis results of the Ximenkou–Gulou section as an example, under the condition of nonuniform subsidence, the von Mises stress of the segment at the center of the subsidence trough is the largest, reaching approximately 5.1 MPa, far more than the 1.04 MPa obtained under the condition of uniform subsidence. Compared with uniform subsidence, nonuniform subsidence easily leads to cracking of tunnel segments, which leads to failure of the connection between segments.
  • Due to the complexity of numerical modeling and multifield coupling, a single-factor analysis strategy was adopted in this study. In the future, multifield analysis or cyclic loading should be considered to conduct a more realistic numerical simulation.

Author Contributions

Investigation, F.G. and W.W.; writing—original draft, T.Z. and X.Z. (Xuebin Zhu); funding acquisition, T.Z., X.Z. (Xudong Zheng) and W.W.; software, X.Z. (Xuebin Zhu); data curation, X.Z. (Xuebin Zhu); writing—review and editing, F.G., X.Z. (Xudong Zheng) and L.Z.; supervision, F.G. and W.W. All authors have read and agreed to the published version of the manuscript.

Funding

This research was supported by the Natural Science Foundation in Zhejiang Province, China (No. LY19E080013, LQ19E080009, LHZ23E080002), Ministry of Housing and Urban-Rural Development of China Funded Science and Technology Project (2021-K-092), Construction of Science and Technology Project of Zhejiang Province (2021K144, 2022K112) and the Engineering Research Center of Prevention and Control of Geological Disasters in Northern Fujian, Fujian Province University, China (WYERC 2020-1).

Institutional Review Board Statement

Not applicable.

Informed Consent Statement

Not applicable.

Data Availability Statement

The data presented in this study are available in the article.

Acknowledgments

The numerical simulation research was carried out under the guidance of Jinzhu Li from Zhejiang Institute of Communications Co., Ltd.

Conflicts of Interest

The authors declare no conflict of interest. The sponsors had no role in the design, execution, interpretation or writing of the study.

References

  1. Minh, D.H.T.; Van Trung, L.; Le Toan, T. Mapping ground subsidence phenomena in Ho Chi Minh City through the radar interferometry technique using ALOS PALSAR data. Remote Sens. 2015, 7, 8543–8562. [Google Scholar] [CrossRef] [Green Version]
  2. Nguyen, M.; Lin, Y.N.; Tran, Q.C.; Ni, C.-F.; Chan, Y.-C.; Tseng, K.-H.; Chang, C.-P. Assessment of long-term ground subsidence and groundwater depletion in Hanoi, Vietnam. Eng. Geol. 2022, 299, 106555. [Google Scholar] [CrossRef]
  3. Tomás, R.; Romero, R.; Mulas, J.; Marturià, J.J.; Mallorquí, J.J.; Lopez-Sanchez, J.M.; Herrera, G.; Gutiérrez, F.; Gonzalez, P.J.; Fernández, J.; et al. Radar interferometry techniques for the study of ground subsidence phenomena: A review of practical issues through cases in Spain. Environ. Earth Sci. 2014, 71, 163–181. [Google Scholar] [CrossRef] [Green Version]
  4. Bagheri-Gavkosh, M.; Hosseini, S.M.; Ataie-Ashtiani, B.; Sohani, Y.; Ebrahimian, H.; Morovat, F.; Ashrafi, S. Land subsidence: A global challenge. Sci. Total Environ. 2021, 778, 146193. [Google Scholar] [CrossRef]
  5. Khalid, U.; ur Rehman, Z.; Liao, C.; Farooq, K.; Mujtaba, H. Compressibility of compacted clays mixed with a wide range of bentonite for engineered barriers. Arab. J. Sci. Eng. 2019, 44, 5027–5042. [Google Scholar] [CrossRef]
  6. Ur Rehman, Z.; Farooq, K.; Mujtaba, H.; Khalid, U. Unified evaluation of consolidation parameters for low to high plastic range of cohesive soils. Mehran Univ. Res. J. Eng. Technol. 2021, 40, 93–103. [Google Scholar]
  7. Khan, S.D.; Huang, Z.; Karacay, A. Study of ground subsidence in northwest Harris county using GPS, LiDAR, and InSAR techniques. Nat. Hazards 2014, 73, 1143–1173. [Google Scholar] [CrossRef]
  8. Kim, K.D.; Lee, S.; Oh, H.J.; Choi, J.-K.; Won, J.-S. Assessment of ground subsidence hazard near an abandoned underground coal mine using GIS. Environ. Geol. 2006, 50, 1183–1191. [Google Scholar] [CrossRef]
  9. Shi, X.; Fang, R.; Wu, J.; Xu, H.; Sun, Y.; Yu, J. Sustainable development and utilization of groundwater resources considering land subsidence in Suzhou, China. Eng. Geol. 2012, 124, 77–89. [Google Scholar] [CrossRef]
  10. Wang, J.; Wu, Y.; Liu, X.; Yang, T.; Wang, H.; Zhu, Y. Areal subsidence under pumping well–curtain interaction in subway foundation pit dewatering: Conceptual model and numerical simulations. Environ. Earth Sci. 2016, 75, 1–13. [Google Scholar] [CrossRef]
  11. Galliková, Z.; ur Rehman, Z. Appraisal of the hypoplastic model for the numerical prediction of high-rise building settlement in Neogene clay based on real-scale monitoring data. J. Build. Eng. 2022, 50, 104152. [Google Scholar] [CrossRef]
  12. Zhu, Y.; Gao, F.; Ye, J.; Bian, X.; Lin, W.; Chen, Y. Lateral Ground Displacement Induced by EPB Tunneling in Ningbo Soft Clay. In Proceedings of the International Symposium on Environmental Vibration and Transportation Geodynamics, Hangzhou, China, 28–30 October 2016; Springer: Singapore, 2016; pp. 681–688. [Google Scholar]
  13. Ijaz, Z.; Zhao, C.; Ijaz, N.; Rehman, Z.U.; Ijaz, A. Spatial mapping of geotechnical soil properties at multiple depths in Sialkot region, Pakistan. Environ. Earth Sci. 2021, 80, 1–16. [Google Scholar] [CrossRef]
  14. Ijaz, Z.; Zhao, C.; Ijaz, N.; Rehman, Z.U.; Ijaz, A. Novel application of Google earth engine interpolation algorithm for the development of geotechnical soil maps: A case study of mega-district. Geocarto Int. 2022, 1–21. [Google Scholar] [CrossRef]
  15. Holzer, T.L.; Johnson, A.I. Land subsidence caused by ground water withdrawal in urban areas. GeoJournal 1985, 11, 245–255. [Google Scholar] [CrossRef]
  16. Pacheco-Martínez, J.; Hernandez-Marín, M.; Burbey, T.J.; González-Cervantes, N.; Ortíz-Lozano, J.A.; Zermeño-De-Leon, M.E.; Solís-Pinto, A. Land subsidence and ground failure associated to groundwater exploitation in the Aguascalientes Valley, México. Eng. Geol. 2013, 164, 172–186. [Google Scholar] [CrossRef]
  17. Nguyen, Q.T. The main causes of land subsidence in Ho Chi Minh City. Procedia Eng. 2016, 142, 334–341. [Google Scholar] [CrossRef] [Green Version]
  18. Zhu, L.; Gong, H.; Li, X.; Wang, R.; Chen, B.; Dai, Z.; Teatini, P. Land subsidence due to groundwater withdrawal in the northern Beijing plain, China. Eng. Geol. 2015, 193, 243–255. [Google Scholar] [CrossRef]
  19. Zhao, Y.; Zhou, L.; Wang, C.; Li, J.; Qin, J.; Sheng, H.; Huang, L.; Li, X. Analysis of the spatial and temporal evolution of land subsidence in Wuhan, China from 2017 to 2021. Remote Sens. 2022, 14, 3142. [Google Scholar] [CrossRef]
  20. Takagi, H.; Fujii, D.; Esteban, M.; Yi, X. Effectiveness and limitation of coastal dykes in Jakarta: The need for prioritizing actions against land subsidence. Sustainability 2017, 9, 619. [Google Scholar] [CrossRef] [Green Version]
  21. Suganthi, S.; Elango, L. Estimation of groundwater abstraction induced land subsidence by SBAS technique. J. Earth Syst. Sci. 2020, 129, 1–13. [Google Scholar] [CrossRef]
  22. Abidin, H.Z.; Andreas, H.; Gumilar, I.; Wibowo, R.R.I. On correlation between urban development, land subsidence and flooding phenomena in Jakarta. Proc. Int. Assoc. Hydrol. Sci. 2015, 370, 15–20. [Google Scholar] [CrossRef]
  23. Xu, Z.; Li, G.; Meng, Q. The influence of the regional land subsidence on the orbit transportation engineering of Beijing city to Tianjin city and the cure counter-plans for it. J. Eng. Geol. 2006, 14, 394–398. [Google Scholar]
  24. Wu, H.N.; Shen, S.L.; Yang, J. Identification of tunnel settlement caused by land subsidence in soft deposit of Shanghai. J. Perform. Constr. Facil. 2017, 31, 04017092. [Google Scholar] [CrossRef] [Green Version]
  25. Krishna, S.S.; Lokhande, R.D. Study on the Effect of Surface Subsidence Due to Tunneling Under Various Loading Conditions. Geotech. Geol. Eng. 2022, 40, 923–943. [Google Scholar] [CrossRef]
  26. Su, X.; Chen, J.; Li, M.; Zhang, J.; Cao, T.; Liu, T. Sensitivity analysis of deformation of large diameter mud-water shield through complex environment. J. Eng. Geol. 2021, 29, 1587–1598. [Google Scholar]
  27. Wang, X.; Jiang, Y.; Wang, W.; Han, K.; Mao, Z. Research on ground surface settlement effect and numerical simulation of shield tunnel of subway in soft soil of coast in Ningbo. Subgrade Eng. 2018, 4, 61–68+74. [Google Scholar] [CrossRef]
  28. Meng, F.Y. Effects of Construction-Induced Disturbance on Post-Construction Settlements of Shield Tunnel and Ground in Soft Clayey Strata. Ph.D. Thesis, Zhejiang University, Hangzhou, China, 2019. [Google Scholar]
  29. Wang, W.; Hou, Y.; Zhao, T.; Li, J.; Bai, S.; Wang, H.; Lu, T. Study on the Impact of Land Subsidence on Major Urban Infrastructure and Its Strategy in Ningbo City; Ningbo Administration and Service Centre for Marine and Ecological Restoration of Natural Resources: Ningbo, China, 2019.
  30. GB50911–2013; Code for Monitoring Measurement of Urban Rail Transit Engineering. Ministry of Housing and Urban-Rural Development of the PR China: Beijing, China, 2013.
Figure 1. Growth of the land subsidence funnel area of the Jiangdong subsidence center.
Sustainability 15 00543 g001
Figure 2. Variation in the cumulative subsidence (a) and subsidence rate (b) of the Jiangdong subsidence center.
Sustainability 15 00543 g002aSustainability 15 00543 g002b
Figure 3. Development of land subsidence with time under the self-weight consolidation condition.
Sustainability 15 00543 g003
Figure 4. Development of land subsidence for each soil layer with time under the self-weight consolidation condition. (a) Impermeable surface. (b) Permeable surface.
Sustainability 15 00543 g004aSustainability 15 00543 g004b
Figure 5. Development of land subsidence with time under backfill and surcharge.
Sustainability 15 00543 g005
Figure 6. Development of land subsidence for each soil layer with time under backfill and surcharge. (a) Impermeable surface. (b) Permeable surface.
Sustainability 15 00543 g006aSustainability 15 00543 g006b
Figure 7. Finite element model and mesh division of a single pile. (a) Finite element model. (b) Mesh division.
Sustainability 15 00543 g007aSustainability 15 00543 g007b
Figure 8. Subsidence pattern of the consolidated soil.
Sustainability 15 00543 g008
Figure 9. Variation in nonuniform soil settlement with time.
Sustainability 15 00543 g009
Figure 10. Typical Ximenkou–Gulou geological section in Ningbo.
Sustainability 15 00543 g010
Figure 11. Plane strain finite element model of the metro tunnel. (a) Finite element model. (b) Mesh division.
Sustainability 15 00543 g011
Figure 12. Relationship between tunnel inner diameter shrinkage and land subsidence (uniform).
Sustainability 15 00543 g012
Figure 13. Von Mises stress patterns of the tunnel (deformation amplification factor = 50).
Sustainability 15 00543 g013
Figure 14. Vertical displacement patterns of the stratum (deformation amplification factor = 200).
Sustainability 15 00543 g014
Figure 15. Vertical displacement and von Mises stress of the tunnel segment (deformation amplification factor = 200). (a) Vertical displacement. (b) Von Mises stress.
Sustainability 15 00543 g015aSustainability 15 00543 g015b
Figure 16. Relationship between the tunnel inner diameter shrinkage and the ground subsidence (nonuniform).
Sustainability 15 00543 g016
Table 1. Comparison of land subsidence conditions based on previous studies.
ReferencesMain Cause (s)Maximum Cumulative Subsidence/mmMaximum Subsidence Rate/(mm·a−1)Negative InfluenceControl Strategy
Pacheco-Martínez et al. [16] (2013)Groundwater extraction1300111.8Damage to infrastructures, roads, pipelines and well casingsUpdating the building codes and designs, more accurate numerical models
Nguyen [17] (2016)Groundwater extraction, management of underground urban infrastructure-15Road collapse, project delayControlling groundwater exploitation, managing the underground space development
Zhu et al. [18] (2015)Groundwater extraction34252--
Zhao et al. [19] (2022)Urban subway construction, building construction, groundwater extraction9057Karst collapse of the ground, ground collapse hazardsMore SAR satellites and higher radar accuracy
Takagi et al. [20] (2017)Extracting groundwater for industrial usage-215Risk of floodingConstruction of large dykes and more pumping stations
Suganthi & Elango [21] (2020)Groundwater overpumping528-Reducing the extraction of groundwater, increasing the groundwater recharge
Table 2. Different stages of subsidence at the subsidence center in Jiangdong, Ningbo.
StageDurationCumulative
Subsidence/mm
Subsidence
Rate/(mm·a−1)
Area of Subsidence
Funnels/(km2)
Initial stage1964~197717512.542
Development stage1978~198532018.991
Relatively stationary stage1986–now2015594.45.9482.8
2018607.83.4-
2021617.11.6-
Table 3. Physical and mechanical properties of the different soil layers in the Chunxiao Project.
Layer No.LayerLayer Thickness/mDensity/(g·cm−3)Void RatioCoefficient of Compressibility/MPaPermeability Coefficient/(cm·s−1)Cohesion/kPaAngle of Internal Friction/°
1Fill41.81.1293.02.40 × 10−714.410.1
2Mucky silty clay8.81.81.1293.02.40 × 10−714.410.1
4Muddy clay171.791.1762.81.00 × 10−716.69.8
5Silty clay41.960.786.63.40 × 10−729.117.6
6Silty clay4.61.910.8596.23.40 × 10−724.217.4
7Silty clay4.71.930.8236.23.40 × 10−727.317.7
8Silty sand6.91.980.64113.35.00 × 10−512.331.4
Table 4. Physical and mechanical properties of the different soil layers (XS-Z02).
Layer No.LayerLayer Thickness/mDensity/(g·cm−3)Void RatioCoefficient of Compressibility/MPaCohesion/kPaAngle of Internal Friction/°
1-1Fill3.71.721.5512.2615.59.2
1-3Muddy clay1.51.721.5512.2615.59.2
2-2-2Muddy clay6.81.751.2902.6216.810.2
2-3Mucky silty clay1.51.821.0743.1220.511.7
3-1Clayey silt3.01.940.8226.411.728.3
4-1-2Silty clay1.21.850.9673.932214.4
5-1Silty clay5.31.960.7926.5943.217.9
5-2Silty clay6.51.900.8945.5235.316.9
5-4Silty clay5.51.870.9574.3930.613.4
6-2Silty clay7.51.860.9974.527.513.8
6-3Silty clay3.71.860.9874.8531.114.9
7-1Silty clay4.51.990.7237.4446.819.6
Disclaimer/Publisher’s Note: The statements, opinions and data contained in all publications are solely those of the individual author(s) and contributor(s) and not of MDPI and/or the editor(s). MDPI and/or the editor(s) disclaim responsibility for any injury to people or property resulting from any ideas, methods, instructions or products referred to in the content.

