Article

The Influencing Factors of the Carbon Trading Price: A Case of China against a “Double Carbon” Background

1
School of Economics, Hangzhou Normal University, Hangzhou 311121, China
2
Hangzhou Economist Association, Hangzhou 311121, China
3
Business School, Ningbo University, Ningbo 315211, China
*
Authors to whom correspondence should be addressed.
Sustainability 2023, 15(3), 2203; https://doi.org/10.3390/su15032203
Submission received: 28 December 2022 / Revised: 18 January 2023 / Accepted: 20 January 2023 / Published: 25 January 2023

Abstract

:
The Carbon trading price (CTP) can best reflect the fluctuations of the carbon trading market. This paper comprehensively analyzes the CTP mechanism of China’s carbon trading market, discusses the main factors affecting China’s CTP, which include macroeconomic factors, energy price factors, policy factors, and environmental factors, and provides three hypotheses. In order to highlight and test the three hypotheses about the CTP, five representative carbon trading pilot markets were included: Beijing, Shenzhen, Shanghai, Hubei, and Guangdong, and the daily average price data (over years) were adapted from January 2017 to December 2021, using a dynamic heterogeneous panel PMG model. The current paper selects the China air quality index (AQI), Bohai-Rim steam-coal price index (BSPI), Liquefied natural gas index (LNGI), and the Shanghai stock exchange industrial index (SSEII) as the explanatory variables. The empirical results show that there is a long-term equilibrium relationship between the CTP, AQI, energy price, and macroeconomics. Strengthening environmental governance, optimizing the energy structure, and expanding the carbon trading market coverage should be adopted to improve the China carbon emission trade exchange (CCETE) and stabilize the CTP.

1. Introduction

1.1. Research Background

The International Energy Agency (IEA) Report holds that “there is no plausible path to limiting the global temperature rise to 1.5 °C without China” (2020). One of the key policy tools that China has used to tackle climate change is the construction of the carbon emission trading market [1]. China first made the action target for a carbon dioxide (CO2) emission peak around 2030 in its intended nationally determined contributions under the 2015 Paris Agreement. The significant action followed is the 2017 joint presidential statement, in which China announced the launch of a national carbon trading market. Based on this statement, the creation of a carbon trading market and putting a price on greenhouse gas emissions are believed to become national-level strategies [2]. The markets across the nation with cap-and-trade rules or emissions allowance standards set by the State Council were formally started after this. The 2020 “double carbon” promise by President Xi Jinping at the general debate of the 75th Session of the United Nations General Assembly stated that China aimed to have a carbon emission peak before 2030 and achieve carbon neutrality before 2060, presenting a “double carbon” background in China and extensively speeding up the construction of the national market system [3]. Therefore, it is worthwhile to investigate the developments of carbon trading pilot markets and examine the key influencing factors of the CTP across the national preparation-to-full operation stages. This is the research object of the current paper.
Up to now, China has successively set up eight carbon emission trading pilots. By 2021, China’s carbon emission trading market covered more than 20 industries, nearly 3000 key emission companies, and 620 million tons of carbon emissions. The cumulative transaction amount is about CNY 17.936 billion, which is the most extensive coverage of CO2 emissions in the world. But compared with the mature carbon markets overseas, like the EU carbon emissions trading system (ETS), China’s pilot markets still have the problem of asynchronous development. The CTP data of China’s pilot markets were not complete and had the typical characteristics of poor information [4]. Problems such as insufficient trading vitality and unstable trading prices still exist in the carbon trading markets at present. It is believed that highly volatile markets increase the risk of loss and threaten the motivation for carbon emission reductions [5,6,7,8].
In the analysis of the influencing factors of the CTP, the energy prices, macroeconomic activities, and environmental conditions are mainly focused on in the literature. But these factors differ in factor selection, time, or spatial dimension and are not necessarily leading to consistent conclusions [9]. Much more literature focuses on the European carbon market or individual pilot market in China [4,10,11,12,13,14,15,16], while there are few literature studies for the 2017–2021 period of the China markets. Factors vary according to single or mixed types, and the corresponding impacts empirically differ in their correlation direction and degree across pilot markets [1,4,15]. Some explanations are attributed to the imperfect CTP formation mechanisms, and some are attributed to the local market characteristics [4,17,18,19]. Therefore, the current paper found a need to identify a complete study across the main China pilot markets and test the impacts of the key influencing factors on the CTP.
Some pieces of research exclude natural gas with arguments for its low proportion in energy consumption and low carbon emission coefficients [1,14]. Some studies exclude it with arguments for its similarity with oil or with cleaner energy sources [17]. It should be noted that natural gas is considered the pillar of China 2050′s roadmap to higher renewable energy penetration and the “double carbon” roadmap [9]. Empirically, there are few studies that have viewed the relative natural gas price level through price comparison effects or that can provide an incentive for promoting the optimization of the emission structure [18]. Therefore, we call for attention to the impact of the natural gas price, which is much less emphasized and tested in China CTP studies.
Overall, to understand the uniqueness of the CTP formation mechanism and the underlying forces behind carbon price fluctuations in Chinese markets, the current paper analyzed and proposed three hypotheses related to the carbon price mechanism and carried out an empirical study with the available daily data in five pilot markets of Beijing, Shenzhen, Shanghai, Hubei, and Guangdong from January 2017 to December 2021 using a dynamic heterogeneous panel PMG model. The abbreviations of key terms showed in Table A1.

1.2. Research Significance

The theoretical significance includes the following: firstly, it is conducive to improving the exploration of the pricing mechanism of China’s CTP. Since the establishment of China’s carbon trading market, the price and volume of transactions have been affected by the interaction of many factors. As there are differences in the construction time, development speed, and the government’s policies for different pilot markets, the CTP fluctuates greatly. The current paper represents a theoretical analysis of the formation of the mechanism and the influencing factors of the CTP. Secondly, the current paper may enrich the study of those factors affecting China’s CTP and, in turn, the way that they could affect the achievement of the “double carbon” goal. We make an empirical analysis of the influencing factors of the CTP, on which we identify and analyze the correlation between the environmental factors, the nonclean and clean energy price factors, the macroeconomic factors, and the average carbon price under different CTP levels.
The practical significance includes, firstly, the CTP fluctuation, which reflects the balance change between supply and demand in the carbon emission trading market. Effective price signals have realistic guiding significance on the resource allocation of the carbon emission trading market, the transformation and upgrading of enterprises, and the decrease in the total costs of carbon emission reductions. Secondly, the paper’s findings provide sound foundations for policy-makers to improve the carbon trade market systems and comprehensively consider the effectiveness of multiple policy tools.

1.3. Research Content and Innovation

Against a “double carbon” background in China, we first reviewed studies on the formation mechanism of the CTP from the carbon total emission trading mechanism, carbon emission offsetting mechanism, carbon financial mechanism, and the carbon tax mechanism. Secondly, the current paper discussed the factors affecting the CTP based on the literature in terms of macroeconomic factors, energy factors, policy factors, and environmental factors. Thirdly, we explore the theoretical mechanism analysis of the effect of the factors on the China CTP and propose a research hypothesis. Fourthly, by analyzing the status quo of China’s carbon trading market, a series of key problems are pointed out, such as the large fluctuation in the CTP, the unbalanced development of the carbon emission trading market, and single industry coverage. Based on the theoretical analysis, we establish a dynamic heterogeneous panel model, analyze the specific impact of various influencing factors on the CTP, and put forward policy recommendations.
The research aims to provide novel empirical evidence by exploring the influence of China’s CTP using the dynamic heterogeneous panel PMG model. The innovation of the current paper is that it analyzes the influencing factors of China’s CTP from multiple perspectives through conducting empirical research using a dynamic heterogeneous panel PMG model. We expand these observations to the five most active and representative carbon pilot markets, including Beijing, Shenzhen, Shanghai, Hubei, and Guangdong. These markets’ daily average price for carbon emission trading from January 2017 to December 2021 was used as the sample. Meanwhile, four indicators, including AQI, BSPI, LNGI, and SSEII, were selected to establish a random effect model to explore the impact on the CTP from environmental factors, energy price factors, and macroeconomic factors.
The following sections of the current paper are as follows: Section 2 is a literature review. Section 3 provides the theoretical mechanism analysis of the factors’ effect on the CTP and proposes the research hypothesis. Section 4 provides an analysis of the carbon emission trading market, including its current status and development problems. Section 5 sees the construction of the empirical model and an empirical analysis of the influencing factors of the CTP, including empirical tests and results. Section 6 presents conclusions and policy implications.

2. Literature Review

There are many studies on the CTP, such as (1) the theoretical basis of carbon trading and trading prices, which includes the externality theory and emission trading theory. These theories explain the necessity of carbon trading. (2) The formation mechanism of the CTP, which is internalized in the cost of emission enterprises. (3) The influencing factors of the CTP, which can be affected by market trading, policies, and the development of the economy.

2.1. Theoretical Basis of Carbon Trading and Trading Prices

2.1.1. Externality Theory

The externality theory lays a theoretical foundation for the formation of the carbon trading market. Marshall, Pigou, and Coase have made important contributions to the development of the externality theory [20]. Pigou expanded on the concept proposed by Marshall. He believed that when the marginal private cost and the marginal social cost deviate from each other, it is necessary to rely on the government’s intervention. Coase used the theory of property rights to solve the problem of economic externalities. He proposed that the economic function of property rights is to overcome externalities and reduce social costs, thereby ensuring the effective allocation of resources in the system.
Greenhouse gases, such as the CO2 that is produced from the production activities of enterprises, are the main cause of global warming. In economics, this is a typical external diseconomy phenomenon. The carbon trading market trades the carbon emission quota as a commodity and clarifies the carbon quota emission indicators of each enterprise. Enterprises can exchange quotas in the carbon trading market according to their own needs so as to realize the effective allocation of resources from a carbon trading market and solve the externality issues. Shi et al. pointed out that, as an emissions abatement mechanism focusing on property rights theory and market trading methods, carbon emission rights trading plays an important role in achieving low-carbon economic development, which has already garnered broad worldwide recognition [21].

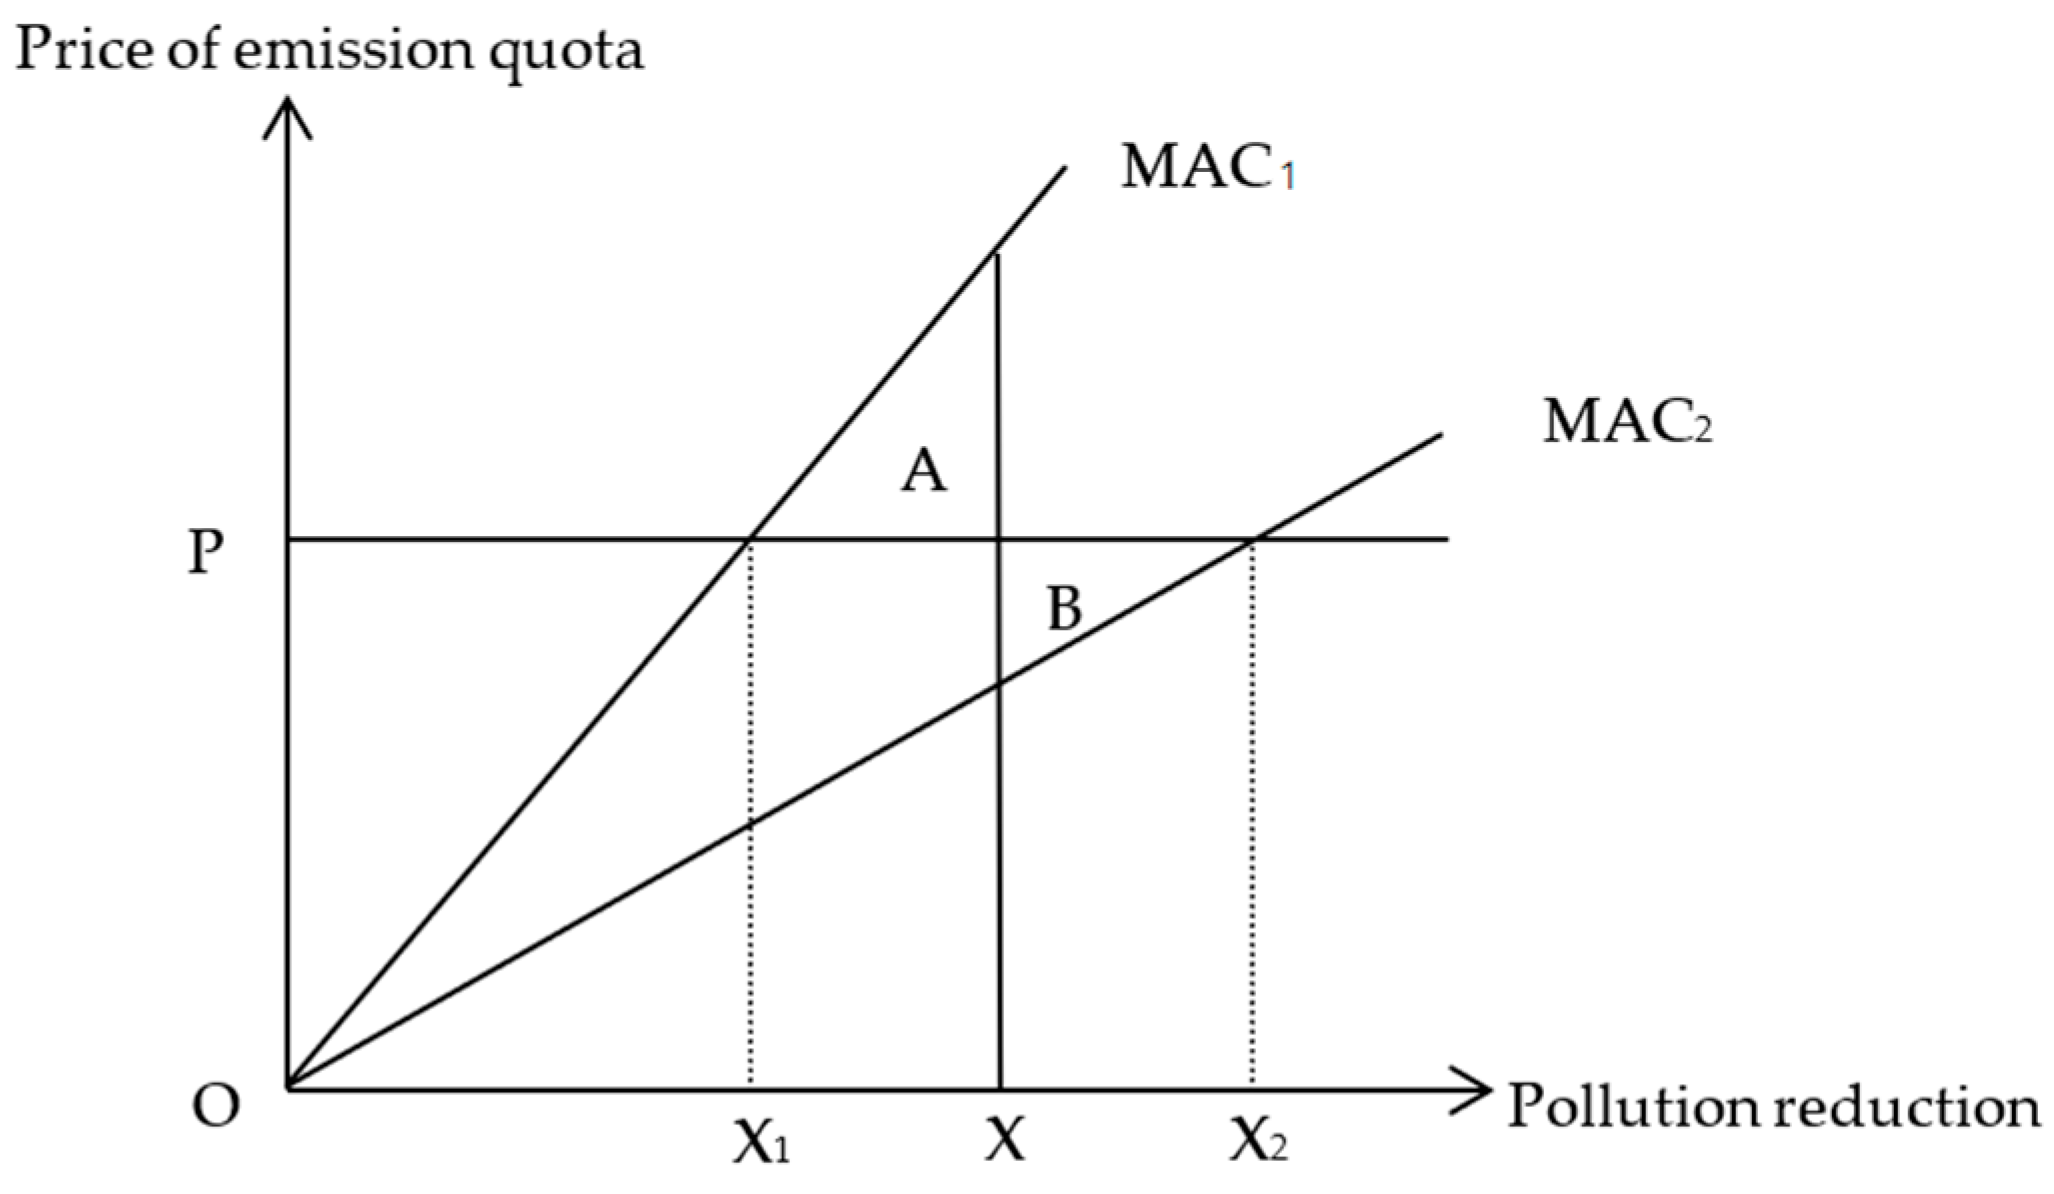
2.1.2. Emission Trading Theory

The emission trading theory provides a theoretical basis for carbon emission trading. Emission trading refers to the mutual adjustment of emissions between various internal pollution sources through currency exchange. Coase believes that when the transaction cost is zero, as long as the initial definition of the property rights is clear and the parties to economic activities are allowed to negotiate the transactions, the result of market equilibrium will lead to the efficient allocation of resources [22].
The market price of the emission quota can be deducted through trading, which is also applied in the case of the CTP. As shown in Figure 1, there are two polluters in an area: polluter 1 has a higher cutting cost and uses a steeper marginal cost-cutting curve, MAC1, while polluter 2 cuts pollution at a lower cost and uses the marginal cost-cutting curve MAC2, which is flatter. Assuming that the emission quotas are equally distributed to the two polluters, each polluter has to reduce OX units of pollution; the total reduction is 2OX, and the market equilibrium price of the emission quota is P. At this time, polluter 2 will find that the amount of XX2 pollution reduction will increase and the excess carbon emission quota will be sold at the price P, and the net income of area B will be obtained. Polluter 1 will find that it is beneficial to purchase the emission quota of XX1 at the price P and reduce their own pollution reduction amount, which can save the net cost of area A. In this way, in the entire market, both of the polluters will trade emissions rights from their own interests. The total reduction after trading is still 2OX, and the marginal cut cost for both polluters after trading is equal to the market price of the emission quota.

2.2. Formation Mechanism of the CTP

The mechanism of the CTP refers to the pricing of greenhouse gas emissions in the unit of CO2 per equivalent ton. It is the correction of the negative environmental externalities, which is internalized in the cost of the emission enterprises. The CTP of the emissions trading scheme reflects a firm’s marginal cost of the emissions [23]. The formation mechanism of China’s CTP involves the carbon total emission trading mechanism, carbon emission offsetting mechanism, carbon financial mechanism, and the carbon tax mechanism, but they do not function equally. Achieving the “double carbon” goal is believed to be both essential and improves institutional arrangements [24].

2.2.1. Carbon Total Emission Trading Mechanism

The CTP depends on the balance between the supply and demand of the carbon emission quota in the market. The carbon total emission trading mechanism refers to affecting the actual total carbon emission supply through allowances, auctions, and agreement transfers. It restricts market participants through default penalties, determines the carbon emission price gap in the primary and secondary markets, and then affects the actual total demand for the carbon emission quota.
Overseas scholarly research on the formation mechanism of the CTP focuses on the EU carbon emission trading system with paid or free allowances and has theoretically analyzed the model of the carbon price mechanism. Paid carbon allowances are obtained through bidding and auctions in the carbon trading market. Free allowances refer to the government’s policy goals, which are allocated to enterprises according to the proportion, which then guides the carbon price. Ellerman and Buchner briefly discussed the origin of the EU ETS and their concern for over-allowances, concluding a broader principle from the ETS experience for free allowances that may not be any more equitable or efficient but which seem to fit the facts well [10]. It suggests that free allowances are preferred for an ETS in the early stages. In order to have effective prices, dynamic allocation (e.g., output-based free allowances and mixed allowance) is extensively discussed on the cost-contained, price-responsive allowance supply [25,26] and on the capacity of explicit carbon pricing to drive significant abatements [27].
In China’s case, studies show that the carbon total emission trading allowances affect the CTP. Regarding the issues related to carbon emission control and carbon emission right-pricing functions, Chen et al. discussed the essential institutional arrangement of the total amount of the control system, quota allocation system, verification system, and effective trading system for low-cost carbon pricing and active market participation [24]. Peng and Zhong explored the formation logic of the carbon price and held that, through emission control thresholds, carbon quotas are found to be included in the system, and carbon accounting is carried out to determine the surplus and gap in the carbon trading market, thereby generating supply and demand sides and forming a CTP [28]. Wu and Zhang discussed that the auction volume and negotiated transfer volume of carbon emission rights would have an impact on the secondary market carbon price in the case of paid allocation, and punishments for contract breaches can directly stimulate the market demand for carbon emission rights and, in turn, affect the price in the secondary carbon market [29]. Fan and Wang further argued the adequate sectoral coverage in the design of a Chinese emissions trading mechanism due to a huge diversity in regional economic development [30]. Zhang et al. point out that all pilot markets have directly or indirectly covered the energy-intensive, high-polluting, and high-emission sectors, providing a common base yet differentiated impacts when determining the CPT [31].

2.2.2. Carbon Emission Offsetting Mechanism

The carbon offset mechanism is a carbon price formation mechanism that urges emission reduction enterprises to trade carbon emission quotas in the secondary carbon market through certified emission reduction units. This mechanism is not only conducive to reducing the cost for enterprises but also provides certain subsidies for voluntary emission-reduction enterprises. Zhang et al. tested and found that the voluntary emission reduction will be adopted when the balance can be improved in the carbon system [32].
China Certified Emission Reduction (CCER) trading was opened in 2012 and suspended new projects as of 2017, but the registered projects are still trading. Li et al. established a two-level decision subgame and empirically supported the cost-saving effect before and after the CCER scheme in the provision of homogeneity and equivalence of the carbon emission quotas and CCER quotas [33]. SCII held that offsetting the regulations has a decisive impact on pricing for CCERs, and price differentiation exists among local pilot carbon markets where CCERs vary in originating regional restrictions. More studies believe that the effect of CCER was limited before the relaunch [34].

2.2.3. Carbon Financial Mechanism

The carbon financial mechanism uses the price forecasting function of carbon financial derivatives to form the CTP.
In China’s case, studies agree with the ineffective application of the carbon financial mechanism, which is believed to be one of the important reasons behind the lower carbon price in its pilot markets [35]. Zhu et al. found that when the gap between the carbon price and the marginal abatement cost (MAC) of CO2 is smaller, the carbon financial derivatives are more abundant [25]. Liu C et al. took regression tests and found an empirically significant relationship between the average price of carbon emission rights and the total amount of regional carbon emissions in a six pilot Chinese markets but failed to find significant and negligible relationships between the issuance amount of green bonds and the transaction amount of carbon emission rights [36]. It is generally believed that with the deepening of China’s financial market, the carbon financial mechanism will be much more important in stimulating carbon emission trading volumes.

2.2.4. Carbon Tax Mechanism

The carbon tax is priced by the government, which sets a tax rate on the carbon content of fossil fuels for greenhouse gas emissions and restricts the carbon emissions for enterprises through taxation. Studies have focused on the differences and correlations between the two pricing mechanisms of carbon tax and carbon trading from the three dimensions of carbon price fluctuation, transaction cost, and emission reduction effects. Comparatively, it is more elastic in the supply side of the carbon emission rights and has lower fluctuations in price under demand shocks [37]. Jiang pointed out that the government directly acts on fuel prices in the form of taxation, thereby affecting demand and guiding the formation of market carbon prices through price intervention [38]. Liu L et al. believed that the carbon tax mechanism fixes the price of carbon emissions through the setting of tax rates despite the uncertainty in reducing carbon emissions [26]. Therefore, it is believed that the government’s taxation control function is an important path to stabilizing the CTP if China adopts the practice.

2.3. The Influencing Factors of the CTP

The formation mechanism of the CTP analyzed above showed that the CTP may be affected by market trading, policies, and the development of the economy.
Some literature addresses the factors affecting the CTP. Overseas scholars explore the driving and decisive factors related to carbon prices, mainly taking the EU carbon ETS as the research object. Dutta analyzed the data of the EU emission trading mechanism and believed that after the voluntary emission reductions and forestry carbon sinks obtained by emission control companies are offset with their own emissions, the rest will be traded in the secondary market [39]. Moreover, through the analysis of chaos theory, Dutta found that the positive and negative feedback mechanisms of the market and the heterogeneous environment directly determine the formation of the carbon price [39]. Wang analyzed the formation of the carbon financial mechanisms in developed western countries and pointed out that the United States actively implemented the carbon financial trading mechanism after the introduction of the Kyoto Protocol and effectively predicted the price fluctuations in the carbon trading market through the trading volume of carbon financial futures to promote carbon resource market stability [40]. Practice has also shown that the futures price of the EU carbon market can predict and prevent carbon price risks well [29]. Santos et al. found that, even though the Austrian government presented a plan to introduce a carbon price, there are still uncertainties about the design of the carbon pricing instrument, the institutional and regulatory framework, revenue recycling policies, the impacts on sectoral GDP, the competitiveness indicators, and international trade; meanwhile, the transport sector should require special attention in terms of mitigation and adaptive measures [41].
China’s carbon market has a relatively short development time in pilot regions [4]. Most of China’s scholars focused on single or multiple carbon pilot cities with active carbon trading [4,14,15]. Based on the regional spatial gap, the level of industrial development, the degree of low-carbon industry development, the degree of air pollution, and green technology maturity are thought to be the main factors that affect the CTP in China’s eight pilot areas [1]. In the selection of the influencing factors, the factors of macroeconomics and energy prices are more recognized. Regarding factor impact, the effects of energy prices, weather changes, and policy measures are more differentiated [42,43].
According to the formation mechanism of the CTP analyzed above and the relevant literature on the factors affecting the CTP, we could identify and summarize the influencing factors of the CTP from the macroeconomic factors, energy price factors, policy factors, and environmental factors.

2.3.1. Macroeconomic Factors

The macroeconomic development level is the economic base in the carbon total emission trading mechanism and, in turn, affects CTP changes. Macroeconomic activities affect the production and operation of emission-control enterprises and the supply and demand of the carbon market, as well as cause fluctuations in the CTP. Empirically, Conrard et al. modeled the adjustment process of EUA prices in accordance with the European Commission’s second national allocation plan and demonstrated that the rise in EUA prices was inseparable from future and current economic activities [12].
Macroeconomic factors appear to negatively affect the CTP changes in China. Wang and Hu used the EEMD method to decompose the CTP and the inherent mode function to analyze the impacts of the internal market mechanism and the external market environment, and the results showed a significant negative relationship between the growth rate of GDP in various regions and the CTP [44]. Chu et al. analyzed the effect of macroeconomics on carbon prices in different quartiles and qualitatively displayed that macroeconomic factors matter for price changes, with medium prices being more sensitive [45]. Some studies apply the industrial development level to macroeconomic factors. Song et al. took the improved gray relational analysis model and found the industrial index had a negative impact on the CTP, depending on the location of the pilot markets. Zhu et al. argued that industrial development implied an increase in energy inputs, which led to an increase in the carbon trading price [46]. Song et al. argued that industrial upgrading might affect the impact direction of aggregate economic activities on the CTP [1].

2.3.2. Energy Price Factors

Energy price factors reflect economic needs for high-carbon energy sources, which are internalized as the multiple mechanisms of the CTP. The consumption of related energy by enterprises will generate large amounts of CO2, so changes in energy prices will have an impact on carbon emissions, which, in turn, will affect the formation of carbon prices. The literature agrees on and empirically supports the fact that fossil fuel prices are important factors affecting the CTP. Zhou and Li considered that there is a long-term equilibrium relationship between the carbon emissions trading price and energy prices [47]. Sun and Zhang empirically supported that carbon price prediction accurateness was significantly enhanced by using energy price fluctuation as an influencing factor on carbon price prediction [5]. Kanamura applied an inverse Box-Cox MAC curve and a reduction process to model a price correlation between EU allowances (EUAs) and secondary certified emission reductions (sCERs), and the empirical results showed that energy prices have a positive impact on EUA prices, and this is much stronger than on sCERs prices [48].
Empirical studies based on Chinese carbon trading markets show that the effects of energy price factors differ with energy sources, and the impact of the natural gas price is much less emphasized. Wang and Hu used the EEMD method to decompose the CTP and found that, under the internal mechanism of the market, there is a positive impact between energy prices and the CTP [44]. Zhu et al. proposed a multiscale analysis model to explore and identify the drivers of carbon prices over different time scales and found that coal prices have a negative effect on carbon prices [49]. Li used the cointegration test and impulse response analysis method to study the influencing factors of the CTP by selecting the interval data of Beijing and Shanghai from 2018 to 2019 and found that the prices of crude oil and natural gas have a positive impact, while the coal price negatively impacts the CTP [50]. Lin and Xu observed that coal prices have an inverted U-shaped nonlinear impact on carbon prices, which means that coal prices push carbon prices up; in the long run, the changes in coal prices will help reduce carbon prices [51].

2.3.3. Policy Factors

Carbon emission standards, emission control targets, carbon tax, and other emission control policies, as well as quota policies, such as carbon emission allowance allocation, are all direct factors affecting the CTP. Zhang et al. took the construction route and operation mode of the EU carbon trading as research objects and pointed out the close correlation between the carbon market and carbon control goals and other policies by analyzing the reasons for the fluctuation in carbon prices in three stages. He also proposed that China should coordinate with policies and measures, such as green certificates and total coal volume control, while introducing various basic systems for the carbon market [52]. Peng and Chen selected the MSM model to predict the fluctuation in the CTP in China’s pilot projects and found that adjusting the proportion of free carbon emission allowances has a negative impact on the CTP, while the establishment of a new carbon emission market may well raise the CTP [53]. Zhang et al. believed that China’s carbon market is still a regional market driven by government policy [54].

2.3.4. Environmental Factors

Some scholars believe that the environment is a factor affecting the CTP, and some scholars do not believe this [1]. Air temperature or pollution degree can affect energy consumption directly or induce governance policies to limit work and production and, in turn, affect and demand for carbon emissions rights and the CTP [1].
Bredin and Muckley used Johansen’s multivariate cointegration likelihood ratio test to study the impact of climate and environmental factors on the expected price of CO2 emission allowances in the United States from 2005 to 2009. The results showed that the increase in the air quality index increases the price of carbon emission rights trading, and extremely high temperatures and extremely low temperatures also have a certain degree of impact on the carbon price [55].
The differing results of the environmental factors also appear in the studies of the Chinese CTP. Jiang and Wu selected three carbon trading pilots in Beijing, Shanghai and Hubei, and tested the effects of weather changes on carbon prices. The results showed that weather changes were positively correlated with CTP [17]. Li selected the interval data of Beijing and Shanghai from 2018 to 2019, and through the cointegration test and impulse response analysis, the analysis concluded that air quality negatively affects carbon prices, while there is no impact between abnormal weather and carbon prices [50]. Song et al. empirically found that environmental factors had a negative, positive, or little impact on the carbon trading price, depending on the factor selection and market location [1]. The results contributed to the ineffective responses to emissions reduction policies and geographic conditions.

2.4. Literature Reviews

From the perspective of the research object, overseas scholars have uncovered a lot of research results on the carbon market price in the EU. The European carbon emission price is influenced by trading mechanisms, the environment, financial markets, and policy systems. However, the actual economic situation in Europe is different from that in China in many aspects. The research conclusion on the EU carbon market is conducive to providing certain guiding significance for China in establishing a unified carbon emission quota market. With the deepening of China’s carbon emission trading market research, a consensus on the research of the CTP still has not been obtained. Although there is some relevant literature, a comprehensive study on the carbon prices of multiple pilot markets is necessary for the smooth operation of China’s unified carbon emission trading market.
Although most research on the factors affecting the CTP focus on energy prices, macroeconomic development, policy factors, and environmental conditions, these are not sufficient enough to depict the whole story. Up to 90% (65% on average) of the fluctuations in the carbon price, when adjusted for effects of supply, are explained by fluctuations in fundamental market variables [56]. On the factors of energy prices, the importance of the natural gas price is hardly emphasized. A few studies involved the impact of environmental factors on the CTP, and fewer agreed with the impact extent and significance of this. Regarding the dimensions of time and space, much less studies have been empirically conducted against a background of the “double carbon” goal. Therefore, there is a need to make the research indicators more comprehensive and predictive.
In summary, the current paper takes Beijing, Shenzhen, Shanghai, Hubei, and Guangdong (the five pilot carbon markets) as the incision to explore the relationship between environmental factors, energy prices, macroeconomic factors, and China’s regional CTP and establish a random effect model, exploring the impact of the relevant variables on the CTP. We conduct a multiangle analysis from both a theoretical and empirical perspective, sorting the relevant research on the formation mechanism of the CTP and the factors affecting the CTP at the theoretical level, analyzing the current status of the carbon trading market using empirical analysis.

3. Theoretical Hypothesis of the Effects of the Factors on the CTP

According to the above literature review, the current paper provides three theoretical hypotheses on the mechanism by which the factors influence the CTP.
The fluctuations in the CTP reflect the balance change between demand and supply in the carbon emission quota. Therefore, the factors that affect this balance represent the key to analyzing the theoretical mechanisms, which include environmental factors, energy price factors, and macroeconomic factors. All of them are important in energy-saving and emission reductions, which is important for realizing China’s “double carbon” goal.

3.1. Effect of Environmental Factors on the CTP

Environmental factors affect the demand for the carbon emission rights and the CTP in two ways. Firstly, it can affect energy consumption directly. Secondly, it may induce governance policies to limit production, which relies on high-energy consumption. Usually, AQI or air temperature are used as the metrics to measure greenhouse gas emissions [57,58]. AQI is a more effective factor in the literature. Under the “double carbon” goal, AQI is strictly monitored and is receiving wider recognition in reflecting the level of pollution control. The larger the AQI is, the more serious the environmental pollution. This leads the government to strengthen the regulation of the environment, which means it is much more difficult for enterprises to get enough carbon emission quota allocations. The best choice for enterprises is to transform and upgrade their energy consumption structure to reduce emissions. In this way, the CTP will fall into a new balance.
Hypothesis 1.
The long-term and short-term coefficients of AQI on CTP are negative.

3.2. Effect of Energy Price Factors on the CTP

Energy price factors may have different effects due to different types of energy. Usually, traditional energy is represented by coal. When coal prices rise, in the short term, enterprises will not make many adjustments to the energy use structure, so carbon demand and carbon emissions will still rise, which has a positive impact on the CTP. However, in the long run, enterprises will shift part of their energy consumption to low-carbon energy, which will reduce carbon emissions and carbon quota demand to a certain extent and have a negative impact on the CTP. In China, coal is the most carbon-intensive and highest-proportional energy source. In the long term, China has surpassed all other countries in coal consumption and is dominant in coal pricing. Under the “double carbon” goal, coal price changes can facilitate the target. Therefore, we use the Bohai-Rim steam-coal price index (BSPI) as the traditional energy price, which also reflects the energy transition priority under “double carbon”. So BSPI has a positive impact on the CTP in the short term and a negative impact in the long term.
Similarly, the clean energy price has the reverse effect against high-carbon energy. The consumption of renewable energy plays a vital role in decreasing CO2 emissions [59]. The rise of the clean energy price will cause a demand increase for high-carbon energies and induce the demand increase for carbon allowances, which will see a rise in the CTP. The factor of the natural gas price is adopted in this paper as the clean energy price, with the following considerations: the project for the replacement of coal with natural gas was speeded up from 2017 to tackle carbon emissions and widely covered North China. Before 2020, natural gas, instead of renewable new energies, appeared to be a more reliable and large-scale clean energy source. Under the “double carbon” goal, the consumption of natural gas is the only fossil fuel that is not controlled. We use the liquefied natural gas index (LNGI) due to the high proportional imports of natural gas in China. We believe that, in the short term, natural gas will receive attention and will be widely covered, which will have a positive impact on CTP prices. However, its long-lasting effects should be taken into account (the popularization breadth and the depth of use of natural gas), which will decrease the CTP. So LNGI has a positive impact on the CTP in the short term and a negative impact in the long term.
Hypothesis 2.
The short-term coefficients of BSPI and LNGI on CTP are positive and the long-term coefficients are negative.

3.3. Effect of Macroeconomic Factors on the CTP

In China, macroeconomic factors usually use SSEII as the metric, which means the macroeconomic level. The industrial development level affects the CPT in the carbon market through its demand for carbon emission quotas when the production and investment levels of industrial enterprises reflect China’s energy consumption. So, the CTP and SSEII fluctuate in the same direction. It is true that China has seen the prosperity of industrial development and an increase in energy consumption and carbon emissions across the nation. Under the “double carbon” goal, macroeconomic activities are also viewed as the main force that can drive rises in carbon emissions, so the demand for carbon emission quotas and, in turn, the CTP will change in the same direction.
Hypothesis 3.
The short-term and long-term coefficients of SSEII on CTP are positive.

3.4. Construction of the Basic Model

In summary, the current paper intends to select the daily average price data of five representative carbon trading pilot markets in Beijing, Shenzhen, Shanghai, Hubei, and Guangdong from January 2017 to December 2021, taking the AQI, BSPI, LNGI, and SSEII as the explanatory variables, and using them to build a linear coefficient model of the CTP. The model is given by Equation (1).
C T P = β 0 + β 1 A Q I + β 2 B S P I + β 3 L N G I + β 4 S E I I + ε
In Equation (1), βi is the coefficient of each explanatory variable.

4. China Carbon Emission Trading Market Status

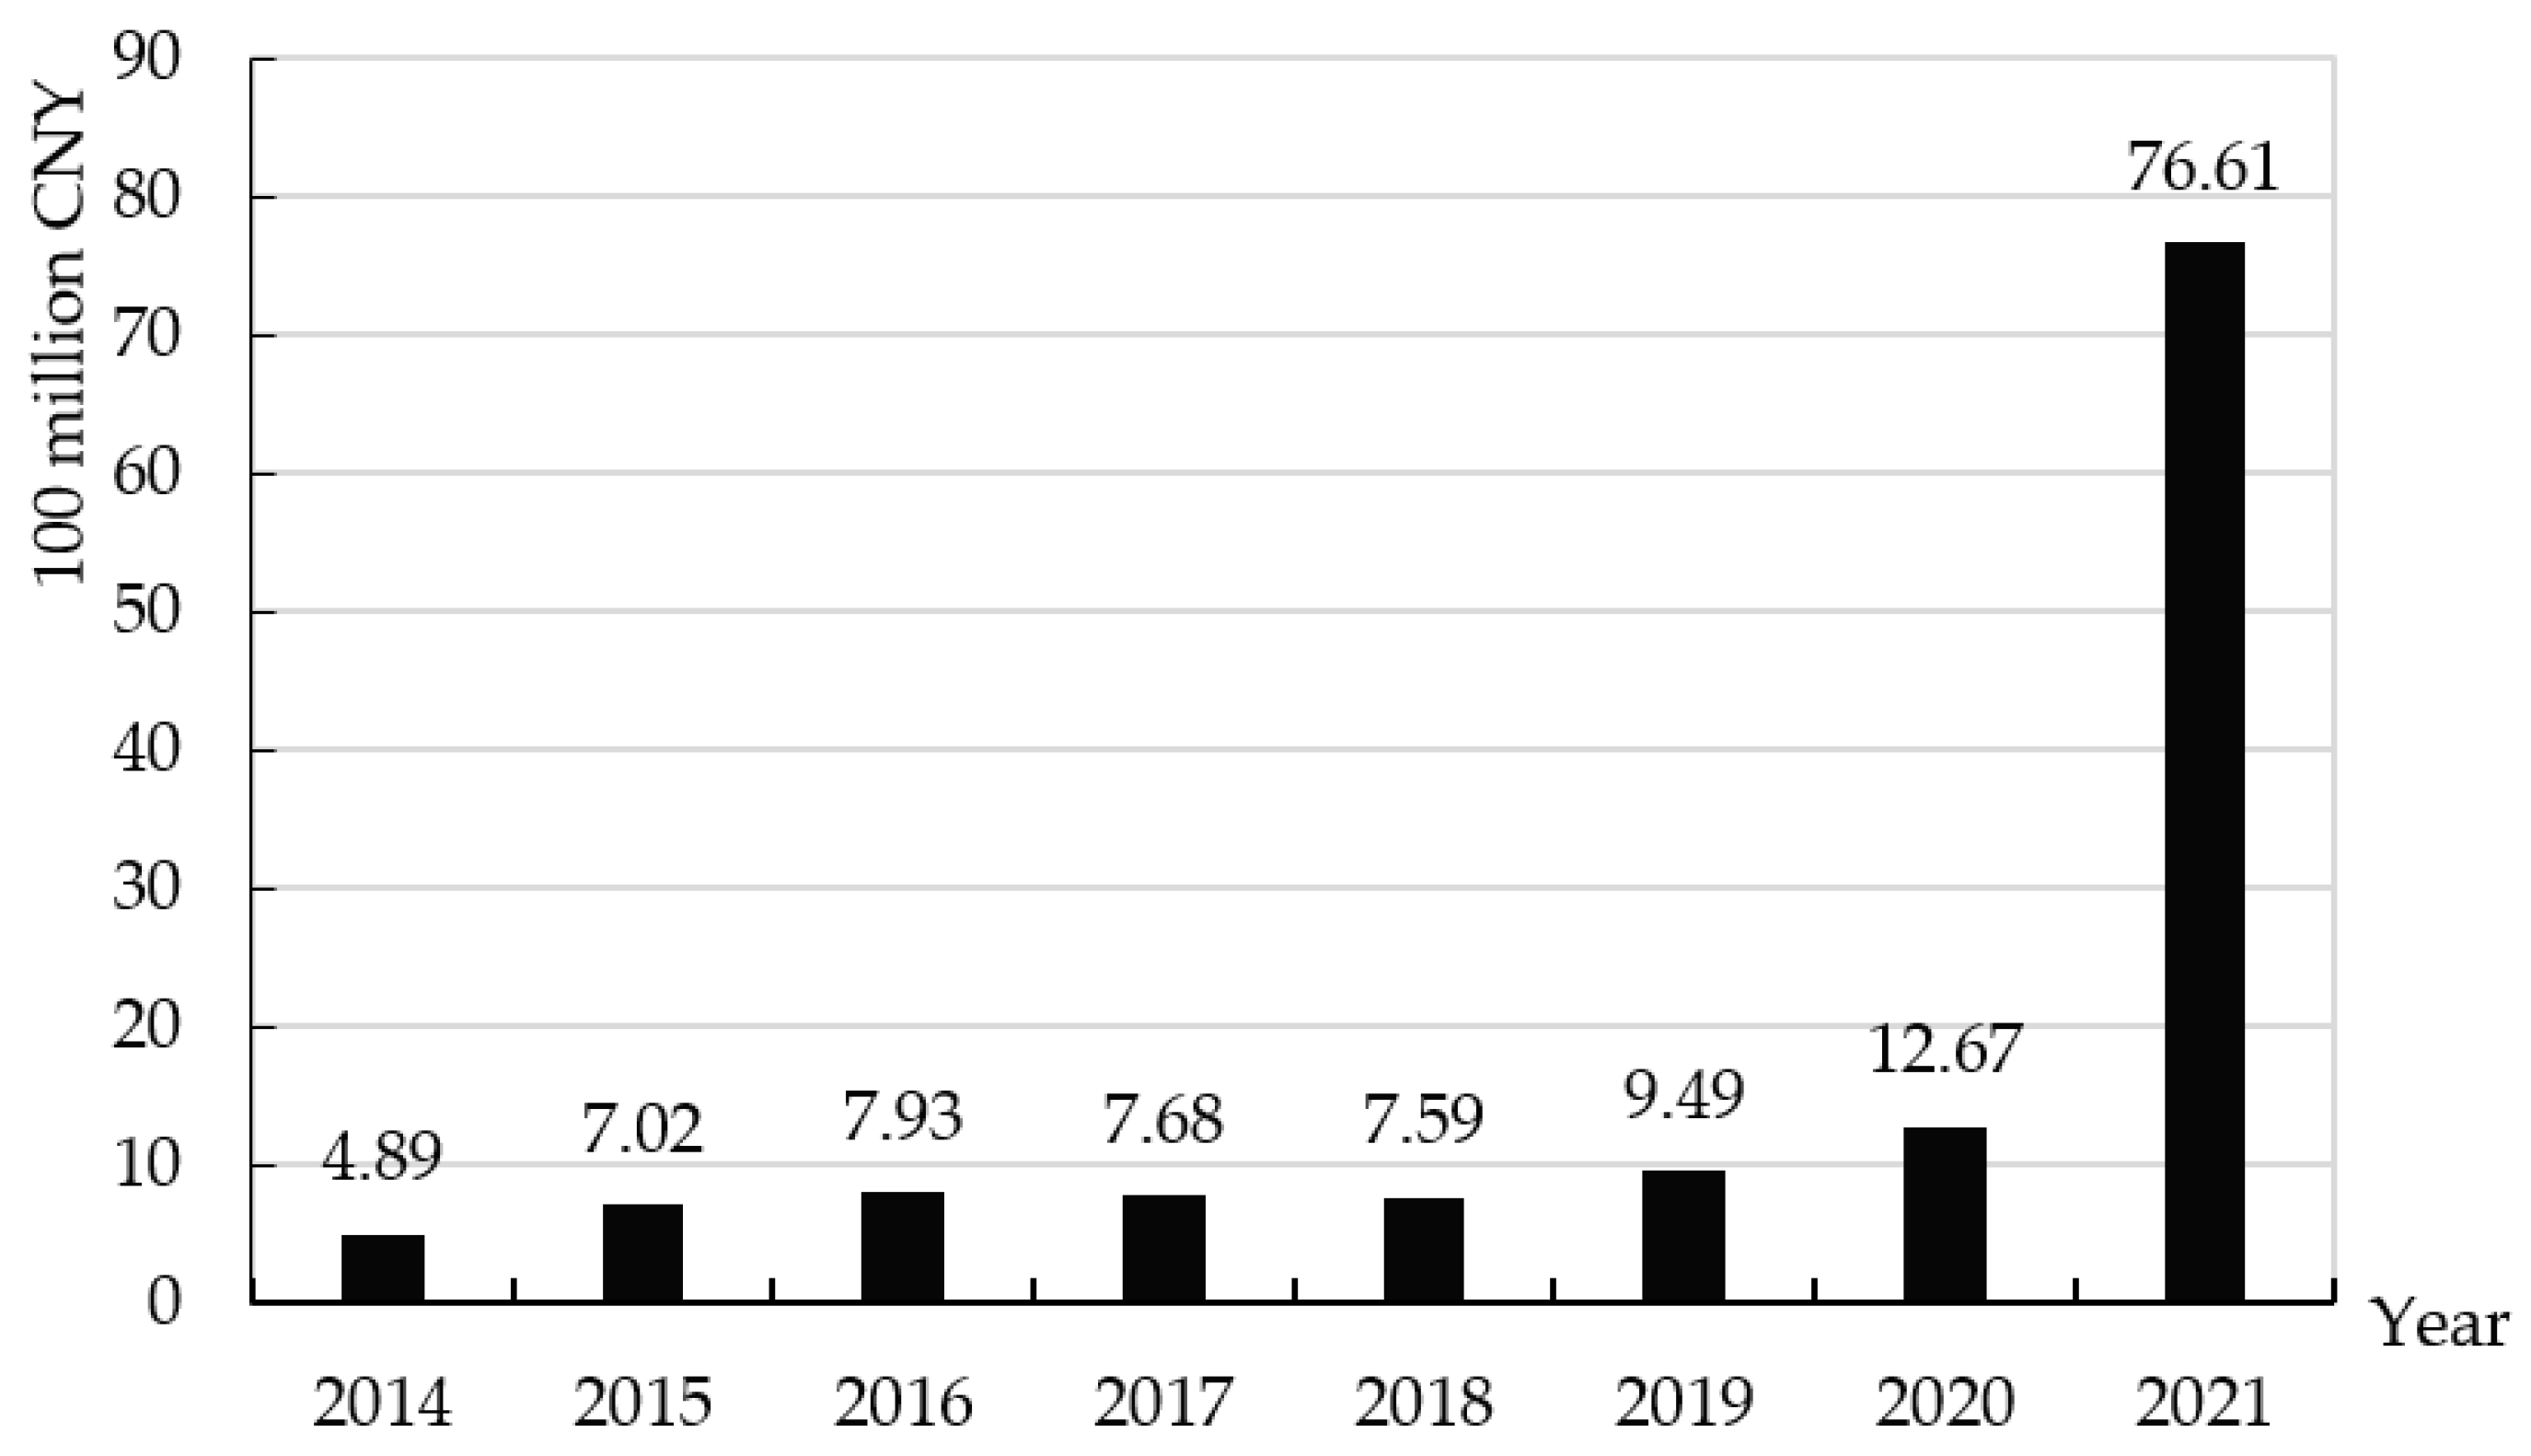
4.1. Development Progress

Global warming caused by the greenhouse effects and global climate anomalies is the common responsibility of all countries in the world. Since 1975, the average temperature of the Earth’s surface has risen by 0.9 degrees Fahrenheit. With the acceleration of industrialization processes, a large amount of CO2 generated by enterprises and daily human activities has triggered the greenhouse effect. In recent years, China has actively undertaken corresponding emission reduction tasks as a large carbon emissions country.
In 2005, China began to actively participate in the international CDM negotiations. In 2011, the National Development and Reform Commission issued a notice to set up seven carbon emission trading pilots in Beijing, Tianjin, Shanghai, Hubei, Guangdong, Chongqing, and Shenzhen. In 2013, seven carbon emission trading pilots were launched one after another, covering nearly 3000 key emission enterprises in more than 20 industries, including steel, power, chemicals, and building materials. Fujian Province launched the carbon trading market on 22 December 2016 as the eighth carbon trading pilot in China. In 2017, the National Development and Reform Commission issued the “National Carbon Emission Trading Market Construction Plan”, proposing to steadily promote the establishment of a unified national carbon market. In 2020, the Ministry of Ecology and Environment issued the Measures for the Administration of Carbon Emissions Trading and the Implementation Plan for the Total Settlement and Distribution of National Carbon Emissions Trading Allowances (Power Generation Industry) from 2019–2020 and established an institutional system to support the operation of the national carbon market. Since 2018, due to factors such as the economic downturn and insufficient market information, the amplitude of price fluctuations has started to rise while the frequency has been increasing, which shows an asymmetry trend [60]. China’s carbon emission trading policy has promoted a reduction in CO2 emissions and carbon emission intensity and has increased green development in the pilot areas [61]. China’s market access rules are still in the initial stage of establishment, and the relevant laws and regulations need to be improved.

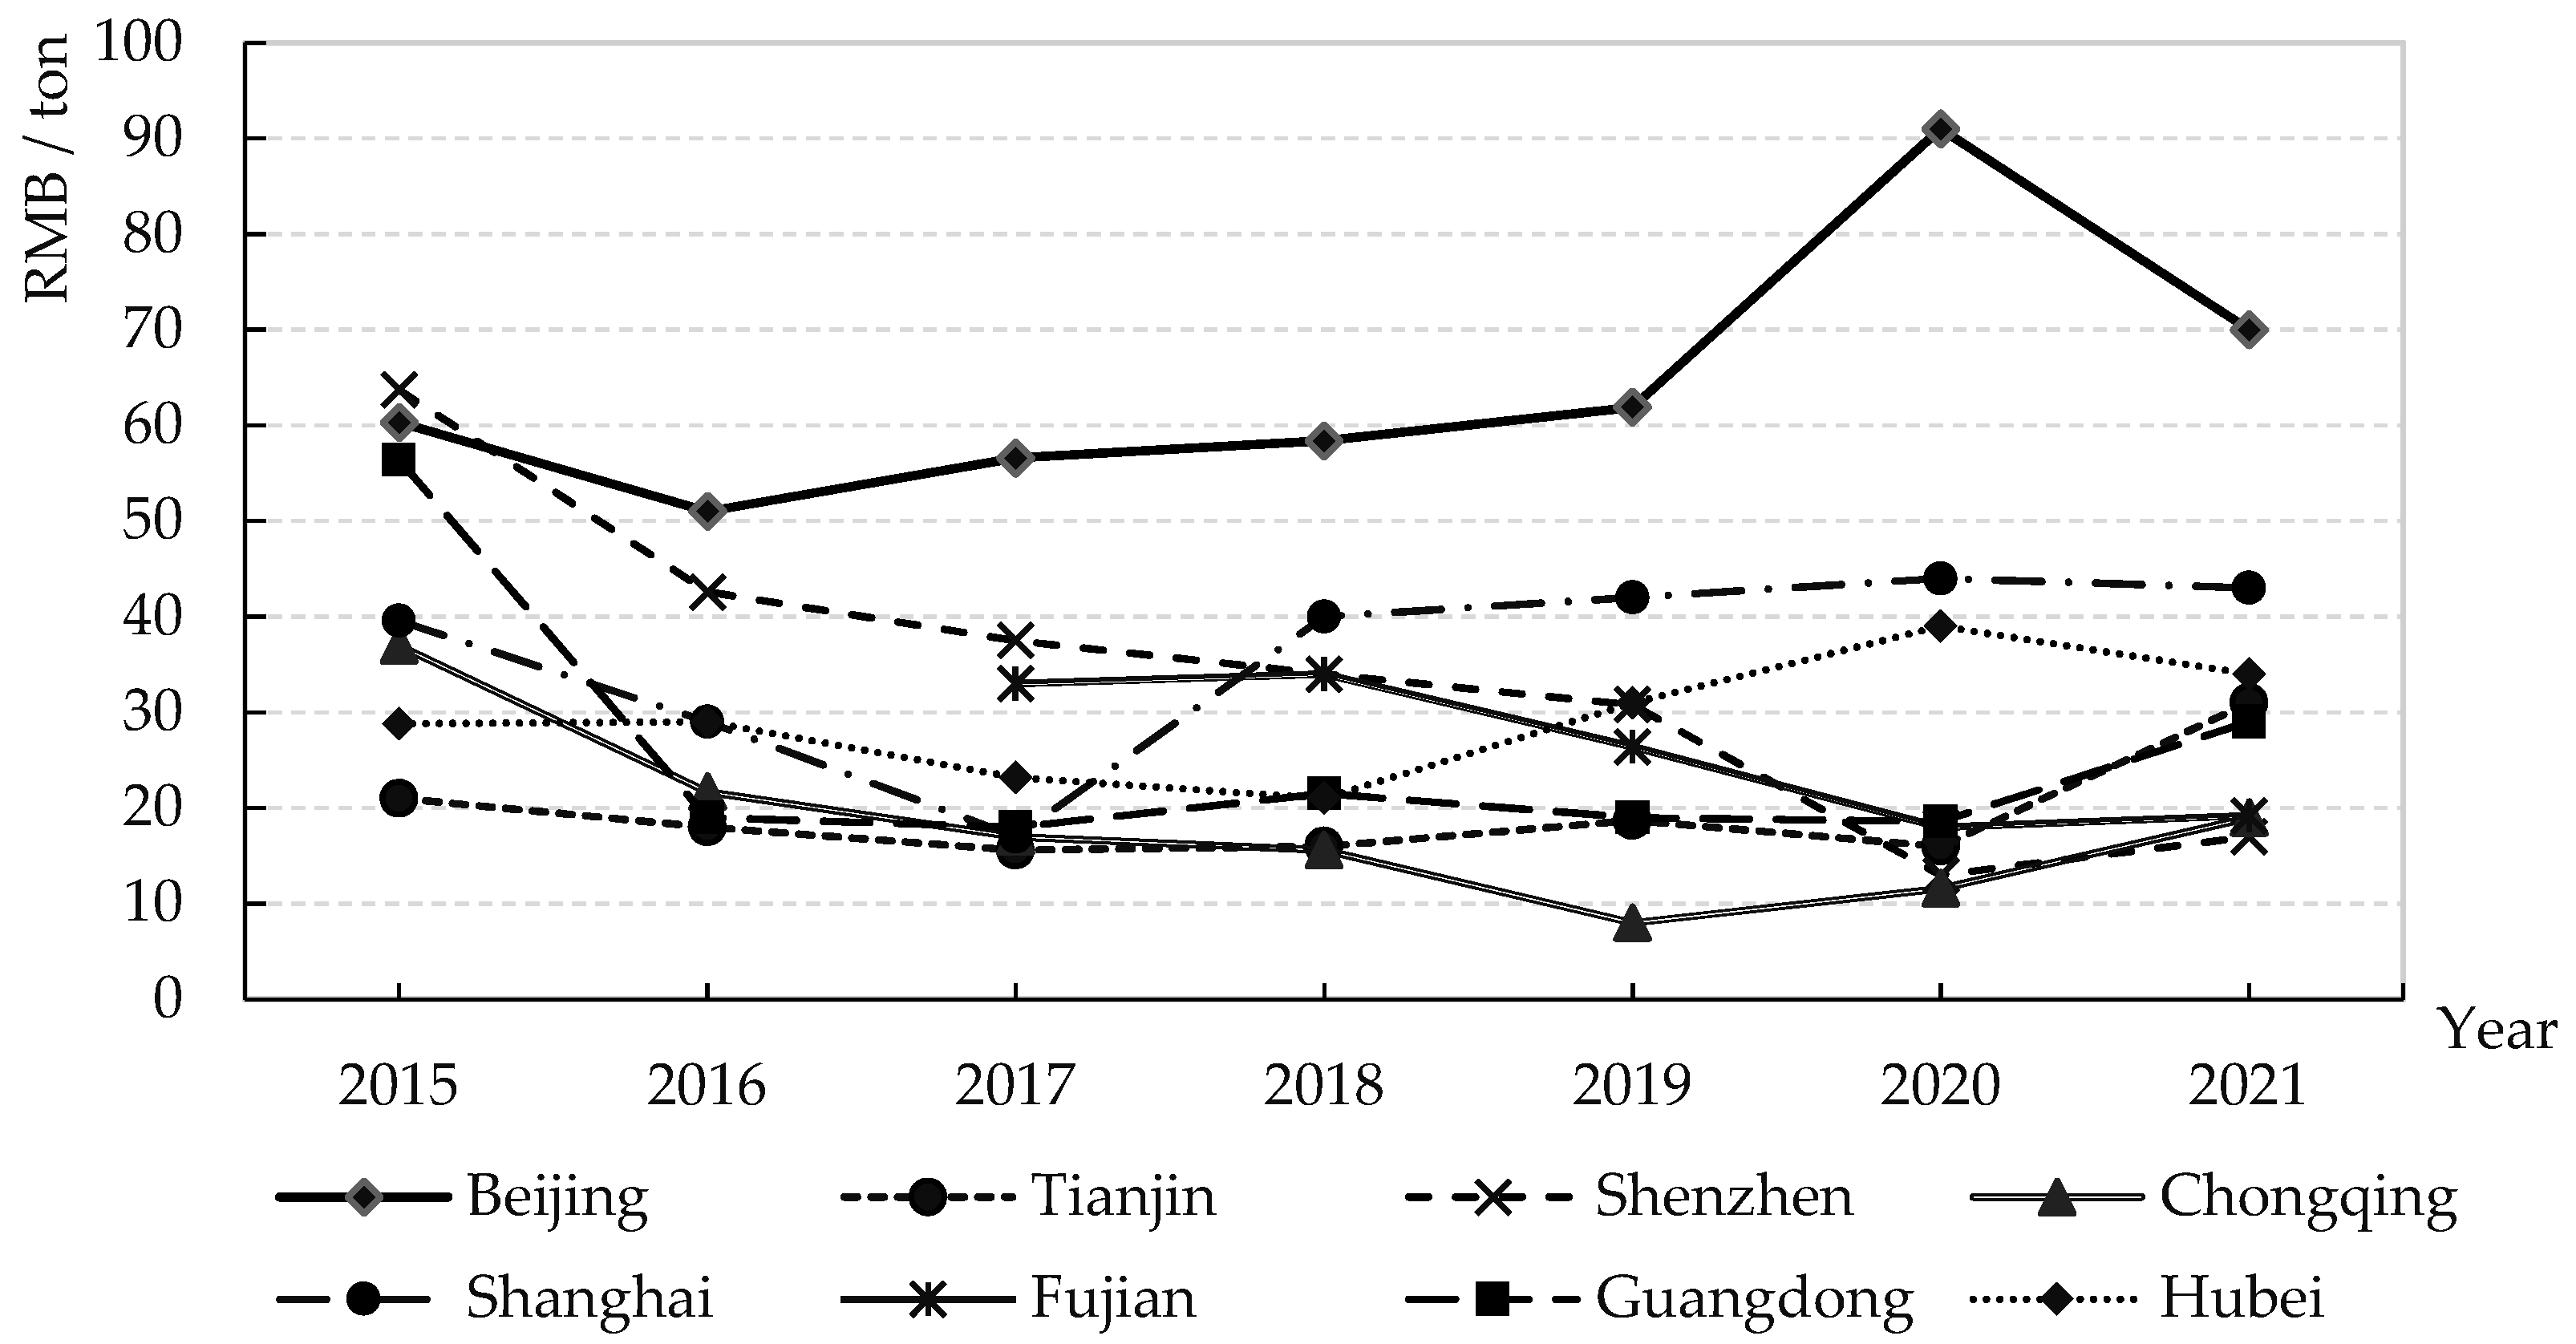
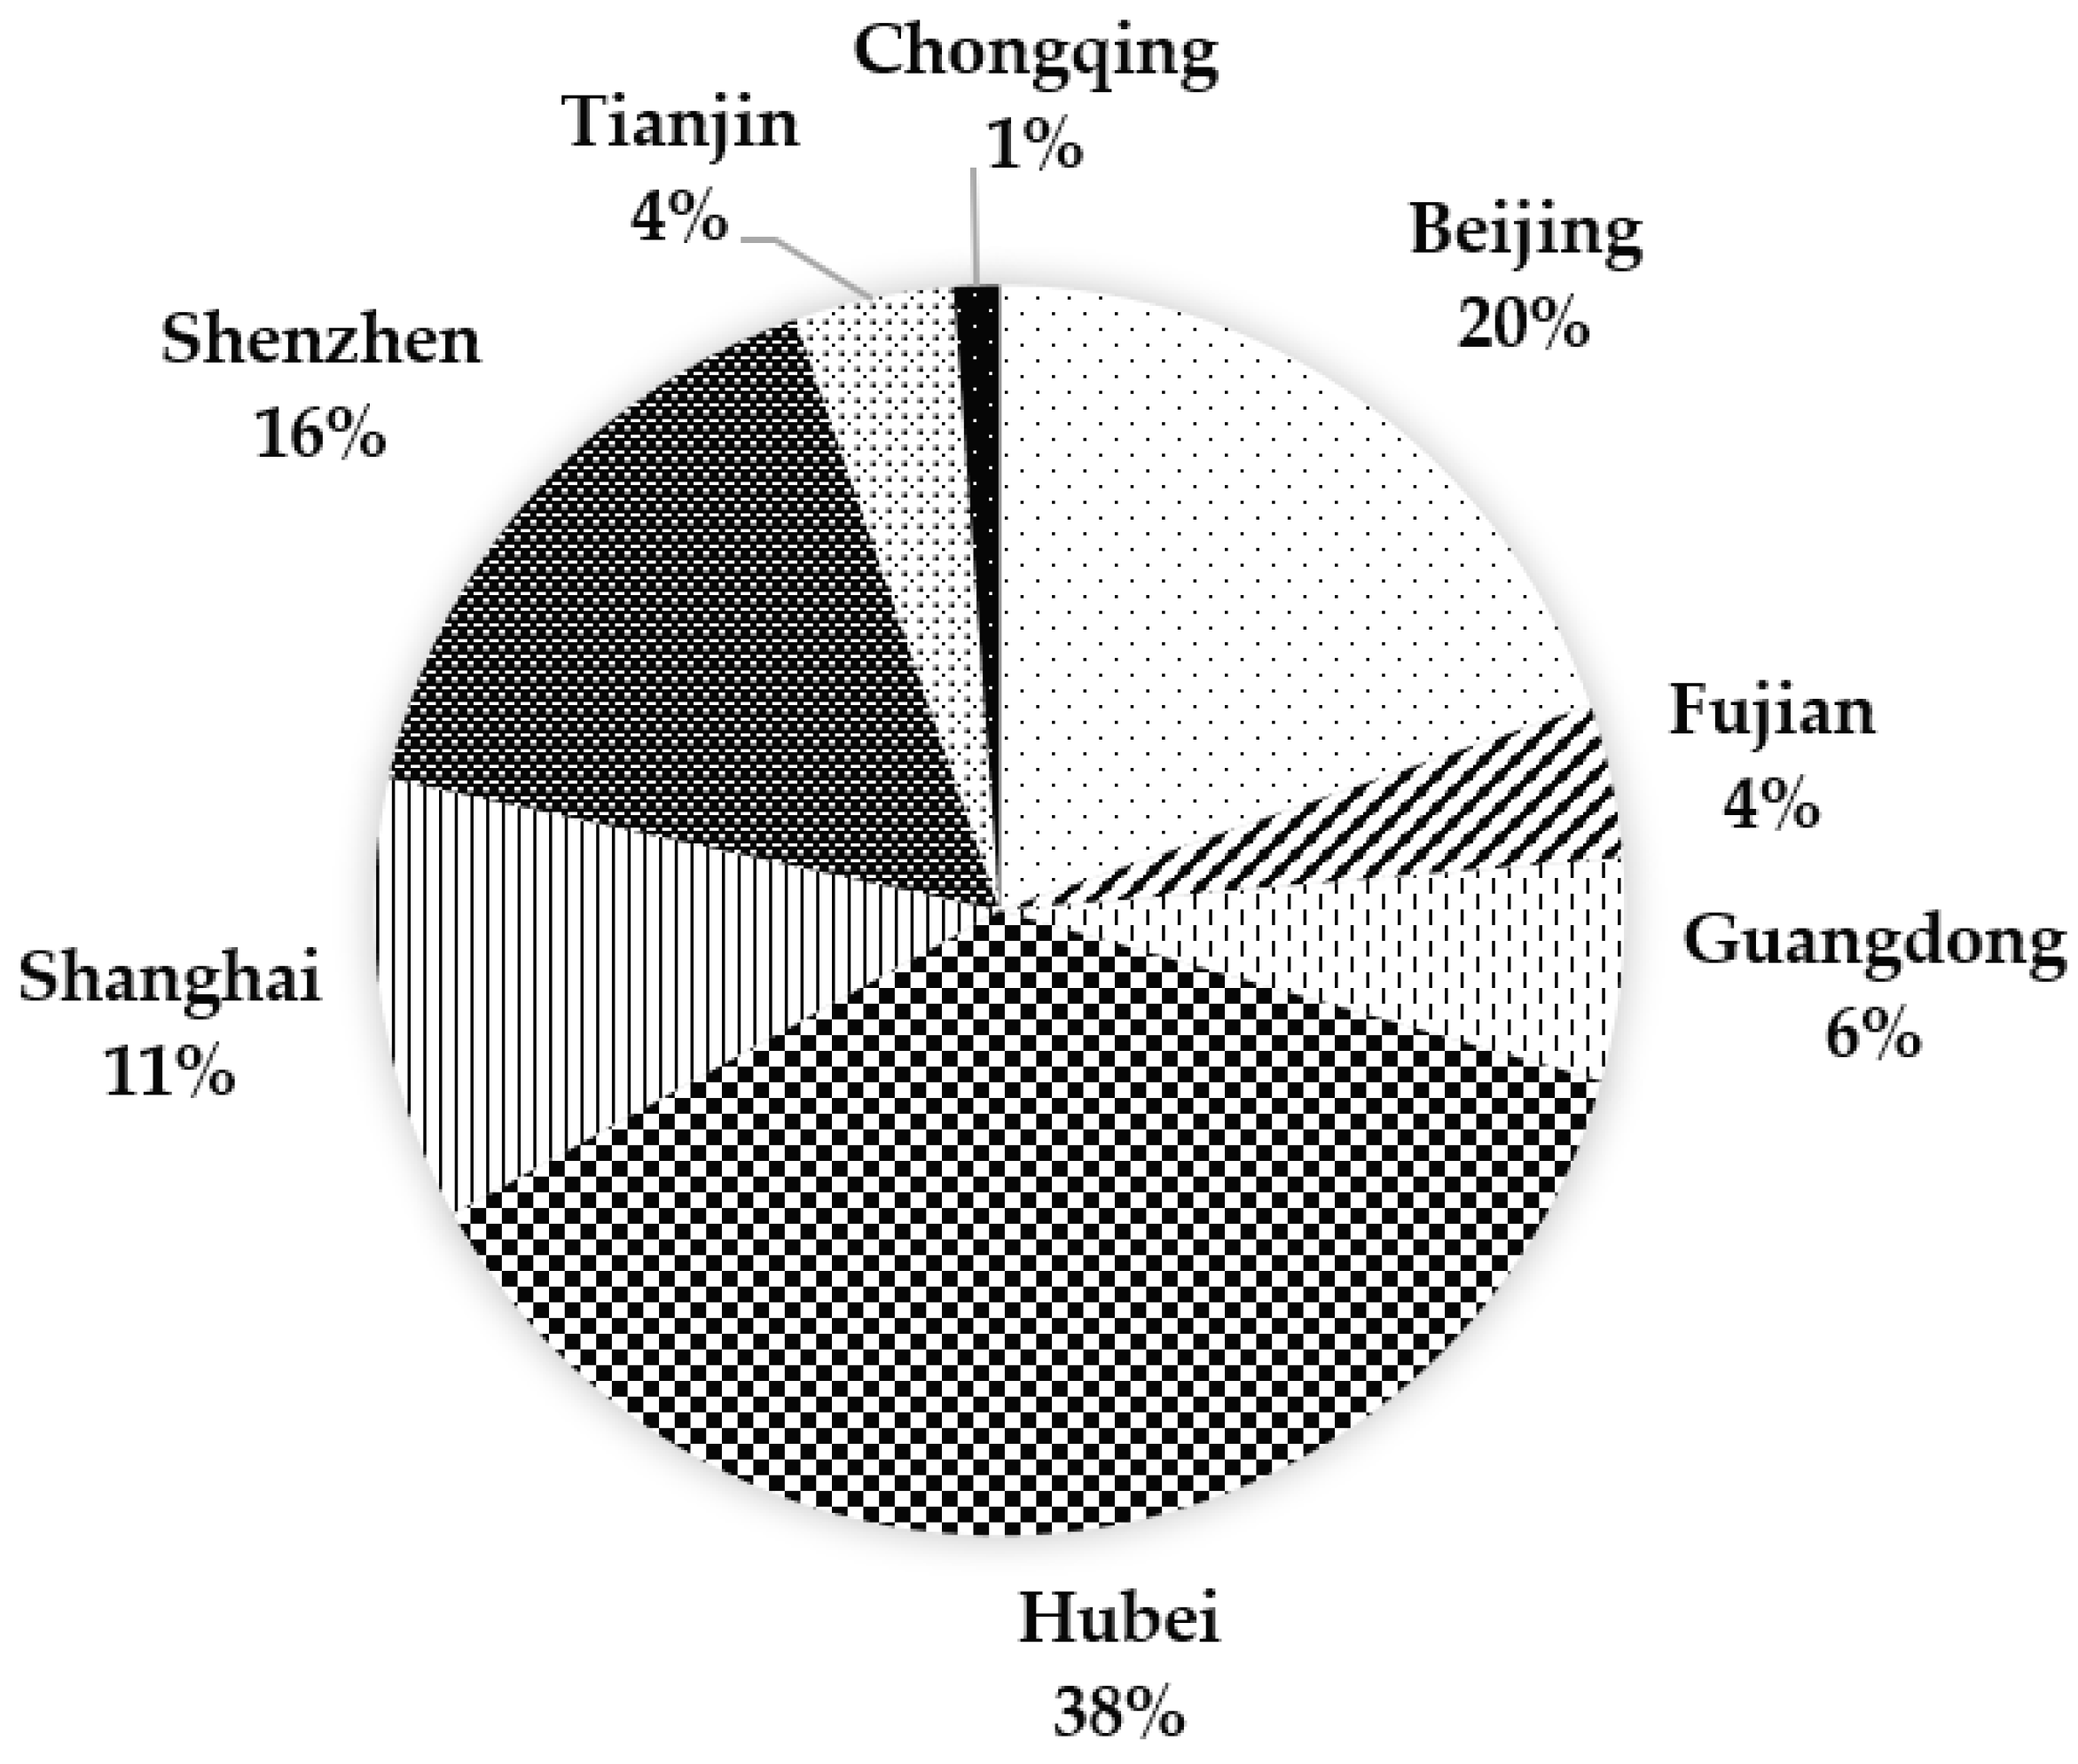
4.2. Status Analysis

In 2021, CCETE was launched. Up until 31 December, the cumulative transaction volume for carbon emission allowances was 179 million tons, and the cumulative transaction value was CNY 7.661 billion. The closing price on 31 December 2021 was 54.22 CNY/ton, which increased by nearly 13% compared to the opening price in July. More than half of the key emission enterprises participated in the transaction. Overall, the market ran smoothly, and the transaction price rose steadily. This is effective in promoting enterprises’ low carbon emissions.
From the perspective of the average CTP, there was a big difference in the eight pilot markets, and the fluctuation of the CTP is different too. The CTP, in the early stages, began to decrease, and in the later stage, it was adjusted. Figure 2 shows that the average daily CTP of Beijing was higher than that of the other pilot markets over the years, and the difference in the CTP between Beijing and other pilot markets continued to expand. Since the opening of Chongqing carbon emission trading pilot market, its CTP has generally been at a low level. The CTP in Tianjin fluctuated between 20–30 CNY/ton, and the CTP in Hubei and Shenzhen fluctuated between 20–40 CNY/ton. Since the opening of the Shanghai carbon emission trading pilot market, its average daily CTP had gradually decreased to less than 20 CNY/ton in 2017 and then was in an upward trend.
At present, when setting carbon prices in China, we adopt a total trading mechanism and a small amount (less than 10%) of carbon compensation mechanism. In the total trading system, we must first determine the total market share. In most cases, the carbon price in a primary market and the gap in the secondary market depend on the quota allocation system (paid or free) and the penalty for default. China has also adopted a carbon offsetting mechanism, which offsets some carbon dioxide emissions through nationally certified emission reductions and forest carbon sinks. At present, China has not adopted the carbon tax mechanism, and many studies have shown that the efficiency of combining the carbon tax mechanism with the total carbon trading mechanism is much higher than that of simply adopting a single mechanism. Finally, the carbon price formation mechanism using the function of the price prediction of carbon financial products has not been fully utilized in China, especially in the development and application of carbon derivatives, which have been used less.
From the perspective of China’s carbon trading market turnover, Figure 3 shows that the trading scale was getting larger and larger. A unified national carbon emission trading market is in the progress of being constructed. On 16 July 2021, the national carbon market officially started online trading, covering about 4.5 billion tons of carbon dioxide emissions annually, making it the largest carbon market in the world. In the first performance cycle of the national carbon market (2019–2020), the cumulative turnover of carbon emission quotas was 179 million tons, with a cumulative turnover of CNY 7.661 billion, and the growth rate was still rising.
From the perspective of each pilot’s total transaction volume, as shown in Figure 4, the transactions in Beijing, Shenzhen, Shanghai, Hubei, and Guangdong were the most active. From 2014 to 2021, Hubei Province accounted for the largest share of the total transaction volume, as its market activity was higher. The other pilots were far lower than the Hubei pilot in terms of total transaction volume. The proportion of Beijing, Shenzhen, and Shanghai decreased in sequence. Fujian, Tianjin, and Chongqing accounted for no more than 5%, and the market activity was lower. The big differences in the transaction volume of the different pilots reflect the unbalanced and unstable development of the carbon emission trading markets; this means the carbon trading mechanism should be improved.
From the perspective of the trading model of the carbon emission trading markets, the trading model currently adopted in China is mainly based on carbon emission quota trading, supplemented by State-certified voluntary emission reductions. Carbon emission quota trading is complied with the State’s formulation of the total annual carbon emission quota and distribution plan. Each enterprise conducts carbon trading according to the difference between its own CO2 emissions, and the quota indicators are given by the government, which can not only reflect the carbon emission level of different products but also when combined with the future development level, reflect the scarcity of the carbon emission quota. The total amount of quota allocation for each pilot is relatively sufficient in the current situation. Even some emission-controlled enterprises have excess quotas, coupled with the existence of quota offset mechanisms, resulting in a CTP that is too low. The setting of the total amount of carbon emission allowances directly affects the issuance of carbon quotas. Therefore, the “relaxed first and then tightened” market expectation of carbon quotas made it difficult to release an effective CTP signal. Due to the slightly higher standards of quota issuance, the emission-controlled enterprises could complete their compliance without participating in the carbon emission trading market, which led to low liquidity in the carbon emission trading market.
From the perspective of the participants in the carbon emission trading market, the national carbon trading market only included the power industry in the initial stage [62], and the number of first-batch key emission enterprises in the power generation industry was 2225, which showed the characteristics of relatively singular industry coverage and fewer trading entities. Although the power generation industry accounts for a large proportion of carbon emissions, due to the homogenization within the industry, the carbon emission reduction costs of power plants in the market were hardly different. This made market activity limited, which was not conducive to the role of the carbon emission trading mechanism in market allocation. During the “14th Five-Year Plan” period, China will consider introducing eight high-energy-consuming industries, such as building materials, petrochemicals, and steel, and gradually expand the market coverage. The photovoltaic and wind power industries have broad prospects. How to stimulate new vitality in the national carbon market has become an urgent problem to be solved.

5. Empirical Analysis of the Influencing Factors of the CTP

In order to support a comprehensive analysis of the reasons for the CTP in five Chinese markets, we construct the basic model to empirically test the hypothesis proposed in Section 3.4. The variable selection, date sourcing, model construction, and empirical analysis using the dynamic heterogeneous panel PMG Model are stated as follows.

5.1. Variable Selection and Data Sources

5.1.1. Variable Selection

The data samples selected in the current paper were large, which included two dimensions of time and space while also theoretically sorting out the influencing factors of the CTP.
1. CTP. The daily average of the CTP from January 2017 to December 2021 in the five carbon trading pilots in Beijing, Shenzhen, Shanghai, Hubei, and Guangdong was selected as the explained variable using panel data to explore the impact of environmental factors, macroeconomics factors, and energy price factors on the CTP.
2. IND. The industrial index was used as the macroeconomic factor explanatory variable, and 1221 data points of SSEII from January 2017 to December 2021 were selected. The macro economy affects the CTP through industrial economy development and the economic development level, directly affecting social consumption and demand. The SSEII can reflect China’s industrial development level directly and truly, so the current paper selected the SSEII as the macroeconomic factor explanatory variable.
3. GAS. The LNGI was used as the clean energy price factor explanatory variable, and 1221 LNGI data points from January 2017 to December 2021 were selected. As a clean energy source, liquefied natural gas has obvious advantages over traditional energy in terms of energy conservation and emission reductions and is an effective alternative to traditional energy.
4. COAL. The BSPI was used as the nonclean energy price factor explanatory variable, and 1221 BSPI data points from January 2017 to December 2021 were selected. The BSPI, as a release system for China’s thermal coal prices, is known as a coal wind vane and is often used as a decision basis for coal supply and demand companies to participate in trading activities. It is also an important reference index that can directly and objectively reflect the dynamics of the coal market.
5. AQI. China’s AQI was used as the environmental factor explanatory variable, and the data of AQI from January 2017 to December 2021 were selected. AQI can effectively reflect the degree of air pollution and the air quality level. CO2 is the main component of air pollutants, and the AQI can objectively measure the level of CO2 emissions in various regions.

5.1.2. Data Source

The selection of variables is shown in Table 1. The data of the CTP were sourced from the website of China’s ‘tanpaifang’. IND, GAS, and COAL were sourced from the wind financial database. The data of AQI were sourced from the data center of the Ministry of Environmental Protection.

5.2. Model Construction

5.2.1. Empirical Model Setting

The data samples selected in the current paper were large and included two dimensions of time and space. Meanwhile, by theoretically sorting out the influencing factors of the CTP from three aspects, as shown in Equation (1): environmental factors, energy price factors, and macroeconomic factors, a panel data regression model was established to explore the impact of each influencing factor on the average CTP of each pilot. The model is changed to Equation (2).
P R I C E i t = β 0 + β 1 I N D i t + β 2 G A S i t + β 3 C O A L i t + β 4 A Q I i t + ε i t
In Equation (2), i represents each pilot province (city), and t represents the effective trading day.
PRICE is the daily closing price of carbon emission trading, which is the explained variable.
IND, GAS, COAL, and AQI are explanatory variables. IND stands for SSEII, GAS stands for LNGI, COAL stands for BSPI, and AQI stands for AQI. β0 represents the individual effect. εit represents the random error term, and it is uncorrelated with the explanatory variables.

5.2.2. Descriptive Statistics of Variables

The measurement software used in the current paper is Stata/SE V16 (Perpetual Academic License Single user, Beijing Uone Info & Tech Co., Ltd., Beijing, China). In order to ensure the scientific and reliable results of the follow-up research, the original data of IND, GAS, COAL, and AQI were processed by unit transformation so as to unify the dimensions between the interpreted variables and the interpreted variables. Descriptive statistics of variables are shown in Table 2.

5.2.3. Correlation Analysis of Variables

In order to test whether the omitted variables would have an impact on the regression results, a correlation test for each variable was taken to test whether there was a pairwise correlation between the variables. The correlation test results are shown in Table 3.
The correlation coefficients between most of the explanatory variables were very small, less than 0.1. The correlation between IND and GAS is 0.243, the correlation between IND and COAL is 0.526, the correlation coefficient between GAS and COAL is 0.591, and the correlation coefficient between AQI and IND is −0.131. There is no strong correlation.
Secondly, as shown in Table 4, each variance inflation factor (VIF) is less than 10, that is, less than the maximum tolerance, indicating that there is no multicollinearity among the explanatory variables, so the model selection could be carried out.

5.3. Empirical Test

5.3.1. Cross-Section Correlation Test Result

CD statistics were used to test whether there was a correlation between the cross sections. Under the original hypothesis of “no cross-section correlation”, CD statistics obey an asymptotic standard normal distribution. The test results are shown in Table 5, so for all variables, we can reject the original hypothesis at the significance level of 1%. This shows that the panel data used in the current paper have a strong cross-sectional correlation.

5.3.2. Panel Unit Root Test Results and Cointegration Test Results

Because the panel data used in the current paper had a strong cross-sectional correlation, a unit root test was carried out on all the variables, and the results are shown in Table 6.
By using the llc unit root test directly for the variables, we obtained that the p values of PRICE, IND, and AQI were 0.000; that is, there was no unit root, while GAS and COAL did have a unit root, so the original data were tested again in the form of a first-order difference. The test results show that there is no unit root in the explanatory variables after the first-order difference.
In order to avoid a false regression caused by the introduction of original data into the model, we further carried out panel cointegration testing. The p value obtained by the Kao test was less than 0.01, so the original hypothesis can be rejected at the level of 1%. It can be considered that the panel studied in the current paper has a cointegration relationship.

5.4. Dynamic Heterogeneous Panel PMG Model Results

Because the panel data in the current paper had the characteristics of nonstationary, a cross-sectional correlation, a long period, and relatively few cross-sections (N = 5, T = 1207), the traditional fixed effect and random effect could not be effectively estimated.
Unobservable factors, such as the institutions and cultures in different regions, show systematic differences in the different regions, which will not only affect the intercept of the regression but also affects the sensitivity of the explained variables to the explained variables. Endogenous problems and the individual heterogeneity in these problems will greatly impact the correctness and effectiveness of the model estimation results, so these problems need to be corrected by the dynamic panel model. This paper attempts to establish a dynamic panel model by using the hysteresis term of the explained variables under the equilibrium condition to estimate the dynamic adjustment of each factor affecting the CTP. Pesaran proposed that the PMG method can effectively solve the problem of coefficient heterogeneity in the process of dynamic panel estimation. So, the lag term was taken into account in the model, and the dynamic heterogeneous panel PMG model was used for short-term and long-term simultaneous investigations. This is useful in analyzing the long-term and short-term influencing factors of the CTP.
The long-term relationship between the constraint variables of the PMG model is consistent, and the short-term coefficient and the coefficient of error correction terms are allowed to be different among different cross sections. In order to better achieve an effective balance between long-term consistency and short-term heterogeneity.
From the dynamic regression results of all the data, we can see that the impact of IND on the CTP is always positive and significant, whether it is long-term or short-term. Based on the unit root test, GAS and COAL have a unit root, so the first-order difference was introduced into the model.
Gas has a negative effect in the long run and a positive effect in the short run. Coal has always maintained a positive impact, which can reflect (to a certain extent) the fact that the utilization rate of traditional energy in China is still very high, and the replacement of clean energy has not achieved an impact. The AQI exponent is negative, which accords with Hypothesis 1. The influencing factors of the CTP are driven by similar factors in the long-term path, but in the short term, different provinces and cities will have different dynamic fluctuations due to the heterogeneity of the variable factors.
Regarding the long-term and short-term adjustment coefficients under the PMG model, if the long-term adjustment coefficient, that is, the adjustment coefficient of error correction term (ECM), is positive and significant, this shows that there is a long-term stable cointegration relationship between the explained variable and the explained variable.
From the estimated results in Table 7, the long-term adjustment coefficients of the five provinces and cities are positive and significant, and the estimated values of the coefficients range from 0.943 to 0.999. This shows that there is a long-term stable co-integration relationship between the explanatory variables studied in the current paper and the CTP. The short-term adjustment coefficients of each explanatory variable vary greatly among the different regions, so it can be considered that there is obvious regional heterogeneity. Among them, the coefficients of IND are all positive except Beijing, which is consistent with all the original PMG data results in Table 8.
The short-term influence factor of the CTP in the Shanghai area is the significant positive influence of IND, the coefficient is 0.083, and it has passed the 5% significance test. However, the Beijing area is more positively affected by GAS. The Beijing area has a high penetration rate for natural gas and a high replacement rate for clean energy, so its regression result is positive, which accords with Hypothesis 2. Guangdong and Hubei are significantly positively affected by IND, which accords with Hypothesis 3.

6. Conclusions and Recommendations

6.1. Conclusions

6.1.1. Effect of Industrial Sector on the CTP

The industrial sector has a positive effect on CTP volatility. The more prosperous the economy, the higher the CTP. The macroeconomic situation directly affects the production and investment of industrial enterprises, and the development of the economic situation affects the total demand of the entire society. The fluctuations in the CTP are related to the investment decisions of market participants, the formulation of enterprise production and operation plans, and the realization of global emission reduction targets. Industrial enterprises will adjust their production and operation scale to change their own carbon emission trading needs according to the situation, and then this will affect the CTP. When the economic situation continues to improve, consumers’ willingness to consume increases, and the total social demand increases. In order to obtain more profits, enterprises will choose to expand production and investment, thereby increasing carbon emissions and increasing the demand for carbon allowances, thus making the CTP rise. When the economy is down, market activity is reduced, the production willingness of enterprises is reduced, and the demand for carbon emission allowances is reduced, resulting in a decline in the CTP.

6.1.2. Effect of Energy Price on the CTP

In the current paper, natural gas as a clean energy-to-traditional energy substitution reduces carbon emissions and the CTP in the long term, but in the short term, there is still no significant effect. In the long run, as China allocates carbon quotas, and when a few production sectors have insufficient carbon quotas, they will choose to trade carbon quotas through the carbon market or change the type of energy structure. When the price of an energy source rises, the carbon trading scheme will increase through quota trading in the carbon market. If the production department changes the energy structure and chooses low-carbon energy types, such as clean energy or new energy for production, it will reduce the carbon emissions of the production department itself, thus promoting a decline in the CTP.
Energy prices are the main factor affecting the CTP. Promoting the smooth functioning of the carbon market requires industrial restructuring to reduce reliance on nonclean energy. The energy price is the main factor affecting the CTP. For nonclean energy, taking coal as an example, this study found that when the price of coal rises, carbon emissions and the CTP keep increasing in both the short and long term. Enterprise production is still highly dependent on the use of traditional energy sources, such as coal and natural gas. Fossil energy accounts for more than 80% of China’s primary energy consumption. Coal and oil are still mainly used in most steel, heavy industry, electricity, and other fields. Coal has the highest carbon density, accounting for 56.9%. Heavy industry is still the main component of China’s economic development. The use of fossil energy, such as coal and oil, produces a large amount of carbon dioxide, and different energy consumption produces different carbon emissions, so it has a positive impact in the long and short term.

6.1.3. Effect of Air Quality on the CTP

When improving air quality to make the CTP mechanism come into play, improvements in air quality will positively drive the demand for carbon emission allowances, which will make the CTP mechanism come into play in a timely and effective manner. The AQI has an inhibitory effect on improving the transaction amount of the carbon emission quota and enhancing the CTP response mechanism. Improving air quality and reducing the AQI will directly cause the CTP to rise. Industry is an important source of air pollution. At the same time, automobile exhaust fumes, garbage incineration, and the use of boilers in daily life are all important causes of air pollution. These production activities will increase the concentration of CO2 in the atmosphere and increase air pollution. The air quality detection index is usually expressed by the AQI. The higher the AQI, the higher the increase in the concentration of CO2 in the atmosphere, which will directly affect the demand for carbon emission quotas by those subjects limited by carbon quotas, causing CTP fluctuations. Each country can improve air quality by formulating relevant standards, increasing emission reduction efforts, controlling greenhouse gas emissions, and limiting the emission targets of the production sectors to regulate the production sector’s demand for carbon allowances.

6.2. Policy Recommendations

Based on the above analysis of the factors affecting the CTP, the following policy recommendations are put forward for the improvement of CCETE.
Regarding the strengthening of environmental governance and improving air quality, the use of environmental factors, such as the AQI, will drive the demand for carbon emission allowances. This will make the CTP mechanism come into play in a timely and effective manner. The AQI has an inhibitory effect on improving the transaction amount of carbon emission quotas and enhancing the CTP response mechanism. Therefore, it is possible to predict CTP fluctuations and take relevant countermeasures in advance. An increase in the AQI indicates that the area is heavily polluted, meaning an increase in CO2 emissions per unit area. Through the AQI, the government can predict the fluctuation trend for the CTP in advance and formulate relevant countermeasures, such as strengthening environmental governance and improving air quality so as to adjust the emission indicators of the production sector.
Regarding optimizing the energy structure and promoting the transformation and upgrade of industry, the results show that the price of the related products in the energy market is the main factor affecting the CTP. Due to the substitution effect between clean energy and nonclean energy, manufacturers can adjust their energy structure to meet the national emission reduction targets. Therefore, when formulating macro controls, the government should attach great importance to the adjustment of the energy structure, set the proportion of the consumption of the related energy products, and strictly control the excessive consumption of fossil energy. On the one hand, the government should actively develop green energy, increase the use of clean energy by production enterprises, reduce dependence on traditional energy, help enterprises to lean towards clean energy, and carry out transformation and upgrading to balance the fluctuations in the CTP caused by the energy market. Price comparison effects can promote the optimization of regional emission structures. On the other hand, the government should increase investment in technology, improve the efficiency of energy use through technological innovation, and control CO2 emissions from the production side so as to avoid the fluctuations in the CTP caused by changes in the prices of the related energy products.
Regarding increasing the number of trading entities and expanding the market coverage, in the process of promoting the smooth operation of the national unified carbon market, it is necessary to introduce more industries into the carbon emission reduction plan, increase trading varieties, and increase market activity. The eight high-energy-consuming industries, namely building materials, petrochemicals, and steel, should be introduced as soon as possible to effectively expand market coverage and expand the prospects of the photovoltaic and wind power industries, effectively stimulating new vitality in the national carbon market. At the same time, there are large differences in the CTP in each pilot carbon trading market, and the fluctuations between regions are different. It is necessary to balance the development differences between regions and adjust the price in a timely manner according to the emission reduction needs of various regions.

6.3. Research Deficiencies

Although some innovations have been made by combing the existing literature, there are still deficiencies. For example, in the selection of the influencing factors, although the study pursues the comprehensiveness of the topic, there may still be other factors that have a certain impact on the CTP that have been missed. In the selection of the variables, the policy system is affected by human activities as it involves artificial formulation; there is no suitable variable selected for empirical analyses. The study proposes that future studies should explore the policy factors in different countries on the effect of the CTP on carbon emission reductions.

Author Contributions

Conceptualization, S.Z. and Y.T.; methodology, S.Z., Q.F. and Y.T.; software, S.Z., Q.F. and Y.T.; validation, S.Z.; formal analysis, S.Z., Q.F. and Y.Y.; investigation, S.Z., D.Y. and Y.T.; resources, S.Z., D.Y. and Y.T.; data curation, S.Z., Q.F. and Y.T.; writing—original draft preparation, S.Z., D.Y. and Y.T.; writing—review and editing, S.Z., Q.F. and Y.Y.; visualization, S.Z.; supervision, S.Z.; project administration, S.Z. and Y.Y.; funding acquisition, Y.Y. and S.Z. All authors have read and agreed to the published version of the manuscript.

Funding

This research was funded by the Humanities and Social Sciences Fund, Ministry of Education of China: 18YJA790097, 18YJCGJW001; Zhejiang Provincial Natural Science Foundation of China, grant number LY19G030009; 2022 Hangzhou Normal University Graduate Research Innovation Promotion Project, grant number 006.

Conflicts of Interest

The authors declare no conflict of interest.

Appendix A

Table A1. The abbreviations of key terms.
Key TermAbbreviations
Carbon trading priceCTP
Air quality indexAQI
Bohai-Rim steam-coal price indexBSPI
Liquefied natural gas indexLNGI
Shanghai stock exchange industrial indexSSEII
China carbon emission trade exchangeCCETE
European Union EU
Carbon dioxideCO2
Emissions trading systemETS
EU emission allowanceEUA
secondary certified emission reductionssCERs
China Carbon Emissions DatabaseCEADs

References

  1. Song, X.; Zhang, W.; Ge, Z.; Huang, S.; Huang, Y.; Xiong, S. A Study of the Influencing Factors on the Carbon Emission Trading Price in China Based on the Improved Gray Relational Analysis Model. Sustainability 2022, 14, 8002. [Google Scholar] [CrossRef]
  2. NDRC, China 2050 High Renewable Energy Penetration Scenario and Roadmap Study. Available online: https://www.efchina.org/Attachments/Report/report-20150420 (accessed on 6 October 2022).
  3. Statement by H.E. Xi Jinping, President of the People’s Republic of China, At the General Debate of the 75th Session of the United Nations General Assembly, Chinadaily 22 September 2020. Available online: https://language.chinadaily.com.cn/a/202009/23/WS5f6a9cc2a31024ad0ba7b25f.html (accessed on 23 September 2020).
  4. Wang, L.; Yin, K.; Cao, Y.; Li, X. A new grey relational analysis model based on the characteristic of inscribed core (IC-GRA) and its application on seven-pilot carbon trading markets of China. Int. J. Environ. Res. Public Health 2019, 16, 99. [Google Scholar] [CrossRef] [PubMed] [Green Version]
  5. Sun, W.; Zhang, J. Carbon price prediction based on ensemble empirical mode decomposition and extreme learning machine optimized by improved bat algorithm considering energy price factors. Energies 2020, 13, 3471. [Google Scholar] [CrossRef]
  6. Zhao, B.; Sun, L.; Gao, S. Effects of Government Regulations on Under-Reporting of Carbon Emission Transfers by Enterprises in Supply Chains. Sustainability 2022, 14, 9269. [Google Scholar] [CrossRef]
  7. Komarova, A. State Regulation of Energy Transition and Economic Development. Energies 2022, 15, 4304. [Google Scholar] [CrossRef]
  8. Ji, C.; Li, X.; Hu, Y.; Wang, X.Y.; Tang, B.J. Research on carbon price in emissions trading scheme: A bibliometric analysis. Nat. Hazards 2019, 99, 1381–1396. [Google Scholar] [CrossRef]
  9. Zeng, S.; Zhang, H.; Qu, Y.; Zeng, B. Study on price fluctuation and influencing factors of regional carbon emission trading in China under the background of high-quality economic development. Int. Energy J. 2021, 21, 201–211. [Google Scholar]
  10. Ellerman, A.; Buchner, B. The European Union emissions trading scheme: Origins, allocation, and early results. Rev. Environ. Econ. Policy 2007, 1, 66–87. [Google Scholar] [CrossRef]
  11. Zhu, H.; Tang, Y.; Peng, C.; Yu, K. The heterogeneous response of the stock market to emission allowance price: Evidence from quantile regression. Carbon Manag. 2018, 9, 277–289. [Google Scholar] [CrossRef]
  12. Conrad, C.; Rittler, D.; Rotfuss, W. Modeling and explaining the dynamics of european union allowance prices at high-frequency. Energy Econ. 2012, 34, 316–326. [Google Scholar] [CrossRef] [Green Version]
  13. Jiang, C.; Yue, Y. Sensitivity analysis of key factors influencing carbon prices under the EU ETS. Pol. J. Environ. Stud. 2021, 30, 3645–3658. [Google Scholar] [CrossRef]
  14. Sun, W.; Sun, C.; Li, Z. A Hybrid Carbon Price Forecasting Model with External and Internal Influencing Factors Considered Comprehensively: A Case Study from China. Pol. J. Environ. Stud. 2020, 29, 3305–3316. [Google Scholar] [CrossRef]
  15. Yang, J.; Dong, H.; Shackman, J.D.; Yuan, J. Construction of a carbon price benchmark in China—Analysis of eight pilot markets. Environ. Sci. Pollut. Res. 2022, 29, 41309–41328. [Google Scholar] [CrossRef] [PubMed]
  16. Lamphiere, M.; Blackledge, J.; Kearney, D. Carbon Futures Trading and Short-Term Price Prediction: An Analysis Using the Fractal Market Hypothesis and Evolutionary Computing. Mathematics 2021, 9, 1005. [Google Scholar] [CrossRef]
  17. Jiang, Y.; Wu, Z. Regression analysis of the factors affecting the carbon pricing in China. Environ. Sustain. Dev. 2021, 46, 77–83. [Google Scholar] [CrossRef]
  18. Yan, Z.; Cui, C. How Natural Gas Infrastructure Affects Carbon Emission Indicators in Guangdong Province? Sustainability 2022, 14, 8104. [Google Scholar] [CrossRef]
  19. Yang, X.; Zhang, C.; Yang, Y.; Wu, Y.; Yun, P.; Wagan, Z.A. China’s Carbon Pricing Based on Heterogeneous Tail Distribution. Sustainability 2020, 12, 2754. [Google Scholar] [CrossRef] [Green Version]
  20. Huang, S. Three Theoretical Pillars to Support ESG. Financ. Account. Mon. 2021, 19, 3–10. [Google Scholar] [CrossRef]
  21. Shi, D.; Zhang, C.; Zhou, B.; Yang, L. The True Impacts of and Influencing Factors Relating to Carbon Emissions Rights Trading: A Comprehensive Literature Review. Chin. J. Urban Environ. Stud. 2018, 6, 1850016. [Google Scholar] [CrossRef]
  22. Zhao, S. The essence of Coase theorem and its academic disputes. Economist 2004, 4, 92–96. [Google Scholar] [CrossRef]
  23. Wu, Q.; Wang, Y. How does carbon emission price stimulate enterprises’ total factor productivity? Insights from China’s emission trading scheme pilots. Energy Econ. 2022, 109, 105990. [Google Scholar] [CrossRef]
  24. Chen, S.; Huang, M.; Bin, H. Institutional Optimization of Sustainable Development of National Carbon Trading Market under Dual Carbon Target. Financ. Minds 2021, 4, 88–101,142–143. Available online: https://oversea.cnki.net/kns/detail/detail.aspx?FileName=CJZK202104006&DbName=CJFQ2021 (accessed on 20 May 2022).
  25. Zhu, R.; Long, L.; Gong, Y. Emission Trading System, Carbon Market Efficiency, and Corporate Innovations. Int. J. Environ. Res. Public Health 2022, 19, 9683. [Google Scholar] [CrossRef] [PubMed]
  26. Liu, L.; Zhang, Y.; Zhou, Q. Some Suggestions on the Carbon Taxation in China from the Perspective of Coordination of Policy. Tax. Res. 2022, 3, 121–126. [Google Scholar] [CrossRef]
  27. Green, J.F. Does carbon pricing reduce emissions? A review of ex-post analyses. Environ. Res. Lett. 2021, 16, 043004. [Google Scholar] [CrossRef]
  28. Peng, X.; Zhong, Y. Research on influencing factors and strategies of carbon emission trading price. Prices Mon. 2021, 12, 25–31. [Google Scholar] [CrossRef]
  29. Wu, H.; Zhang, Z. Price characteristics and its causes in China’s carbon market: Level, equilibrium and stability. World For. Res. 2021, 34, 123–128. [Google Scholar] [CrossRef]
  30. Fan, Y.; Wang, X. Which Sectors Should Be Included in the ETS in the Context of a Unified Carbon Market in China? Energy Environ. 2014, 25, 613–634. [Google Scholar] [CrossRef]
  31. Zhang, X.; Zhang, D.; Yu, R. Theory and Practice of China’s National Carbon Emissions Trading System. J. Manag. World 2021, 37, 80–95. [Google Scholar] [CrossRef]
  32. Zhang, J.; Liang, Z.; Matsumoto, T.; Zhang, T. Environmental and Economic Implication of Implementation Scale of Sewage Sludge Recycling Systems Considering Carbon Trading Price. Sustainability 2022, 14, 8684. [Google Scholar] [CrossRef]
  33. Li, L.; Ye, F.; Li, Y.; Chang, C. How will the Chinese Certified Emission Reduction scheme save cost for the national carbon trading system? J. Environ. Manag. 2019, 244, 99–109. [Google Scholar] [CrossRef] [PubMed]
  34. Li, Y.; Lv, Y. Research Progress of China’s Carbon Trading System. J. Shanghai Lixin Univ. Account. Financ. 2019, 3, 42–52. [Google Scholar] [CrossRef]
  35. Ji, C.; Hu, Y.; Tang, B.; Qu, S. Price drivers in the carbon emissions trading scheme: Evidence from Chinese emissions trading scheme pilots. J. Clean. Prod. 2021, 278, 123469. [Google Scholar] [CrossRef]
  36. Liu, C.; Luan, W.; Guo, G. Research on the Impact Mechanism of Green Finance Development on Carbon Rights Trading and Carbon Emissions. Trade Fair Econ. 2022, 7, 133–136. [Google Scholar] [CrossRef]
  37. Xie, C.; Li, J.; Xu, E. Construction of carbon pricing system based on carbon market and carbon tax. Int. Financ. 2021, 5, 20–31. [Google Scholar] [CrossRef]
  38. Jiang, J. Analysis of Carbon Pricing Mechanism and Proposals on the Improvement of China’s Carbon Market under Carbon Neutralization. Price Theory Pract. 2022, 2, 26–30,90. [Google Scholar] [CrossRef]
  39. Dutta, A.A. Impact of carbon emission trading on the European Union biodiesel feedstock market. Biomass Bioenergy 2019, 128, 105328. [Google Scholar] [CrossRef]
  40. Wang, H. International Experience, China Development and Prospect of Carbon Market Construction. Int. Financ. 2021, 12, 23–33. [Google Scholar] [CrossRef]
  41. Santos, L.; Steininger, K.; Cordeiro, M.C.; Vogel, J. Current Status and Future Perspectives of Carbon Pricing Research in Austria. Sustainability 2022, 14, 9684. [Google Scholar] [CrossRef]
  42. Ji, C.; Hu, Y.; Tang, B. Research on carbon market price mechanism and influencing factors: A literature review. Nat. Hazards 2018, 92, 761–782. [Google Scholar] [CrossRef]
  43. Li, Y.; Song, J. Research on the application of GA-ELM Model in carbon trading price—An example of Beijing. Pol. J. Environ. Stud. 2022, 31, 149–161. [Google Scholar] [CrossRef]
  44. Wang, Z.; Hu, Y. An empirical analysis of the factors affecting the carbon price in China. J. Ind. Technol. Econ. 2018, 2, 128–136. Available online: https://oversea.cnki.net/kns/detail/detail.aspx?FileName=GHZJ201802016&DbName=CJFQ2018 (accessed on 20 May 2022).
  45. Chu, W.; Chai, S.; Chen, X.; Du, M. Does the Impact of Carbon Price Determinants Change with the Different Quantiles of Carbon Prices? Evidence from China ETS Pilots. Sustainability 2020, 12, 5581. [Google Scholar] [CrossRef]
  46. Zhu, B.; Tang, J.; Wang, P.; Zhang, L. Exploring the drivers of carbon market risk: A meta regression analysis. J. Clean. Prod. 2022, 352, 131538. [Google Scholar] [CrossRef]
  47. Zhou, K.; Li, Y. Influencing factors and fluctuation characteristics of China’s carbon emission trading price. Phys. A Stat. Mech. Its Appl. 2019, 524, 459–474. [Google Scholar] [CrossRef]
  48. Kanamura, T. Role of carbon swap trading and energy prices in price correlations and volatilities between carbon markets. Energy Econ. 2016, 54, 204–212. [Google Scholar] [CrossRef]
  49. Zhu, B.; Ye, S.; Han, D.; Wang, P.; He, K.; Wei, Y.; Xie, R. A multiscale analysis for carbon price drivers. Energy Econ. 2019, 78, 202–216. [Google Scholar] [CrossRef]
  50. Li, Y. An empirical study on the external influencing factors of carbon emission trading pricing. Price Theory Pract. 2020, 6, 146–149. [Google Scholar] [CrossRef]
  51. Lin, B.; Xu, B. A non-parametric analysis of the driving factors of China’s carbon prices. Energy Econ. 2021, 104, 105684. [Google Scholar] [CrossRef]
  52. Zhang, J.; Wang, Z.; Lei, Y. The Enlightenment of the EU Carbon Market Experience to the Construction of China’s Carbon Market Chinese Full Text. Price Theory Pract. 2020, 1, 32–36,170. [Google Scholar] [CrossRef]
  53. Peng, W.; Chen, S. Analysis and Forecast of Carbon Trading Price in China’s Carbon Emission Pilot Market. J. Technol. Econ. 2020, 3, 102–110. [Google Scholar]
  54. Zhang, S.; Ji, H.; Tian, M.; Wang, B. High-dimensional nonlinear dependence and risk spillovers analysis between China’s carbon market and its major influence factors. Ann. Oper. Res. 2022, JUNE, 1–30. [Google Scholar] [CrossRef] [PubMed]
  55. Bredin, D.; Muckley, C. An emerging equilibrium in the EU emissions trading scheme. Energy Econ. 2011, 33, 353–362. [Google Scholar] [CrossRef]
  56. Lovcha, Y.; Perez-Laborda, A.; Sikora, I. The determinants of CO2 prices in the EU emission trading system. Appl. Energy 2022, 305, 117903. [Google Scholar] [CrossRef]
  57. Alberola, E.; Chevallier, J.; Chèze, B.T. Price drivers and structural breaks in European carbon prices 2005–2007. Energy Policy 2008, 36, 787–797. [Google Scholar] [CrossRef]
  58. Mansanet-Bataller, M.; Pardo, A.; Valor, E. CO2 prices, energy and weather. Energy J. 2007, 28, 73–92. [Google Scholar] [CrossRef]
  59. Ali, M.; Tursoy, T.; Samour, A.; Moyo, D.; Konneh, A. Testing the impact of the gold price, oil price, and renewable energy on carbon emissions in South Africa: Novel evidence from bootstrap ARDL and NARDL approaches. Resour. Policy 2022, 79, 102984. [Google Scholar] [CrossRef]
  60. Zhang, J.; Xu, Y. Research on the Price Fluctuation and Risk Formation Mechanism of Carbon Emission Rights in China Based on a GARCH Model. Sustainability 2020, 12, 4249. [Google Scholar] [CrossRef]
  61. Wu, Q.; Tambunlertchai, K.; Pornchaiwiseskul, P. Examining the Impact and Influencing Channels of Carbon Emission Trading Pilot Markets in China. Sustainability 2021, 13, 5664. [Google Scholar] [CrossRef]
  62. Chen, Y.; Sun, Y.; Wang, C. Influencing Factors of Companies’ Behavior for Mitigation: A Discussion within the Context of Emission Trading Scheme. Sustainability 2018, 10, 414. [Google Scholar] [CrossRef]
Figure 1. This is the carbon emission trading theory figure.
Sustainability 15 02203 g001
Figure 2. Average annual CTP of eight pilot carbon trading markets from 2014 to 2021 in China. Source: China Carbon Emissions Database (CEADs), http://www.ceads.net (accessed on 12 April 2022).
Sustainability 15 02203 g002
Figure 3. Cumulative turnover of eight pilot carbon emission trading markets from 2014 to 2021 in China. Source: China Carbon Emissions Database (CEADs), http://www.ceads.net (accessed on 12 April 2022).
Sustainability 15 02203 g003
Figure 4. Proportion of total transactions of eight pilot carbon emission trading markets from 2014 to 2021 in China. Source: China Carbon Emissions Database (CEADs), http://www.ceads.net (accessed on 12 April 2022).
Sustainability 15 02203 g004
Table 1. Variables selection in Equation (2).
Variable CategoryVariable NameVariable AbbreviationData Sources
the explained variable
PRICECTP of BeijingBEIJINGhttp://www.tanpaifang.coc/ (accessed on 12 April 2022)
CTP of ShenzhenSHENZHEN
CTP of ShanghaiSHANGHAI
CTP of HubeiHUBEI
CTP of GuangdongGUANGDONG
explanatory variables
macroeconomic factorSSEIIINDwind
nonclean energy price factorBSPICOAL
clean energy price factorLNGIGAS
environmental factorAQIAQIhttps://www.mee.gov.cn/ (accessed on 12 April 2022).
Table 2. Descriptive statistics of variables.
VariableMeanStd. Dev.MinimumMaximumObservations
PRICE34.86119.8713.030107.2606035
BEIJING65.27418.64724.000107.2601207
SHENZHEN21.24811.1823.03056.2401207
SHANGHAI37.8444.58024.75049.5001207
HUBEI26.1888.38311.56053.8501207
GUANGDONG23.7519.62711.05047.8001207
IND31.5212.94524.64437.1546035
GAS40.58211.55824.93276.3506035
COAL5.8870.5395.2608.4806035
AQI0.5950.1640.0407.8906035
Table 3. Correlation test results.
PRICEINDGASCOALAQI
PRICE1.000
IND0.0021.000
GAS−0.045 ***0.243 ***1.000
COAL0.0200.526 ***0.591 ***1.000
AQI0.024 *−0.131 ***−0.026 **−0.091 ***1.000
*** means p < 0.01, ** means p < 0.05, * means p < 0.1.
Table 4. Multicollinearity test results.
VariableVIFVIF
IND1.4100.710
GAS1.5540.644
COAL2.0220.495
AQI1.0190.982
Mean VIF1.501
Table 5. Cross-section correlation test result.
MethodCDP
PesaranCSD10.3570.000
FreesCSD0.9720.000
Table 6. Panel unit root test results.
VariableStatisticPD_VariableStatisticP
PRICE−9.3680.000D.PRICE−63.4240.000
IND−80.5330.000D.IND−53.0690.000
GAS−4.3010.988D.GAS−54.6770.000
COAL0.7841.000D.COAL−54.9460.000
AQI−53.3100.000D.AQI−88.2000.000
Table 7. Different region PMG model results.
VariableShanghaiBeijingGuangdongShenzhenHubei
ECM0.943 ***0.951 ***0.999 ***0.799 ***0.995 ***
(98.77)(106.53)(521.37)(46.05)(321.70)
IND0.083 **−0.0300.078 *0.0480.076 *
(2.03)(−0.44)(1.92)(0.66)(1.86))
D.GAS0.0050.245 **0.002−0.004−0.028
(0.17)(2.27)(0.19)(−0.03)(−1.60)
D.COAL−0.7304.9250.043−1.4380.208
(−0.66)(1.23)(0.10)(−0.29)(0.32)
AQI−0.1240.1380.414−0.9820.142
(−0.65)(0.09)(1.62)(−0.42)(1.25)
_CONS1.769 ***6.187 **−0.3775.153 **−0.081
(2.94)(2.38)(−1.63)(1.97)(−0.25)
obs12071207120712071207
Note: *** denotes rejection of the hypothesis at a 0.01 significance level. ** denotes rejection of the hypothesis at a 0.05 significance level. * denotes rejection of the hypothesis at a 0.1 significance level.
Table 8. Multicollinearity test results.
VariableStatisticZ
Long-term parameter
IND0.073 *1.80
(1.80)
D.GAS−0.015−1.63
(−1.63)
D_COAL0.0790.24
(0.24)
AQI−0.054−0.57
(−0.57)
Short-term parameter
ECM0.937 ***25.70
(25.70)
IND0.051 **2.40
(2.40)
D.GAS0.0440.87
(0.87)
D.COAL0.6020.54
(0.54)
AQI−0.082−0.34
(−0.34)
_CONS2.530 *1.88
(1.88)
Log likelihood−12,559.350
OBS6035
Notes: *** denotes rejection of the hypothesis at a 0.01 significance level. ** denotes rejection of the hypothesis at a 0.05 significance level. * denotes rejection of the hypothesis at a 0.1 significance level.
Disclaimer/Publisher’s Note: The statements, opinions and data contained in all publications are solely those of the individual author(s) and contributor(s) and not of MDPI and/or the editor(s). MDPI and/or the editor(s) disclaim responsibility for any injury to people or property resulting from any ideas, methods, instructions or products referred to in the content.

