Article

The Effect of FDI Agglomeration on Carbon Emission Intensity: Evidence from City-Level Data in China

1
School of Economics, Wuhan University of Technology, 122 Luoshi Road, Wuhan 430070, China
2
School of Management, Hubei University of Chinese Medicine, 16 Huangjiahu West Road, Wuhan 430065, China
3
Research Center for the Development of Traditional Chinese Medicine, Key Research Institute of Humanities and Social Sciences of Hubei Province, 16 Huangjiahu West Road, Wuhan 430065, China
*
Author to whom correspondence should be addressed.
Sustainability 2023, 15(2), 1716; https://doi.org/10.3390/su15021716
Submission received: 29 November 2022 / Revised: 13 January 2023 / Accepted: 14 January 2023 / Published: 16 January 2023

Abstract

:
How to accelerate the reduction of carbon emissions in the context of the “double carbon” target has become a key concern for all sectors of society. This paper firstly analyzes the influence mechanism of foreign direct investment (FDI) agglomeration on carbon emission intensity, from a theoretical perspective. Then, based on a panel data of 270 cities in China from 2006 to 2019, this paper uses ArcGIS software to visually analyze the spatial and temporal characteristics of FDI agglomeration and carbon emission intensity, and constructs traditional fixed effect models and spatial econometric models for empirical analysis. The results show that, first, FDI agglomeration has a significantly positive impact on the carbon emission intensity of local and neighboring cities with crowding effect. Second, the level of technological innovation can mitigate the crowding effect of FDI agglomeration on carbon emission intensity in local and neighboring cities. Third, there is a negative spatial autocorrelation between the local carbon emission intensity and the carbon emission intensity of neighboring cities. Fourth, the crowding effect of FDI agglomeration on carbon emission intensity is mainly concentrated in the central and western regions. Based on the research conclusions, this paper puts forward corresponding countermeasure suggestions.

1. Introduction

Since the reform and opening up of the country, China has experienced rapid industrialization and urbanization, and has grown rapidly to become the second largest economy in the world, with an average annual economic growth rate of 9.7% [1]. However, with the acceleration of industrialization and urbanization, energy consumption and the resulting carbon emissions have become increasingly serious. According to the World Bank, China has become the world’s largest energy consumer [2]. In 2019, China’s CO2 emissions reached 10,707.22 million tons, accounting for 31.18% of the world’s emissions. Faced with the increasingly severe situation of carbon emission reduction, the Chinese government has been committed to exploring a green and low-carbon economic development model. In 2015, the Chinese government put forward “Five major development” concepts, among which the concept of “green development” demonstrates the government’s firm determination and strategic resolve to promote green economic development. On 22 September 2020, at the 75th session of the United Nations General Assembly, China put forward the “double carbon” goal of carbon peaking and carbon neutrality. Subsequently, the report of the Twentieth National Congress of the Communist Party of China pointed out that we should actively and steadily promote carbon peaking and carbon neutralization, implement carbon peaking action in a planned way, and actively participate in global governance to address climate change. In this context, how to accelerate the reduction of carbon emissions and realize green development has become an important issue of concern to all sectors of Chinese society. At the same time, with the acceleration of the opening up of China to the outside world and the gradual expansion of the opening areas, the proportion of foreign investment in China has been rising from USD 10.289 billion in 1990 to USD 144.369 billion in 2020, becoming the world’s largest inflow of foreign investment. However, the spatial distribution of foreign direct investment (FDI) shows an obvious regional imbalance, which is manifested by the fact that foreign investment is mainly concentrated in the eastern region, especially in Beijing-Tianjin-Hebei, Yangtze River Delta, and Pearl River Delta regions, regardless of the number of foreign-invested enterprises or total foreign investment.
Will the spatial agglomeration of FDI affect the carbon emission intensity? Will the relationship between FDI concentration and carbon emission intensity be affected by the level of technological innovation? Will there be spatial spillover effect of FDI agglomeration? Clarifying these issues will help reduce carbon emissions, accelerate the transition to a green economy, and provide policy references for promoting coordinated, healthy, and sustainable development among cities. Unfortunately, the academic circle has not made a full answer to this question. Therefore, this paper attempts to explore the relationship between FDI concentration and carbon emission intensity from both theoretical and empirical aspects. Based on the panel data of 270 cities in China from 2006 to 2019, this paper first explores the influence mechanism of FDI agglomeration on carbon emission intensity, and uses ArcGIS software to visually analyze the spatio-temporal characteristics of FDI agglomeration and carbon emission intensity. Then, empirically investigates the impact of FDI concentration on carbon emission intensity and the moderating effect of the technological innovation level, and then, a spatial econometric model is constructed to investigate the spatial spillover effect of FDI agglomeration. The results are as follows: first, FDI agglomeration has a significant positive effect on urban carbon emission intensity, indicating that FDI agglomeration has a crowding effect on carbon emission intensity. Second, the level of technological innovation can negatively regulate the crowding effect of FDI agglomeration on carbon emission intensity. Third, FDI agglomeration in central and western regions has a significant promoting effect on carbon emission intensity, but the effect of FDI agglomeration in eastern regions on carbon emission intensity is not significant. Fourth, there is a spatial spillover effect of FDI agglomeration on carbon emission intensity, and there is a negative spatial autocorrelation between local carbon emission intensity and carbon emission intensity of neighboring cities, and FDI agglomeration has a positive effect on carbon emission intensity of local and neighboring cities. Both local and neighboring cities’ technological innovation levels help to improve the crowding effect of FDI agglomeration on carbon emission intensity.
The possible marginal contributions of this paper are as follows: First, from the perspective of research, the impact of FDI agglomeration on carbon emission intensity is investigated based on Chinese city-level data, which is a useful extension of the existing literature on the impact of FDI on carbon emission intensity, and can deepen the academic understanding of the relationship between FDI and carbon emission. Second, in terms of the research content, the mechanism of FDI agglomeration on carbon emission intensity, the regulatory role of technological innovation level, and the spatial spillover effect are deeply analyzed, with a view to revealing the influence of FDI agglomeration on carbon emission intensity from multiple dimensions.
The structure of other chapters is as follows: Section 2 is a literature review, which reviews the existing literature, points out the contribution of existing studies and further expands the research space of this paper. In Section 3, the influence mechanism is analyzed. Firstly, the overall influence of FDI agglomeration on carbon emission intensity and the regulatory effect of technological innovation levels are analyzed, and then the spillover effect of FDI agglomeration on carbon emission intensity is further discussed. Section 4 contains the empirical research design, including model setting, variable selection, and data sources. Section 5 is the analysis of empirical results. First, ArcGIS software is used to visualize the temporal and spatial distribution characteristics of FDI agglomeration and carbon emission intensity. Then, the overall impact of FDI agglomeration on carbon emission intensity and the regulatory role of technological innovation levels are investigated at the national and regional levels. Finally, a spatial Dubin model was constructed to investigate the spillover effect of FDI agglomeration on carbon emission intensity. Section 6 is the conclusion and suggestions, which summarizes the research conclusions and puts forward corresponding policy suggestions.

2. Literature Review

Carbon emission intensity refers to the carbon emissions generated per unit of gross domestic product (GDP), which is an important indicator to measure the quality of energy utilization and carbon emission efficiency. Academic research on carbon emission intensity mainly focusses on spatial and temporal distribution characteristics [3], spatial effects [4,5], and driving factors [6,7,8], investigating how financial geographic density affects carbon emission intensity by building a spatial model. On the one hand, financial geographic density can promote technological innovation and industrial structure upgrading, thus reducing carbon emission intensity; on the other hand, financial geographic density can promote industrial scale expansion, and thus increase carbon emission intensity. Xu et al. [3], based on the data of high-energy-consuming industries in 30 provinces of China from 2000 to 2019, found that the carbon emission intensity of China’s high-energy-consuming industries showed a spatial distribution pattern of “high in the west and low in the east” and “high in the north and low in the south”, and there was spatial autocorrelation between high and low concentrations. Technological innovation, energy structure, and industrial agglomeration have significant direct and indirect effects, which affect the carbon emission intensity of local and surrounding areas, through spatial spillover effects.
Agglomeration refers to the concentration of an economic activity in a specific space. The agglomeration of economic activities can not only affect the efficiency of resource allocation through price and competition mechanisms, but also generate externalities through infrastructure sharing and knowledge spillover, namely the agglomeration effect. As an investment capital, FDI generates initial agglomeration due to the basic attributes of a city, its geographical location, relevant policies, and other soft environments. As more and more capital come in, it will also bring more resources, further triggering agglomeration. At the same time, the enormous competitive pressure generated by the agglomeration core area will also force some enterprises to move from the agglomeration core area to the sub-core area, thus expanding the agglomeration area, to a certain extent. FDI agglomeration has been explored extensively by academics such as Ding et al. [9], by constructing a threshold model to investigate the impact of FDI agglomeration on water resources in the Yangtze River Economic Zone. The study found that there was a significant positive relationship between FDI agglomeration and water resources utilization efficiency when the threshold variable (GDP per capita) was below USD 2184 or above USD 12,058. However, the negative effect of FDI agglomeration on water use efficiency was not significant when the GDP per capita was in between. Yu et al. [10] constructed a spatial Durbin model (SDM) based on data from 285 cities in China from 2003 to 2017 to investigate the impact of FDI agglomeration on green total factor productivity, and found that FDI promoted green total factor productivity in high-cluster cities and low-cluster cities, while the promotion effect was not significant in low-high and low-low agglomeration cities.
The relationship between FDI agglomeration and carbon emission intensity is less studied in academic circles, and the existing literature mainly focuses on how FDI affects carbon emission intensity in host countries. How FDI affects the carbon emission intensity of host countries is an important issue that has been debated for a long time in academic circles. There are mainly two representative views: the “pollution paradise” effect and the “pollution halo” effect. The “pollution paradise” effect argues that FDI inflows exacerbate carbon emissions in host countries [11,12,13]. The “pollution paradise” effect refers to the fact that developed countries transfer energy-intensive and highly polluting industries to developing countries in order to avoid the high costs caused by domestic environmental regulations, which leads to the increase in carbon emissions in the host country [14,15,16]. A concept related to the “pollution paradise” effect is “race to the bottom”, that is, the international competition generated by an open economy, which further induces host countries to reduce the level of environmental regulations in order to attract more foreign investment inflows, which will further exacerbate the “pollution paradise” effect [17]. However, the “pollution halo” effect suggests that FDI inflows reduce the host country’s carbon emissions [18,19]. This is because foreign investment brings advanced production technology and management experience, which improves energy use efficiency and reduces carbon emissions. Based on the data from 188 countries from 1990 to 2013 and using a dynamic model, Shao [20] found that FDI has a significant negative effect on carbon emission intensity. Further studies, after classifying host countries according to their income levels, show that FDI has a significant negative effect on carbon emission intensity in both high-income and low and middle-income countries. Aysha et al. [21] found a significant negative correlation between FDI and CO2 emissions based on the data of G8 member countries from 1990 to 2019. Hayat et al. [22] used static and dynamic models to investigate the effect of FDI on carbon emission reduction, and concluded that FDI reduced carbon emissions of countries along the Belt and Road. In addition, some scholars have suggested that the impact of FDI on carbon emissions is not simply positive or negative. Gong et al. [23] examined the relationship between FDI and CO2 emissions in a non-linear framework based on the data of countries along the Belt and Road from 1979 to 2017. Muhammad et al. [24] used fully modified ordinary least squares (FMOLS) to reveal the inverted “U-shaped” relationship between FDI and CO2 emissions in global and middle-income countries. Pazienza [25] introduced the squared term of FDI to capture the “U” shaped relationship between FDI and CO2 emissions. The square term of FDI introduced by Pazienza [25] captures the “U-shaped” relationship between FDI and CO2 emissions. Sarkodie and Strezov [26] constructed a third-order polynomial to examine the nonlinear relationship between FDI and carbon emissions by introducing the squared term and the third term of FDI. Xie et al. [27] found that FDI and CO2 emission had a “W+V-shaped” time characteristic, revealing the coexistence of the “pollution paradise” effect and “pollution halo” effect. Through the review of existing literature, it can be seen that the academic community has conducted in-depth discussions on carbon emission intensity and how FDI affects carbon emission intensity, which provides a solid theoretical basis and empirical support for further research, but there are still some shortcomings. There are few studies that directly investigate the impact of FDI agglomeration on carbon emission intensity in academic circles, and currently mainly focus on the impact of FDI on carbon emission intensity. Based on this, the marginal contributions of this paper are as follows: First, from the perspective of research, this paper focuses on the impact of FDI agglomeration on urban carbon emission intensity in China, which is a useful expansion of the existing literature examining the impact of FDI on carbon emission intensity and can deepen the academic community’s understanding of the relationship between FDI and carbon emission. Second, in terms of research content, this paper focuses on the analysis of the mechanism of the effect of FDI agglomeration on carbon emission intensity, the moderating effect of technological innovation level, and the spatial spillover effect.
After reviewing the literature, the following two findings can be made: First, the academic community has conducted in-depth discussion on the spatial and temporal distribution characteristics, spatial effects, and driving factors of carbon emission intensity; Second, in the research on FDI and carbon emission intensity, the academic circle holds three views on the relationship between the two: positive relationship, negative relationship and, nonlinear relationship. Among them, the “pollution paradise” effect and the “pollution halo” effect are the typical representatives of the positive relationship and the negative relationship, respectively. Due to the influence of sample selection, estimation methods, and variable selection, scholars have not reached a consensus on the nonlinear relationship between FDI and carbon emission intensity. Existing studies have conducted in-depth discussions in the field of FDI and carbon emission, providing solid empirical support for further research, but there are also some shortcomings: First, the academic community mainly focuses on the impact of FDI on carbon emission intensity, and there are few studies directly discussing the relationship between FDI concentration and carbon emission intensity. Second, the relationship between FDI concentration and carbon emission intensity may be regulated by other variables, and ignoring the role of the regulating variables may lead to bias in the regression results. Therefore, based on the perspective of Chinese cities, this paper discusses the influence of FDI agglomeration on carbon emission intensity, the moderating effect of technological innovation level, and the spatial spillover effect from both theoretical and empirical aspects, which will help to expand the theoretical research on FDI and carbon emission, and provide policy suggestions for accelerating the realization of the “double carbon goal” and promoting the coordinated development among cities.

3. Theoretical Analysis and Research Hypothesis

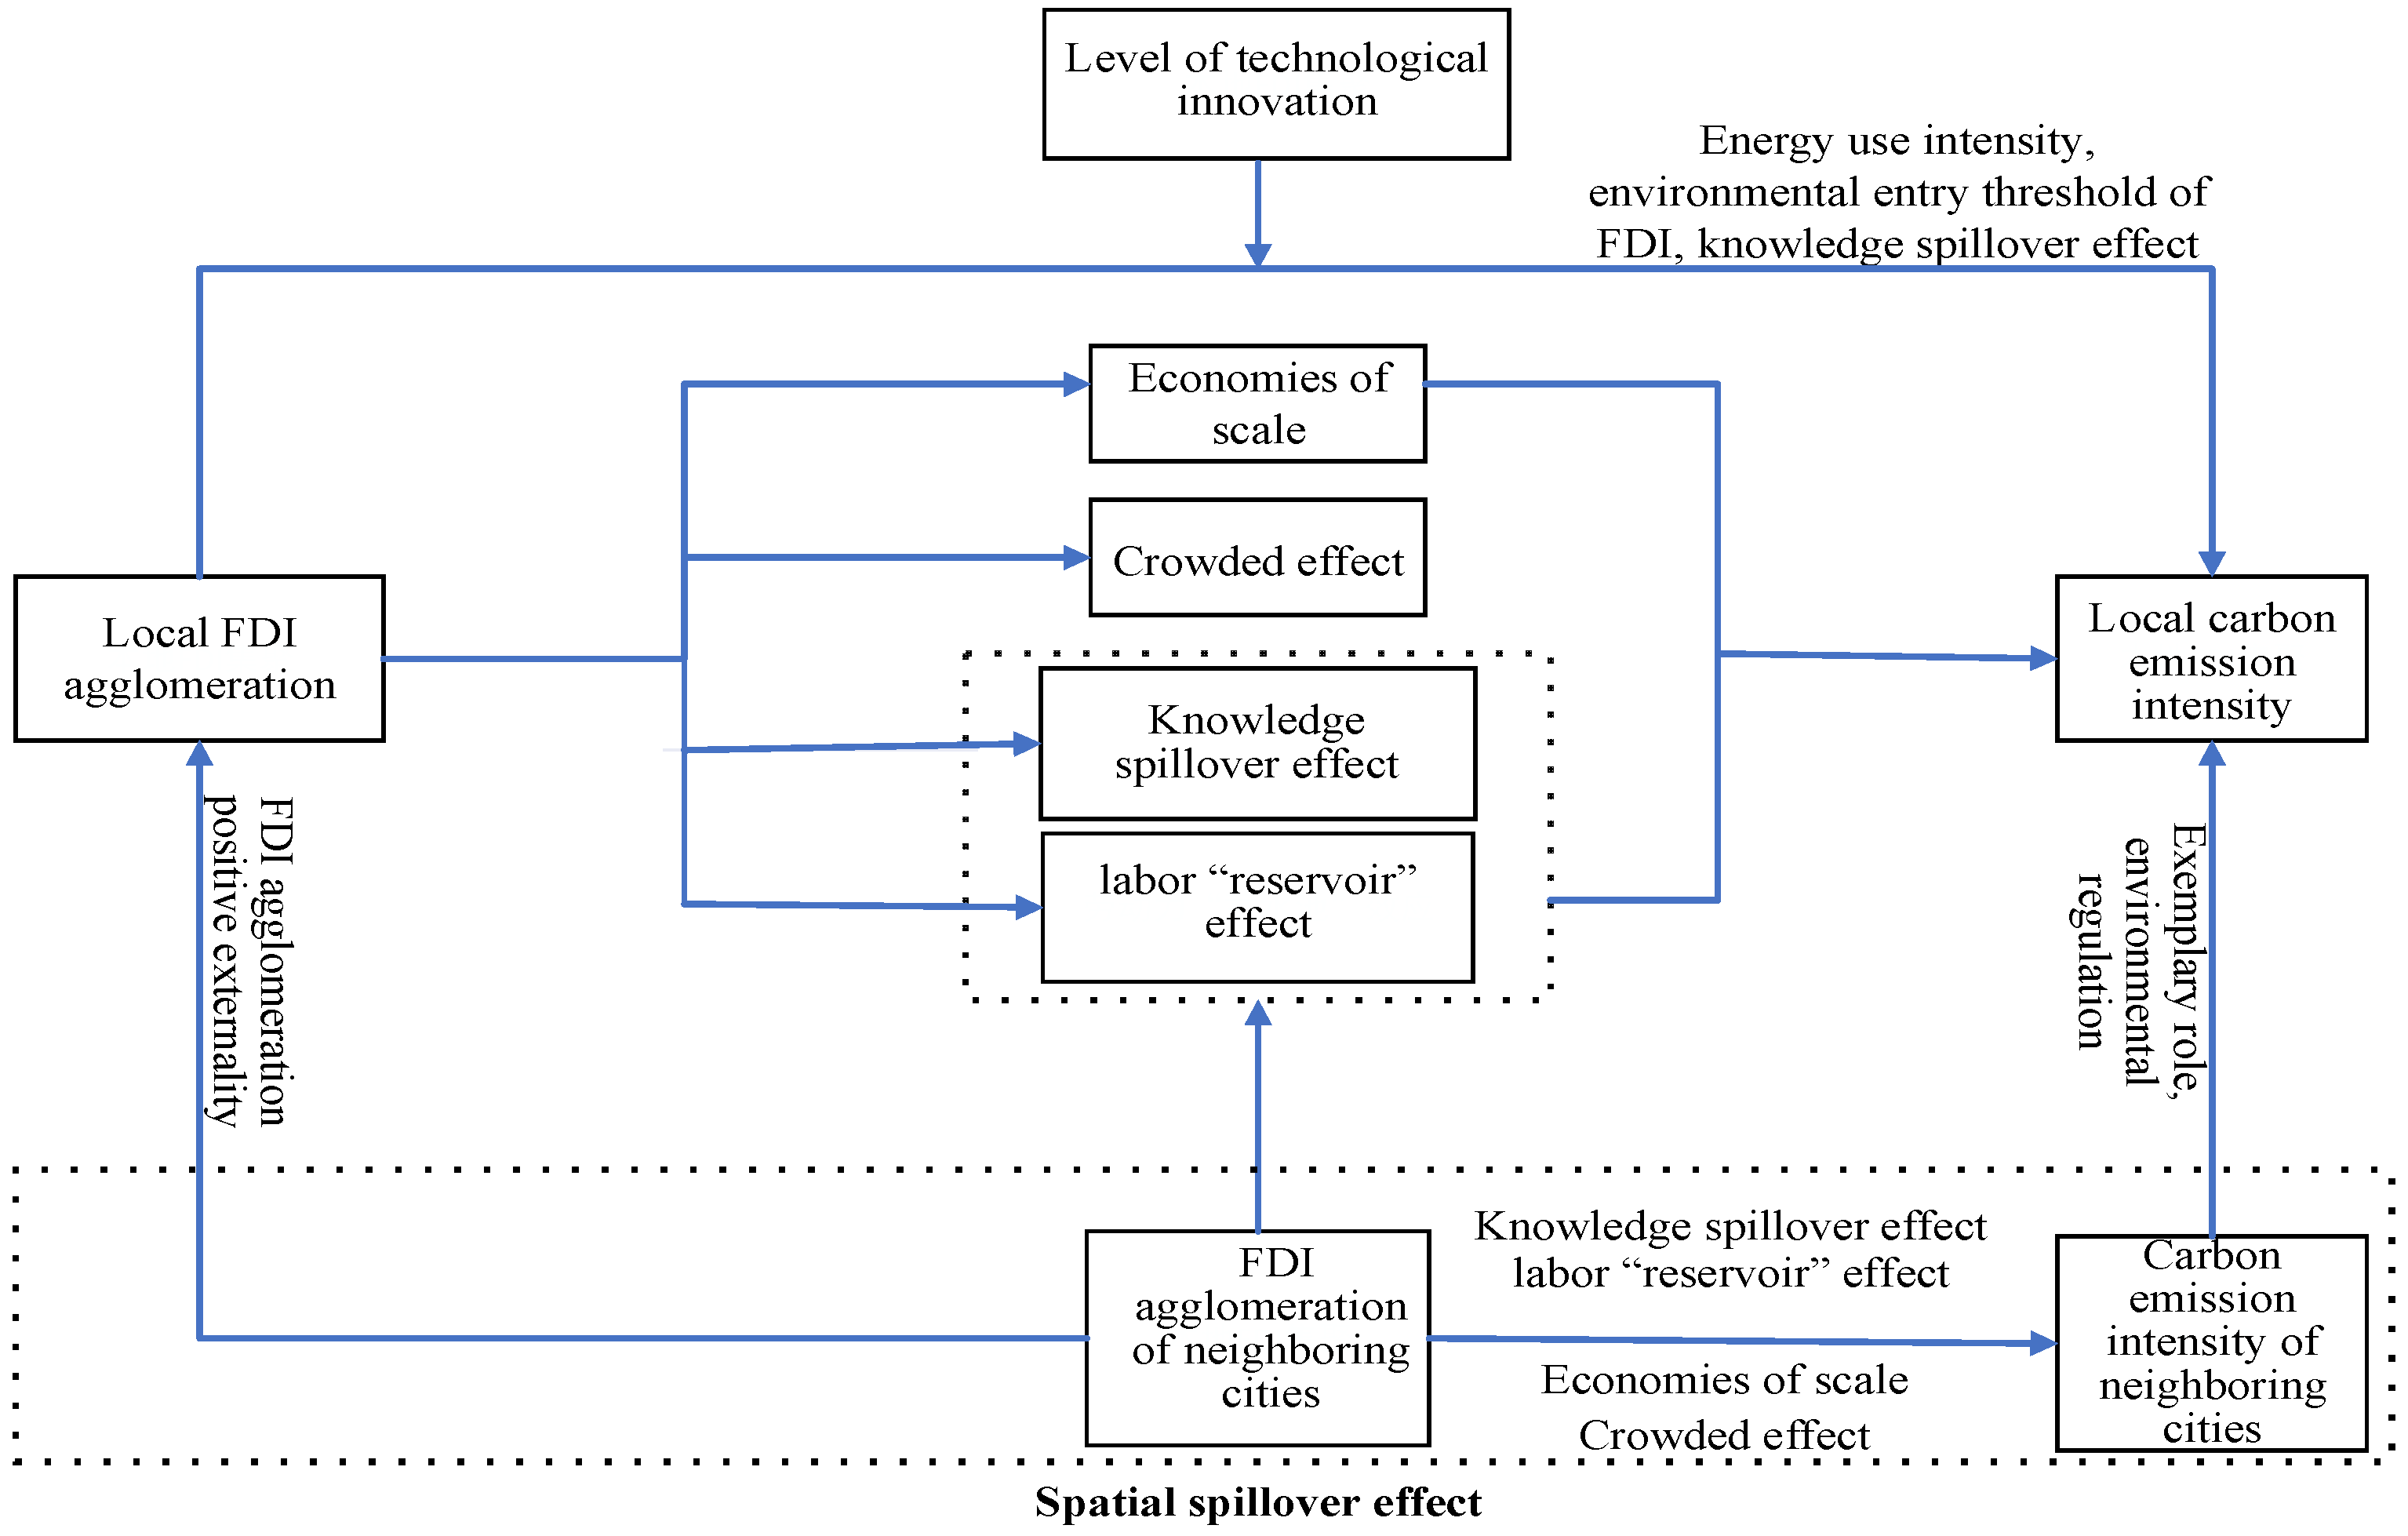
3.1. The Influencing Mechanism of FDI Agglomeration on Carbon Emission Intensity

The mechanism of FDI agglomeration affecting carbon emission intensity includes the labor “reservoir” effect, knowledge spillover effect, scale effect, crowding effect, etc.
First, the labor “reservoir” effect. FDI agglomeration realizes talent sharing by providing specialized labor force, which on the one hand saves labor search costs for foreign and domestic firms, and on the other hand facilitates labor to find jobs matching their skills, and improves labor matching degree and allocation efficiency [28]. The high degree of matching jobs and labor skills can effectively improve labor productivity, thereby affecting production capacity and energy consumption and thus urban carbon emission intensity.
Second, the knowledge spillover effect. The knowledge spillover effect of FDI agglomeration on carbon emission intensity mainly shows a negative inhibitory effect. Green knowledge spillover can be achieved through face-to-face technical exchange and information interaction among technicians in the agglomeration area. Moreover, FDI agglomeration can provide specialized logistics, big data, and other services to promote the interaction, sharing, and diffusion of clean technologies among enterprises [29], which is conducive to carbon emission reduction and thus restrain the increase of carbon emission intensity.
Third, the scale effect. On the one hand, the expansion of FDI agglomeration implies the increase of resource consumption, which results in a higher level of carbon emissions and further promotes the increase in carbon emission intensity. However, on the other hand, the further expansion of the scale of foreign-funded enterprises means that they have more capital, which is conducive to the improvement of technology and production efficiency, and will reduce the resource consumption and CO2 emissions in the production process. Moreover, with the further expansion of FDI agglomeration, the rising public awareness of environmental protection will force enterprises to carry out technological innovation and reduce carbon emissions, or to introduce innovative products that are more in line with the concept of green production and life to meet market demand, which in turn will suppress the increase of carbon emission intensity. Only when FDI agglomeration reaches a certain level can the scale effect contribute to environmental quality [30] and restrain the increase of carbon emission intensity.
Fourth, the crowding effect. Foreign-funded enterprises spontaneously agglomerate for economic motives such as cost reduction and profit increase, and the formed agglomeration scale is limited, and the output efficiency is not significantly improved. Additionally, the capacity expansion and blind construction of infrastructure accompanied by FDI agglomeration may cause problems such as excessive resource consumption and increased CO2 emissions. Moreover, the relatively concentrated geographical locations will further amplify the impact of negative environmental externalities, resulting in the “positive externality” of FDI agglomeration being smaller than the “negative externality” [1,31], which will promote the increase of carbon emission intensity.
Based on the above analysis, this paper proposes Hypotheses 1a and 1b:
Hypothesis 1a.
FDI agglomeration has a positive effect on carbon emission intensity.
Hypothesis 1b.
FDI agglomeration has a negative effect on carbon emission intensity.

3.2. Regulation Mechanism of the Level of Technological Innovation

Technological innovation is a key driver of economic growth and an important way to reduce carbon emissions and improve environmental quality [1,32], so the level of technological innovation will moderate the effect of FDI agglomeration on carbon emission intensity. First, technological innovation contributes to increase energy use intensity [33,34], which can alleviate the problems of energy consumption and the increase of carbon emissions brought about by the expansion of FDI agglomeration. Second, urban technological innovation and green development level often show synergistic development. Considering a green economy, cities with high levels of technological innovation will raise the environmental access standards of FDI, and put forward higher requirements on the types of industries of foreign enterprises and carbon emission reduction, so the level of technological innovation can screen out non-clean FDI and offset the crowding effect of FDI agglomeration on carbon emission intensity, to a certain extent. Third, when the level of technological innovation is low, the poor learning and absorbing ability of enterprises leads to the weak knowledge spillover effect of FDI agglomeration. As the level of technological innovation increases, the scale, specialization, and centralization of production and operation in the FDI agglomeration area increase. That is, the high level of technological innovation makes the enterprises in the FDI agglomeration area more connected, which is conducive to accelerating the formation of inter-enterprise production interaction and promoting the production and transfer of knowledge, and the enterprises will be more active and capable of clean technological innovation in the production process, thus alleviating the FDI congestion effect of FDI agglomeration on carbon emission intensity.
Based on these points, this paper further proposes Hypothesis 2:
Hypothesis 2.
The level of technological innovation negatively moderates the effect of FDI agglomeration on carbon emission intensity.

3.3. Spatial Spillover Mechanism of FDI Agglomeration on Carbon Emission Intensity

The FDI agglomeration in each region affects the carbon emission intensity of the neighboring cities while influencing the carbon emission intensity of the local cities.
First, the FDI agglomeration in a city directly affects the carbon emission intensity of neighboring cities through the labor “reservoir” effect, knowledge spillover effect, and other channels. As the level of FDI agglomeration rises and the infrastructure becomes better, high-end factors such as high-skilled labor, information, and green technology in the FDI agglomeration area will not only flow locally, but also to the surrounding cities, thus affecting the carbon emission intensity of the neighboring cities.
Second, the FDI agglomeration of a city indirectly affects the carbon emission intensity of neighboring cities through influencing the FDI agglomeration of neighboring cities. The behavior of a city in order to obtain positive externalities through FDI agglomeration may have a demonstration effect on neighboring cities, which may lead them to adopt similar FDI agglomeration measures, thus affecting the FDI agglomeration level of neighboring cities, which in turn affects the carbon emission intensity of neighboring cities.
Third, the FDI agglomeration in a city indirectly affects the carbon intensity of neighboring cities by influencing the carbon intensity of the local city. Regions with higher FDI agglomeration have a comparative advantage in carbon emission reduction technology, which can not only improve environmental quality, but also serves as a model for neighboring cities [35]. Moreover, considering the political promotion and the public’s environmental demands, local governments have the feature of “competition for the top” in environmental regulation [36], which will affect the carbon emission intensity of surrounding cities.
Based on these points, this paper further proposes Hypothesis 3:
Hypothesis 3.
The effect of FDI agglomeration on carbon emission intensity has a spatial spillover effect.
The influence mechanism of FDI agglomeration on carbon emission intensity is shown in Figure 1.

4. Empirical Study Design

4.1. Model Setup

The benchmark model of this paper is set as follows.
  lnCI i , t = β 0 + β 1 lnFDIA i , t + β 2 lnTI i , t + β 3 lnFDIA i , t × lnTI i , t + β 4 lnPGDP i , t + β 5 ( lnPGDP i , t ) 2 + β 6 lnOPEN i , t + β 7 lnPOP i , t + β 8 lnIS i , t + β 9 lnFIN i , t +   β 10 lnGOV i , t + ω i + η t + ε i , t
In Equation (1), the subscripts i and t represent city and time, respectively, the explanatory variable lnCI i , t represents carbon intensity, lnFDIA i , t represents FDI concentration, lnTI i , t represents technological innovation, lnFDIA i , t × lnTI i , t is the interaction term of FDI concentration and technological innovation, the control variables lnPGDP i , t , ( lnPGDP i , t ) 2 , lnOPEN i , t , lnPOP i , t , lnIS i , t , lnFIN i , t and lnGOV i , t are the level of economic development, the quadratic term of the level of economic development, trade openness, population size, industrial structure, financial structure, and government support, respectively, ω i   and   η t denote the individual fixed effects and time fixed effects, respectively, and ε i , t is the random disturbance term.

4.2. Variable Selection

4.2.1. Explained Variables

Carbon emission intensity is represented by CO2 emissions per unit of GDP in cities, and the city-level GDP indicators can be obtained from the National Bureau of Statistics, but CO2 emissions have not been directly published and need to be measured using relevant data. At present, the measurement of city-level carbon emissions mainly includes liquefied petroleum gas (LPG), natural gas, electricity consumption, and transportation carbon emissions (Bai et al., 2019 [37]). However, due to the lack of data related to transportation carbon emissions and the fact that it has been found in the literature that the proportion of transportation carbon emissions in the total carbon emissions is small and negligible, this paper measures urban CO2 emissions through the consumption of LPG, natural gas, and electricity. The specific formula is as follows.
CO 2 = C 1 + C 2 + C 3 = kE 1 + vE 2 + φ γ × E 3
In Equation (2),   C 1 , C 2 , and C 3 are CO2 for LPG, natural gas, and social electricity emissions, respectively, E 1 is LPG consumption and k is the CO2 conversion factor for LPG; E 2 is natural gas consumption and v is the CO2 conversion factor for natural gas; E 3 is social electricity consumption, φ is the CO2 conversion factor for social electricity consumption, and γ is the proportion of coal-fired power generation in the total power generation. Although the proportion of coal-fired power generation varies among cities, the difference is not huge, so the calculation of urban coal-fired power generation is based on the unified proportion.

4.2.2. Core Explanatory Variables

FDI agglomeration. Drawing on Yu et al. [10], this paper first converts the actual amount of FDI used in 270 cities in the China City Statistical Yearbook to Ren Min Bi (RMB) according to the annual average exchange rate of RMB to USD, and then calculates the FDI agglomeration using Equation (3).
FDIA i , t = FDI i , t / FDI i , t AR i / AR i
In Equation (3), FDIA i , t is the FDI agglomeration in city i, in year t, FDI i , t represents the total actual utilization of FDI in city i, in year t, and AR i , represents the area of city i.
Technological innovation level (TI). The patent situation of a city can reflect the city’s technological innovation level more realistically, and academics generally use the number of patent applications or patent grants to measure the city’s innovation output [38,39]. In this paper, the number of patent applications is selected as a measure of the city’s technological innovation level in the benchmark regression, and the number of patent grants is used to measure the city’s technological innovation level in the robustness test. In order to examine the moderating effect of technological innovation level, this paper introduces the interaction term between FDI agglomeration and technological innovation level.

4.2.3. Control Variables

Economic development level. The Environmental Kuznets Curve (EKC) considers the level of economic development as an important factor affecting carbon emissions, so this paper introduces the primary and secondary terms of the level of economic development as control variables and uses the gross domestic product per capita to measure the level of economic development [40,41,42], denoted as lnPGDP .
Trade openness. Trade openness is expressed as the proportion of total exports and imports in regional GDP [43], denoted as lnOPEN .
Population size. The population size is expressed as the year-end resident population of the region [44,45], denoted as lnPOP .
Industrial structure. Among the primary, secondary, and tertiary industries, the secondary industry is the industry with the highest carbon emissions [39]. The higher the proportion of the secondary industry in the economy, the greater the CO2 emissions, so this paper uses the proportion of the value added of the secondary industry in the regional GDP to measure the industrial structure [45], denoted as lnIS.
Level of financial development. The level of financial development is measured by the balance of loans from financial institutions as a percentage of regional GDP at the end of the year, which is denoted as lnFIN .
Government support. The government support is expressed as the proportion of local government budget expenditures in regional GDP and is denoted as lnGOV .

4.3. Data Sources and Descriptions

In view of the lack of data for some cities, 270 cities in China from 2006 to 2019 were selected for this paper, and the data were mainly obtained from the China City Statistical Yearbook, wind database, Guotaian database, China Research Data Service Platform (CNRDS), and statistical yearbooks of each city, etc. The descriptive statistics of the main variables are shown in Table 1. As shown in Table 1, the mean, variance, and minimum and maximum values of carbon emission intensity are 8.329, 0.821, 5.469, and 12.128, respectively. The mean, variance, and minimum and maximum values of FDI agglomeration are 2.333, 2.361, −7.065, and 8.633, respectively. The mean, variance, and minimum and maximum values of technological innovation level are 7.158, 1.781, 2.197, and 12.388, respectively. The mean, variance, and minimum and maximum values of economic development level are 10.454, 0.719, 4.595, and 15.675, respectively. The mean, variance, and minimum and maximum values of trade openness are 2.09, 1.569, −9.492, and 6.701, respectively. The mean, variance, and minimum and maximum values of population size are 5.950, 0.803, 3.769, and 14.393, respectively. The mean, variance, and minimum and maximum values of the industrial structure are 3.845, 0.246, 0.657, and 4.45, respectively. The mean, variance, and minimum and maximum values of financial development level are 4.403, 0.585, 2.418, and 7.423, respectively. The mean, variance, and minimum and maximum values supported by the government are 2.809, 0.53, 1.451, and 6.404, respectively.

5. Analysis of Empirical Results

5.1. Spatial and Temporal Characteristics of FDI Agglomeration and Carbon Emission Intensity

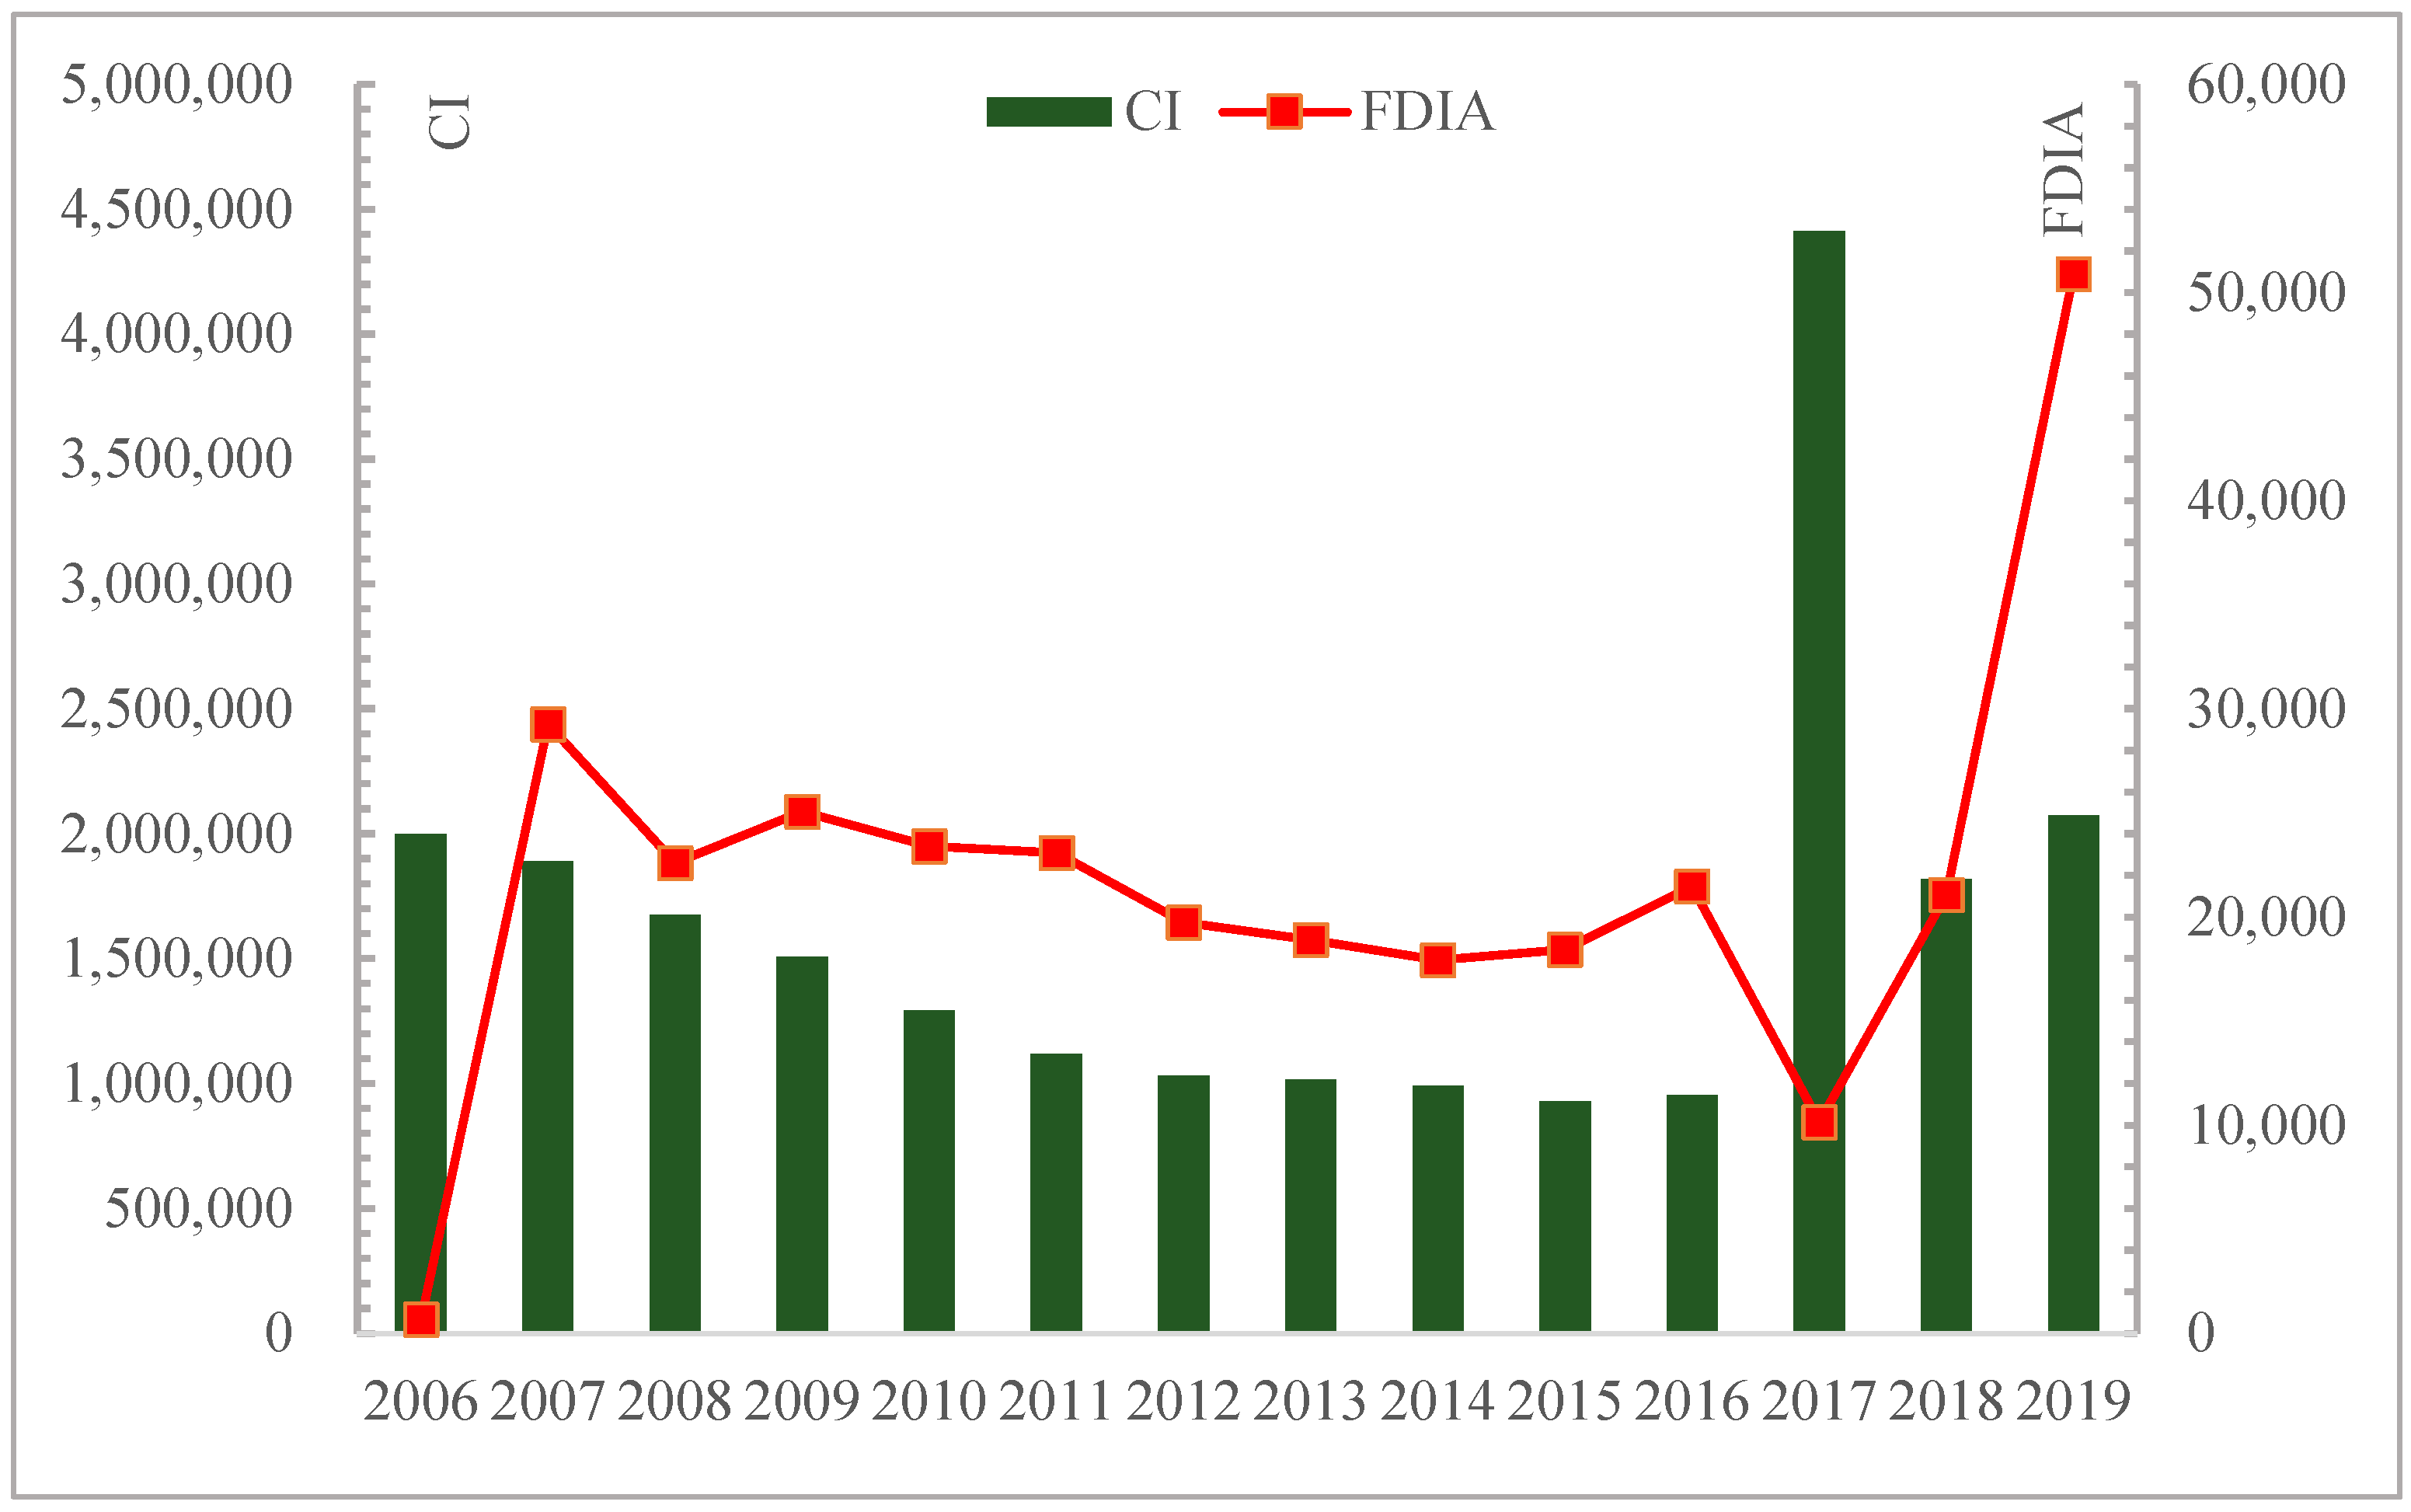
5.1.1. Temporal Trends of FDI Agglomeration and Carbon Emission Intensity

Figure 2 depicts the temporal trends of FDI agglomeration and carbon emission intensity for 270 cities in China from 2006 to 2019. Overall, both the FDI agglomeration and carbon emission intensity do not show a relatively smooth and monotonic trend. Specifically, the carbon emission intensity of Chinese cities decreased first and then increased, from 1,998,366 kg/yuan in 2006 to 953,871 kg/yuan in 2016, and reached a historical high of 4,413,471 kg/yuan in 2017. The FDI agglomeration level showed a relatively stable trend from 2008 to 2016, with a phase decline in 2017, followed by a continuous rise.

5.1.2. Spatial Distribution and Change Trend of FDI Concentration and Carbon Emission Intensity

Figure 3 and Figure 4 visualize the spatial variation of FDI agglomeration and carbon emission intensity. As shown in Figure 3, the level of FDI agglomeration keeps increasing. FDI is mainly concentrated in the eastern coastal cities with the Bohai Sea industrial belt, Yangtze River Delta region, and Pearl River Delta region as the core, and then gradually expanded to the surrounding areas with the agglomeration as the core. According to Figure 4, the cities with high carbon emission intensity in China in 2006 and 2010 were mainly concentrated in the Northeast region, the Pearl River Delta region, the Bohai Sea industrial belt, and the Yangtze River economic belt. Subsequently, the Northeast region, the Pearl River Delta region, and the Bohai Sea Industrial Belt still maintain high levels of carbon emission intensity; the Yangtze River Economic Belt has a significant effect on carbon emission reduction, except for Yunnan, Guizhou and Sichuan, and the Yangtze River Delta region, which maintain high levels of carbon emission intensity, and the rest of the regions have significantly decreased; some cities in Inner Mongolia have high carbon emission intensity.

5.2. Benchmark Regression Results

Before the regression, this paper first conducted the F-test, LM test and Hausman test, and the corresponding p-value of the F-test was 0. The original hypothesis of adopting mixed ordinary least squares (OLS)model was rejected, and fixed effects were selected. The LM test rejected the original hypothesis of using a mixed OLS model and chose random effects. The corresponding p-value of the Hausman test was 0, and the original hypothesis of random effects was rejected. So, this paper finally chooses fixed effects and adopts double fixed robust standard errors for estimation.
Table 2 reports the effect of FDI agglomeration on carbon emission intensity and the moderating effect of the level of technological innovation. The results show that, first, FDI agglomeration is positive at the 1% significance level, which indicates that FDI agglomeration significantly contributes to urban carbon emission intensity, verifying the previous research Hypothesis 1a, indicating that the increased production capacity and blind construction of infrastructure accompanying FDI agglomeration cause excessive energy consumption and increased CO2 emissions, which will contribute to the increase of carbon emission intensity. Second, the level of technological innovation significantly suppresses the crowding effect of FDI agglomeration on carbon emission intensity, which verifies research Hypothesis 2.

5.3. Endogeneity Problems and Robustness Tests

In this paper, the robustness of the benchmark regression results is examined in the following four aspects. First, considering the endogeneity problem caused by the possible two-way causality between FDI agglomeration and carbon emission intensity, this paper adopts the two-stage least squares (2SLS) method to deal with the endogeneity problem. The lag one period of FDI agglomeration, interaction terms of FDI agglomeration and technological innovation were used as instrumental variables for 2SLS regression, as shown in column (1) of Table 3, and the Wald F-test results rejected the original hypothesis of weak instrumental variables, and the Anderson LM test rejected the original hypothesis of insufficient identification of instrumental variables. Second, the regression was rerun by replacing the sample period to 2012 to 2019, and the results are shown in column (2) of Table 3. Third, to avoid possible negative effects of sample outliers on the regression results, the 1st and 99th percentiles of the sample data were shrunken, and the estimated results are shown in column (3) of Table 3. Fourth, the baseline regression uses the number of patent applications as a measure of the level of technological innovation in the city, and replaces the number of patent applications with the number of patents granted for re-regression, and the estimation results are shown in column (4) of Table 3. The results of the four robustness tests show that there is no substantial change in the sign of the coefficients of the core explanatory variables as well as their significance, so the results of the benchmark regression are reliable and stable.

5.4. Heterogeneity Test

The spatio-temporal characteristics analysis of FDI agglomeration and carbon emission intensity in the previous paper confirms that there is a regional imbalance in the spatial distribution of FDI agglomeration and carbon emission intensity, so regional factors need to be considered when analyzing the effect of FDI agglomeration on carbon emission intensity. In this paper, 270 cities are divided into eastern, central, and western regions for estimation, and the results are reported in Table 4. The results show that FDI agglomeration significantly promotes carbon emission intensity in the central and western regions, and the promotion effect is greater in the western region, but the suppression effect on the eastern region is not significant. The possible reasons for this phenomenon are as follows: compared with the central region, the western region has poor infrastructure, relatively backward economic development level, and imperfect financial system. These factors lead to the crowding effect of FDI agglomeration on carbon emission intensity in the western region than in the central region. The eastern region attracts high-quality foreign investment due to its geographical location, economic foundation, infrastructure, and other advantages, as well as policy inclination. The knowledge spillover effect of FDI agglomeration on carbon emission intensity offsets the crowding effect, so it did not show an increase in carbon emission intensity. The level of technological innovation significantly suppresses the crowding effect of FDI agglomeration on carbon emission intensity in the western region, but the suppression effect on the east and central regions is not significant.

5.5. Spatial Spillover Effect Test

5.5.1. Spatial Autocorrelation Test

Based on the geographic distance matrix, this paper adopts Moran’s I index to explore the spatial correlation of urban carbon emission intensity, The specific formula is shown in Equation (4).
Moran s   I = n i = 1 n j = 1 n w ij × i = 1 n j = 1 n w ij X i X ¯ X j X ¯ i = 1 n ( X i X ¯ ) 2
In Equation (4), Xi is the observed value of city i and Wij is the row-standardized geographic distance matrix. The Moran’s I index takes values ranging from −1 to 1. At a given significance level, a Moran’s I value greater than 0 indicates a positive correlation and less than 0 indicates a negative correlation. A Moran’s I value close to 0 indicates that the observations show a random distribution in space or are not spatially correlated.
The results are shown in Table 5. The global Moran’s I index of carbon emission intensity from 2006 to 2019 are all less than −0.01 at the 1% significance level, indicating that the national urban carbon emission intensity presents a strong spatial clustering characteristic. This paper further characterizes Moran’s scatter plot in local autocorrelation analysis, as shown in Figure 5. From Figure 5, it can be seen that carbon emission intensity has an obvious negative spatial correlation, and most cities are located in the second and fourth quadrants, that is, the spatial distribution is characterized by “high-low” clustering and “low-high” clustering.

5.5.2. Selection of Spatial Econometric Models

Before model estimation, the applicability of the specific spatial model should also be examined. The LM test was used to determine whether the spatial econometric model was chosen. It was found that the p-values of LM-LAG, Robust LM-lag, LM-error and Robust LM-error were all 0, indicating that the spatial Durbin model (SDM) was more suitable for this paper’s study. The Hausman test was used to determine whether the fixed-effects estimation method or the random-effects estimation method was chosen for the spatial Durbin model. The p-value of the Hausman test was 0, indicating that the fixed-effects estimation method was more suitable for the spatial Durbin model in this paper. Therefore, the fixed-effects spatial Durbin model was finally selected for estimation in this paper, and the results are shown in Table 6.

5.5.3. Spatial Econometric Model Estimation Results

Table 6 reports the estimation results of the SDM model. According to the estimation results, the spatial lag coefficient is negative and significant at the 10% significance level, indicating that the carbon emission intensity of Chinese cities shows a significant negative spatial interaction effect. The coefficient of FDI agglomeration is significantly positive and the interaction term of FDI agglomeration and technology innovation level is significantly negative, which is consistent with the results of the benchmark regression, and verifies Hypothesis 1a and Hypothesis 2 again. The spatial lag term of FDI agglomeration is significantly positive, indicating that FDI agglomeration in neighboring cities promotes the increase of carbon emission intensity in local cities. The spatial lag term of the interaction term between FDI agglomeration and technological innovation level is significantly negative, indicating that the technological innovation level in neighboring cities weakens the crowding effect of FDI agglomeration on carbon emission intensity in local cities.
We further estimate the direct effect, indirect effect, and total effect of each explanatory variable on carbon emission intensity. Combined with the research object of this paper, the direct effect refers to the effect of the explanatory variables such as local FDI agglomeration, FDI agglomeration, and technological innovation interaction term on local carbon emission intensity, while the indirect effect refers to the effect of the explanatory variables such as neighboring city FDI agglomeration, FDI agglomeration and technological innovation interaction term on local carbon emission intensity. The total effect refers to the comprehensive effect of FDI agglomeration and the interaction terms of FDI agglomeration and technological innovation on carbon emission intensity. The estimated results are shown in Table 7.

6. Conclusions and Recommendations

Since the China’s reform and opening up, rapid industrialization and urbanization have caused high energy consumption and high emissions while promoting economic growth, and how to achieve “carbon peaking” and “carbon neutrality” has become a key concern for all sectors of society. This paper investigates the impact of FDI agglomeration on carbon emission intensity, the moderating effect of technological innovation level, and the spatial spillover effect from both theoretical and empirical aspects, and further analyzes the robustness and regional heterogeneity. The main research conclusions are as follows.
First, FDI agglomeration has a significant positive effect on the carbon emission intensity of cities, indicating that there is a crowding effect of FDI agglomeration on carbon emission intensity. Second, the interaction term of technological innovation level and FDI agglomeration has a significant negative effect on carbon emission intensity, indicating that the level of technological innovation can negatively regulate the crowding effect of FDI agglomeration on carbon emission intensity. Third, the influence of FDI agglomeration on carbon emission intensity presents regional heterogeneity. Specifically, FDI agglomeration has a significant promoting effect on carbon emission intensity in central and western China, but has no significant negative effect on carbon emission intensity in eastern China. Fourth, there is a spatial spillover effect of FDI agglomeration on carbon emission intensity. There is a negative spatial autocorrelation between local carbon emission intensity and carbon emission intensity of neighboring cities, indicating that urban carbon emission intensity presents a negative spatial interaction effect. FDI agglomeration has a positive effect on carbon emission intensity of local and neighboring cities. Both local and neighboring cities’ technological innovation levels help to improve the crowding effect of FDI agglomeration on carbon emission intensity.
Based on the above conclusions, this paper proposes the following countermeasures: First, when expanding the opening to the outside world to attract investment, the government should actively guide the FDI agglomeration to transform to high quality. For example, the government can use the market mechanism to eliminate low-end and backward industries in FDI agglomeration areas, thus deepening the industrial chain in FDI agglomeration areas. The government can also raise the environmental access threshold for foreign investment to attract a group of high-quality, low-pollution, and high-value-added enterprises to improve the crowding effect of FDI agglomeration. Second, the level of technological innovation is an important way to improve the crowding effect of FDI agglomeration. China needs to continuously increase investment in scientific and technological R&D, and introduce more preferential measures in introducing talents and scientific and technological R&D to encourage talents and high-tech enterprises to actively settle in the country, thus improving the level of scientific and technological innovation. Third, different regions should formulate differentiated policies and strategies based on their own conditions. The eastern region should continue to exert its regional advantages to attract low-pollution and high-quality foreign investment, guide enterprises to interact, exchange, and cooperate in energy-saving information, environmental protection knowledge and clean technology, and actively exploit the knowledge spillover effect of FDI clustering. The central and western regions should improve the construction of infrastructure and financial systems to enhance FDI agglomeration in an appropriate and orderly manner. Fourth, fully understand the role of technological innovation level in improving the crowding effect of FDI agglomeration, strengthen inter-city technology exchange and cooperation, make full use of the radiation effect of technological innovation, and actively drive the development of local and neighboring cities.

Author Contributions

Y.W. led this study, conducted analysis and contributed to the original draft. H.X. contributed to language polishing, review and editing. All authors have read and agreed to the published version of the manuscript.

Funding

This work was funded by the Projects of Ministry of Education Humanities and Social Sciences Foundation (Grant No. 21YJC790051).

Institutional Review Board Statement

Not applicable.

Informed Consent Statement

Not applicable.

Data Availability Statement

The data presented in this study are available on request from the corresponding author (hanxu520@hbtcm.edu.cn).

Conflicts of Interest

The authors declare no conflict of interest.

References

  1. Yuan, H.; Feng, Y.; Lee, C.-C.; Cen, Y. How does manufacturing agglomeration affect green economic efficiency? Energy Econ. 2020, 92, 104944. [Google Scholar] [CrossRef]
  2. Zhang, Y.-J.; Liu, Z.; Qin, C.-X.; Tan, T.-D. The direct and indirect CO2 rebound effect for private cars in China. Energy Policy 2017, 100, 149–161. [Google Scholar] [CrossRef]
  3. Xu, X.; Shen, Y.; Liu, H. What Cause Large Spatiotemporal Differences in Carbon Intensity of Energy-Intensive Industries in China? Evidence from Provincial Data during 2000–2019. Int. J. Environ. Res. Public Health 2022, 19, 10235. [Google Scholar] [CrossRef] [PubMed]
  4. Liang, S.; Zhao, J.; He, S.; Xu, Q.; Ma, X. Spatial econometric analysis of carbon emission intensity in Chinese provinces from the perspective of innovation-driven. Environ. Sci. Pollut. Res. 2019, 26, 13878–13895. [Google Scholar] [CrossRef] [PubMed]
  5. Wang, S.; Ren, H.; Liang, L.; Li, J.; Wang, Z. The effect of economic development on carbon intensity of human well-being: Evidence from spatial econometric analyses. J. Clean. Prod. 2022, 364, 132632. [Google Scholar] [CrossRef]
  6. Han, X.; Cao, T.; Sun, T. Analysis on the variation rule and influencing factors of energy consumption carbon emission intensity in China’s urbanization construction. J. Clean. Prod. 2019, 238, 117958. [Google Scholar] [CrossRef]
  7. Wen, S.; Liu, H. Research on energy conservation and carbon emission reduction effects and mechanism: Quasi-experimental evidence from China. Energy Policy 2022, 169, 113180. [Google Scholar] [CrossRef]
  8. Yan, B.; Wang, F.; Liu, J.; Fan, W.; Chen, T.; Liu, S.; Ning, J.; Wu, C. How financial geo-density mitigates carbon emission intensity: Transmission mechanisms in spatial insights. J. Clean. Prod. 2022, 367, 133108. [Google Scholar] [CrossRef]
  9. Ding, X.; Tang, N.; He, J. The Threshold Effect of Environmental Regulation, FDI Agglomeration, and Water Utilization Efficiency under " Double Control Actions"-An Empirical Test Based on Yangtze River Economic Belt. Water 2019, 11, 452. [Google Scholar] [CrossRef] [Green Version]
  10. Yu, D.; Li, X.; Yu, J.; Li, H. The impact of the spatial agglomeration of foreign direct investment on green total factor productivity of Chinese cities. J. Environ. Manag. 2021, 290, 112666. [Google Scholar] [CrossRef]
  11. Ali, S.; Ali, S.; Muhammad, T. Determinants of CO2 emissions: Exploring the unexplored in low-income countries. Environ. Sci. Pollut. Res. Int. 2022, 29, 48276–48284. [Google Scholar]
  12. Liu, X.; Wahab, S.; Hussain, M.; Sun, Y.; Kirikkaleli, D. China carbon neutrality target: Revisiting FDI-trade-innovation nexus with carbon emissions. J. Environ. Manag. 2021, 294, 113043. [Google Scholar] [CrossRef]
  13. Bulus, G.C.; Koc, S. The effects of FDI and government expenditures on environmental pollution in Korea: The pollution haven hypothesis revisited. Environ. Sci. Pollut. Res. 2021, 28, 38238–38253. [Google Scholar] [CrossRef]
  14. Andrew, K. Does Foreign Investment Harm the Air We Breathe and the Water We Drink? A Cross-National Study of Carbon Dioxide Emissions and Organic Water Pollution in Less-Developed Countries, 1975 to 2000. Organ. Environ. 2007, 20, 137–156. [Google Scholar]
  15. Lee, J.W. The contribution of foreign direct investment to clean energy use, carbon emissions and economic growth. Energy Policy 2013, 55, 483–489. [Google Scholar] [CrossRef]
  16. Bakhsh, K.; Rose, S.; Ali, M.F.; Ahmad, N.; Shahbaz, M. Economic growth, CO2 emissions, renewable waste and FDI relation in Pakistan: New evidences from 3SLS. J. Environ. Manag. 2017, 196, 627–632. [Google Scholar] [CrossRef]
  17. Konisky, D.M. Assessing U.S. State Susceptibility to Environmental Regulatory Competition. State Politics-Policy Q. 2009, 9, 404–428. [Google Scholar] [CrossRef]
  18. Haider, M. The spatial analyses of consumption-based CO2 emissions, exports, imports, and FDI nexus in GCC countries. Environ. Sci. Pollut. Res. Int. 2022, 29, 48301–48311. [Google Scholar]
  19. Wang, Z.; Gao, L.; Wei, Z.; Majeed, A.; Alam, I. How FDI and technology innovation mitigate CO2 emissions in high-tech industries: Evidence from province-level data of China. Environ. Sci. Pollut. Res. 2021, 29, 4641–4653. [Google Scholar] [CrossRef]
  20. Shao, Y. Does FDI affect carbon intensity? New evidence from dynamic panel analysis. Int. J. Clim. Change Strat. Manag. 2018, 10, 27–42. [Google Scholar] [CrossRef] [Green Version]
  21. Abid, A.; Mehmood, U.; Tariq, S.; Haq, Z.U. The effect of technological innovation, FDI, and financial development on CO2 emission: Evidence from the G8 countries. Environ. Sci. Pollut. Res. Int. 2021, 29, 11654–11662. [Google Scholar] [CrossRef] [PubMed]
  22. Hayat, K.; Liu, W.; Itbar, K. The role of institutional quality in FDI inflows and carbon emission reduction: Evidence from the global developing and belt road initiative countries. Environ. Sci. Pollut. Res. Int. 2022, 29, 30594–305621. [Google Scholar]
  23. Gong, M.; Zhen, S.; Liu, H. Research on the nonlinear dynamic relationship between FDI and CO2 emissions in the "One Belt, One Road " countries. Environ. Sci. Pollut. Res. 2021, 28, 1–12. [Google Scholar] [CrossRef] [PubMed]
  24. Shahbaz, M.; Nasreen, S.; Abbas, F.; Anis, O. Does foreign direct investment impede environmental quality in high-, middle-, and low-income countries? Energy Econ. 2015, 51, 275–287. [Google Scholar] [CrossRef]
  25. Pazienza, P. The impact of FDI in the OECD manufacturing sector on CO2 emission: Evidence and policy issues. Environ. Impact Assess. Rev. 2019, 77, 60–68. [Google Scholar] [CrossRef]
  26. Sarkodie, S.A.; Strezov, V. Effect of foreign direct investments, economic development and energy consumption on greenhouse gas emissions in developing countries. Sci. Total Environ. 2018, 646, 862–871. [Google Scholar] [CrossRef]
  27. Xie, Q.; Wang, X.; Cong, X. How does foreign direct investment affect CO2 emissions in emerging countries?New findings from a nonlinear panel analysis. J. Clean. Prod. 2019, 249, 119422. [Google Scholar] [CrossRef]
  28. Duranton, G.; Puga, D. Micro-foundations of Urban Agglomeration Economies. In Handbook of Regional and Urban Economics; Elsevier: Amsterdam, The Netherlands, 2004; pp. 2063–2117. [Google Scholar]
  29. Xie, R.; Yao, S.; Han, F.; Fang, J. Land Finance, Producer Services Agglomeration, and Green Total Factor Productivity. Int. Reg. Sci. Rev. 2019, 42, 550–579. [Google Scholar] [CrossRef]
  30. Chen, Y.; Zhu, Z.; Cheng, S. Industrial agglomeration and haze pollution: Evidence from China. Sci. Total Environ. 2022, 845, 157392. [Google Scholar] [CrossRef]
  31. Hong, Y.; Lyu, X.; Chen, Y.; Li, W. Industrial agglomeration externalities, local governments’ competition and environmental pollution: Evidence from Chinese prefecture-level cities. J. Clean. Prod. 2020, 277, 123455. [Google Scholar] [CrossRef]
  32. Lanre, I.; Bello, A. Disaggregated environmental impacts of non-renewable energy and trade openness in selected G-20 countries: The conditioning role of technological innovation. Environ. Sci. Pollut. Res. Int. 2021, 28, 67496–674510. [Google Scholar]
  33. Hille, E.; Lambernd, B. The role of innovation in reducing South Korea’s energy intensity: Regional-data evidence on various energy carriers. J. Environ. Manag. 2020, 262, 110293. [Google Scholar] [CrossRef]
  34. Cheng, C.; Ren, X.; Dong, K.; Dong, X.; Wang, Z. How does technological innovation mitigate CO2 emissions in OECD countries? Heterogeneous analysis using panel quantile regression. J. Environ. Manag. 2020, 280, 111818. [Google Scholar] [CrossRef]
  35. Zeng, W.; Li, L.; Huang, Y. Industrial collaborative agglomeration, marketization, and green innovation: Evidence from China’s provincial panel data. J. Clean. Prod. 2021, 279, 123598. [Google Scholar] [CrossRef]
  36. Holzinger, K.; Sommerer, T. ‘Race to the Bottom’ or ‘Race to Brussels’? Environmental Competition in Europe. J. Common Mark. Stud. 2011, 49, 315–339. [Google Scholar] [CrossRef]
  37. Bai, Y.; Deng, X.; Gibson, J.; Zhao, Z.; Xu, H. How does urbanization affect residential CO2 emissions? An analysis on urban agglomerations of China. J. Clean. Prod. 2018, 209, 876–885. [Google Scholar] [CrossRef]
  38. Liu, X.; Zhang, S.; Bae, J. Nonlinear analysis of technological innovation and electricity generation on carbon dioxide emissions in China. J. Clean. Prod. 2022, 343, 131021. [Google Scholar] [CrossRef]
  39. Zhu, X. Have carbon emissions been reduced due to the upgrading of industrial structure? Analysis of the mediating effect based on technological innovation. Environ. Sci. Pollut. Res. 2022, 29, 54890–54901. [Google Scholar] [CrossRef]
  40. Wang, S.; Wang, H.; Sun, Q. The Impact of Foreign Direct Investment on Environmental Pollution in China: Corruption Matters. Int. J. Environ. Res. Public Health 2020, 17, 6477. [Google Scholar] [CrossRef]
  41. Jiang, L.; Zhou, H.-F.; Bai, L.; Zhou, P. Does foreign direct investment drive environmental degradation in China? An empirical study based on air quality index from a spatial perspective. J. Clean. Prod. 2018, 176, 864–872. [Google Scholar] [CrossRef]
  42. Hao, Y.; Wu, Y.; Wu, H.; Ren, S. How do FDI and technical innovation affect environmental quality? Evidence from China. Environ. Sci. Pollut. Res. 2019, 27, 7835–7850. [Google Scholar] [CrossRef] [PubMed]
  43. Xu, S.-C.; Li, Y.-W.; Miao, Y.-M.; Gao, C.; He, Z.-X.; Shen, W.-X.; Long, R.-Y.; Chen, H.; Zhao, B.; Wang, S.-X. Regional differences in nonlinear impacts of economic growth, export and FDI on air pollutants in China based on provincial panel data. J. Clean. Prod. 2019, 228, 455–466. [Google Scholar] [CrossRef]
  44. Muhammad, K.; Ilhan, O. Examining the direct and indirect effects of financial development on CO2 emissions for 88 developing countries. J. Environ. Manag. 2021, 293, 112812. [Google Scholar]
  45. Yang, X.; Li, C. Industrial environmental efficiency, foreign direct investment and export—Evidence from 30 provinces in China. J. Clean. Prod. 2019, 212, 1490–1498. [Google Scholar] [CrossRef]
Figure 1. Theoretical framework of FDI agglomeration affecting carbon emission intensity.
Sustainability 15 01716 g001
Figure 2. Temporal variation of FDI agglomeration and carbon emission intensity.
Sustainability 15 01716 g002
Figure 3. Spatial distribution of FDI agglomeration and its changes.
Sustainability 15 01716 g003
Figure 4. Spatial distribution of carbon emission intensity and its variation.
Sustainability 15 01716 g004
Figure 5. Moran scatter plot of carbon emission intensity.
Sustainability 15 01716 g005
Table 1. Descriptive statistics of variables.
VariableObsMeanStd. DevMinMax
lnCI37808.3290.8215.46912.128
lnFDIA37802.3332.361−7.0658.633
lnTI37807.1581.7812.19712.388
lnPGDP378010.4540.7194.59515.675
lnOPEN37802.0901.569−9.4926.701
lnPOP37805.9500.8033.76914.393
lnIS37803.8450.2460.6574.450
lnFIN37804.4030.5852.4187.423
lnGOV37802.8090.5301.4516.404
Table 2. Baseline regression results.
VariablelnCI
lnFDIA0.103 ***
(3.339)
lnTI0.092 **
(2.518)
lnFDIA × lnTI−0.016 ***
(−3.960)
lnPGDP0.177
(0.835)
(lnPGDP)2−0.006
(−0.575)
lnOPEN0.051 **
(2.016)
lnPOP0.006
(0.263)
lnIS0.022
(0.196)
lnFIN0.401 ***
(4.200)
lnGOV0.684 ***
(6.344)
cons3.393 ***
(2.986)
Year fixed effectyes
City fixed effectsyes
Sample size3780
R20.656
Note: t-values in parentheses, ***, ** indicate significant at 1%, 5%, significance levels, respectively.
Table 3. Endogeneity issues and robustness tests.
Variable(1)
2SLS
(2)
During Sample Replacement
(3)
Shrinkage Processing
(4)
Replacement Indicators
lnFDIA0.132 ***
(4.008)
0.317 ***
(5.396)
0.109 ***
(2.917)
0.096 ***
(3.371)
lnTI0.098 ***
(5.212)
0.159 ***
(2.640)
0.0947 **
(2.490)
0.134 ***
(3.917)
lnFDIA × lnTI−0.022 ***
(−5.420)
−0.045 ***
(−5.497)
−0.017 ***
(−3.500)
−0.016 ***
(−4.102)
lnPGDP0.218
(1.366)
2.041 ***
(3.442)
0.165
(0.229)
0.138
(0.670)
(lnPGDP)2−0.007
(−0.934)
−0.083 ***
(−3.335)
−0.003
(−0.081)
−0.004
(−0.448)
lnOPEN0.057 ***
(5.389)
0.097 **
(2.411)
0.089 ***
(3.118)
0.049 **
(1.987)
lnPOP0.004
(0.275)
−0.002
(−0.113)
−0.017
(−0.181)
0.006
(0.336)
lnIS0.105 *
(1.716)
0.033
(0.301)
−0.052
(−0.347)
0.015
(0.138)
lnFIN0.387 ***
(10.784)
0.381 ***
(2.858)
0.462 ***
(4.736)
0.396 ***
(4.198)
lnGOV0.721 ***
(17.719)
0.825 ***
(5.558)
0.584 ***
(6.026)
0.6945 ***
(6.511)
cons2.620 ***
(3.012)
−9.514 ***
(−2.863)
3.535
(0.997)
3.489 ***
(3.209)
Year fixed effectyesyesyesyes
City fixed effectsyesyesyesyes
Wald F573.401
LM statistic[0.000]
Sample size3510216037803780
R2 0.7700.6550.658
Note: t-values in round brackets, p-values in middle brackets, ***, **, * indicate significant at 1%, 5%, and 10% significance levels, respectively.
Table 4. Heterogeneity test.
VariableEastMiddleWest
lnFDIA−0.027
(−0.740)
0.136 ***
(2.734)
0.146 ***
(2.917)
lnTI−0.031
(−0.653)
0.100 **
(2.292)
0.128 *
(1.686)
lnFDIA × lnTI−0.005
(−1.032)
−0.011
(−1.576)
−0.022 ***
(−3.074)
lnPGDP1.392 *
(1.768)
2.026 **
(2.612)
0.148
(0.633)
(lnPGDP)2−0.051
(−1.421)
−0.091 **
(−2.509)
−0.008
(−0.850)
lnOPEN0.209 ***
(2.774)
0.002
(0.152)
0.089 *
(1.680)
lnPOP−0.009
(−0.289)
0.288
(1.155)
0.278
(0.571)
lnIS−0.210
(−0.932)
0.084
(0.823)
0.102
(0.310)
lnFIN0.224 *
(1.887)
0.308 *
(1.933)
0.586 ***
(4.480)
lnGOV0.782 ***
(5.245)
0.782 ***
(4.013)
0.531 ***
(3.298)
cons−2.402
(−0.609)
−7.962 *
(−1.742)
1.376
(0.419)
Year fixed effectyesyesyes
City fixed effectsyesyesyes
Sample size14141386980
R20.6880.7200.631
Note: t-values in parentheses, ***, **, * indicate significant at 1%, 5%, and 10% significance levels, respectively.
Table 5. Moran’s I index of carbon emission intensity.
YearCI
2006−0.015 ***
2007−0.018 ***
2008−0.017 ***
2009−0.013 ***
2010−0.014 ***
2011−0.017 ***
2012−0.013 ***
2013−0.014 ***
2014−0.017 ***
2015−0.025 ***
2016−0.041 ***
2017−0.016 ***
2018−0.025 ***
2019−0.026 ***
Note: *** indicates significant at 1% level of significance.
Table 6. Spatial econometric model regression results.
VariablelnCI
lnFDIA0.172 ***
(9.00)
lnTI0.0413 **
(2.62)
lnFDIA × lnTI−0.0219 ***
(−8.69)
lnPGDP0.799 ***
(3.32)
(lnPGDP)2−0.0316 **
(−2.78)
lnOPEN0.0380 ***
(4.41)
lnPOP−0.172 ***
(−11.10)
lnIS0.539 ***
(10.12)
lnFIN0.517 ***
(17.73)
lnGOV0.110 **
(2.79)
WlnFDIA1.279 ***
(3.63)
WlnTI2.221 ***
(3.60)
WlnFDIA × lnTI−0.175 ***
(−4.58)
WlnPGDP−40.82 ***
(−6.43)
W (lnPGDP)21.610 ***
(5.20)
WlnOPEN0.173
(0.33)
WlnPOP−9.228 ***
(−9.05)
WlnIS19.38 ***
(9.83)
WlnFIN7.819 ***
(7.80)
WlnGOV−6.600 ***
(−3.88)
ρ −0.499 *
(−1.73)
Sample size3780
R20.3626
Note: t-values in parentheses, ***, **, * indicate significant at 1%, 5%, and 10% significance levels, respectively.
Table 7. Direct and indirect effects of FDI agglomeration on carbon emission intensity.
VariableDirect EffectIndirect EffectsTotal Effect
lnFDIA0.171 ***
(8.86)
0.884 *
(2.23)
1.055 **
(2.64)
lnTI0.0367 *
(2.57)
1.576 *
(2.37)
1.613 *
(2.41)
lnFDIA × lnTI−0.0215 ***
(−8.92)
−0.123 *
(−2.48)
−0.144 **
(−2.88)
lnPGDP0.880 ***
(3.44)
−29.38 **
(−3.06)
−28.50 **
(−2.96)
(lnPGDP)2−0.0352 **
(−2.95)
1.152 **
(2.96)
1.117 **
(2.86)
lnOPEN0.0384 ***
(4.53)
0.150
(0.34)
0.188
(0.43)
lnPOP−0.159 ***
(−9.06)
−6.545 **
(−2.93)
−6.704 **
(−2.99)
lnIS0.506 ***
(10.11)
13.77 **
(3.01)
14.27 **
(3.11)
lnFIN0.506 ***
(18.28)
5.339 **
(3.10)
5.844 ***
(3.37)
lnGOV0.113 **
(2.85)
−4.816 *
(−2.16)
−4.703 *
(−2.10)
Sample size378037803780
R20.36260.36260.3626
Note: t-values in parentheses, ***, **, * indicate significant at 1%, 5%, and 10% significance levels, respectively.
Disclaimer/Publisher’s Note: The statements, opinions and data contained in all publications are solely those of the individual author(s) and contributor(s) and not of MDPI and/or the editor(s). MDPI and/or the editor(s) disclaim responsibility for any injury to people or property resulting from any ideas, methods, instructions or products referred to in the content.

