
Sustainability Analysis of Soil Erosion Control in Rwanda: Case Study of the Sebeya Watershed

Abstract
:1. Introduction
2. Methodology
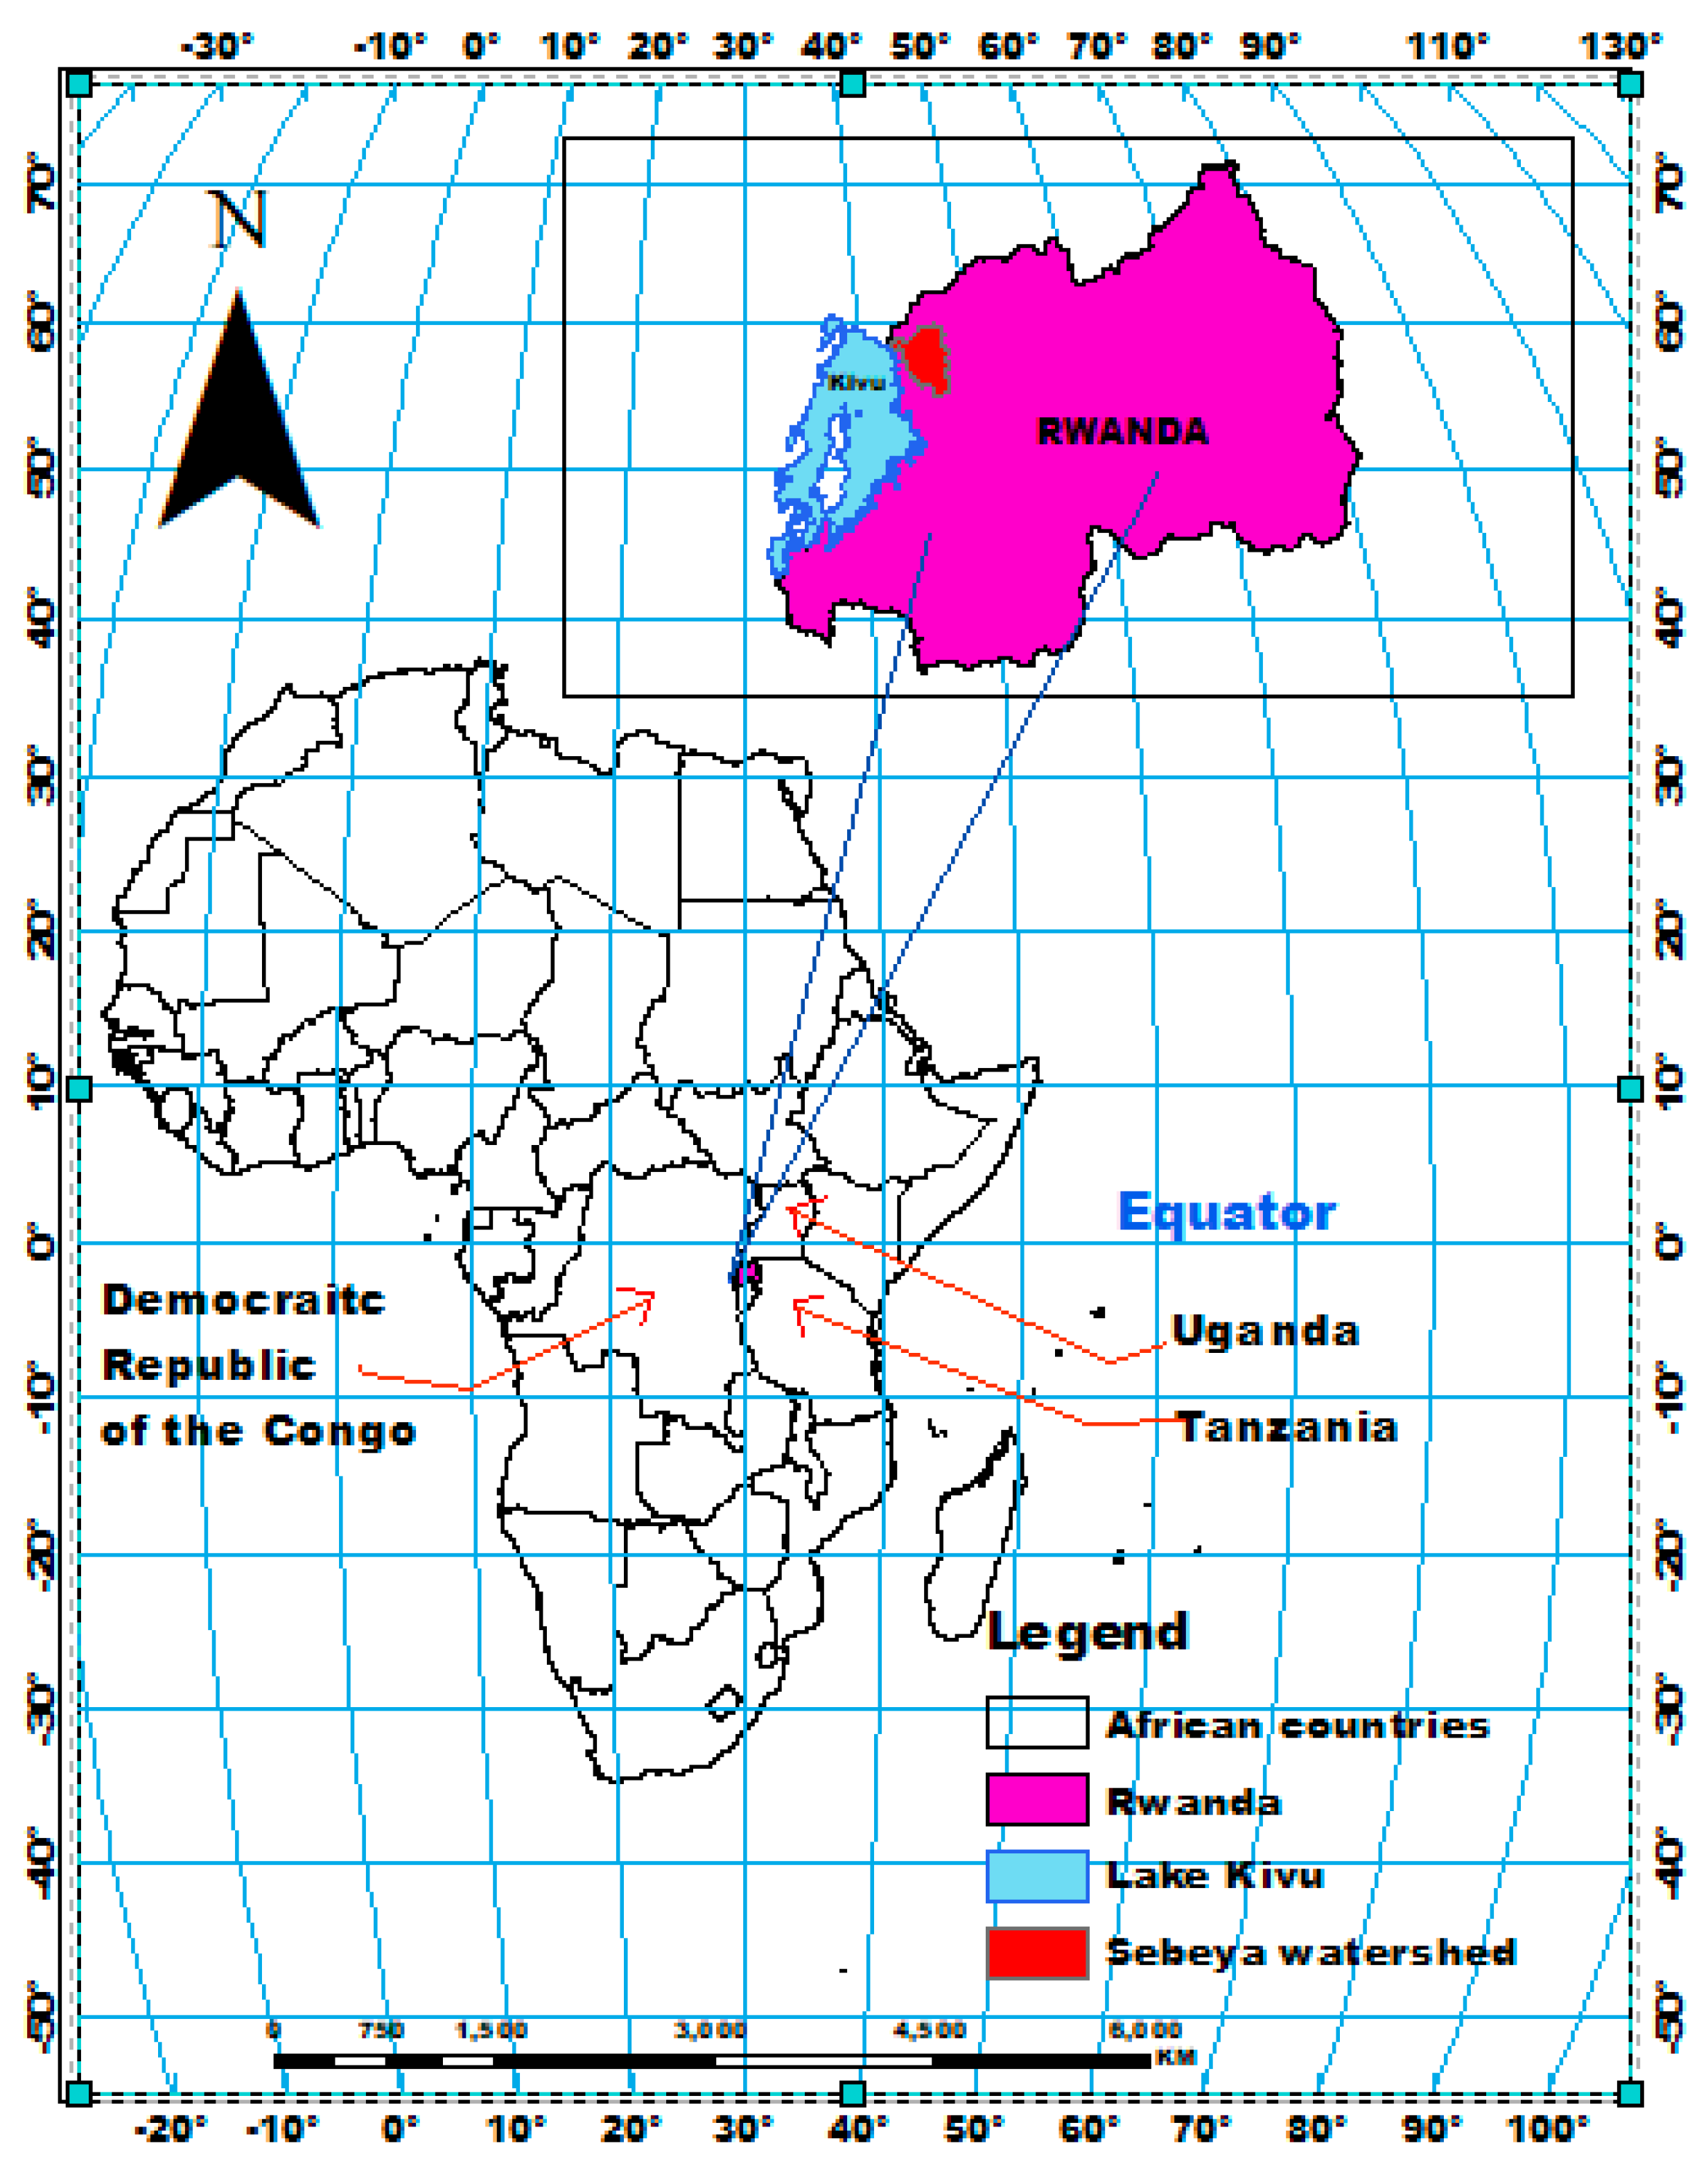
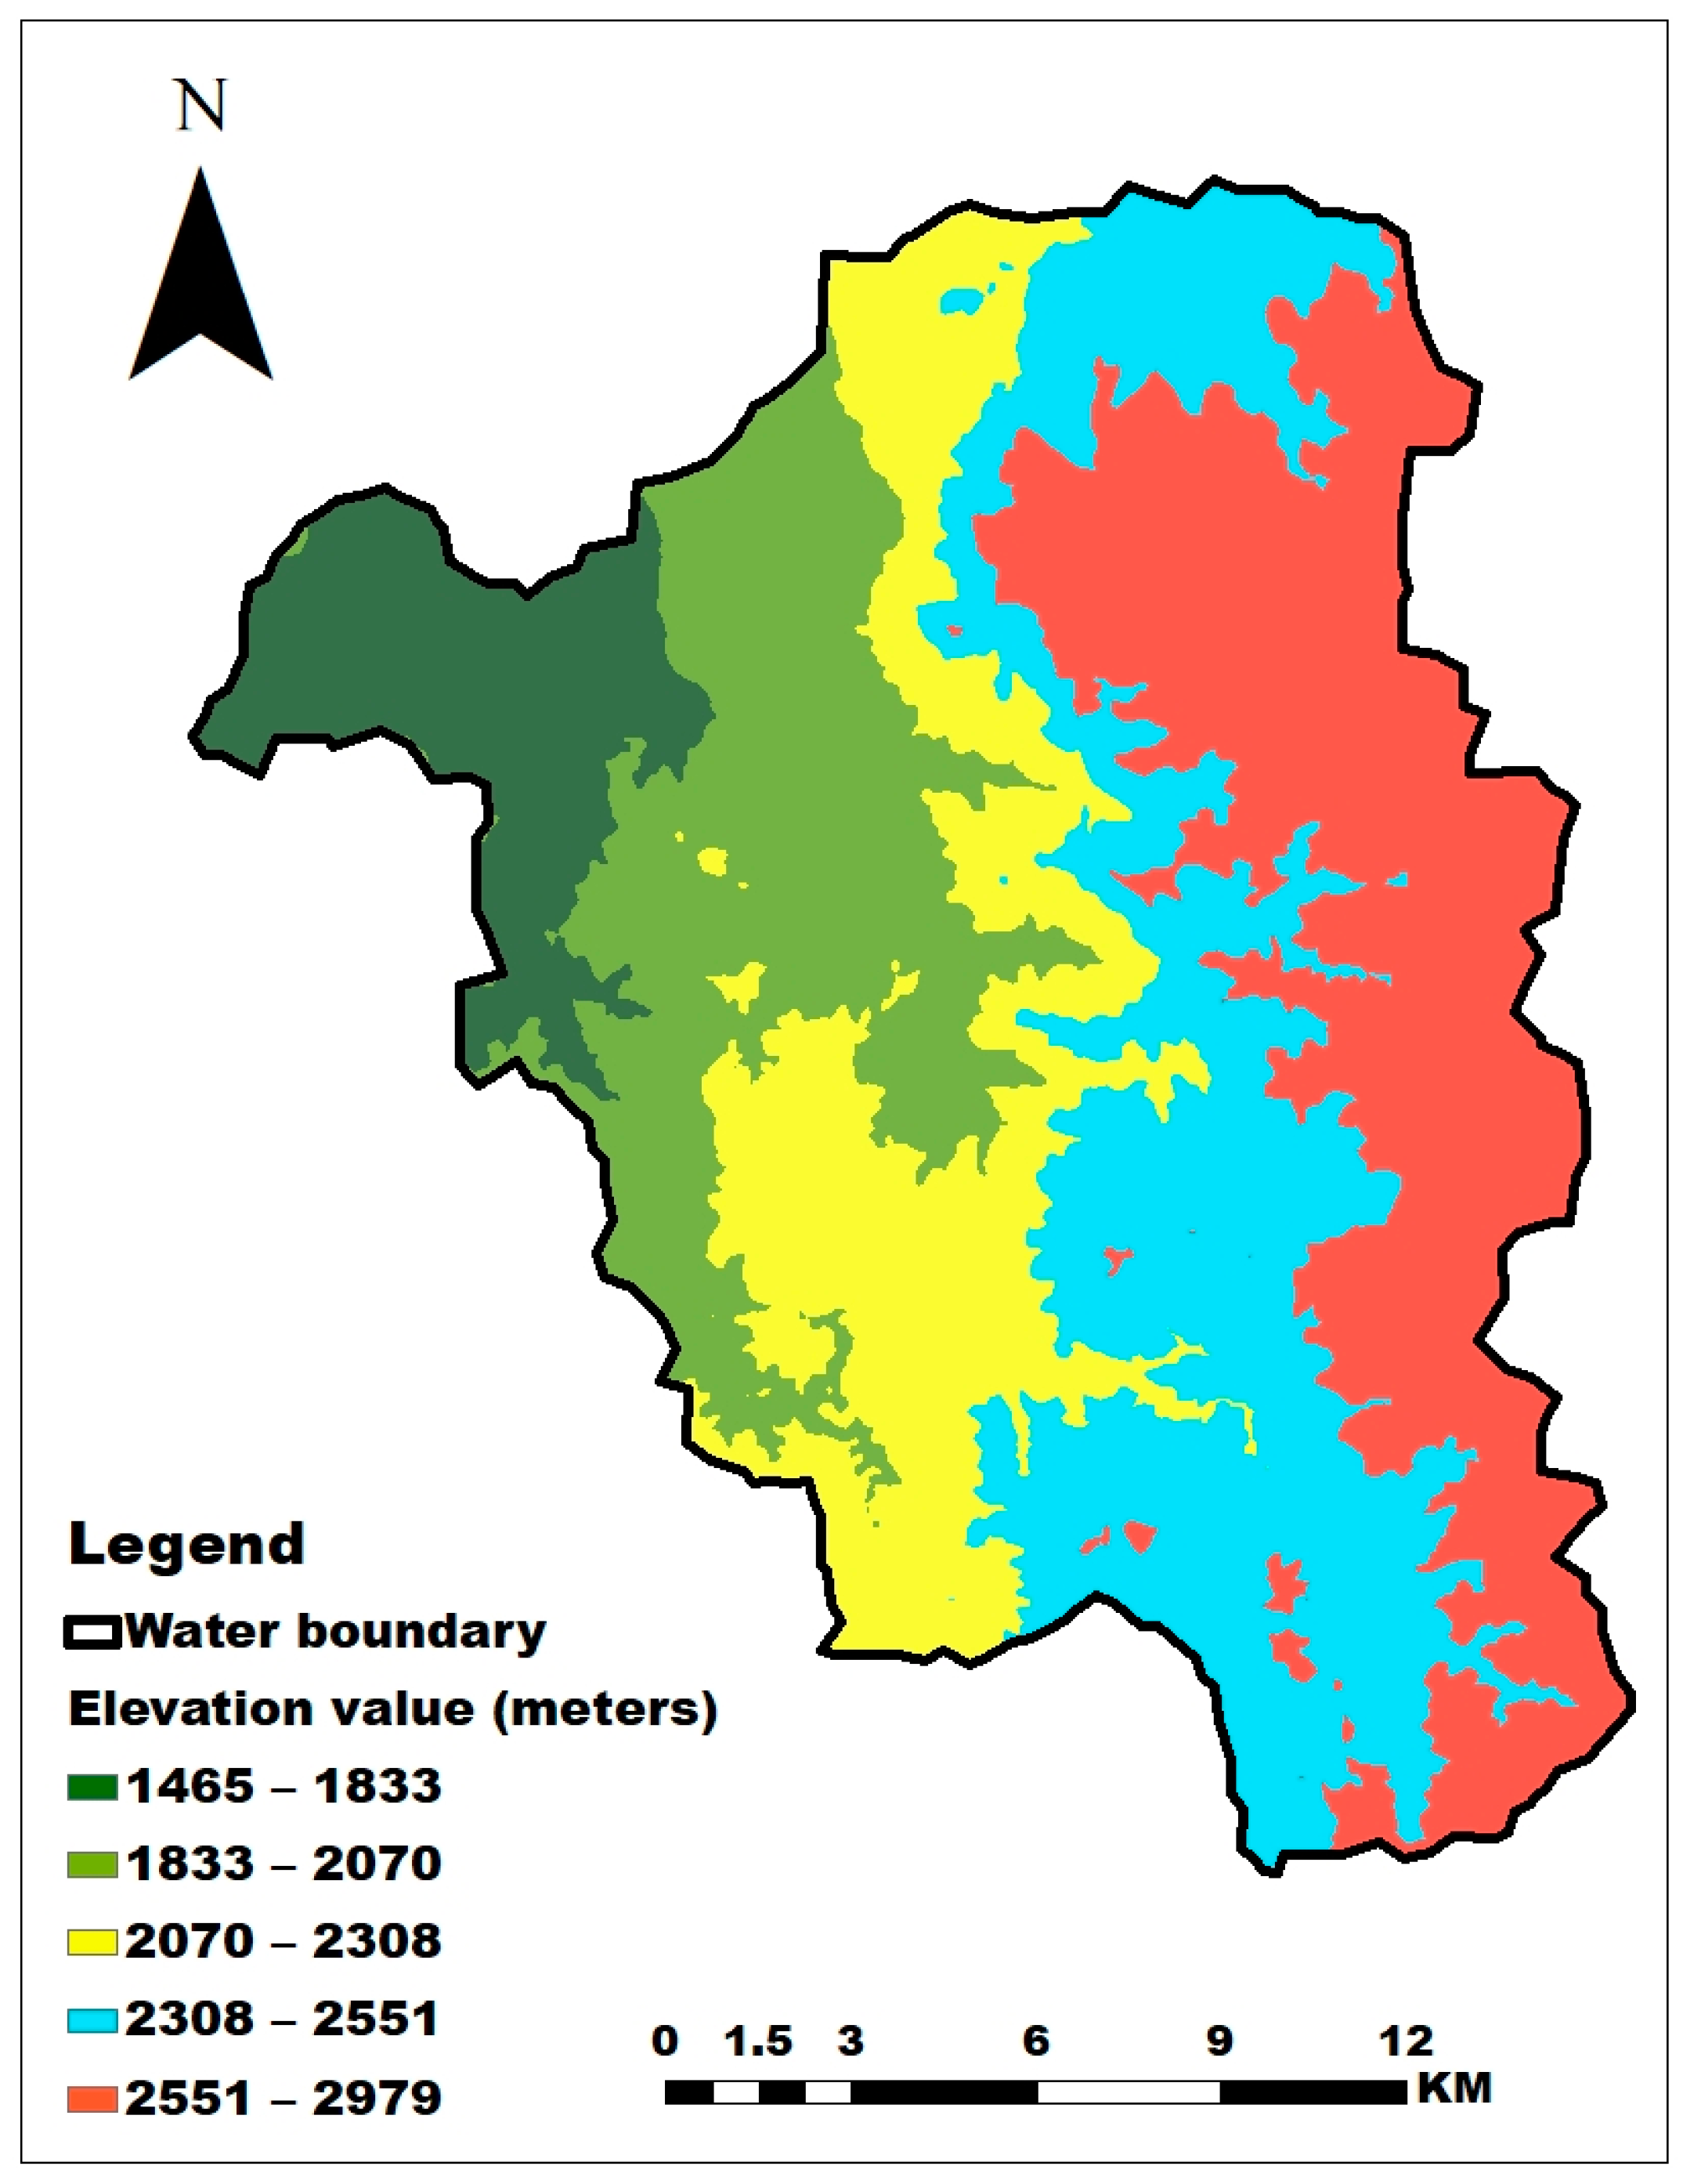
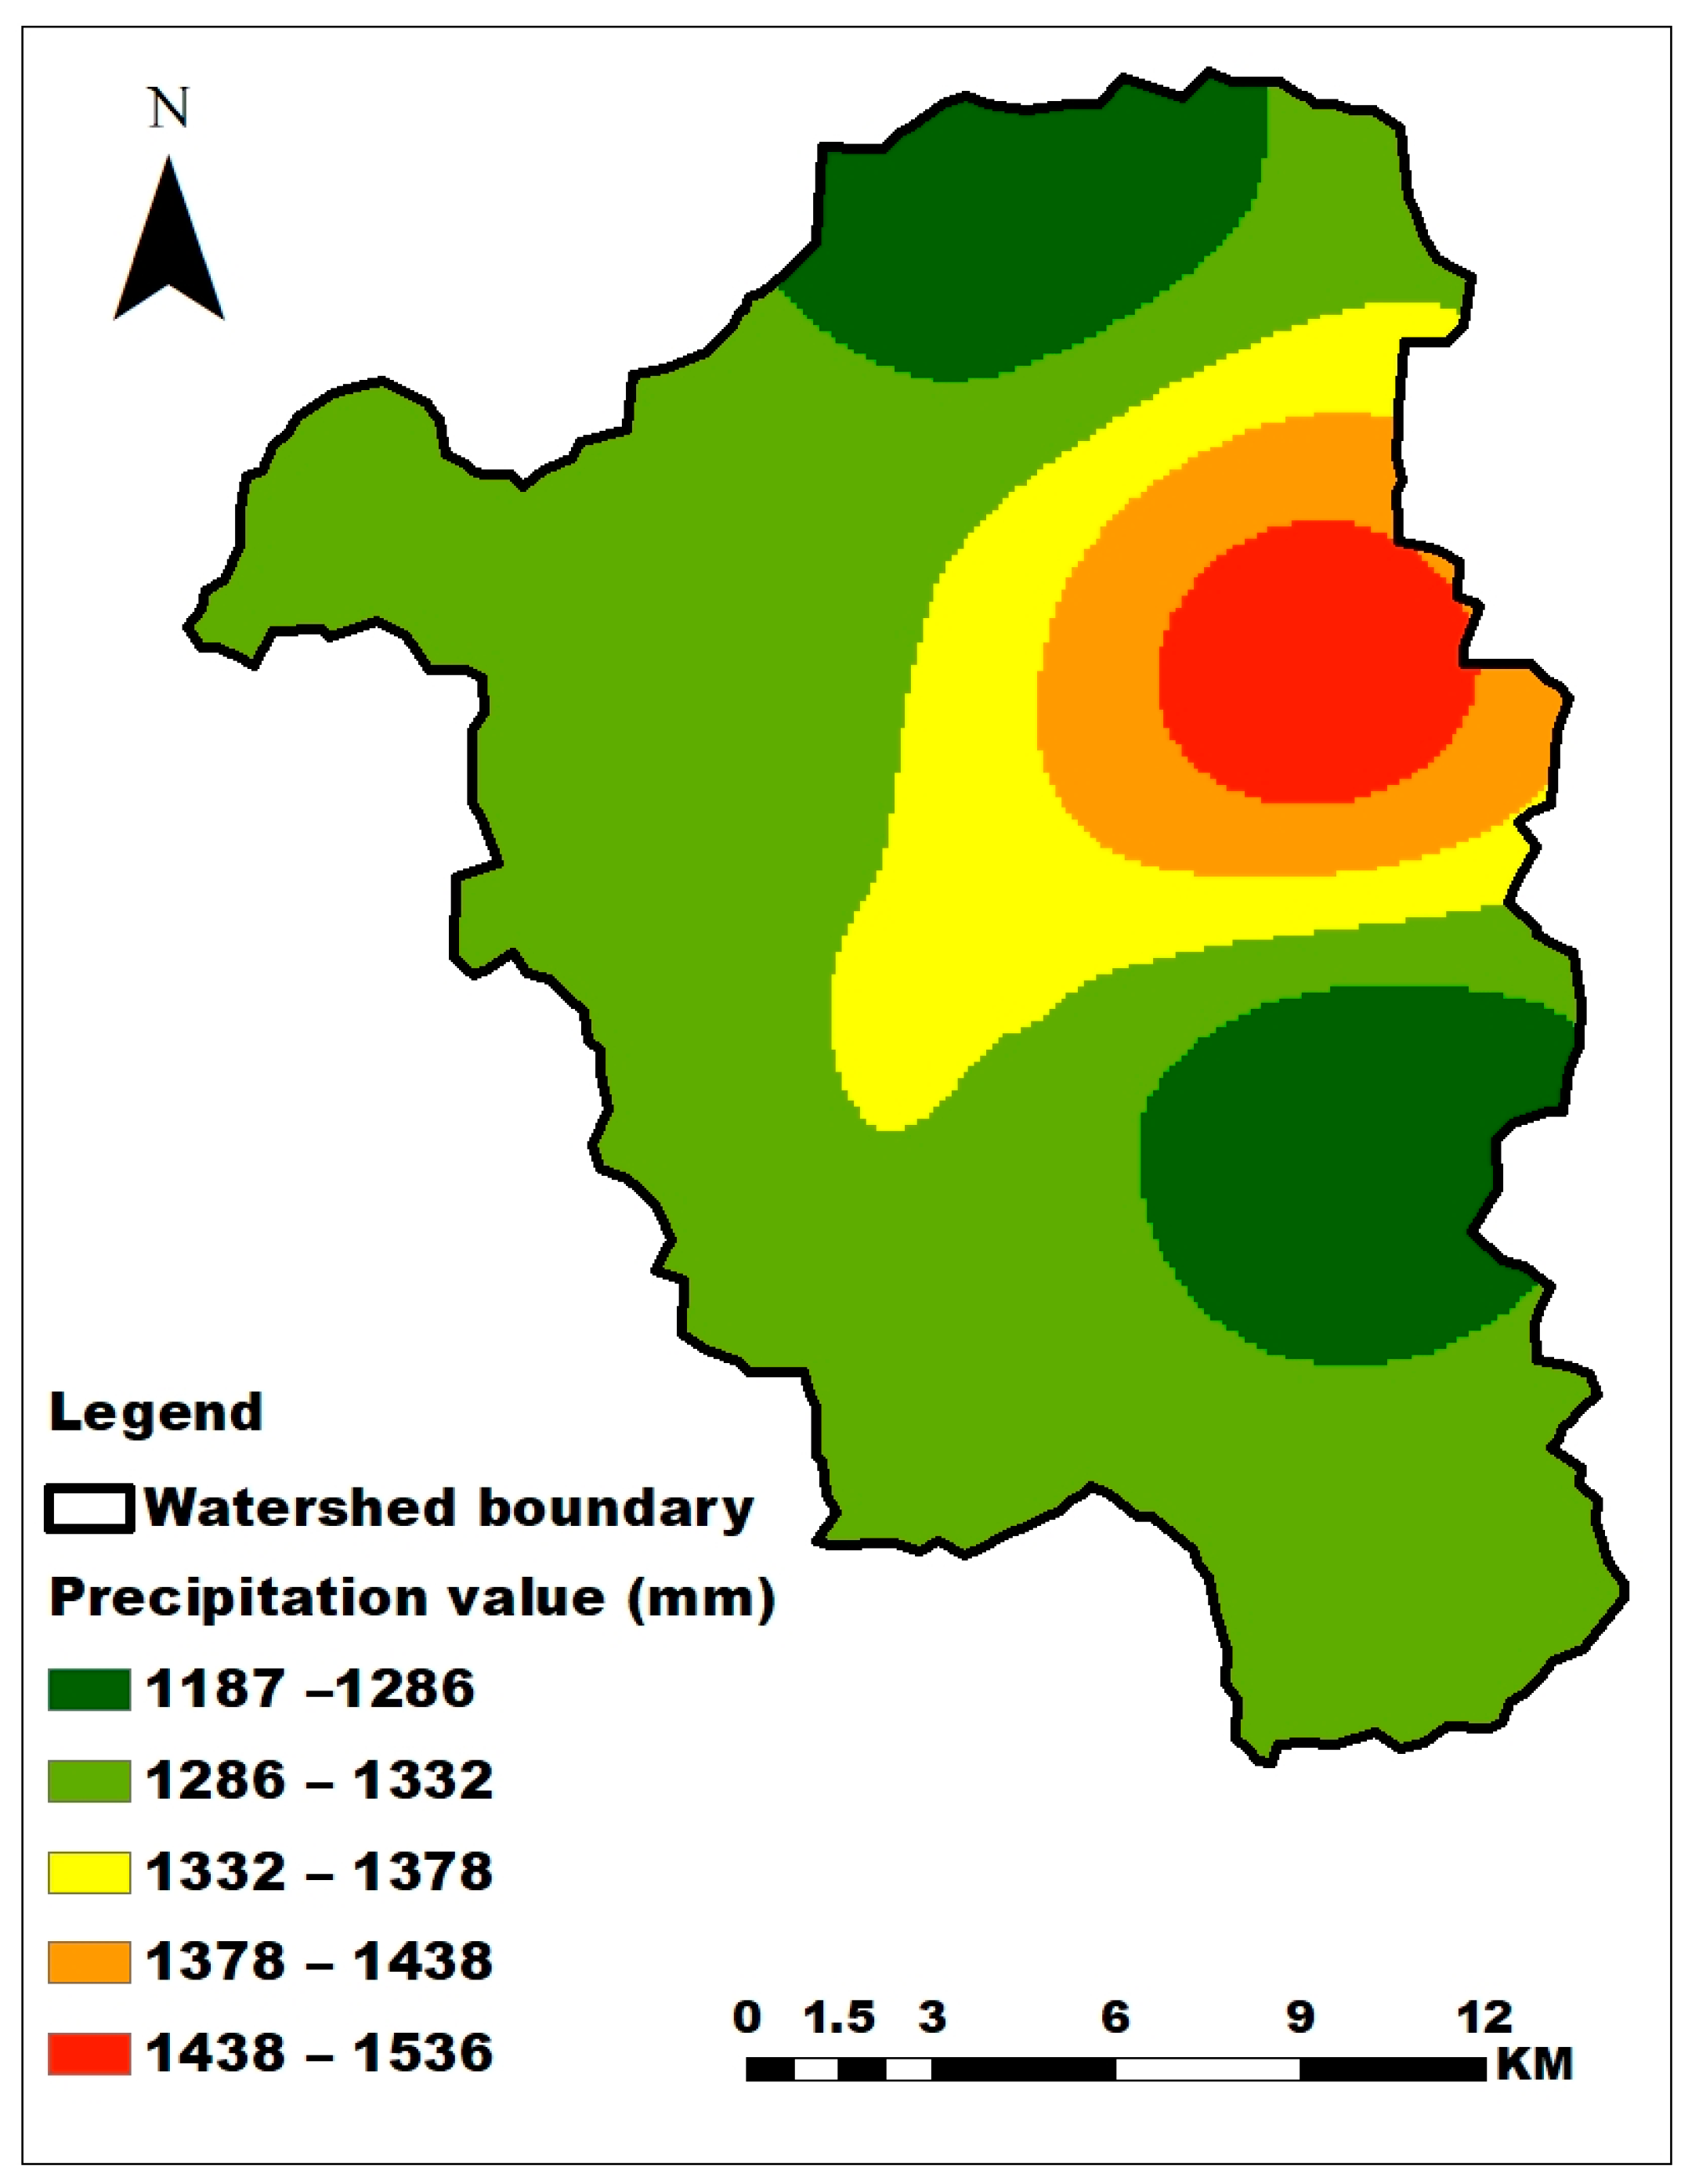
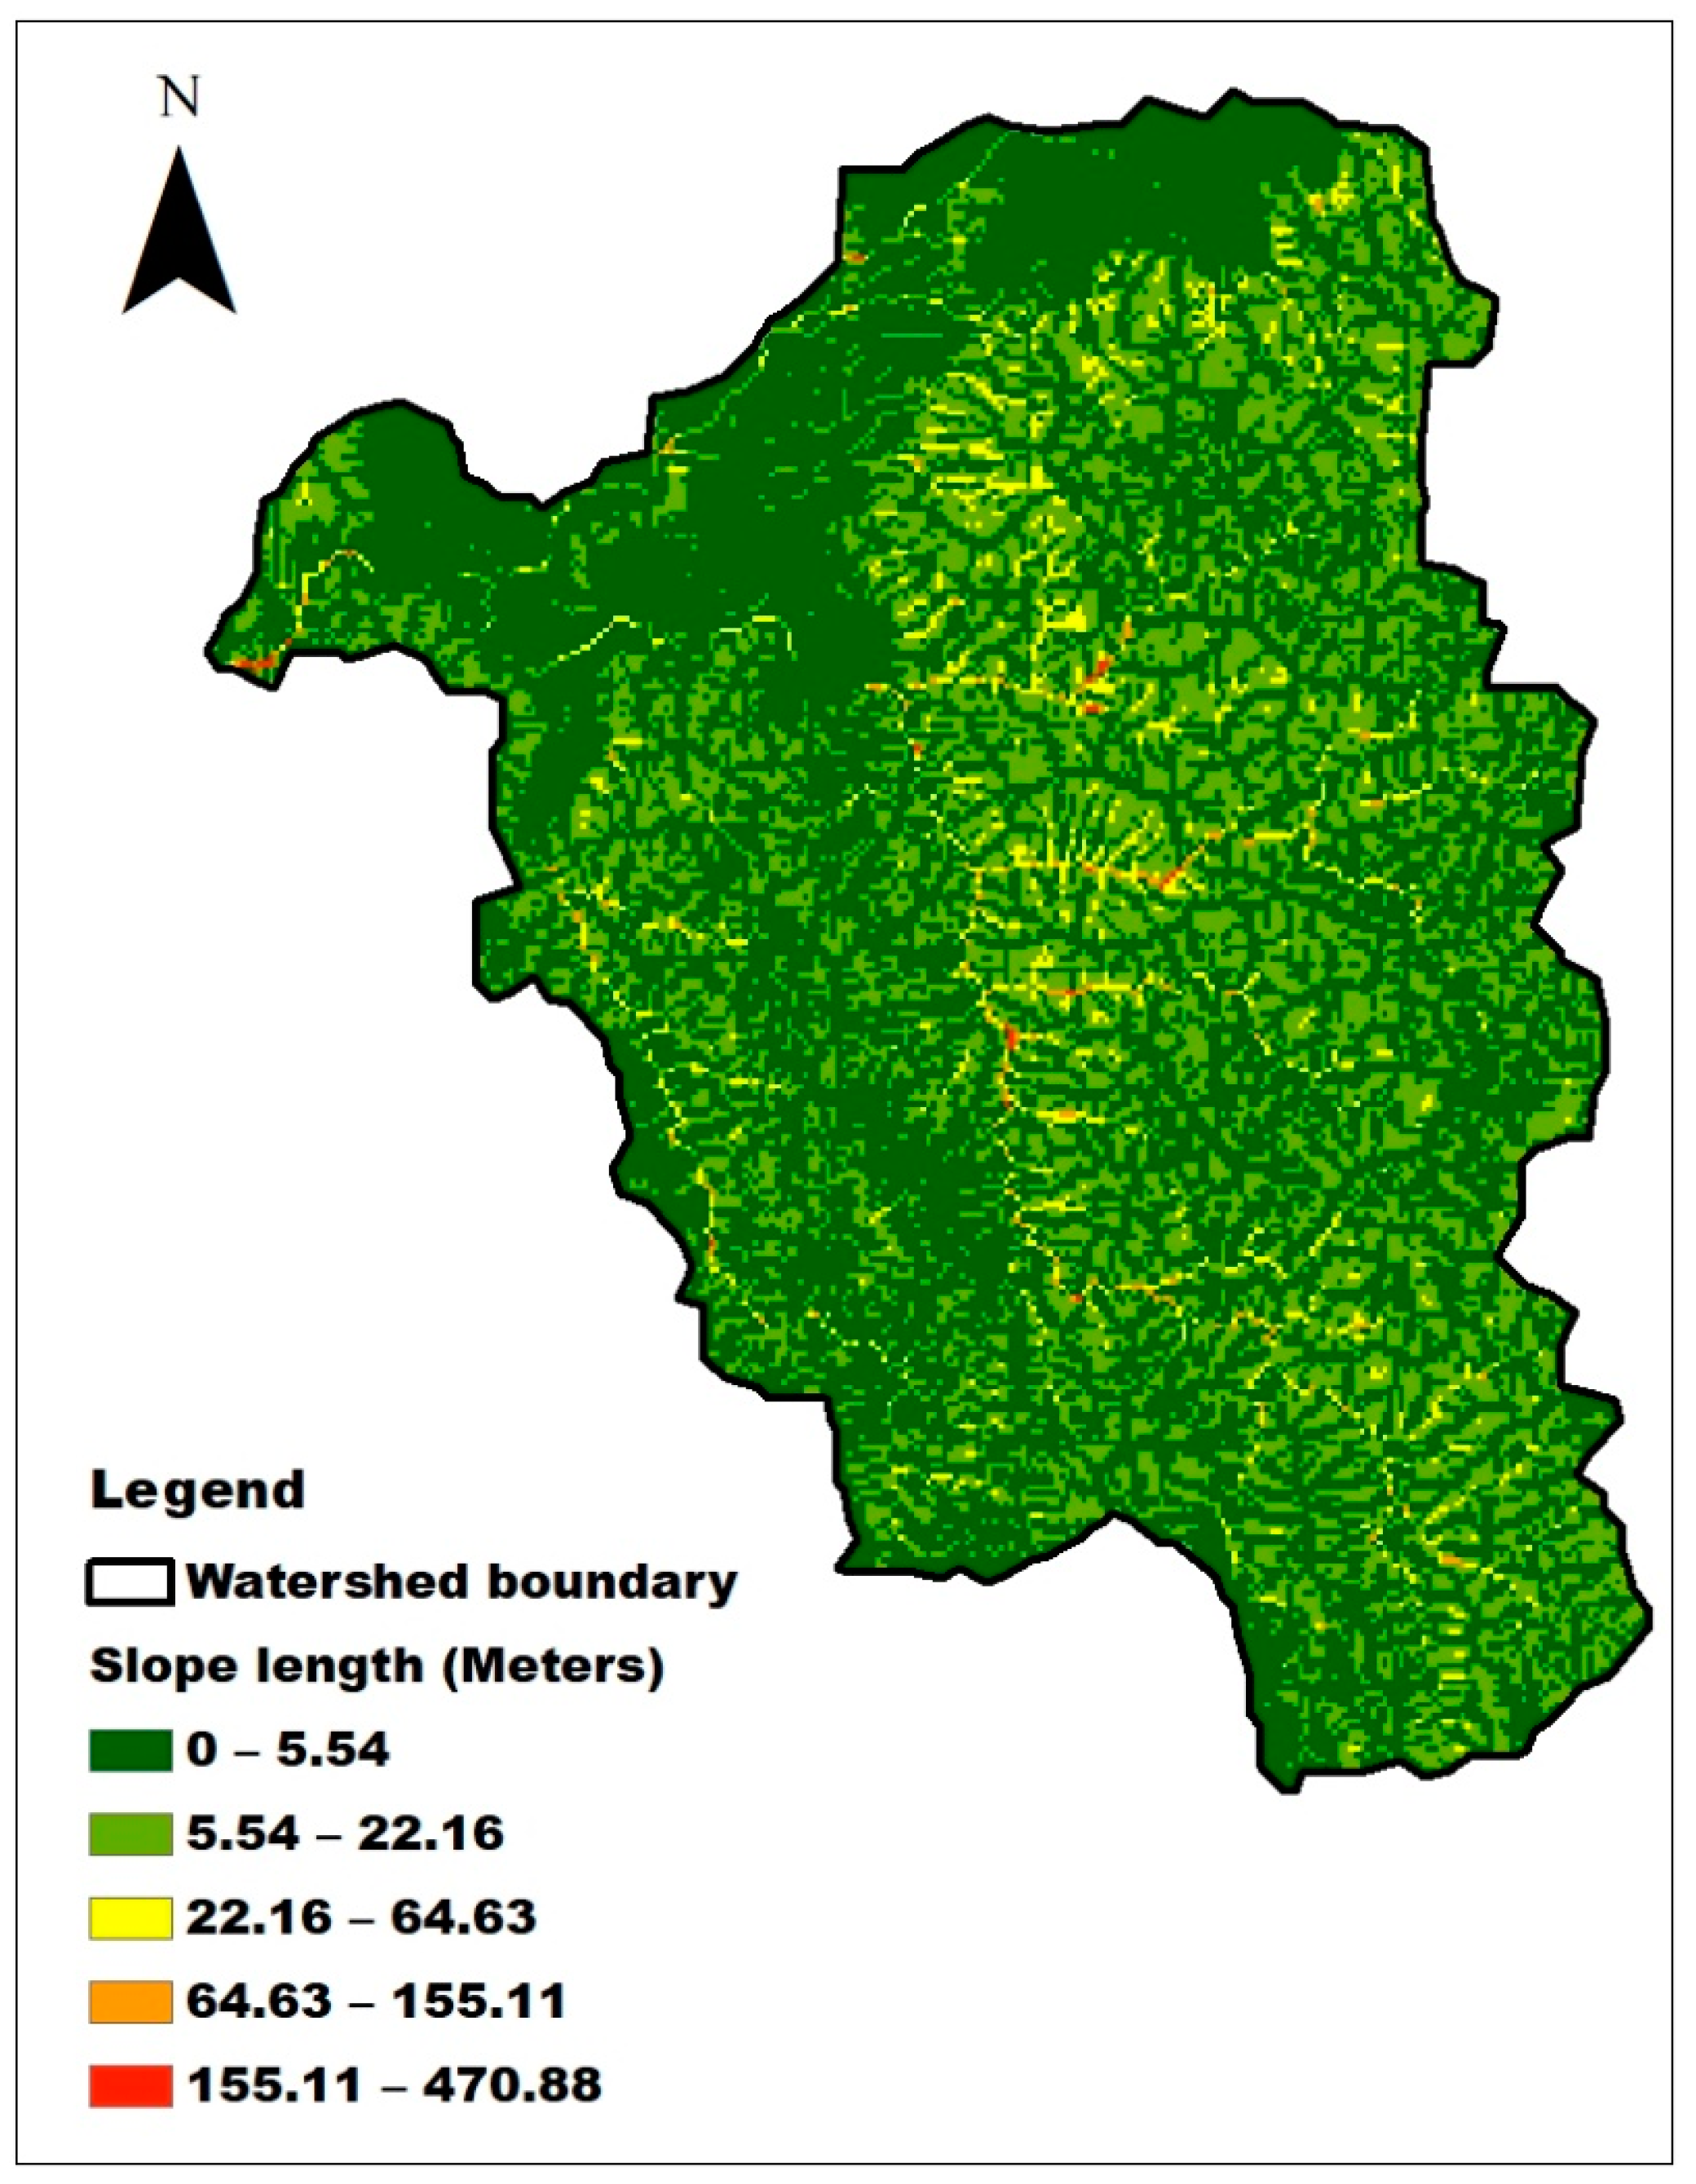
2.1. Study Area
2.2. Data Collection
- Step 1: Determining R factor for the Sebeya watershed
- Step 2: Determining K factor for the Sebeya watershed
- Step 3: Determining LS factor for the Sebeya watershed
- Step 4: Determining C factor and P factor associated to various LULC types in the Sebeya watershed
- Step 5: Determining C factor and P factor for various SECM in the Sebeya watershed
2.3. Data Analysis
3. Results
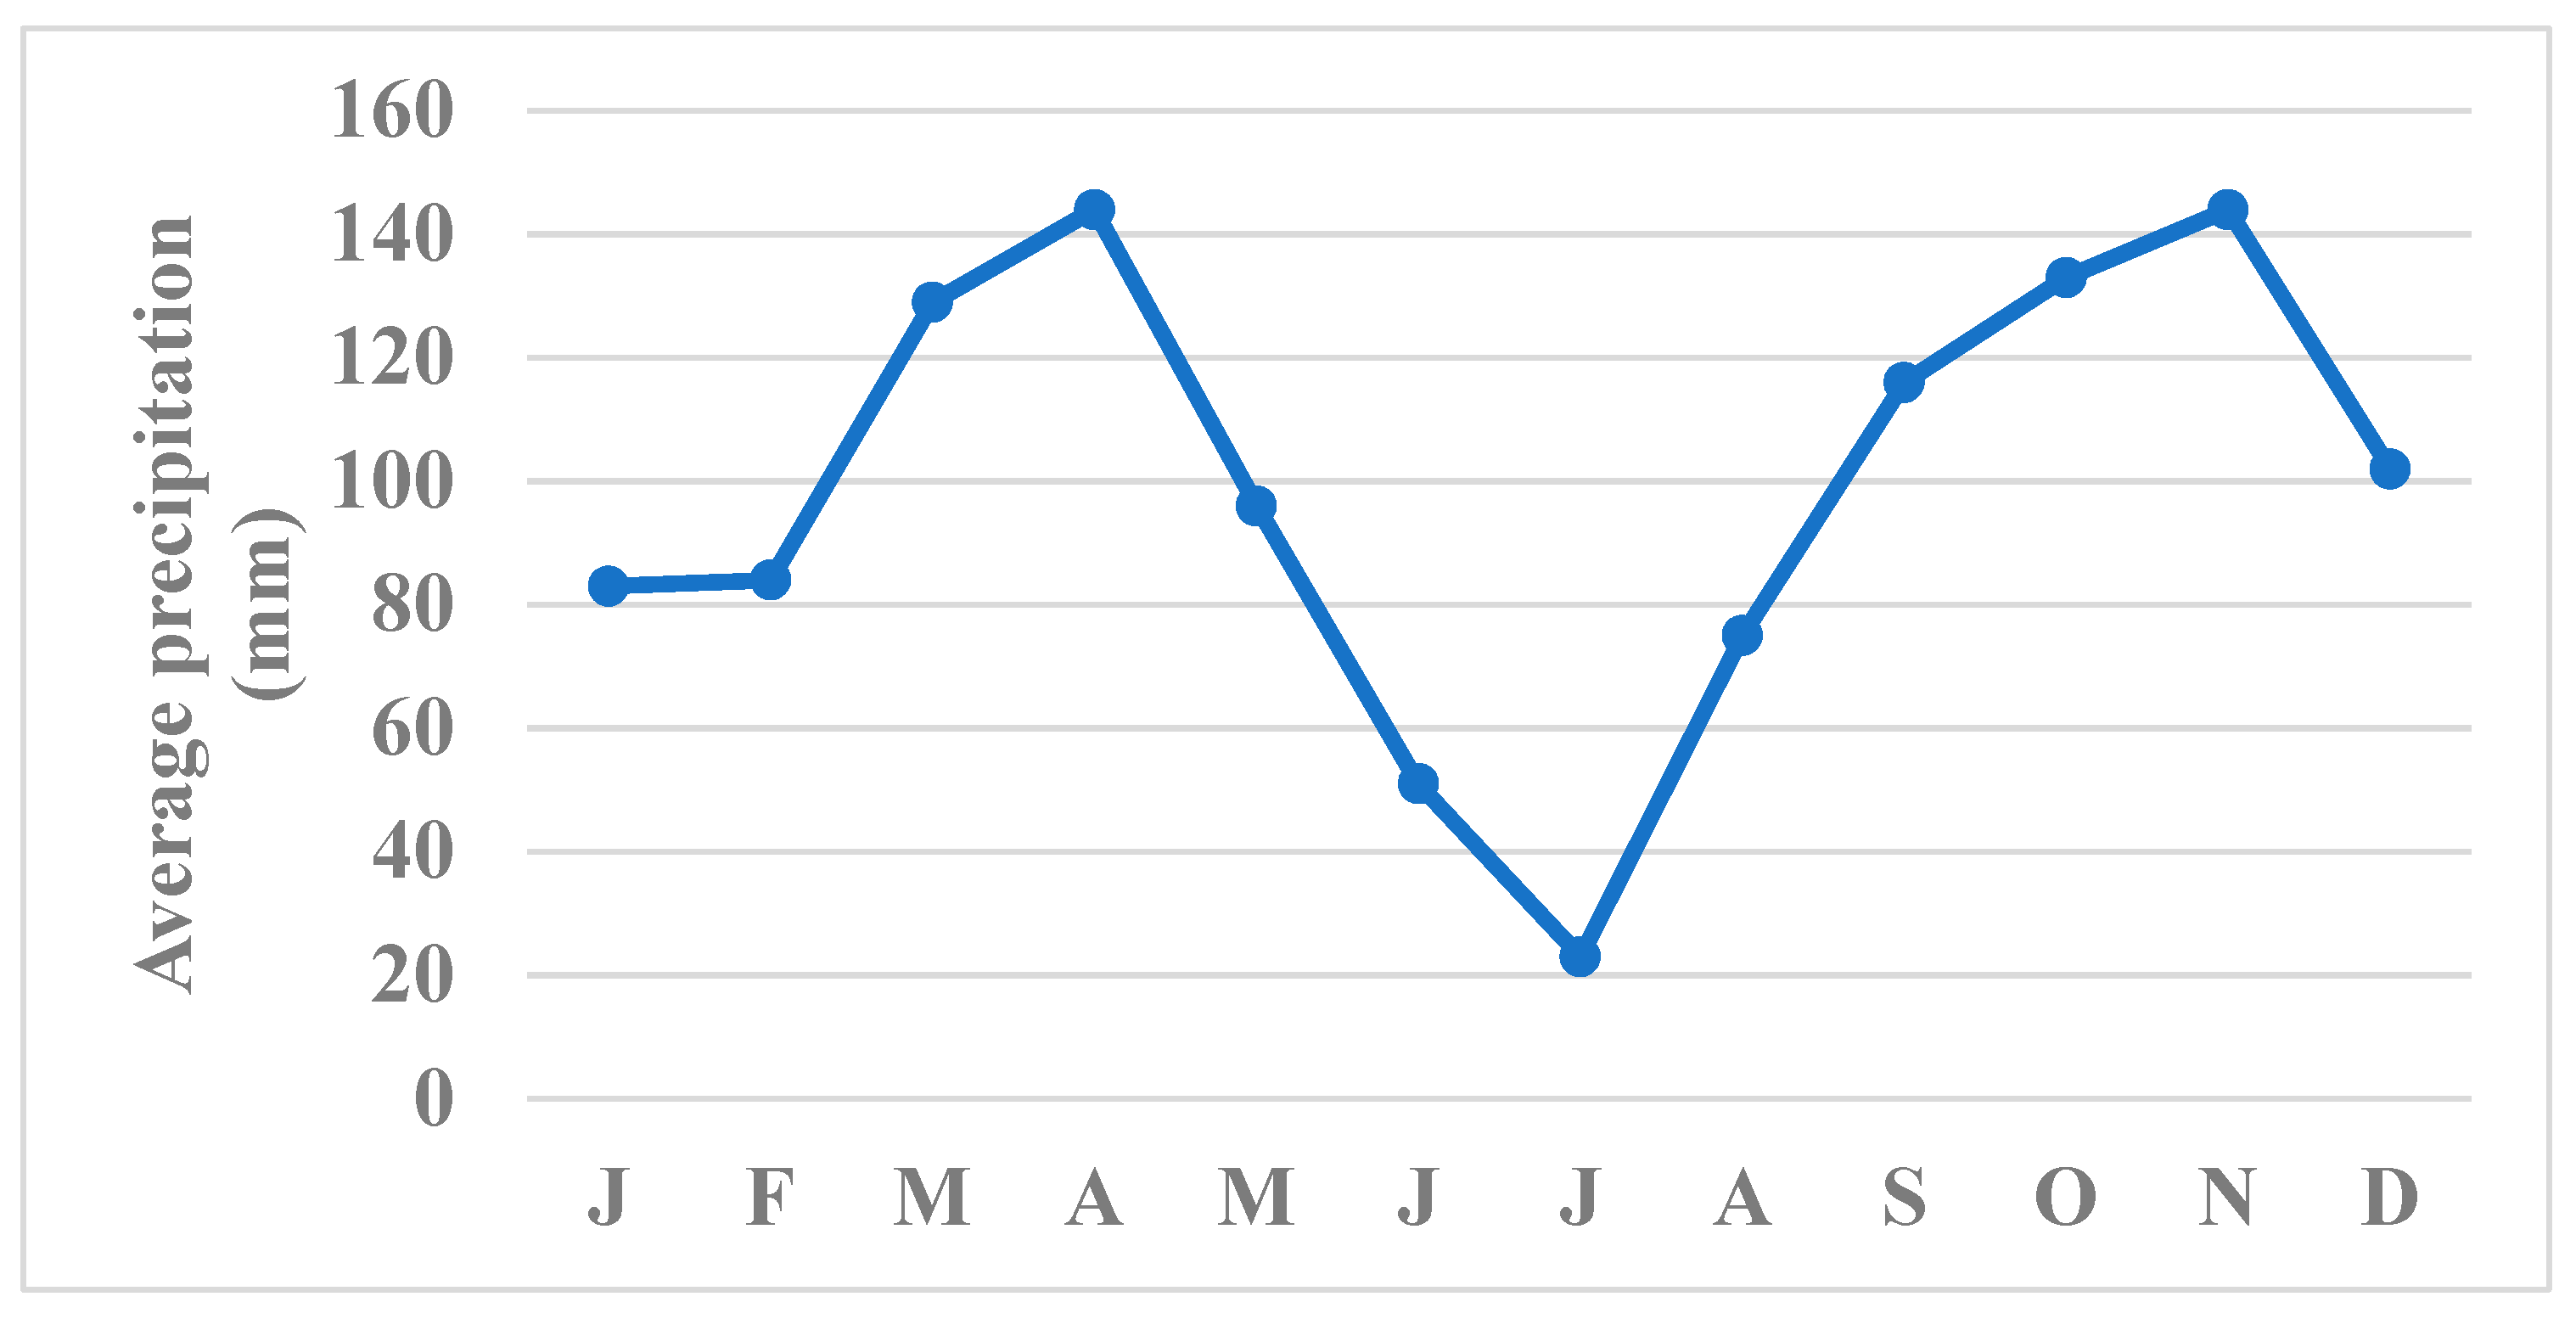
3.1. Hydrological Processes in the Sebeya Watershed
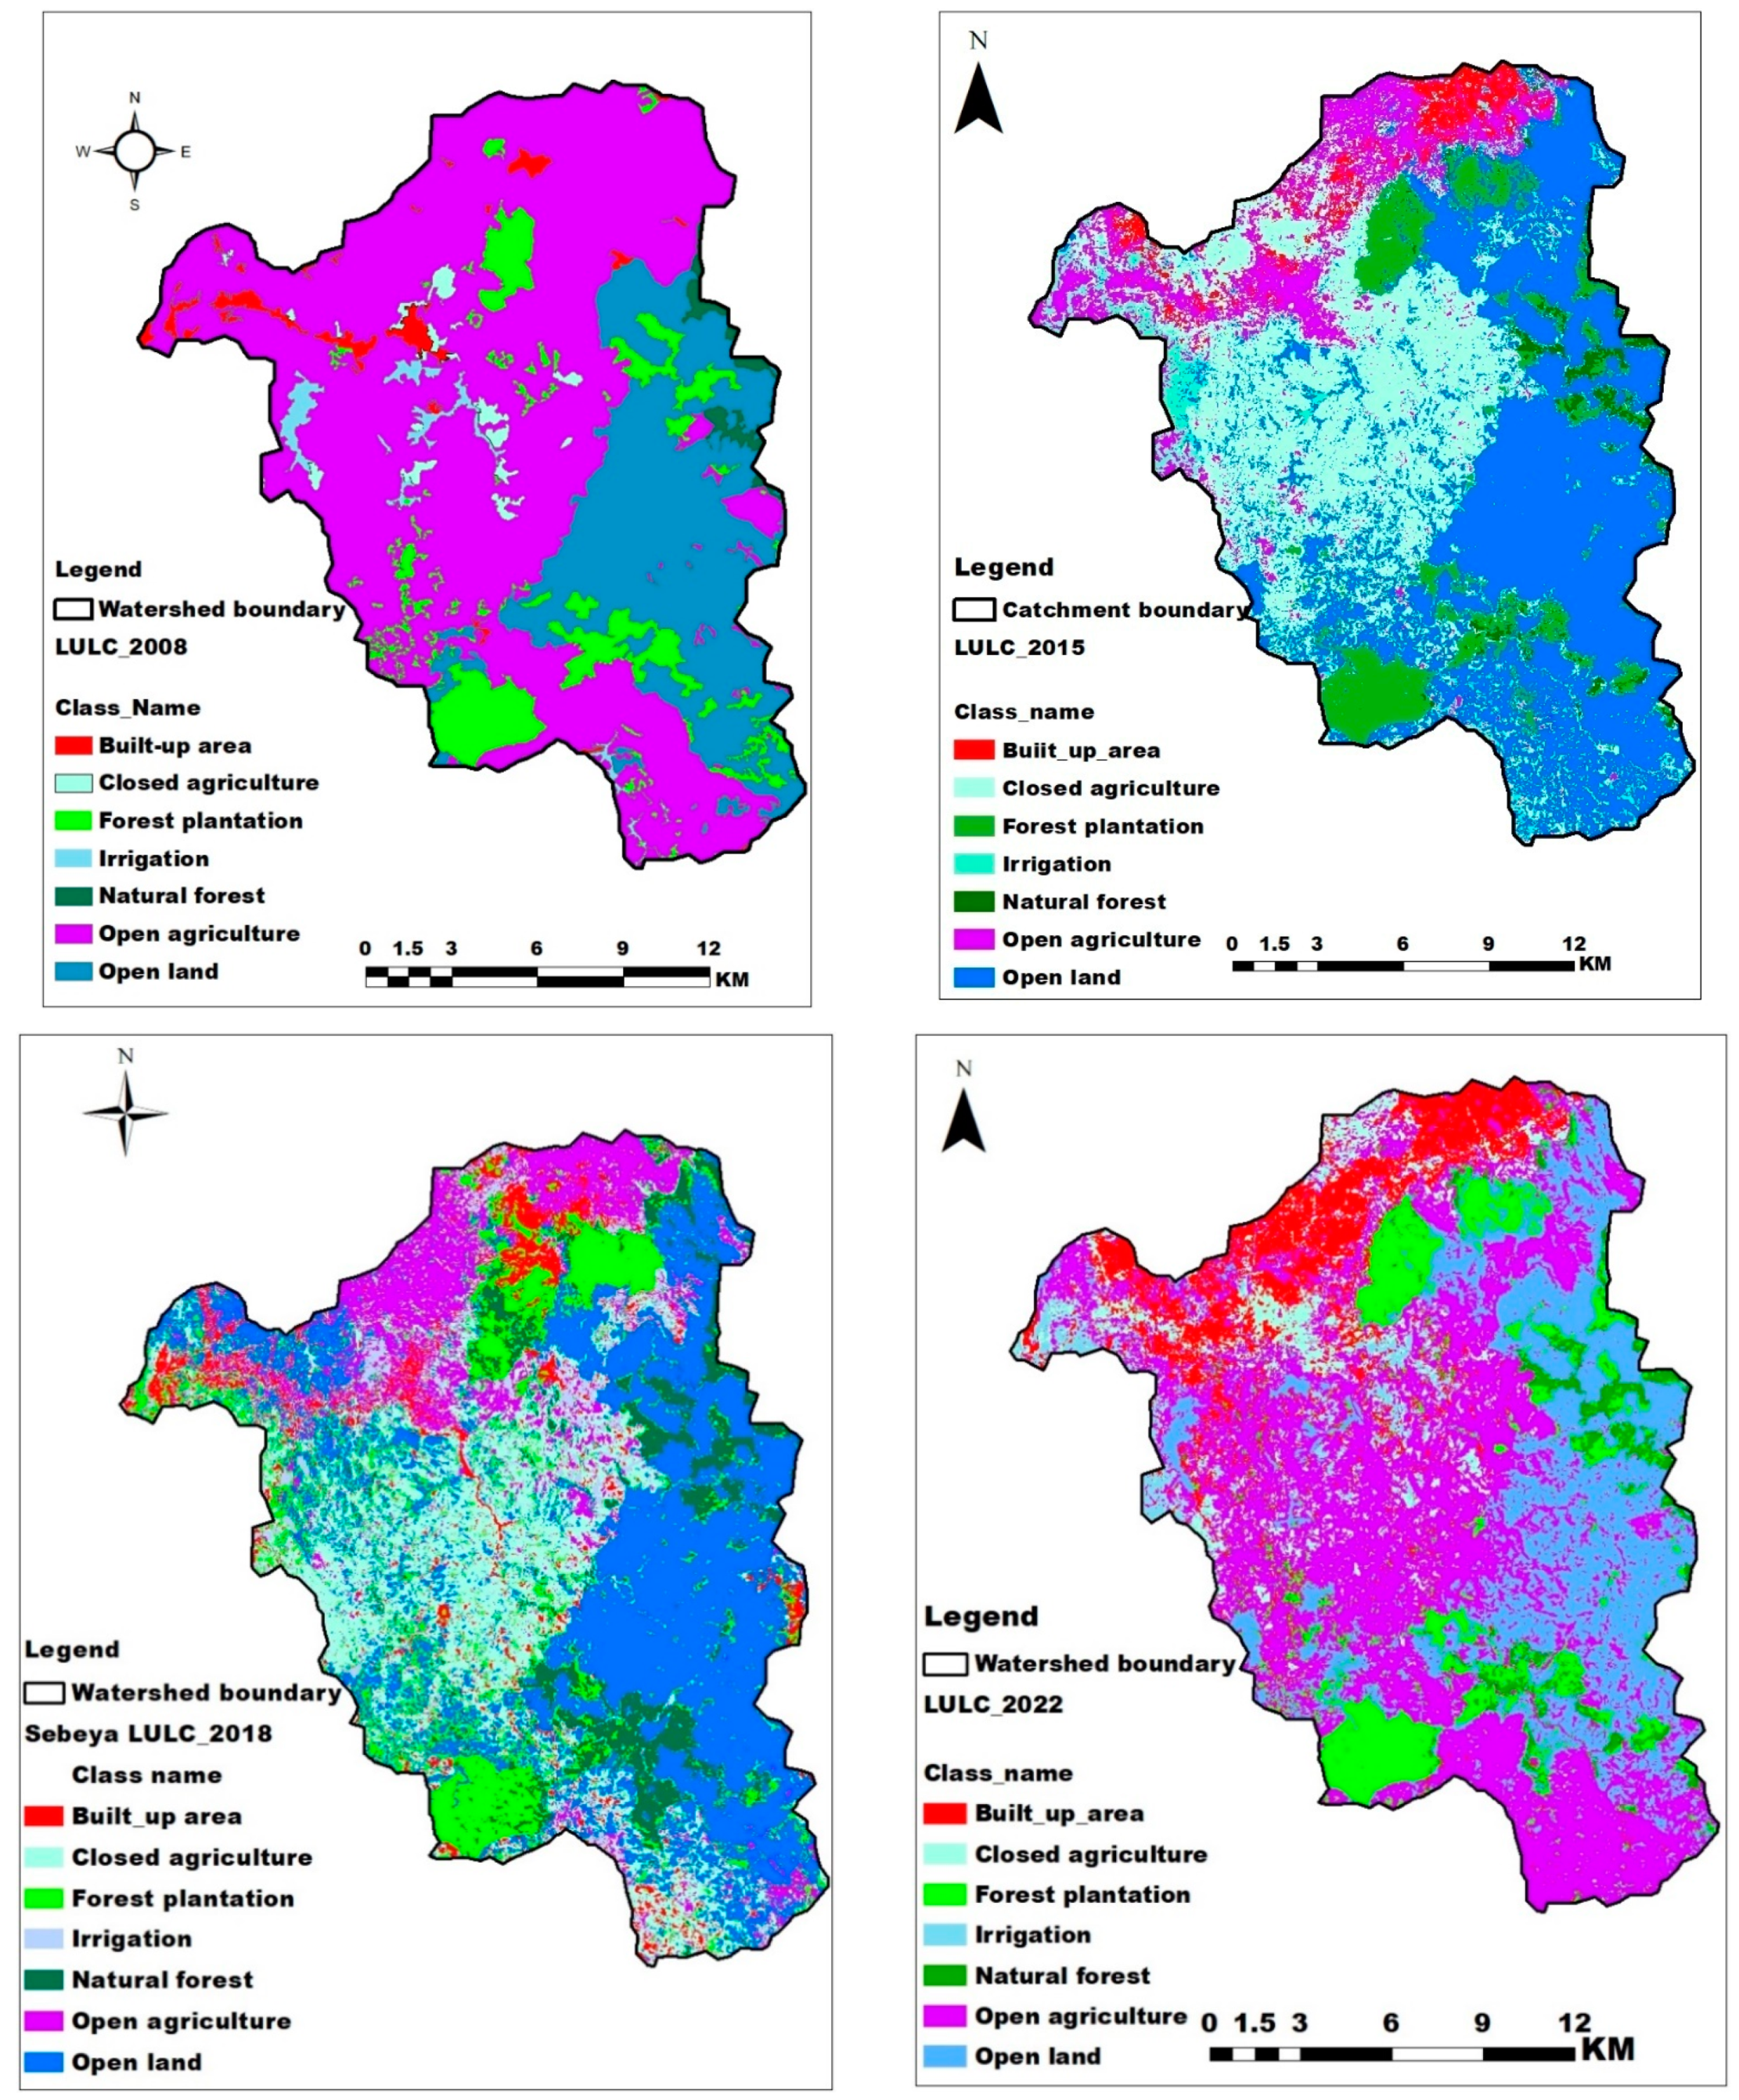
3.2. Impact of LULC on Water Erosion in the Sebeya Watershed
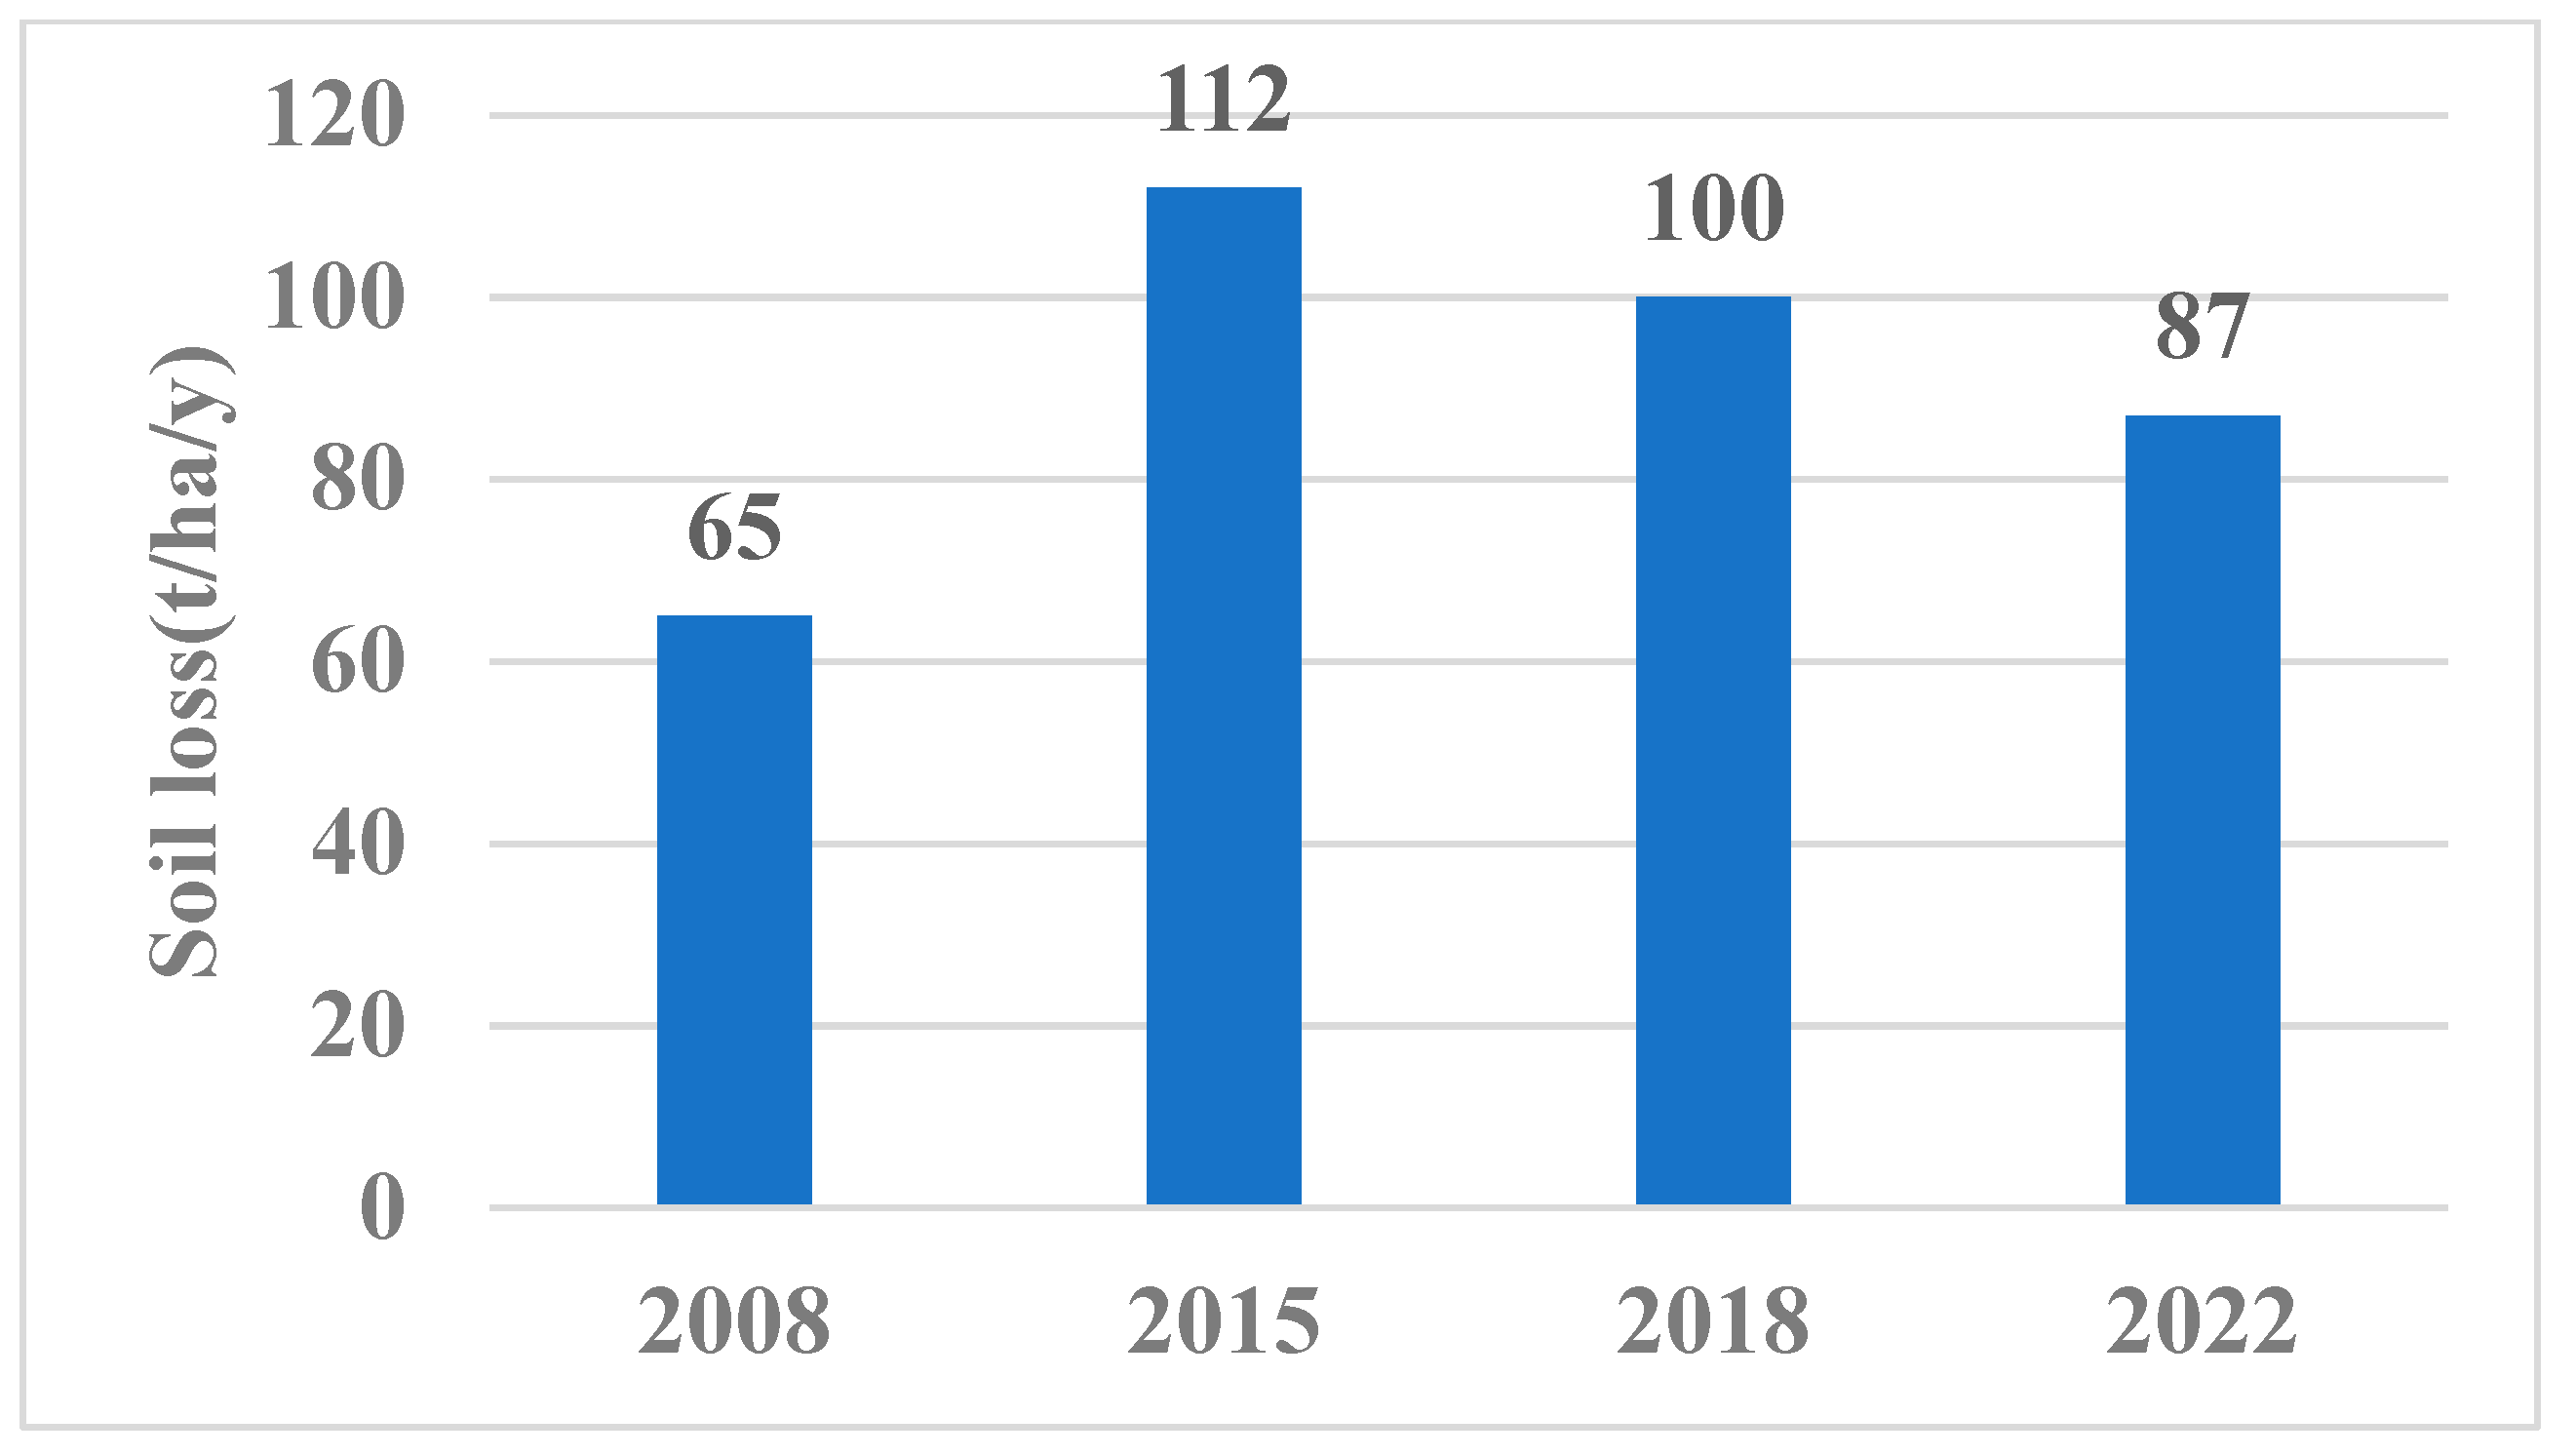
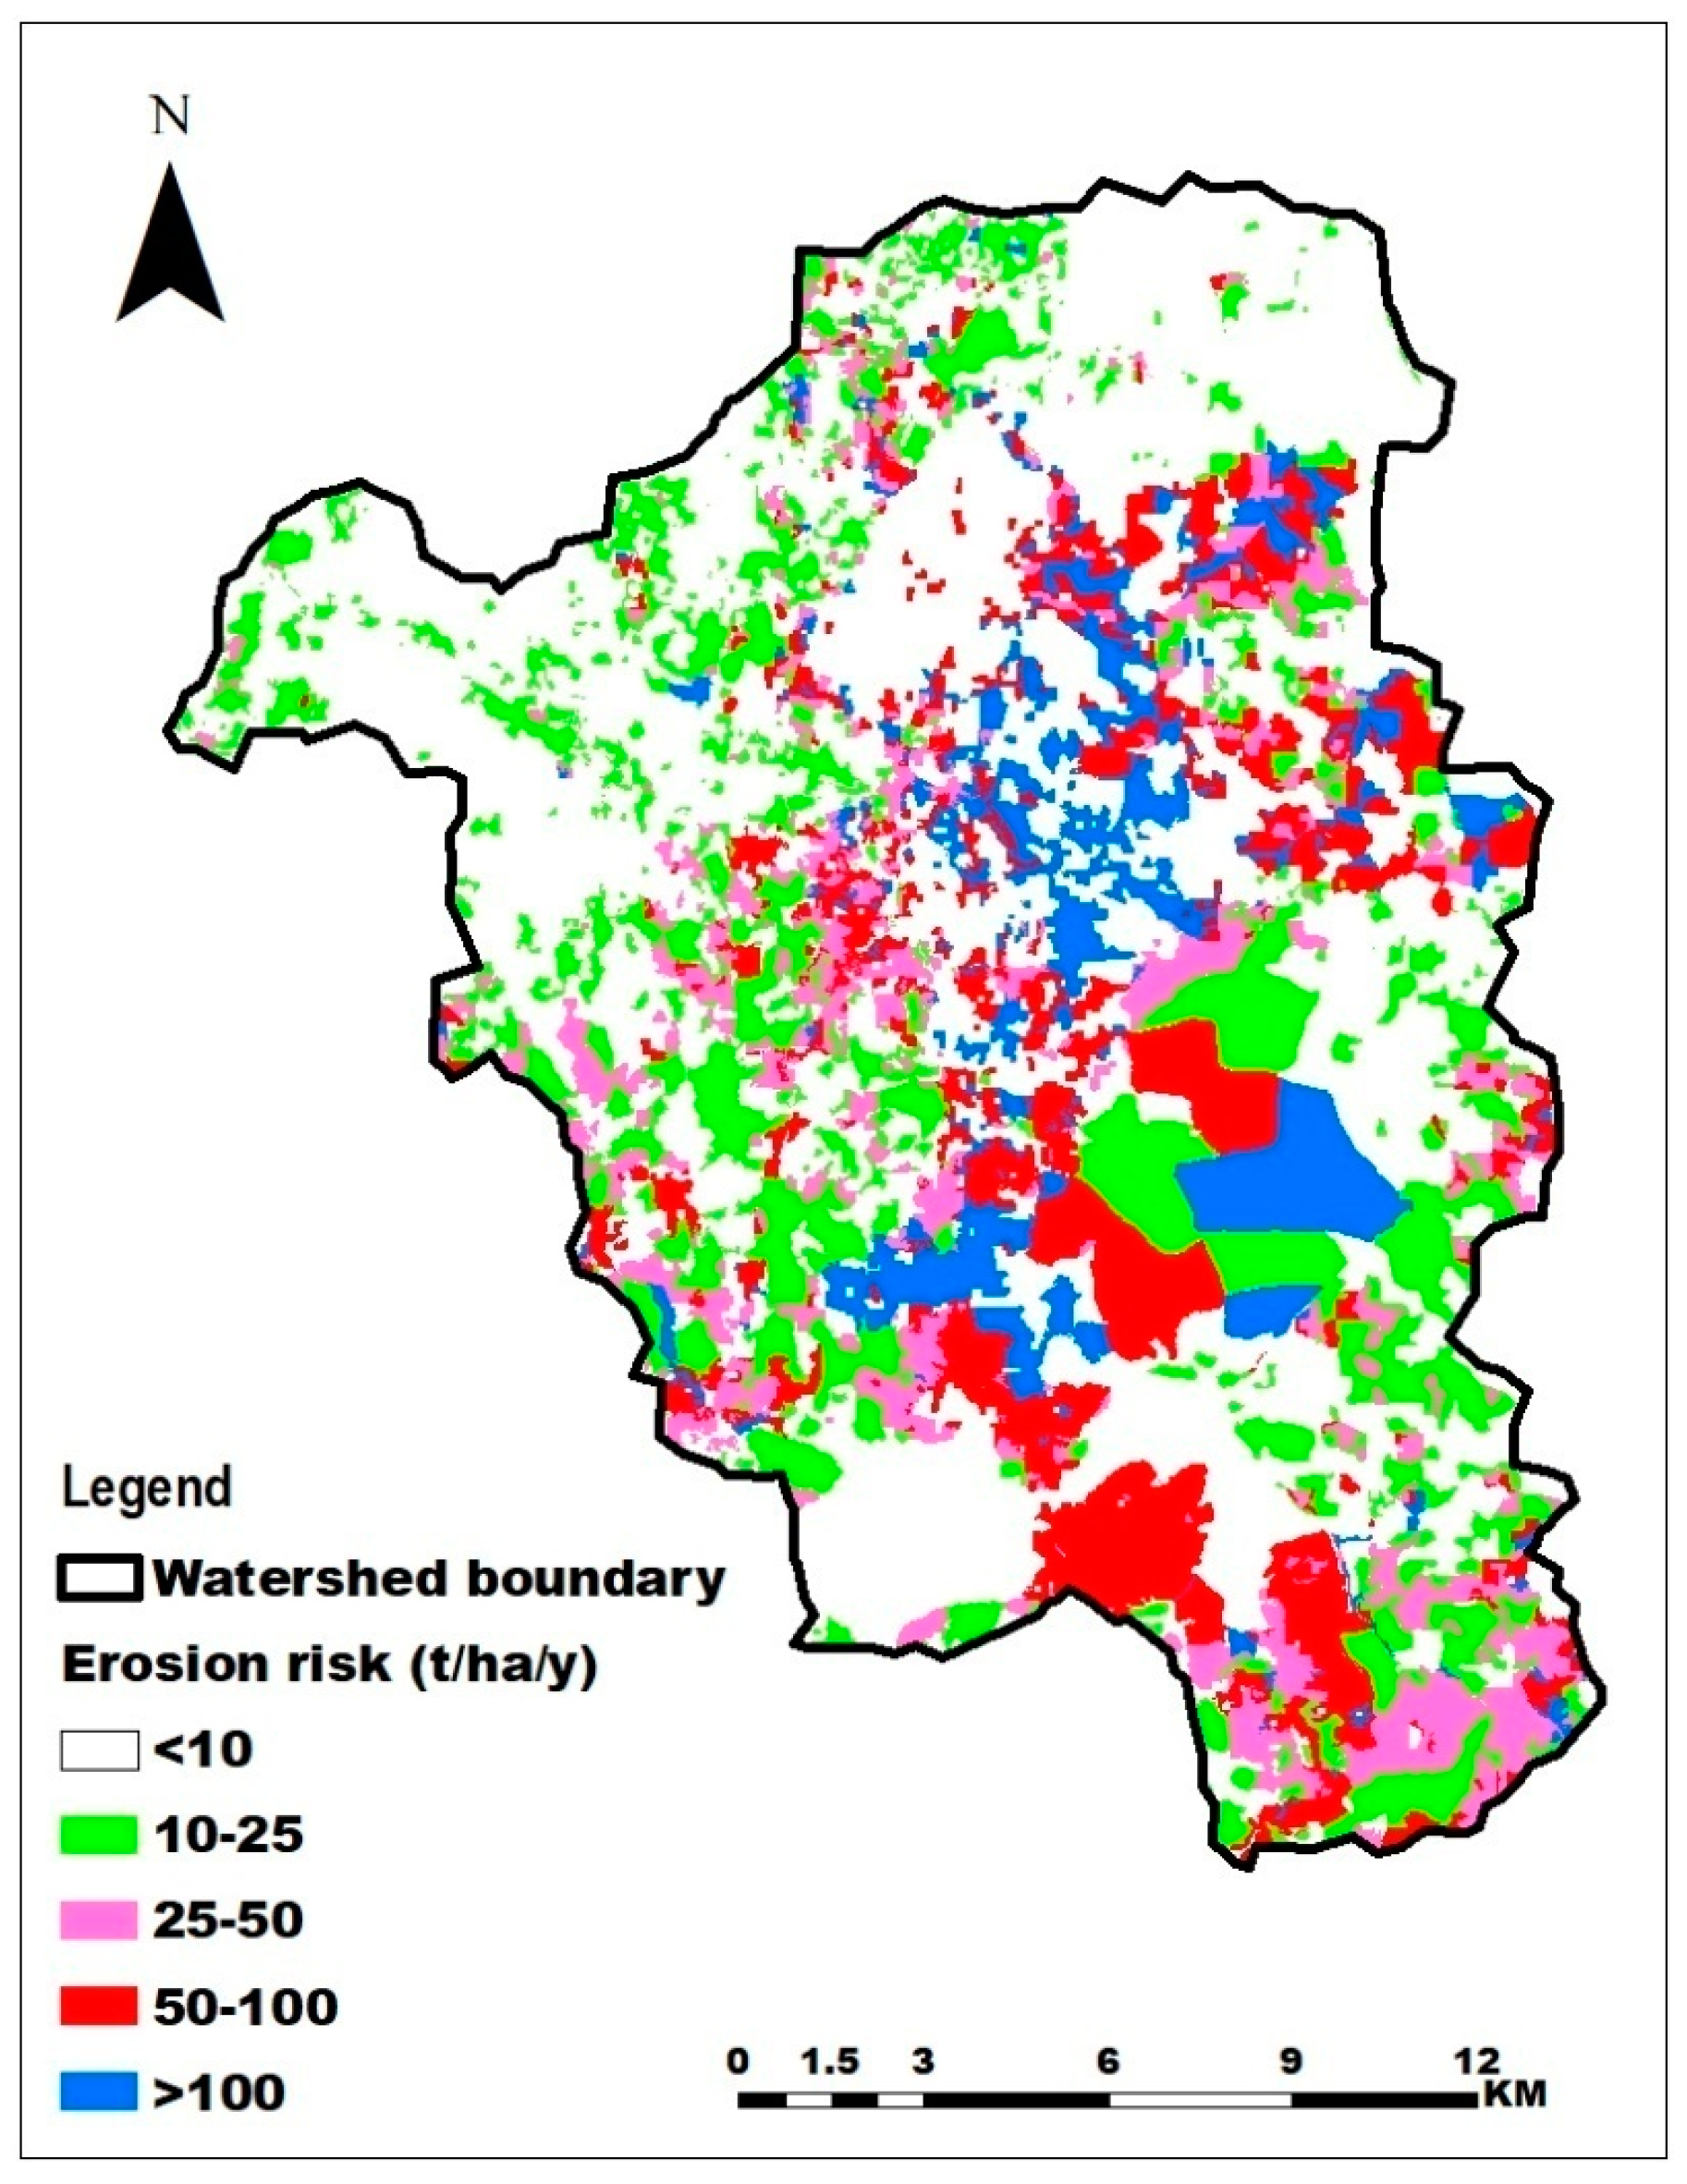
3.3. Estimating the Actual Soil Erosion Rates in the Sebeya Watershed
3.4. Soil Nutrients Depletion Due to Water Erosion in the Sebeya Watershed
3.5. Sediments and Nutrients Dynamics in the Sebeya Watershed
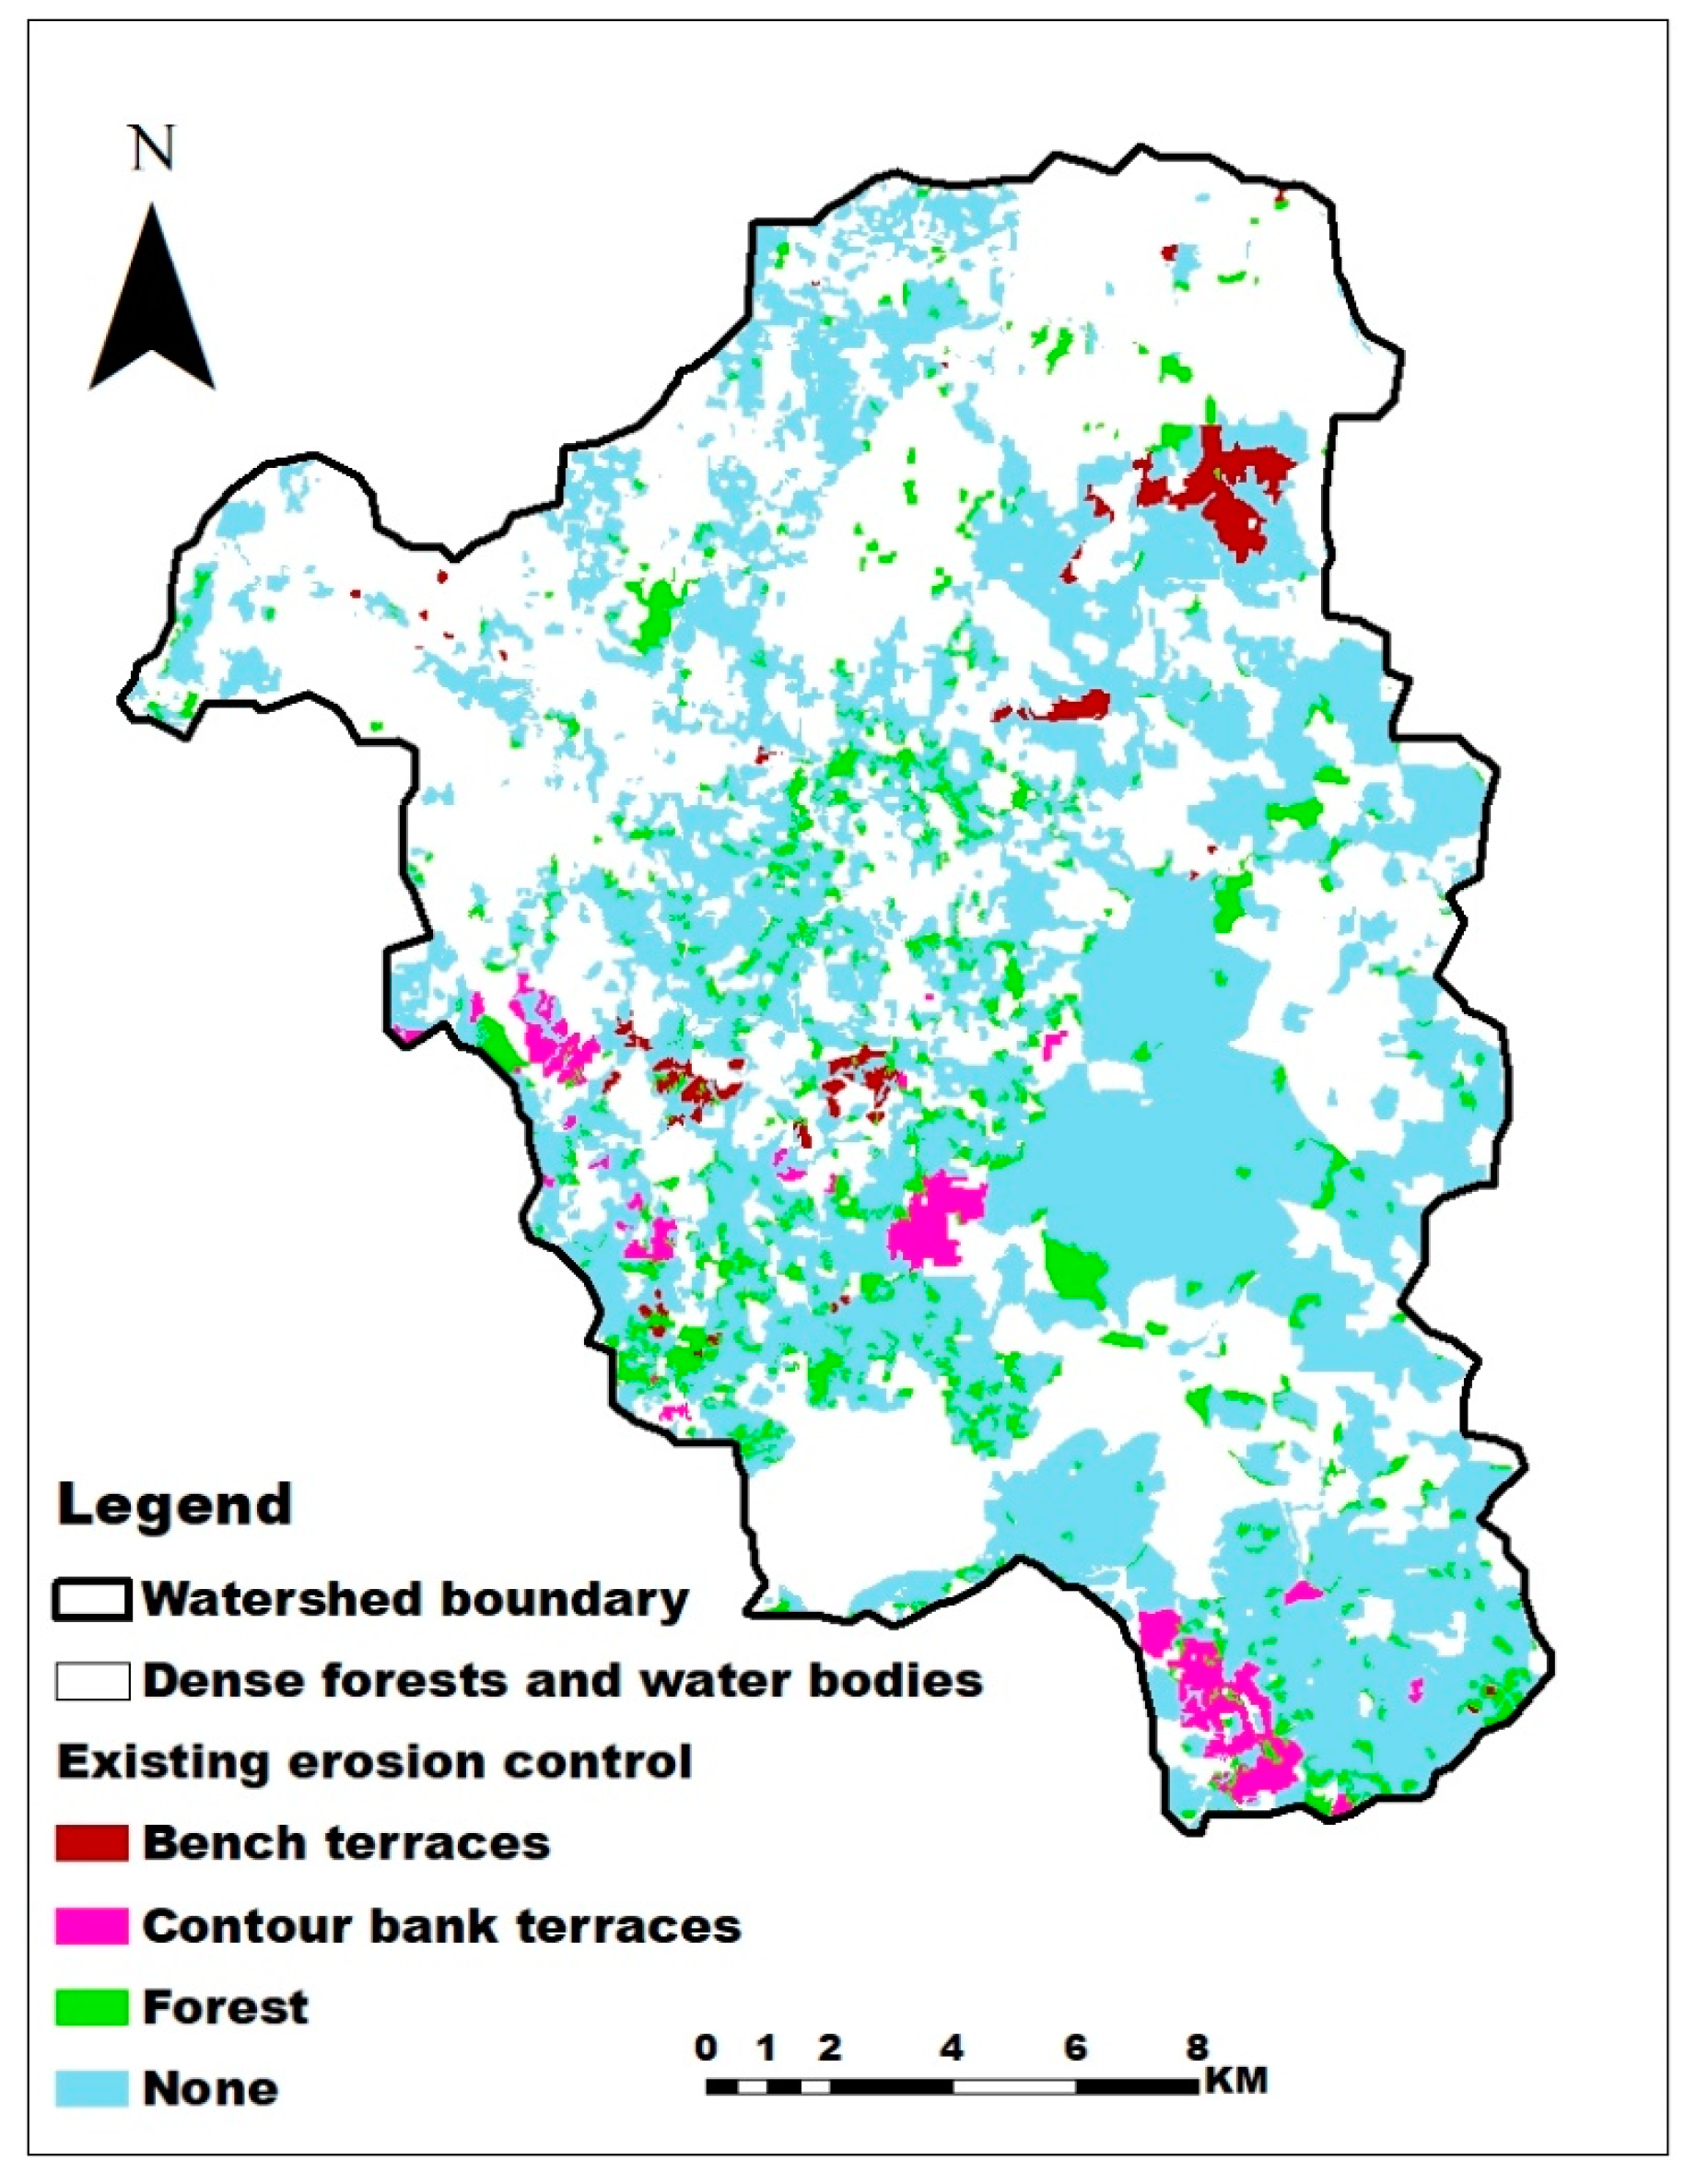
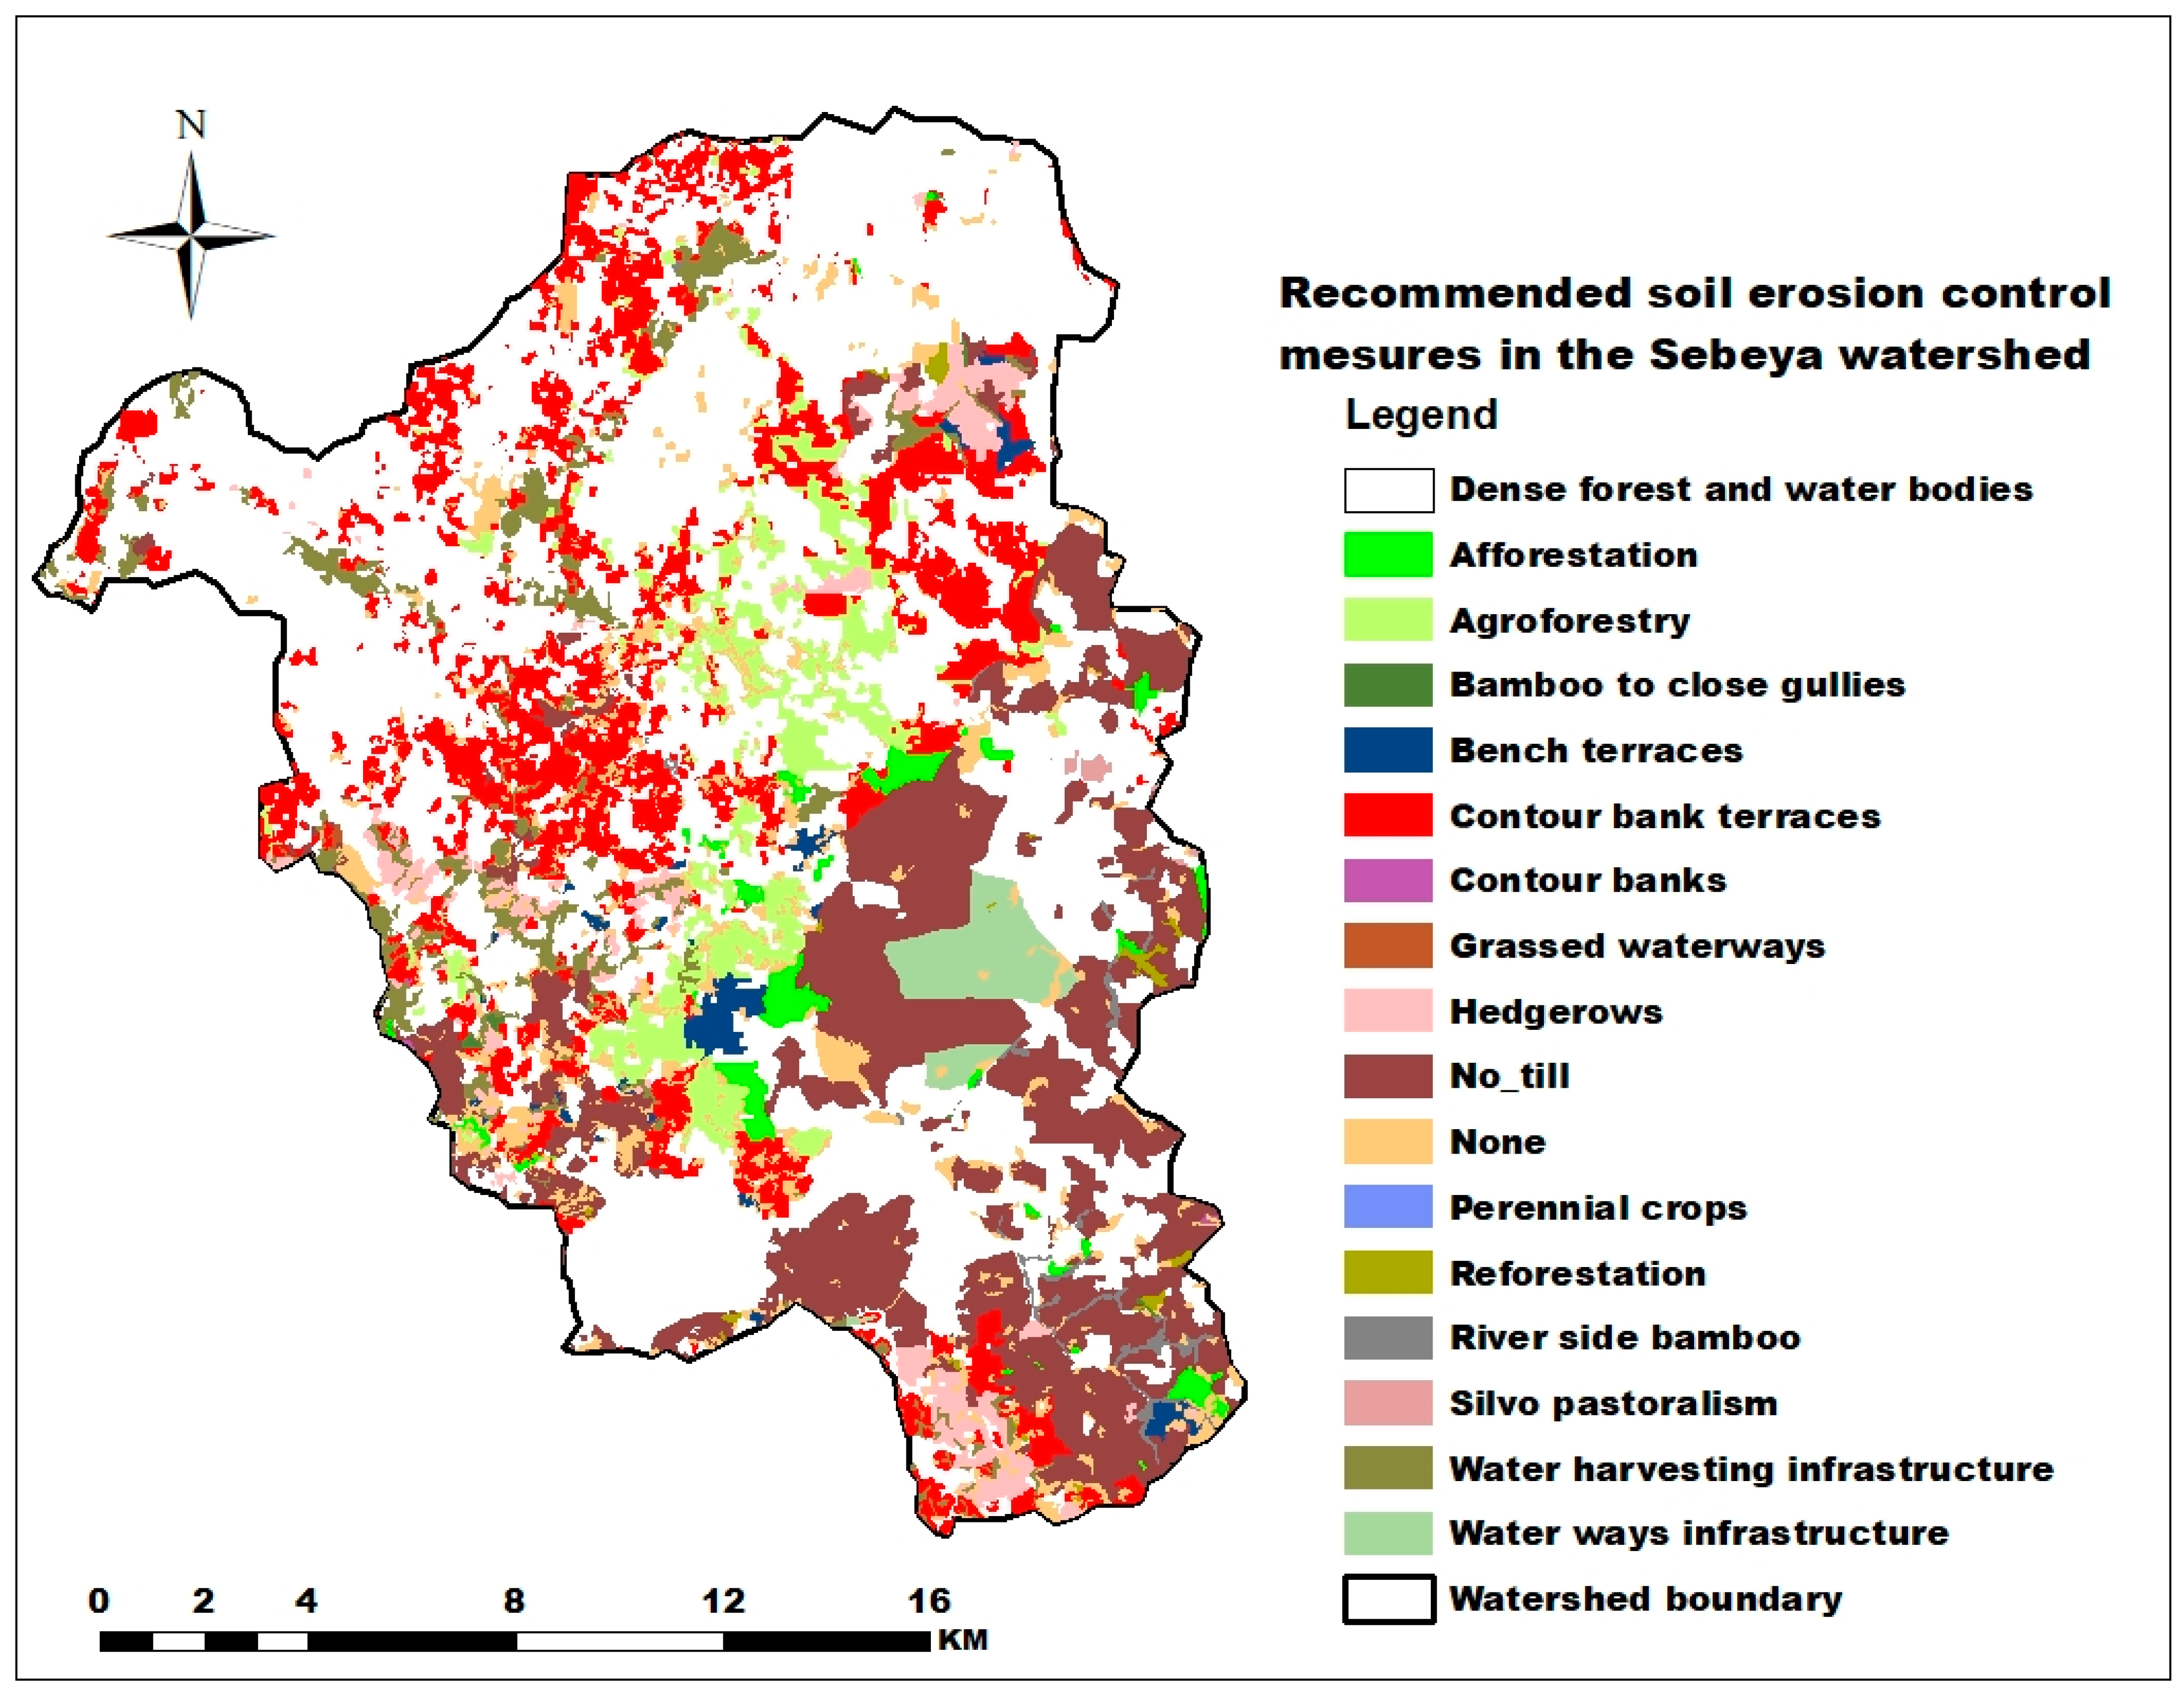
3.6. Site-Based Recommended Soil Erosion Control Measures and Associated Soil Loss Rates in the Sebeya Watershed
3.7. Implications of Soil Erosion Control Measures on Crop Productivity in the Sebeya Watershed
4. Discussion
4.1. Erosion Process and Its Damages in the Sebeya Watershed
4.2. Implications of LULC Changes on Water Erosion within the Sebeya Watershed
4.3. Future Work
5. Conclusions and Recommendations
Author Contributions
Funding
Institutional Review Board Statement
Informed Consent Statement
Data Availability Statement
Acknowledgments
Conflicts of Interest
References
- Igwe, P.U.; Nwezi, C.C.; Echendu, J.E.; Chukwunyere, I.C.; Okonkwo, N.J. Adaptations to Soil Erosion: A Review. Int. J. Adv. Eng. Manag. Sci. 2017, 1, 1126–1134. [Google Scholar]
- Pimentel, D.; Michael, B. Soil erosion threatens food production. Agriculture 2013, 3, 443–463. [Google Scholar] [CrossRef] [Green Version]
- Sarathi, S.; Padmini, B. Estimation of soil erosion using RUSLE and GIS techniques: A case study of Barakar river basin, Jharkhand, India. Model. Earth Syst. Environ. 2015, 1, 42. [Google Scholar]
- Sanogo, K.; Birhanu, B.Z.; Kizito, F. Vulnerability of Landscape Patterns from a Multidisciplinary Approach Based on Remote Sensing and GIS in Two Agroecologies of Mali; International Institute of Tropical Agriculture: Ibadan, Nigeria, 2021; pp. 1–12. [Google Scholar]
- Telkar, S.G.; Shivendu, P.S.; Kumar, J.D.; Kant, K. Soil Erosion: Types and Their Mechanism. Int. J. Econ. Plants 2015, 2, 178–180. [Google Scholar]
- Farayi, D. Spatial Soil Erosion Hazard Assessment and Modelling in Mbire District, Zimbabwe; University of Zimbabwe: Mbire, Zimbabwe, 2011. [Google Scholar]
- Sharma, A.; Tiwari, K.N.; Bhadoria, P.B. Effect of land use land cover change on soil erosion potential in an agricultural watershed. Environ. Monit. Assess. 2011, 173, 789–801. [Google Scholar] [CrossRef] [PubMed]
- Kalambukattu, G.J.; Kumar, S. Modelling soil erosion risk in a mountainous watershed of Mid-Himalaya by integrating RUSLE model with GIS. Euresian J. Sci. 2017, 6, 92–105. [Google Scholar] [CrossRef] [Green Version]
- Bashagaluke, J.B.; Logal, V.; Opoku, A.; Sarkodie-Addo, J.; Quansah, C. Soil nutrient loss through erosion: Impact of different cropping systems and soil amendments in Ghana. PLoS ONE 2018, 13, e0208250. [Google Scholar] [CrossRef] [PubMed] [Green Version]
- Huffman, R.; Fangmeier, D.; Elliot, W.; Workman, S.A. Soil and Water Conservation Engineering; American Society of Agricultural and Biological Engineers: St. Joseph, MI, USA, 2011. [Google Scholar]
- NISR. Rwanda Natural Capital Accounts—Ecosystems; National Institue of Statistics of Rwanda: Kigali, Rwanda, 2019. [Google Scholar]
- IWRM. Sebeya Catchment Plan 2018–2024; Integrated Water Resources Management Department: Kigali, Rwanda, 2018. [Google Scholar]
- Munyaneza, O.; Majoro, F.; Mutake, S.; Hagenimana, E. Performance Evaluation of Sediment Basins: Case Study of Keya Hydropower Plant in Rwanda. J. Water Resour. Prot. 2015, 7, 1387–1398. [Google Scholar] [CrossRef] [Green Version]
- Alewell, A.; Borrelli, P.; Meusburger, K.; Panagos, P. Using the USLE: Chances, challenges and limitations of soil erosion modelling. Int. Soil Water Conserv. Res. 2019, 7, 203–225. [Google Scholar] [CrossRef]
- Devatha, C.P.; Deshpandeb, V.; Renukaprasad, M.S. Estimation of soil loss using USLE model for Kulhan watershed, Chattisgarh—A case study. Aquat. Procedia 2015, 4, 1429–1436. [Google Scholar] [CrossRef]
- Panagopoulos, T.; Cakula, A.; Ferreira, V.A. Simulation model for predicting soil erosion in a large reservoir of Southern Portugal. Int. J. Sustain. Agric. Manag. Inform. 2015, 1, 3–25. [Google Scholar] [CrossRef]
- Muvundja, A.F.; Pasche, N.; Bugenyi, W.B.F.; Isumbisho, M.; Müller, B.; Namugize, J.P.; Rinta, P.; Schmid, M.; Stierli, R.; Wüest, A. Balancing nutrient inputs to Lake Kivu. J. Great Lakes Res. 2009, 35, 406–418. [Google Scholar]
- Guo, X.; Zhou, L.; Chen, Y.; Zhao, M.; Wang, R. Perception and adaption of ecological change for farmers in the typical desertification area: A case of Hangjin Banner in the Inner Mongolia autonomous region. J. Arid Land Resour. Environ. 2017, 31, 64–69. [Google Scholar]
- BirdLife International. Sediment Fingerprinting in Sebeya Catchment; Rwanda Water and Forestry Authority: Kigali, Rwanda, 2018. [Google Scholar]
- NISR. Demographic and Health Survey; National Institute of Statistics in Rwanda: Kigali, Rwanda, 2014. [Google Scholar]
- NISR. Seasonal Agricultural Survey 2017; National Institute of Statistics of Rwanda: Kigali, Rwanda, 2017. [Google Scholar]
- Yang, C.; Rottensteiner, F.; Heipke, C. Classification of land cover and land use based on convolutional neural networks. ISPRS Ann. Photogramm. Remote Sens. Spat. Inf. Sci. 2018, 4, 251–258. [Google Scholar] [CrossRef] [Green Version]
- MoE. Mapping of Erosion in Rwanda and Guidelines for Erosion Control; Ministry of Environment: Kigali, Rwanda, 2018. [Google Scholar]
- Sultana, S.; Satyanarayana, A.N. Urban heat island intensity during winter over metropolitan cities of India using remote-sensing techniques: Impact of urbanization. Int. J. Remote Sens. 2018, 39, 6692–6730. [Google Scholar] [CrossRef]
- MoE. Soil Erosion Control Mapping Report; Ministry of Environment: Kigali, Rwanda, 2020. [Google Scholar]
- Parveen, R.; Kumar, U. Integrated Approach of Universal Soil Loss Equation (USLE) and Geographical Information System (GIS) for Soil Loss Risk Assessment in Upper South Koel Basin, Jharkhand. J. Geogr. Inf. Syst. 2012, 4, 588–596. [Google Scholar] [CrossRef] [Green Version]
- Hassan, K.F. Application of rainfall intensity-kinetic energy relationship for soil loss prediction. Mesoptamia J. Agric. 2011, 39, 40–51. [Google Scholar] [CrossRef] [Green Version]
- Khare, M.D.; Mondal, A.; Kundu, S.; Kumar, P. Climate change impact on soil erosion in the Mandakini River Basin, North India. Appl. Water Sci. 2017, 7, 2373–2383. [Google Scholar] [CrossRef] [Green Version]
- Benavidez, R.; Jackson, B.; Maxwell, D.; Norton, K. A review of the Revised Universal Soil Loss Equation (RUSLE): With a view to increasing its global applicability and improving soil loss estimates. Hydrol. Earth Syst. Sci 2018, 22, 6059–6086. [Google Scholar] [CrossRef] [Green Version]
- Zisu, I.; Nasui, D. Using the Universal Soil Loss Equation for soil erosion assessment in agricultural land from Rugoj hills. Geogr. Timisiensis 2015, 24, 13–23. [Google Scholar]
- Oruk, E.; Eric, J.N.; Ogogo, A. Influence of soil textural properties and land use cover type on soil erosion of a characteristic ultisols in Betem, Cross River State, Nigeria. J. Sustain. Dev. 2012, 5, 104–110. [Google Scholar] [CrossRef]
- Chaudhary, S.; Kumar, S. Soil erosion estimation and prioritization of Koshalya Jhajhara watershed in North India. Indian J. Soil Conserv. 2018, 46, 305–311. [Google Scholar]
- Ausseil, A.E.; Dymond, J.R. Evaluating ecosystem services of afforestation on erosion-prone land: A case study in the Manawatu Catchment, New Zealand. In Proceedings of the International Congress on Environmental Modelling and Software, 5th Bienni Meeting (July 2010), Ottawa, ON, Canada, 5–8 July 2010; pp. 1–10. [Google Scholar]
- Ganasri, B.P.; Ramesh, H. Assessment of soil erosion by RUSLE model using remote sensing and GIS -A case study of Nethravathi Basin. Geosci. Front. 2016, 7, 953–961. [Google Scholar] [CrossRef] [Green Version]
- Hrabalíková, M.; Janeček, M. Comparison of different approaches to LS factor calculations based on a measured soil loss under simulated rainfall. Soil Water Res. 2017, 12, 66–77. [Google Scholar] [CrossRef] [Green Version]
- Kumar, S.; Kushwara, S.P. Modelling soil erosion risk based on RUSLE-3D using GIS in a Shivalik sub-watershed. J. Earth Syst. Sci. 2013, 122, 389–398. [Google Scholar] [CrossRef] [Green Version]
- Lu, J.; Svendsen, E.S.; Campbell, L.K.; Greenfeld, J.; Braden, J.; King, K.L.; Falxa-Raymond, N. Biological, Social, and Urban Design Factors Affecting Young Street Tree Mortality in New York City. Cities Environ. 2010, 3, 1–15. [Google Scholar] [CrossRef]
- Tegegne, M.; Biniam, S. Estimating Soil Erosion Risk and Evaluating Erosion Control Measures for Soil Conservation Planning at Koga Watershed, Highlands of Ethiopia. Solid Earth 2017, 8, 13–25. [Google Scholar]
- Panagos, P.; Borrelli, P.; Meusburger, K.; Alewell, C.; Lugato, E.; Montanarella, L. Estimating the soil erosion cover-management factor at the European scale. Land Use Policy 2015, 48, 38–50. [Google Scholar] [CrossRef]
- Adormado, H.A.; Appolineres, H.A.; Yoshida, M. Erosion vulnerability assessment in Reina, Quezon Province, Philippines with raster-based tool built within GIS environment. Agric. Inf. Res. 2019, 18, 24–31. [Google Scholar]
- Bagarella, G.; Lazzarin, R.; Noro, M. On the activation strategy of the chiller in water-loop self-contained refrigeration system: An experimental analysis. Int. J. Refrig. 2015, 57, 94–102. [Google Scholar] [CrossRef]
- Panagos, P.; Borrelli, P.; Poesen, J.; Ballabio, C.; Lugato, E.; Meusburger, K.; Alewell, C. The new assessment of soil loss by water erosion in Europe. Environ. Sci. Policy 2015, 54, 438–447. [Google Scholar] [CrossRef]
- Sanchez-Bernal, E.; Ortega-Baranda, V.; Domonguez-Hernandez, F.; Ortega-Escobar, M.; Can-Chulim, A.; Sarmiento-Bustos, D. Soil erosion control using agroforestry terraces in San Pedro Mixtepec, Oaxaca, Mexico. Int. J. Agriscience 2013, 3, 423–439. [Google Scholar]
- Endalamaw, N.T.; Moges, M.A.; Kebebe, S.Y.; Alehegn, B.M.; Sinshaw, B.G. Potential soil loss estimation for conservation plannining, upper Blue Nile basin, Ethiopia. Environ. Chall. 2021, 5, 100224. [Google Scholar] [CrossRef]
- Tardio, G.; Mockoviski, S.B.; Rauch, H.P.; Fernandes, J.P.; Acharya, M.S. The use of bamboo for erosion control and slope stabilization: Soil bioengineering works. In Bamboo: Current and Future Prospects; Books on Demand: Paris, France, 2018; pp. 106–132. [Google Scholar]
- Kuok, K.K.; Darrien, Y.S.; Chiu, P.C. Evaluation of C and P factors in universal soil loss equation on trapping sediment: Case study of Santubong river. J. Water Resour. Prot. 2013, 5, 1149–1154. [Google Scholar] [CrossRef] [Green Version]
- Shannon, D.R. Effect of Contour Bunds on Surface Runoff and Soil Erosion in the Bokole Watershed, Southwest Ethiopia; Utrecht University: New Delhi, India, 2017. [Google Scholar]
- Fiener, P.; Auerswald, K. Effectiveness of Grassed Waterways in Reducing Runoff and Sediment Delivery from Agricultural Watersheds. J. Environ. Qual. 2003, 32, 927–936. [Google Scholar] [CrossRef]
- Duguma, T.A. Soil erosion risk assessment and treatment priority classification: A case study on Guder Watersheds, Abay River Basin, Oromia, Ethiopia. Heliyon 2022, 8, e10183. [Google Scholar] [CrossRef]
- Chen, G.; Zhang, Z.; Guo, Q.; Wang, X.; Wen, Q. Quantitative Assessment of Soil Erosion Based on CSLE and the 2010 National Soil Erosion Survey at Regional Scale in Yunnan Province of China. Sustainability 2019, 11, 3252. [Google Scholar] [CrossRef] [Green Version]
- Gao, Z.; Xu, Q.; Si, Q.; Zhang, S.; Fu, Z.; Chen, H. Effects of Different Straw Mulch Rates on the Runoff and Sediment Yield of Young Citrus Orchards with Lime Soil and Red Soil under Simulated Rainfall Conditions in Southwest China. Water 2022, 14, 1119. [Google Scholar] [CrossRef]
- Obalum, S.E.; Buri, M.M.; Nwite, J.C.; Hermansah; Watanabe, Y.; Igwe, C.A.; Wakatsuki, T. Soil degradation-induced decline in productivity of Sub Saharan African soils: The prospects of looking downwards the low lands with the Sawah ecotechnology. Appl. Environ. Soil Sci. 2012, 2012, 673926. [Google Scholar] [CrossRef] [Green Version]
- NISR. Rwanda Statistical Yearbook; National Institute of Statistics of Rwanda: Kigali, Rwanda, 2009. [Google Scholar]
- Kinnel, P.I.A. Event soil loss, runoff and the Universal Soil Loss Equation family of models: A review. J. Hydrol. 2010, 385, 384–397. [Google Scholar] [CrossRef]
- IWRM. Feasibility Study and Detail Design of the Early Implementation Project on Sebeya Catchment; Integrated Water Resources Management: Kigali, Rwanda, 2016. [Google Scholar]
- Dibaba, W.K.; Demissie, T.A.; Miegel, K. Watershed Hydrological Response to Combined Land Use/Land Cover and Climate Change in Highland Ethiopia: Finchaa Catchment. Water 2020, 12, 1801. [Google Scholar] [CrossRef]
- Sisay, G.; Gitima, G.; Mersha, M.; Alemu, G.W. Assessment of land use land cover dynamics and its drivers in Bechet Watershed Upper Blue Nile Basin, Ethiopia. Remote Sens. Appl. Soc. Environ. 2021, 24, 100648. [Google Scholar] [CrossRef]
- Belaya, T.; Mengistua, D.A. Land use and land cover dynamics and drivers in the Muga watershed, Upper Blue Nile basin, Ethiopia. Remote Sens. Appl. Soc. Environ. 2019, 15, 100249. [Google Scholar] [CrossRef]
- RWB. Shapefiles on Soil Erosion Risks in Rwanda: Actual and Site-Based Recommended Soil Erosion Control Measures; Rwanda Water Resources Board: Kigali, Rwanda, 2018. [Google Scholar]
- Van Beek, C.L.; Elias, E.; Yihenew, G.S.; Heesmans, H.; Tsegaye, A.; Feyisa, H.; Tolla, M.; Melmuye, M.; Gebremeskel, Y.; Mengist, S. Soil nutrient balances under diverse agro-ecological settings in Ethiopia. Nutr. Cycl. Agroecosyst. 2016, 106, 257–274. [Google Scholar] [CrossRef] [Green Version]
- Niaz, A.; Sajjad, H.; Muhammad, A.A.; Minhas, A.; Waheed, W.; Danish, S.; Sahad, F.; Ghafoor, U.; Baiq, K.S.; Sultan, H.; et al. Correlation of Soil Characteristics and Citrus Leaf Nutrients Contents in Current Scenario of Layyah District. Horticulture 2022, 8, 61. [Google Scholar] [CrossRef]
- Suchithra, M.S.; Pai, L.M. Improving the prediction accuracy of soil nutrient classification by optimizing extreme learning machine parameters. Inf. Process. Agric. 2020, 7, 72–82. [Google Scholar] [CrossRef]
- Baptista, I.; Ritsema, C.; Geissen, V. Effect of Integrated Water-Nutrient Management Strategies on Soil Erosion Mediated Nutrient Loss and Crop Productivity in Cabo Verde Drylands. PLoS ONE 2015, 10, e0134244. [Google Scholar] [CrossRef] [PubMed] [Green Version]
- Kabirigi, M.; Mugambi, S.; Musana, S.B.; Ngoga, T.G.; Muhutu, J.C.; Rutebuka, J.; Ruganzu, V.M.; Nzeyimana, I.; Nabahungu, N.L. Estimation of soil erosion risk, its valuation and economic implications for agricultural productioni Western part of Rwanda. J. Exp. Biol. Agric. Sci. 2017, 5, 525–536. [Google Scholar] [CrossRef]
- MINAGRI. Annual Report 2020–2021; Ministry of Agriculture and Animal Resource: Kigali, Rwanda, 2021. [Google Scholar]
- Karamage, F.; Zhang, C.; Ndayisaba, F.; Shao, H.; Kayiranga, A.; Fang, X.; Nahayo, L.; Nyesheyija, M.E.; Tian, G. Extent of Cropland and Related Soil Erosion Risk in Rwanda. Sustainability 2016, 8, 609. [Google Scholar] [CrossRef] [Green Version]
- Mupenzi, J.P.; Li, L.; Ge, J.; Habumugisha, J.D.; Habiyaremye, G.; Ngamije, J.; Baragahoranye, I. Radical Terraces in Rwanda. East Afr. J. Sci. Technol. 2012, 1, 53–58. [Google Scholar]
- Narendar, K.M.; Gautam, R.; Tiwari, P.; Sharma, P. Nutrient losses in soil due to erosion. J. Pharmacogn. Phytochem. 2017, 6, 1009–1011. [Google Scholar]
- Bagalwa, M.J. Sediment and Nutrient Loading into Lake Kivu: A Case Study Lwiro Micro-Catchment, Democratic Republic of Congo; Integrated Watershed Management of Makerere University: Kampala, Uganda, 2015. [Google Scholar]
- Onu, F.M.; Mohammed, A. Competency improvement needs of farmers in soil erosion prevention and control for enhancing crop production: Case study of Kogi State, Nigeria. Agric. Sci. 2014, 5, 958–963. [Google Scholar] [CrossRef]
- NISR. Seasonal Agricultural Survey 2015; National Institute of Statistics of Rwanda: Kigali, Rwanda, 2015. [Google Scholar]
- Bidogeza, J.; Berentsena, P.B.; De Graaff, J.; Oude Lansinka, A.G. Multivariate typology of farm households based on socioeconomic characteristics explaining adoption of new technology in Rwanda. In Proceedings of the AAAE 2007 Second International Conference, Accra, Ghana, 20–22 August 2007; pp. 175–181. [Google Scholar]
- Chen, S.H.; Su, H.B.; Tian, J.; Zhang, R.H.; Xia, J. Estimating soil erosion using MODIS and T.M. images based on support vector machine and à trous wavelet. Int. J. Appl. Earth Obs. Geoinf. 2011, 13, 626–635. [Google Scholar]
- Xungui, L.; Xia, W. Analysis of the Relationship between Soil Erosion Risk and Surplus Floodwater during Flood Season. J. Hydrol. Eng. 2014, 19, 1294–1311. [Google Scholar]
- Nenadović, S.; Kljajević, L.; Nenadović, M.; Milanović, M.; Marković, S. Physico-chemical soil analysis of Rudovci region. Geonauka 2013, 1, 1–8. [Google Scholar] [CrossRef]
- Leta, A.; Megersa, T. Factors Influencing Soil Erosion Management Practices in Ejersa Lafo District, West Showa Zone, Oromia, Regional State, Ethiopia. J. Appl. Sci. Environ. Manag. 2021, 25, 79–85. [Google Scholar] [CrossRef]
- IWRM. Catchment Plan Sebeya 2017–2023; Integrated Water Resources Management: Kigali, Rwanda, 2017. [Google Scholar]
- Ding, L.; Chen, K.; Cheng, C.; Wang, X. Water ecological carrying capacity of urban lakes in the context of rapid urbanization: A case study of East Lake in Wuhan. Phys. Chem. Earth 2015, 89, 104–113. [Google Scholar] [CrossRef]
- Balasubramanian, A. Soil Erosion—Causes and Effects; University of Mysore: Mysore, India, 2017. [Google Scholar]
- Dahal, G.; Holcomb, J.; Socci, D. Surfactant-Oxidant Co-Application for Soil and Groundwater Remediation. Remediation 2016, 26, 101–108. [Google Scholar] [CrossRef]
- Sakinatu, I.; Muhammad, A.A. Impact of soil erosion and degradation on water. Geol. Ecol. Landsc. 2017, 1, 1–11. [Google Scholar] [CrossRef] [Green Version]
- Debebbe, W.; Melaku, K.M. Farmers’ perceptions and participation on Mechanical soil and water conservation techniques in Kembata Tembaro Zone: The Case of Kachabirra Woreda, Ethiopia. Int. J. Adv. Struct. Geotech. Eng. 2013, 2, 118–131. [Google Scholar]
- Twisa, S.; Buchroithner, F.M. Land-Use and Land-Cover (LULC) Change Detection in Wami River Basin, Tanzania. Land 2019, 8, 136. [Google Scholar] [CrossRef] [Green Version]
- Rawat, J.; Kumar, M. Monitoring land use/cover change using remote sensing and GIS techniques: A case study of Hawalbagh block, district Almora, Uttarakhand, India. Egypt. J. Remote Sens. Space Sci. 2015, 18, 77–84. [Google Scholar] [CrossRef] [Green Version]
- Hegazy, I.R.; Kaloop, R.M. Monitoring urban growth and land use change detection with GIS and remote sensing techniques in Daqahlia governorate Egypt. Int. J. Sustain. Built Environ. 2015, 4, 117–124. [Google Scholar] [CrossRef] [Green Version]
- Tewkesbury, P.A.; Comber, J.A.; Tate, J.N.; Lamb, A.; Fisher, F.P. Critical synthesis of remotely sensed optical image change detection techniques. Remote Sens. Environ. 2015, 160, 1–14. [Google Scholar] [CrossRef] [Green Version]
- Bossio, D.; Geheb, K.; Critchley, W. Managing water by managing land: Addressing land degradation to improve water productivity and rural livelihoods. Agric. Water Manag. 2010, 97, 536–542. [Google Scholar] [CrossRef]
- MIDMAR. Disaster High Risk Zones on Floods and Landslides; Ministry of Disasters Management and Refugees Affairs: Kigali, Rwanda, 2012. [Google Scholar]
- Majoro, F.; Wali, U.G. Analyzing Various Factors Affecting Farmers’ Willingness to Adopt Soil Erosion Control Measures in the Sebeya Catchment. Sustainability 2022, 14, 12895. [Google Scholar] [CrossRef]


| Soil loss (t/ha/y) | <5 | 5–10 | 10–25 | 25–50 | 50–100 | >100 |
| Risk severity | very low | low | moderate | high | very high | extremely high |
| Soil Type | K | References |
|---|---|---|
| Silty loam soil | 0.05 | [30] |
| Loamy soil | 0.30 | [31] |
| Clay | 0.22 | [31] |
| Sand clay loam | 0.20 | [31] |
| Clay loam | 0.31 | [31] |
| Sandy loam soil | 0.23 | [32] |
| Sand | 0.05 | [33] |
| Silt | 0.35 | [34] |
| S.N. | LULC | C | References | P | References |
|---|---|---|---|---|---|
| 1 | Built-up | 0.200 | [15] | 0.500 | [36] |
| 2 | Closed agriculture | 0.340 | [15] | 0.001 | [37] |
| 3 | Forest plantation | 0.020 | [36] | 0.300 | [36] |
| 4 | Irrigation | 0.340 | [15] | 0.500 | [36] |
| 5 | Natural forest | 0.008 | [36] | 0.001 | [37] |
| 6 | Open agriculture | 0.340 | [15] | 0.020 | [38] |
| 7 | Open land | 0.340 | [15] | 0.500 | [36] |
| SN | Recommended SECM | C | References | P | References |
|---|---|---|---|---|---|
| 1 | Afforestation | 0.02 | [36] | 0.001 | [41] |
| 2 | Agroforestry | 0.08 | [42] | 0.500 | [43] |
| 3 | Bamboo to close gullies | 0.01 | [44] | 0.500 | [45] |
| 4 | Bench terraces | 0.15 | [44] | 0.128 | [46] |
| 5 | Contour bank terraces | 0.15 | [44] | 0.150 | [46] |
| 6 | Contour banks | 0.50 | [47] | 0.600 | [46] |
| 7 | Grassed waterways | 0.20 | [44] | 0.100 | [48] |
| 8 | Hedgerows | 0.20 | [44] | 0.000 | (*) |
| 9 | No-till | 0.25 | [42] | 0.100 | [48] |
| 10 | Perennial crops | 0.23 | [42] | 0.800 | [49] |
| 11 | Reforestation | 0.02 | [36] | 0.001 | [41] |
| 12 | River side bamboo | 0.01 | [44] | 0.500 | [45] |
| 13 | Silvopastoralism | 0.09 | [42] | 0.000 | (*) |
| 14 | Rainwater harvesting tanks | 0.00 | (*) | 0.800 | [50] |
| 15 | Drainage channels | 0.58 | [51] | 0.800 | [50] |
| 16 | Dense forest and water bodies | 0.00 | (*) | 0.000 | (*) |
| Crops | y2 = Lowest Yield (t/ha) | y1 = Highest Yield (t/ha) |
|---|---|---|
| Maize | 0.776 | 2.154 |
| Irish potatoes | 4.000 | 15.000 |
| Beans | 0.700 | 1.000 |
| Soybeans | 0.575 | 0.875 |
| Wheat | 0.437 | 2.154 |
| Peas | 0.367 | 1.438 |
| Groundnut | 0.260 | 1.495 |
| Sweet Potatoes | 3.856 | 13.246 |
| Banana | 3.500 | 11.038 |
| SN | LULC Type | Covered Area in 2008 | Covered Area in 2015 | ||
|---|---|---|---|---|---|
| (km2) | (%) | (km2) | (%) | ||
| 1 | Built-up | 6.96 | 1.92 | 10.97 | 3.02 |
| 2 | Closed agriculture | 4.97 | 1.37 | 107.31 | 29.51 |
| 3 | Forest plantation | 34.91 | 9.61 | 33.75 | 9.28 |
| 4 | Irrigation | 5.52 | 1.52 | 16.30 | 4.48 |
| 5 | Natural forest | 4.16 | 1.14 | 6.01 | 1.65 |
| 6 | Open agriculture | 224.40 | 61.75 | 37.71 | 10.37 |
| 7 | Open land | 82.45 | 22.69 | 151.63 | 41.69 |
| Total | 363.38 | 100.00 | 363.38 | 100.00 | |
| SN | LULC Type | Covered Area in 2018 | Covered Area in 2022 | ||
|---|---|---|---|---|---|
| (km2) | (%) | (km2) | (%) | ||
| 1 | Built-up | 11.38 | 3.13 | 39.64 | 10.90 |
| 2 | Closed agriculture | 0.05 | 0.01 | 22.51 | 6.19 |
| 3 | Forest plantation | 55.57 | 15.28 | 35.54 | 9.77 |
| 4 | Irrigation | 7.96 | 2.19 | 16.62 | 4.57 |
| 5 | Natural forest | 13.58 | 3.74 | 11.67 | 3.21 |
| 6 | Open agriculture | 185.63 | 51.04 | 147.38 | 40.52 |
| 7 | Open land | 89.50 | 24.61 | 90.32 | 24.84 |
| Total | 363.38 | 100.00 | 363.38 | 100.00 | |
| (a) Erosion rates induced by the land use/land cover in 2008 | |||||||||
| S.N. | LULC type | K | R | LS | C | P | Soil loss Ai (t/ha/y) | Covered area ai (ha) | Weighted (Ai × ai) |
| 1 | Built-up | 0.405 | 582.34 | 5.73 | 0.200 | 0.500 | 135.141 | 696 | 94,057.95 |
| 2 | Closed agriculture | 0.405 | 582.34 | 5.73 | 0.340 | 0.001 | 0.459 | 497 | 228.36 |
| 3 | Forest plantation | 0.405 | 582.34 | 5.73 | 0.020 | 0.300 | 8.108 | 3491 | 28,306.58 |
| 4 | Irrigation | 0.405 | 582.34 | 5.73 | 0.340 | 0.500 | 229.739 | 552 | 126,816.10 |
| 5 | Natural forest | 0.405 | 582.34 | 5.73 | 0.008 | 0.001 | 0.011 | 416 | 4.50 |
| 6 | Open agriculture | 0.405 | 582.34 | 5.73 | 0.340 | 0.020 | 9.190 | 22,440 | 206,213.90 |
| 7 | Open land | 0.405 | 582.34 | 5.73 | 0.340 | 0.500 | 229.739 | 8245 | 1,894,200.00 |
| Total | 36,337 | 2,349,827 | |||||||
| Average soil loss is 2,349,827/36,337 = 65 t/ha/y | |||||||||
| (b) Erosion rates induced by the land use/land cover in 2015 | |||||||||
| S.N. | LULC type | K | R | LS | C | P | Soil loss Ai(t/ha/y) | Covered area ai (ha) | Weighted (Ai × ai) |
| 1 | Built-up | 0.405 | 582.34 | 5.73 | 0.2 | 0.5 | 135.1407 | 1097 | 148,203.90 |
| 2 | Closed agriculture | 0.405 | 582.34 | 5.73 | 0.34 | 0.001 | 0.459478 | 10,731 | 4930.81 |
| 3 | Forest plantation | 0.405 | 582.34 | 5.73 | 0.02 | 0.3 | 8.108444 | 3375 | 27,365.38 |
| 4 | Irrigation | 0.405 | 582.34 | 5.73 | 0.34 | 0.5 | 229.7392 | 1630 | 374,369.20 |
| 5 | Natural forest | 0.405 | 582.34 | 5.73 | 0.008 | 0.001 | 0.010811 | 601 | 6.49 |
| 6 | Open agriculture | 0.405 | 582.34 | 5.73 | 0.34 | 0.02 | 9.18957 | 3771 | 34,658.22 |
| 7 | Open land | 0.405 | 582.34 | 5.73 | 0.34 | 0.5 | 229.7392 | 15,163 | 3,483,612.00 |
| Total | 36,368 | 4,073,146 | |||||||
| Average soil loss is 4,073,146/36,368 = 112 t/ha/y | |||||||||
| (c) Erosion rates induced by the land use/land cover in 2018 | |||||||||
| S.N. | LULC type | K | R | LS | C | P | Soil loss Ai (t/ha/y) | Covered area ai (ha) | Weighted (Ai × ai) |
| 1 | Built-up | 0.405 | 582.34 | 5.73 | 0.200 | 0.500 | 135.141 | 1991 | 269,084.10 |
| 2 | Closed agriculture | 0.405 | 582.34 | 5.73 | 0.340 | 0.001 | 0.459 | 8003 | 3673.51 |
| 3 | Forest plantation | 0.405 | 582.34 | 5.73 | 0.020 | 0.300 | 8.108 | 5203 | 42,187.51 |
| 4 | Irrigation | 0.405 | 582.34 | 5.73 | 0.340 | 0.500 | 229.739 | 1474 | 338,545.40 |
| 5 | Natural forest | 0.405 | 582.34 | 5.73 | 0.008 | 0.001 | 0.011 | 2710 | 29.81 |
| 6 | Open agriculture | 0.405 | 582.34 | 5.73 | 0.340 | 0.020 | 9.190 | 4167 | 38,294.22 |
| 7 | Open land | 0.405 | 582.34 | 5.73 | 0.340 | 0.500 | 229.739 | 12,818 | 2,944,847.00 |
| Total | 36,366 | 3,636,661 | |||||||
| Average soil loss is 3,636,661/36,366 = 100 t/ha/y | |||||||||
| (d) Erosion rates induced by the land use/land cover in 2022 | |||||||||
| S.N. | LULC type | K | R | LS | C | P | Soil loss Ai (t/ha/y) | Covered area ai (ha) | Weighted (Ai × ai) |
| 1 | Built-up | 0.405 | 582.34 | 5.73 | 0.2 | 0.5 | 135.1407 | 3964 | 535,700.30 |
| 2 | Closed agriculture | 0.405 | 582.34 | 5.73 | 0.34 | 0.001 | 0.459478 | 2251 | 1034.41 |
| 3 | Forest plantation | 0.405 | 582.34 | 5.73 | 0.02 | 0.3 | 8.108444 | 3554 | 28,817.55 |
| 4 | Irrigation | 0.405 | 582.34 | 5.73 | 0.34 | 0.5 | 229.7392 | 1662 | 381,821.00 |
| 5 | Natural forest | 0.405 | 582.34 | 5.73 | 0.008 | 0.001 | 0.010811 | 1167 | 12.61 |
| 6 | Open agriculture | 0.405 | 582.34 | 5.73 | 0.34 | 0.02 | 9.18957 | 14,738 | 135,435.50 |
| 7 | Open land | 0.405 | 582.34 | 5.73 | 0.34 | 0.5 | 229.7392 | 9032 | 2,075,074.00 |
| Total | 36,368 | 3,157,895 | |||||||
| Average soil loss is 3,157,895/36,368 = 87 t/ha/y | |||||||||
| (a) Existing SECM | (b) Calculation of the Actual Soil Loss | ||||||
|---|---|---|---|---|---|---|---|
| Existing SECM | Area Covered (ha) | % | Erosion Risk (t/ha/y) | Peak Value Ai (t/ha/y) | Coverage ai (ha) | % of Area Covered | Weighted Value (Ai × ai) |
| None | 15,319 | 42 | <10 | 10 | 18,009 | 50 | 180,087 |
| Forest | 1959 | 5 | 25-Oct | 25 | 6936 | 18 | 173,408 |
| Contour bank terraces | 606 | 2 | 25–50 | 50 | 3484 | 10 | 174,195 |
| Bench terraces | 442 | 1 | 50–100 | 100 | 4917 | 14 | 491,707 |
| Dense forest and water bodies | 18,009 | 50 | >100 | 600 | 2989 | 8 | 1,791,702 |
| Total | 36,335 | 100 | Total | 36,335 | 100 | 2,654,323 | |
| The actual soil loss from the Sebeya watershed is 2,654,323/36,335 = 73 t/ha/y | |||||||
| Nutrients Level | Nitrogen (N) (ppm) | Phosphorus (P) (ppm) | Potassium (K) (ppm) | Organic Carbon (C) (%) | Calcium (Ca) (%) |
|---|---|---|---|---|---|
| Low | <430 | <7 | <80 | <0.40 | <0.50 |
| Medium | 430–600 | 7–15 | 80–180 | 0.40–0.60 | 0.50–0.75 |
| High | >600 | >15 | >180 | >0.60 | >0.75 |
| S.N. | Soil Nutrient | Sampled Value at Nyamyumba Sector in 2017 [64] | Tested Samples from Mulinga Sector in 2021 [65] |
|---|---|---|---|
| 1 | P | 7.000 | <7 ppm |
| 2 | K | 0.003 | <180 ppm |
| 3 | C | 75,560 | <0.60 ppm |
| 4 | Ca | - | <0.75% |
| 5 | pH * | - | <7 (acidic) |
| S.N. | Recommended SECM | K | R | LS | C | P | Soil Loss Ai (t/ha/y) | Area ai (km2) | Weighted (Ai × ai) |
|---|---|---|---|---|---|---|---|---|---|
| 1 | Afforestation | 0.405 | 582.34 | 5.73 | 0.02 | 0.001 | 0.027 | 4.792 | 0.130 |
| 2 | Agroforestry | 0.405 | 582.34 | 5.73 | 0.08 | 0.500 | 54.056 | 17.500 | 945.966 |
| 3 | Bamboo at gullies | 0.405 | 582.34 | 5.73 | 0.01 | 0.500 | 6.757 | 0.284 | 1.919 |
| 4 | Bench terraces | 0.405 | 582.34 | 5.73 | 0.15 | 0.128 | 25.947 | 3.208 | 83.241 |
| 5 | Progressive terraces | 0.405 | 582.34 | 5.73 | 0.15 | 0.150 | 30.407 | 49.428 | 1502.934 |
| 6 | Contour bunds | 0.405 | 582.34 | 5.73 | 0.50 | 0.600 | 402.179 | 0.065 | 26.030 |
| 7 | Grassed waterways | 0.405 | 582.34 | 5.73 | 0.20 | 0.100 | 27.028 | 0.072 | 1.938 |
| 8 | Hedgerows | 0.405 | 582.34 | 5.73 | 0.20 | 0.000 | 0.000 | 8.714 | 0.000 |
| 9 | No-till | 0.405 | 582.34 | 5.73 | 0.25 | 0.100 | 33.785 | 58.323 | 1970.455 |
| 10 | Existing SECM * | 0.405 | 582.34 | 5.73 | 0.22 | 0.341 | 99.539 | 20.419 | 2032.489 |
| 11 | Perennial crops | 0.405 | 582.34 | 5.73 | 0.23 | 0.800 | 251.146 | 0.002 | 0.475 |
| 12 | Reforestation | 0.405 | 582.34 | 5.73 | 0.02 | 0.001 | 0.027 | 1.024 | 0.028 |
| 13 | River side bamboo | 0.405 | 582.34 | 5.73 | 0.01 | 0.500 | 6.757 | 1.767 | 11.943 |
| 14 | Silvopastoralism | 0.405 | 582.34 | 5.73 | 0.09 | 0.000 | 0.000 | 0.357 | 0.000 |
| 15 | Rainwater tanks | 0.405 | 582.34 | 5.73 | 0.00 | 0.800 | 0.000 | 12.653 | 0.000 |
| 16 | Drainage channels | 0.405 | 582.34 | 5.73 | 0.58 | 0.800 | 627.053 | 6.052 | 3794.661 |
| 17 | Dense forest and water bodies | 0.405 | 582.34 | 5.73 | 0.00 | 0.000 | 0.000 | 178.694 | 0.000 |
| Total | 363.352 | 10,372.209 | |||||||
| Predicted soil loss from the Sebeya watershed = 10,372.209/363.352 = 29 t/ha/y | |||||||||
Disclaimer/Publisher’s Note: The statements, opinions and data contained in all publications are solely those of the individual author(s) and contributor(s) and not of MDPI and/or the editor(s). MDPI and/or the editor(s) disclaim responsibility for any injury to people or property resulting from any ideas, methods, instructions or products referred to in the content. |
© 2023 by the authors. Licensee MDPI, Basel, Switzerland. This article is an open access article distributed under the terms and conditions of the Creative Commons Attribution (CC BY) license (https://creativecommons.org/licenses/by/4.0/).
Share and Cite
Majoro, F.; Wali, U.G.; Munyaneza, O.; Naramabuye, F.-X. Sustainability Analysis of Soil Erosion Control in Rwanda: Case Study of the Sebeya Watershed. Sustainability 2023, 15, 1969. https://doi.org/10.3390/su15031969
Majoro F, Wali UG, Munyaneza O, Naramabuye F-X. Sustainability Analysis of Soil Erosion Control in Rwanda: Case Study of the Sebeya Watershed. Sustainability. 2023; 15(3):1969. https://doi.org/10.3390/su15031969
Chicago/Turabian StyleMajoro, Félicien, Umaru Garba Wali, Omar Munyaneza, and François-Xavier Naramabuye. 2023. "Sustainability Analysis of Soil Erosion Control in Rwanda: Case Study of the Sebeya Watershed" Sustainability 15, no. 3: 1969. https://doi.org/10.3390/su15031969