Article

The Impact of E-Commerce Transformation of Cities on Green Total Factor Productivity

College of Humanities and Development Studies (COHD), China Agricultural University, Beijing 100193, China
*
Author to whom correspondence should be addressed.
Sustainability 2023, 15(24), 16734; https://doi.org/10.3390/su152416734
Submission received: 5 November 2023 / Revised: 5 December 2023 / Accepted: 7 December 2023 / Published: 11 December 2023
(This article belongs to the Special Issue Advances in Urban Green Development and Resilient Cities)

Abstract

:
The e-commerce-oriented transformation of cities is an important measure to enhance the vitality of economic development, improve the efficiency of resource allocation, and provide a new boost to the green and high-quality development of regions. Taking the quasi-natural experiment of national e-commerce demonstration city construction as the starting point, using the panel data of 281 prefecture-level cities in China from 2005 to 2021, we measure the green total factor productivity of cities by using the super-efficient SBM model with non-expected outputs and the global reference GML index method, and use the multi-period propensity score matching double-difference method to examine the impact of urban e-commerce-oriented transformation on the green total factor productivity of the city and the intrinsic mechanism of the effect. The results show that the urban e-commerce transformation policy can significantly promote regional green total factor productivity, and this result still holds after a series of robustness tests, such as changing the time point of the policy, randomly selecting the placebo proposal for the treatment group, and changing the matching method; the effect is regionally heterogeneous, and is more pronounced in large cities, non-provincial capitals, eastern cities, central cities, and non-resource-based cities; the urban e-commerce transformation mainly promotes the improvement of urban green total factor productivity through three channels: the industrial structure upgrading effect, the economic agglomeration effect, and the green technology innovation effect.

1. Introduction

In response to climate change, many countries have increased their focus on carbon emissions and environmental protection issues by enacting stricter legislation and setting emissions targets (Fragkos et al., 2017) [1]. For example, the US passed the American Climate and Energy Security Act (ACESA) and proposed the Green New Deal, Japan formulated a master plan for a ‘Green Development Strategy’, and the EU released the ‘2020 Strategy’, which has green growth as a core strategy to enhance the competitiveness of European countries.
China’s economic growth and social development have made a qualitative leap in the context of forty years of reform and opening-up. However, against the backdrop of rising economic output, the situation of resource scarcity and environmental degradation has become increasingly serious. Relevant information shows that by 2022, China’s comprehensive national power will rank 2nd in the world, while China’s environmental quality will rank only 160th in the world in the Environmental Performance Index Report jointly published by Yale University and Columbia University. The concept of green development was first introduced into the country’s five-year plan in the Outline of the Thirteenth Five-Year Plan for the National Economic and Social Development of the People’s Republic of China (2016–2020), which states that green development is a sine qua non for sustainable development and that it is necessary to adhere to the basic state policy of conserving resources and protecting the environment. The addition of the word “beautiful” to the description of building a strong modern socialist country in the report of the 19th National Congress also highlights the importance of environmental issues. For the largest developing country, industrialization is still an important part of China’s future economic growth, and how to avoid falling into the “middle-income trap” of low-end manufacturing accompanied by environmental pollution has become one of the key tasks of green development.
Under the global digitalization process, e-commerce has become an indispensable and important method for the economic development of cities. After the General Office of the State Council issued several opinions on accelerating the development of e-commerce in 2005, China’s e-commerce industry responded quickly and played a positive role in improving the efficiency of resource allocation, promoting the development of small and medium-sized enterprises (SMEs), and boosting employment while enhancing the vitality of economic development. To further guide the e-commerce industry to develop steadily and play a more strategic role in economic development and social progress, the National Development and Reform Commission, the Ministry of Commerce, and other ministries and commissions have jointly carried out the establishment of “national e-commerce demonstration cities”, with Shenzhen as China’s first e-commerce demonstration city in 2009, and Beijing, Shanghai, Qingdao, and another 22 cities approved in 2011, 2014, and 2017, respectively, in accordance with the principle of “pilot first, step by step”. In 2014 and 2017, a number of national e-commerce model cities were approved under the “pilot first, promote gradually” principle, and a total of 70 cities have been approved as national e-commerce model cities to date. These areas were approved for the construction of national e-commerce demonstration cities, i.e., urban e-commerce transformation cities that must give full play to the role of e-commerce in optimizing resource allocation, upgrading industrial structure, and promoting employment. Specifically, the aim is to vigorously develop e-commerce in agriculture, manufacturing, and traditional services, and vigorously develop e-commerce in the field of people’s livelihood and cross-border e-commerce, so as to promote the transformation and upgrading of the economy; it is to establish a new mechanism adapted to the development of e-commerce, a new mode of e-commerce market governance, and a new regulatory framework that ensures that the healthy and rapid development of e-commerce is the top priority of city construction.
E-commerce not only implies a more convenient and efficient way of consumption, but also develops in a way that reduces energy consumption to a large extent (Abukhader, 2008) [2]. In particular, the Guiding Opinions on the Establishment of National E-commerce Demonstration Cities clearly states that the significance of establishing e-commerce demonstration cities is to “reduce the consumption of material resources and energy, reduce environmental pollution, develop a green economy, improve the industrial structure and optimise the allocation of resources”. Its significance is highly consistent with the goal of green and high-quality development. Green total factor productivity, as an important indicator to measure the level of green and high-quality development of cities, has become a research topic of great interest to scholars at home and abroad.
Can an e-commerce-oriented progressive transformation (i.e., the construction of national e-commerce model cities) improve the green total factor productivity of cities? What are the main mechanisms by which it can do so? Answering the above questions is of great practical significance for China’s transition to a green development model. In this context, this study adopts Chinese prefecture-level urban panel data, selects national e-commerce demonstration cities as quasi-natural experiments, and applies the multi-period PSM-DID methodology to study the promotion effect of urban e-commerce-based transformation on the improvement of green total factor productivity, so as to provide policy recommendations and empirical references for urban green development. The marginal contributions of this paper comprise four main aspects. First, this paper uses the data of 281 prefecture-level cities in China from 2005 to 2021 to validate the issue of the role of urban e-commerce-based transformation on the improvement of green total factor productivity, which broadens the idea of urban development research. Second, this paper verifies the issue by using the multi-period propensity matching score double-difference method to determine the net effect of urban e-commerce-based transformation on green total factor productivity enhancement, which overcomes the estimation bias in some previous studies, and uses various methods to test the robustness of the results. Third, this paper analyzes in detail the regional differences in green total factor productivity enhancement by urban e-commerce-oriented transformation in combination with cities of different levels, types, and locations. Fourth, this paper empirically tests the role path of urban e-commerce-oriented transformation on green total factor productivity improvement from the industrial structure upgrading effect, economic agglomeration effect, and green technology innovation effect, respectively, which enriches related research.
The rest of this paper is structured as follows: the first part describes the policy background of urban e-commerce transformation and puts forward the theoretical hypothesis of this paper; the second part mainly introduces the model construction, data source, and variable design of this paper; the third part is the empirical analysis of this paper, which presents the benchmark regression results, the parallel trend test and the counterfactual test, etc.; the fourth part is the test of the effect mechanism; the fifth part is the conclusions and policy recommendations.

2. Literature Review and Theoretical Background

2.1. Literature Review

At present, scholars are concerned about green total factor productivity and the construction of national e-commerce demonstration cities, and they have also conducted some studies and achieved results. In terms of the construction of national e-commerce demonstration cities, Shi (2022) [3], Jin et al. (2022) [4], Zhou et al. (2021) [5], Gao et al. (2021) [6], and Liu et al. (2021) [7] pointed out that the establishment of national e-commerce demonstration cities not only effectively improves the economic development of the region, but also plays an important role in promoting the green technological innovation of enterprises, the inflow of foreign direct investment, the promotion of industrial structural transformation, and the promotion of green high-quality development, all of which have significant positive impacts. In terms of green total factor productivity, Hu et al. (2011) [8], Wang et al. (2015) [9], and Yu et al. (2019) [10] incorporated the environmental pollution index into the non-parametric DEA–Malmquist index model beyond the logarithmic production function and the SBM model to calculate the green total factor productivity of China’s provinces and cities and analyzed the trend of its development over time. Li et al. (2012) [11] analyzed the impact of environmental regulation on green total factor productivity in the manufacturing sector. Yuan et al. (2015) [12] and Chen (2018) [13] explored the influencing factors of China’s industrial green total factor productivity and pointed out that China’s industrial green total factor productivity is positively influenced by technological level and reasonable property rights structure, negatively influenced by capital deepening and unreasonable energy structure, and affected by foreign direct investment and environmental regulation. She et al. (2020) [14] conducted a study based on a quasi-natural experiment with the national low-carbon city pilot policy in 2010 and found that the policy can significantly improve urban green total factor productivity through technological innovation and industrial structure upgrading. Ge et al. (2018) [15], Shangguan et al. (2020) [16], and Huang et al. (2020) [17] pointed out that scientific and technological innovation, environmental regulation, and industrial agglomeration are important factors in improving green total factor productivity, respectively.
As opposed to the above research perspectives, this paper explores the causal relationship and influence mechanism between the construction of national e-commerce model cities and green development. Sui and Rejeski (2002) [18] and Tiwari and Singh (2011) [19] argue that the environmental impact of e-commerce is a double-edged sword. Zhang et al. (2022) [20] used data from 265 cities in China from 2007 to 2016 as a research sample and used a multi-period variation approach to test the impact of the national e-commerce model city pilot on urban environmental pollution. The results showed that after becoming a pilot city, urban environmental pollution was reduced by about 17.5% on average, which means that the national e-commerce model city policy significantly reduced urban environmental pollution. Di and Zhi-Ping (2023) [21] empirically investigated the impact and mechanism of the NEDC policy on urban CO2 emissions using a multi-period difference-in-difference (DID) model and a mediated effects model and found that the national e-commerce demonstration city policy significantly reduced urban CO2 emissions. Liu et al. (2023) [22] found that the national e-commerce model city construction policy achieved energy-saving effects through technological innovation, industrial reorganization, and economic agglomeration. The above literature review illustrates from various perspectives that the national e-commerce demonstration city policy, as a pilot policy, has generated the green economy effect of e-commerce while expanding the space for e-commerce development. However, there is no relevant scientific literature that explores whether and how the construction of national e-commerce model cities promotes the improvement of green total factor productivity in cities. Therefore, the relationship between e-commerce and green total factor productivity needs to be explored and verified with richer data and rigorous empirical methods.

2.2. Role Mechanism Analysis and Theoretical Hypothesis

Urban e-commerce transformation is an exploratory practice in China’s reform process, and at the same time, it is the key to promoting green development. Based on previous studies, this paper argues that in the process of urban e-commerce transformation, i.e., the construction of national e-commerce demonstration cities, it mainly affects the green total factor productivity of cities through three aspects, namely the effect of upgrading the industrial structure, the effect of economic agglomeration, and the effect of improving the level of regional green technological innovation. The specific mechanism of the role is as follows.
First, the e-commerce-oriented transformation of cities has promoted green total factor productivity in cities by promoting the upgrading of industrial structure. From the technological perspective, the development of e-commerce has promoted the advancement of Internet technology, and enterprises have increased their technological investment, thereby improving their technological level and innovation capacity and promoting the upgrading of industrial structure. From the perspective of productivity, the application of e-commerce has led to the differentiation of productivity among different industries, and in the process of transferring production factors from low-productivity industries to high-productivity industries, the efficiency of social resource allocation has been improved, thus promoting the upgrading of industrial structure. From the perspective of consumer demand, the application of e-commerce enables producers and consumers to carry out low-cost, multi-channel communication, guiding consumer demand towards diversification and personalization, thus promoting the upgrading of industrial structure through changes in the structure of social demand and supply. From the perspective of employment demand, the development of e-commerce has brought a variety of jobs, such as customer service, operation, distribution, and so on, to the social service industry, expanding the proportion of the service industry in the national economy, while changing the original structure of the service industry and promoting the upgrading of the industrial structure. Obviously, the above industrial structure upgrading brought about by the transformation of e-commerce is detached from the high-energy-consuming and high-polluting industrial industry, reducing energy consumption and environmental pollution, and the industrial structure upgrading shows the green transformation mode of “service-oriented” industry (Shao et al., 2019) [23], which helps to improve the green total factor productivity of the city.
Second, the economic agglomeration caused by e-commerce transformation can promote green total factor productivity. Specifically, e-commerce transformation cities with favorable national policies and corresponding supporting policies from local governments have enabled the rapid development of related enterprises in the cities, promoted the rapid improvement of related infrastructure in the cities, such as integrated logistics warehousing and distribution systems and regional logistics and warehousing centers, attracted a large amount of capital and labor, and continuously increased the degree of economic agglomeration. This economic agglomeration can improve labor productivity and factor resource utilization efficiency while promoting technological innovation, and Glaeser (2012) [24] shows that the higher the degree of economic agglomeration, the higher the efficiency of energy and factor utilization, which in turn promotes the green total factor productivity of the city. Therefore, the higher the economic agglomeration brought about by the transformation of e-commerce, the more it contributes to the realization of green total factor productivity by promoting technological progress and production efficiency.
Finally, the urban e-commerce transformation promotes the green development of the economy by enhancing the green innovation capability of enterprises, thus improving the green total factor productivity. In the context of e-commerce-based transformation, traditional industries and e-commerce-based Internet enterprises integrate and penetrate each other, leading to the continuous updating and iteration of their original business models and production methods, which, on the one hand, optimizes the efficiency of resource allocation and, on the other hand, reduces energy consumption through technological iteration. Feng et al. (2016) [25] found that by exploring the new business model of B2B and B2C, this innovative business model makes the supply and demand relationship between enterprises and between enterprises and consumers personalized and efficient, which reduces the market-oriented transaction costs of enterprises. The reduction in transaction costs also plays a role in alleviating the financing constraints of enterprises and provides financial support for their green innovation. At the same time, the development and application of e-commerce has largely alleviated the market failure problems faced by enterprises in the process of green technology innovation, such as environmental externalities, path dependency and capital market imperfection, thus greatly reducing the variable costs in the production and sales process and providing more trial-and-error opportunities for enterprise innovation, which helps the R&D and shaping of green innovative technologies. Enterprises are gradually building a green, low-carbon, and recycling industrial system in the process of exploring green innovation, which enhances the green factors of production.
H1. 
The e-commerce-oriented transformation of the city has a promoting effect on the green total factor productivity of the city.
H2. 
The e-commerce-oriented transformation of cities mainly promotes the improvement of green total factor productivity through the industrial structure upgrading effect, the economic agglomeration effect, and the effect of increasing the level of regional green technological innovation.

3. Research Design

3.1. Model Setting

During the sample period, the sequential approval of e-commerce demonstration cities and the factor of whether they are approved or not leads to regional differences between each demonstration city and non-demonstration cities. To address this phenomenon, this paper adopts the DID method to control for such differences, which can on the one hand intuitively assess the policy effect of urban e-commerce transformation on green total factor productivity improvement, and on the other hand more effectively identify the net effect of urban e-commerce transformation on green total factor productivity. Since the approval of each national e-commerce demonstration city is not at the same time, there is a difference in the point in time at which each city is affected by the policy, so this paper relies on the method of Bertrand et al. (2004) [26], and takes the region that builds a national e-commerce demonstration city as the experimental group and the region that does not build a national e-commerce demonstration city as the control group, and sets up the following double-difference model to examine the impact of urban e-commerce transformation on green total factor productivity:
G t f p i , t = β 0 + β 1 E c o _ c i t y i × T i m e t + γ C o n t r o l s i , t + δ t + μ i + ε i , t
where i denotes city and t denotes time. The explanatory variable Gtfp is green total factor productivity. Eco_city × time is a dummy variable for the year in which the national e-commerce pilot city policy was approved. It takes the value of 0 before being approved as a national e-commerce model city and takes the value of 1 after being approved as a national e-commerce model city (i.e., in that year and thereafter). Control is an ensemble of a number of control variables. δt is a time fixed effect that does not vary with individuals. μi is a region fixed effect that does not vary with time. εit is the model random error term. The regression coefficient β1 measures the net policy effect of urban e-commerce transformation on regional green total factor productivity. If β1 > 0, it means that urban e-commerce transformation is indeed conducive to increasing regional green total factor productivity, i.e., it proves hypothesis H1 put forward in this study. On the other hand, if β1 < 0, it inhibits the increase in green total factor productivity, i.e., hypothesis H1 is not proved.
The double-difference method reduces the endogeneity problem caused by omitted variables in the regression equation to some extent, but the selection of the control group is more subjective and prone to the problem of sample selection bias. Since the government proposed the national e-commerce demonstration city construction project in 2009, regions have responded differently to the policy and implemented it to varying degrees. Although the policy of building national e-commerce model cities is a government act, it is not mandatory for regions, so there is likely to be a natural endogeneity between urban e-commerce transformation and green total factor productivity. Therefore, in order to further select an appropriate control group, this paper incorporates the propensity score matching (PSM) method, which is calculated as follows.
Based on the given covariates, the predicted probability of each city being approved to build a national e-commerce demonstration city, i.e., the propensity score P(Xi), is estimated by a logit model, which is calculated using the following formula:
P ( X i ) = P r ( D i = 1 X i ) = F f ( X i )
In Equation (2), Xi denotes the covariate of the ith city; Di is the dummy variable of the city’s e-commerce transformation, which takes the value of 1 for the approved construction of the national e-commerce demonstration city and 0 for the unapproved construction of the national e-commerce demonstration city; f(Xi) is a linear function, and F[-] is a logit function. According to the propensity score, we use the relevant matching method to match the experimental group with the control group, find the unapproved construction of national e-commerce demonstration cities with similar propensity score values to the construction of national e-commerce demonstration cities as the control group, and perform DID estimation for the matched experimental group and control group using Equation (1) to obtain the average treatment effect of the policy.
The propensity score matching double-difference method (PSM-DID) effectively solves the problem of sample selection bias while overcoming the influence of unobservable and observable variables on sample selection, so that it can more accurately estimate the net effect of urban e-commerce transformation on the improvement of regional green total factor productivity.

3.2. Description of Variables

3.2.1. Explained Variables

This paper chooses green total factor productivity as an explanatory variable. In order to better reflect the strategic importance of green development, this paper simultaneously considers the efficiency requirements of the high-value development stage and environmental factors. Specifically, based on the methodology of Yu et al. (2021) [27], we use the super-efficiency SBM model based on the inclusion of non-desired outputs with the global reference GML index method to measure urban green total factor productivity. The relevant indicators and data processing of inputs, desired outputs, and non-desired outputs are described below:
(1)
Input factors: input factors include labor input, capital input, and energy input. Among them, labor input is measured by the number of people employed in the city district, capital input is measured by the capital stock (measured by the perpetual inventory method based on Jun et al. (2004) [28]) and the built-up area of the city district, and energy input is measured by the value of global stabilized night light based on Wu et al. (2014) [29].
(2)
Desired outputs: desired outputs are measured by the GDP of each city.
(3)
Undesired outputs: undesired outputs are mainly measured by industrial wastewater emissions, sulfur dioxide emissions, and smoke and dust emissions.

3.2.2. Core Explanatory Variables

In this paper, the interaction term of the city grouping dummy variable and the policy time dummy variable, i.e., the city e-commerce transformation dummy variable (Eco_city × Time), is taken as the core explanatory variable.

3.2.3. Control Variables

According to the research of scholars, such as Li et al. (2018) [30] and Lin et al. (2019) [31], green total factor productivity is also affected by foreign direct investment (Fdi), the level of economic development of the city (Pgdp), the degree of government intervention (Gov), the level of foreign trade (Trade), and the level of urbanization and construction (Urban), so this paper takes the above variables as control variables.

3.3. Data Sources

This paper selects the panel data of 281 prefecture-level cities from 2005 to 2021 as the research sample. A total of 70 cities are e-commerce transformation cities, i.e., areas approved as national e-commerce demonstration cities during the study period, but based on the availability of data, this paper selects 68 of these e-commerce transformation cities as the experimental group of cities, and the rest as the control group of cities. The two cities with missing data are Yiwu City and Wujiaqu City. These two cities were not included in the model due to missing environmental data, such as industrial wastewater emissions, sulfur dioxide emissions and smoke and dust emissions, but this does not affect the empirical results. Among these, the list of cities approved as national e-commerce demonstration cities is obtained from the websites of the National Development and Reform Commission and the Ministry of Science and Technology, and from the websites of provincial governments (municipalities and autonomous regions). Other relevant data are obtained from the China Urban Statistical Yearbook, the China Environmental Statistical Yearbook, and the statistical yearbooks of provinces and cities over the years. Table 1 presents the definitions and descriptive statistics of the variables.

4. Empirical Results and Analysis

4.1. Propensity Score Matching Process and Parallel Trend Test

In order to select suitable reference objects for e-commerce transformation cities, this paper is based on the logit regression model, using the one-to-one nearest neighbor propensity score matching method within the caliper range to match, and imposing the “common support” condition. The results are presented in Figure 1 and Table 2. As shown in Figure 2, after kernel matching, the kernel density curves of the treatment group and the control group basically coincide, indicating that the matching effect is better.
Table 2 shows the matching effect of one-to-one near-neighbor propensity scores within the caliper range before and after the implementation of the urban e-commerce transformation policy, and the results of the balance test. As can be seen from the results, after the treatment by PSM, the difference between the treatment group and the control group is significantly reduced, the standard deviations of the control variables have all decreased, the absolute values are all less than 10%, the P values of the balance test of the control variables after the matching are all greater than 10%, the original hypothesis cannot be rejected, there is no significant difference between the experimental group and the control group in the matching variables after the matching, and the whole sample meets the requirements of the balance test. Therefore, the choice of matching method in this paper is reasonable, the variables are valid after matching, and the matching results better balance the data. The matched data can lay the foundation for further multi-period DID estimation, and the following empirical studies are estimated and analyzed with the matched samples.
In the sample interval, the status of a city as a treatment or control group changes according to the year in which the national e-commerce demonstration city is approved, and if the policy is not implemented in a city, the green total factor productivity of the control group and the experimental group should maintain a parallel trend of change. Therefore, in this paper, before using the double-difference method for policy evaluation, the dynamic test of the policy implementation effect was carried out by the event analysis method by cross-multiplying the time dummy variable before the policy implementation with the dummy variable of the national e-commerce demonstration city policy, so as to test the parallel trend hypothesis. The construction model is shown in the following Equation (3):
Y i , t = α + k = 12 k = 11 β k × Y e a r i , k + γ C o n t r o l s i , t + δ t + μ i + ε i , t
where a series of dummy variables Yeari,k denotes the kth year when the pilot policy of urban e-commerce transformation started to be implemented in city i. βk denotes the difference between the treatment group and the control group after the kth year of policy implementation, which is the core parameter of the equation. When k < 0, if none of the estimates of βk are significant, it means that the treatment and control groups satisfy the ex ante parallel assumption, in which case the results of the double-difference method are reliable; on the contrary, if at least one of the estimates of βk is significant during the period k < 0, it means that the parallel trend assumption is not satisfied. The parallel trend dynamics of green total factor productivity as an explanatory variable are shown in Figure 2.
As can be seen from Figure 2, the estimated values of green total factor productivity as an explanatory variable do not pass the significance level test in the period of k < 0. It can be seen that there is no significant difference in the level of green total factor productivity between the experimental group of cities and the control group of cities before the approval of the construction of the national e-commerce demonstration city, and the estimated coefficient of the policy dummy variable hovers around zero, which meets the requirements of the parallel trend assumption. Further analysis of Figure 2 shows that in the year of policy implementation, the explanatory variables still fail the 5% confidence level test, indicating that there is a 1-year lag in the impact of urban e-commerce transformation on the total green factor. In addition, during k > 0, the dynamic intensity of the impact of urban e-commerce transformation on total green factors is proportional to time, indicating that the marginal contribution of the impact of urban e-commerce transformation on total green factors continues to increase.

4.2. Benchmark Model Regression

Under the premise of satisfying the parallel trend assumption, this paper uses the data after PSM to test the relationship between urban e-commerce transformation and urban green total factor productivity using a two-way fixed-effects multi-period DID model controlling for area and time effects. Taking model (1) as the basis of analysis and gradually adding control variables for regression analysis, the results of the estimation are shown in Table 3. The results of columns (1)–(6) in Table 3 show that the estimated coefficients of Eco_city × Time are significantly positive at the 1% significance level, both when controlling only for area fixed effects and time fixed effects without adding the control variables, and after gradually adding the control variables that affect green total factor productivity. In addition, the results of column (6) indicate that, all other things being equal, the green total factor productivity level of a city increases by about 1.4% on average after it is approved as a national e-commerce demonstration city, which means that the transformation of urban e-commerce can help promote the improvement of green total factor productivity, and this result provisionally confirms the research hypothesis H1 proposed in this paper.

4.3. Robustness Tests

4.3.1. Placebo Test: Changing the Time of the Intervention

In order to ensure the validity of the policy treatment effects, this section uses a placebo test to rule out spurious regressions due to omitted variables and, thus, ensure the reliability of the benchmark results. In this section, four spurious model city policy variables (Eco_cityplacebo4, Eco_cityplacebo5, Eco_cityplacebo6 and Eco_cityplacebo7) are created by varying the timing of the policy, i.e., creating a spurious policy timing by advancing the policy by 4–7 years. They are then analyzed using the benchmark model (1). If the coefficient of Eco_cityplacebo is no longer significant under this result, it means that the parallel trend hypothesis is still valid and the policy of “establishing a national e-commerce demonstration city” can have a positive impact on the city’s green total factor productivity. On the other hand, it means that the parallel trend hypothesis is not satisfied and the increase in the green total factor productivity of the cities in the treatment group is related to other stochastic factors rather than being influenced by the policy.
The results of the time placebo test are shown in Table 4: the estimated coefficients are insignificant when the policy is assumed to have been implemented 4, 5, 6, and 7 years earlier, i.e., the parallel trend hypothesis still holds and the policy of establishing a “National E-commerce Demonstration City” influences the increase in green TFP of the treatment group cities rather than this being caused by random factors. This counterfactual test confirms the robustness of the above estimates.

4.3.2. Placebo Test: Randomly Selected Treatment Group

Although some city characteristic variables have been controlled in the quasi-natural experiment, there may still be some unobserved city characteristic factors that may affect the evaluation results of the pilot policies of e-commerce-oriented transition cities. As shown by Liu et al. (2015) [32], for the simultaneous point DID model, it is sufficient to randomly select a number of cities equal to the number of actual pilot cities from all sample cities as the treatment group. For the multi-temporal DID model with different policy shock times, it is necessary to randomly select a sample period for each sample object as the policy time, that is, to randomly generate the pseudo-group dummy variable Grouprandom and the pseudo-policy shock dummy variable Postrandom at the same time.
Based on this, this paper constructs 500 random shocks of the pseudo-e-commerce transformation city pilot policy on 281 sample cities; each time, 68 of them are randomly selected as the experimental group, and the policy implementation time is also randomly given to obtain the 500 group dummy variables Eco_city × Timerandom (i.e., Grouprandom × Postrandom) to perform the placebo test to ensure the robustness of the estimation results. The kernel densities of the 500 estimated coefficients and their p-value distributions are shown in Figure 3.
The results show that the estimated coefficients generated during the randomization process are mainly concentrated around the value of 0, and the p-values are mostly higher than 0.1, while the estimated coefficient of the baseline regression of the actual policy is 0.017, which is significantly different from the results of the placebo test. The results are robust.

4.3.3. Transform Matching Method

Before double-differencing, this paper uses the one-to-one nearest neighbor propensity score matching method within the caliper range to match the experimental group with a similar control group. To test the robustness of the results, this paper transforms the matching method by using the kernel matching method and the radius matching method to match the experimental group with a similar control group based on the original data, respectively, and then double-differencing is performed after matching the control group. The coefficients in columns (1)–(4) of Table 5 are all significantly positive at the 1% significance level, which is consistent with the previous estimation conclusion that the matching method is robust and that the empirical results are reliable.

4.4. Heterogeneity Analysis

4.4.1. Heterogeneity of City Size

This paper first conducts a heterogeneity analysis of the impact of urban e-commerce transformation on urban green total factor productivity based on differences in city size, and divides the sample cities into two sub-samples of large cities and small and medium-sized cities based on the criteria proposed by the Green Book on Small and Medium-Sized Cities (small cities with less than 500,000 urban residents, medium-sized cities with half a million to 1 million residents, and large cities with a population of 1 million or more), and conducts a group regression accordingly. The results are reported in Table 6, where column (1) shows the regression results for large cities and column (2) shows the regression results for small and medium-sized cities.
The results show that the contribution of urban e-commerce transformation to green total factor productivity is more significant in large cities. This may be due to the fact that large cities have more high-quality labor, high-quality innovation factors, and better capital environments than small and medium-sized cities. These cities can promote the innovation and upgrading of energy-saving and emission-reducing technologies through mechanisms, such as the sharing effect and the learning effect, and, thus, have more efficient energy use and stronger pollutant treatment capacity. As a result, pollutant emissions are greatly reduced, which in turn promotes the improvement of urban green total factor productivity. Based on the above analysis, the promoting effect of urban e-commerce transformation on urban green total factor productivity is mainly reflected in large cities.

4.4.2. Heterogeneity of Cities in the East, Central and West

This section examines whether the impact of urban e-commerce transformation on urban green total factor productivity shows heterogeneity among cities in the three economic zones of East, Central, and West, as divided by the National Bureau of Statistics of China. The regression results of the subgroups of the three sub-sample cities in the East, Central, and West regions are shown in Table 7.
Looking at columns (1)–(3), it can be seen that the impact of urban e-commerce transformation on regional green total factor productivity is significantly different in the three major economic zones. Among them, the eastern and central regions are more sensitive to the establishment of national e-commerce demonstration cities, and the green total factor productivity is significantly improved, while the western region has no significant improvement effect. Combined with the reality analysis of the three economic zones, the level of economic development in the western region is relatively low, although in recent years the western region has experienced “western development” and other policies to accelerate its economic development. However, compared with the eastern and central regions there is still a short period of time in which it is difficult to close the gap, which is the core of the regression results of the core factors of the difference. For the central and eastern regions with a higher level of economic development, the material foundation and capital environment for the development of e-commerce existed before the implementation of the policy, so it is easier for them to form a more complete “e-commerce” network through the integration of resources and production factors under the driving force of the policy. In addition, with the upgrading of the industrial structure, the three high-polluting, high-energy-consuming, and high-emission enterprises in these regions will be gradually reduced, thereby promoting the economy through industry and improving the green total factor productivity of the region.

4.4.3. Heterogeneity of Urban Resource Endowment

In order to investigate whether the impact of urban e-commerce transformation on urban green total factor productivity shows heterogeneity under different urban resource endowment conditions, the division criteria for resource-oriented cities used in this section refers to the National Sustainable Development Plan for Resource-Based Cities (2013–2021) issued by the State Council, the 126 prefecture-level cities in the sample cities are classified as resource-oriented cities, and the remaining prefecture-level cities are classified as non-resource-oriented cities. The same grouped regressions are run for the sub-sample of resource-oriented cities and the sub-sample of non-resource-oriented cities, and the results are reported in Table 8.
The results show that the transformation of urban e-commerce has a positive impact on the green and high-quality development of both resource-based and non-resource-based cities, and that it is more significant in non-resource-based cities. The reason is that the economic development of resource-based cities has long depended on local natural resources, such as coal, oil, and natural gas, and, therefore, there are more heavy industrial bases with “high energy consumption, pollution and emissions”. For the establishment of e-commerce cities, the problems of backward infrastructure, technological capacity and irrational industrial layout will be more prominent, and the implementation of green and high-quality development will face greater difficulties, so the transformation of urban e-commerce may not have a significant impact on the green total factor productivity of the city in the short term. However, from a long-term perspective, such cities have great development potential, and with the landing and penetration of Internet technology and high-tech enterprises, the driving effect of urban e-commerce transformation for resource cities will be more extensive and profound.

5. Testing the Mechanism of Action

Based on the research results in Section 3, this section further studies the impact mechanism of urban e-commerce transformation on green total factor productivity. From the logic of mechanism analysis, it can be seen that urban e-commerce transformation mainly affects urban green total factor productivity through three channels: the industrial structure upgrading effect, the economic agglomeration effect, and the green technology innovation effect, and this section further analyses in depth whether urban e-commerce transformation affects green total factor productivity through the above three mechanisms. In this regard, this paper adopts the approach of Quan et al. (2022) [33] to test the mechanism of action using two steps: (1) Testing the impact of urban e-commerce-based transformation on industrial structure upgrading, economic agglomeration, and green technological innovation; if urban e-commerce-based transformation improves industrial structure upgrading, economic agglomeration. and green technological innovation, it will tentatively support the logic of the above mechanism analysis; (2) by using the median of regional industrial structure upgrading level, economic agglomeration level, and green technological innovation level for a group test to further clarify how urban e-commerce-oriented transformation affects green total factor productivity.

5.1. Mechanism Test of Industrial Structure Upgrading Effect

The transformation of urban e-commerce plays an important role in promoting the application and development of e-commerce, and the factors of labor, capital, and technology will be concentrated in the more efficient information technology and service sectors, which will optimize the industrial structure of the city, and then accelerate the process of “retreating into three” of the city through the upgrading of industrial structure. This green transformation of the “service-oriented” city can help reduce energy consumption and environmental pollution and can improve the total factor productivity of the urban green sector. In this section, the ratio of the output value of tertiary industry to that of secondary industry (IS_TS) is used to measure the dynamic transformation mode of “retreating from the second and advancing to the third”, the index of industrial structure upgrading is used to measure the transformation and upgrading of industrial structure (IS_upgrade), and the test results of the effect of industrial structure upgrading are shown in Table 9.
From the regression results in columns (1) and (4), it can be seen that the implementation of urban e-commerce transformation (Eco_city × Time) significantly improves the regional industrial structure upgrade, which confirms the inference of this paper. Furthermore, this paper divides the samples into the advanced industrial structure group and the primary industrial structure group by the median of IS_TS and IS_upgrade to test the mechanism of urban e-commerce transformation on regional green total factor productivity in different contexts, and the test results are shown in columns (2)–(3) and (5)–(6), respectively. As can be seen from the results, in the primary group of industrial structure, the coefficient of urban e-commerce-oriented transformation is positive and significant at the 1% level. Meanwhile, in the advanced group of industrial structure, the urban e-commerce transformation is not significant. Overall, the test results of the above two-step method indicate that the implementation of urban e-commerce-oriented transformation improves the regional green total factor productivity by improving the regional industrial structure upgrading, i.e., it confirms the establishment of the industrial structure upgrading effect.

5.2. Mechanism Test of Economic Agglomeration Effect

To test the mechanism of the economic agglomeration effect, this paper uses the ratio of total non-agricultural output (i.e., the sum of the value added of secondary and tertiary industries) to the sum of the administrative area of these cities to measure economic agglomeration (ag). The results of the test of the economic agglomeration effect are shown in Table 10.
Table 10 columns (1) to (3) are the test results of economic agglomeration effect, from the regression results in column (1), it can be seen that the implementation of urban e-commerce transformation (Eco_city × Time) significantly improves the regional economic agglomeration, which preliminarily supports the inference of this paper. Furthermore, this paper takes the median regional economic agglomeration as the grouping criterion, divides the sample into higher economic agglomeration group and lower economic agglomeration group, and tests the mechanism of the city’s e-commercialization transformation affecting the regional green total factor productivity in the case of higher economic agglomeration group and lower economic agglomeration group, respectively, and the results of the mechanism test are shown in columns (2) and (3), respectively. As can be seen from the results, the Eco_city × Time coefficient is positive and significant at the 1% level in the lower economic agglomeration group sample. On the other hand, Eco_city × Time is not significant in the higher economic agglomeration group. Therefore, the above test of the two-step method shows that the implementation of urban e-commerce transformation increases the level of regional green total factor productivity by increasing regional economic agglomeration, i.e., it confirms that the economic agglomeration effect holds.

5.3. Mechanism Test of Green Technology Innovation Effect

To test the mechanism of the green technology innovation effect, this paper selects the number of green patent applications per capita in each city from 2005 to 2021 to measure the level of green technology innovation in the region, and the test results of the green technology innovation effect are shown in Table 10.
Table 10 columns (4)–(6) show the mechanism of green technology innovation effect test results, and column (4)’s regression results show that the implementation of urban e-commerce transformation (Eco_city × Time) significantly improves the level of regional green technological innovation, preliminary confirmation of this paper’s inference. Next, this paper takes the median level of regional green technological innovation as the grouping benchmark, divides the sample into a higher level of green technological innovation and lower level of green technological innovation group, respectively, and tests the impact mechanism of urban e-commerce transformation on regional green total factor productivity in the context of the higher level of green technological innovation and lower level of green technological innovation group; the empirical results are shown in columns (5) and (6), respectively. As can be seen from the results, in the sample of the lower level of green technological innovation group, the Eco_city × Time coefficient is positive and significant at the 1% level. On the other hand, Eco_city × Time is not significant in the higher level green technology innovation group. Through the above two-step test, it can be seen that the implementation of urban e-commerce transformation increases the level of regional green total factor productivity by increasing the level of regional green technological innovation, which confirms that the green technological innovation effect is established.

6. Conclusions and Discussion

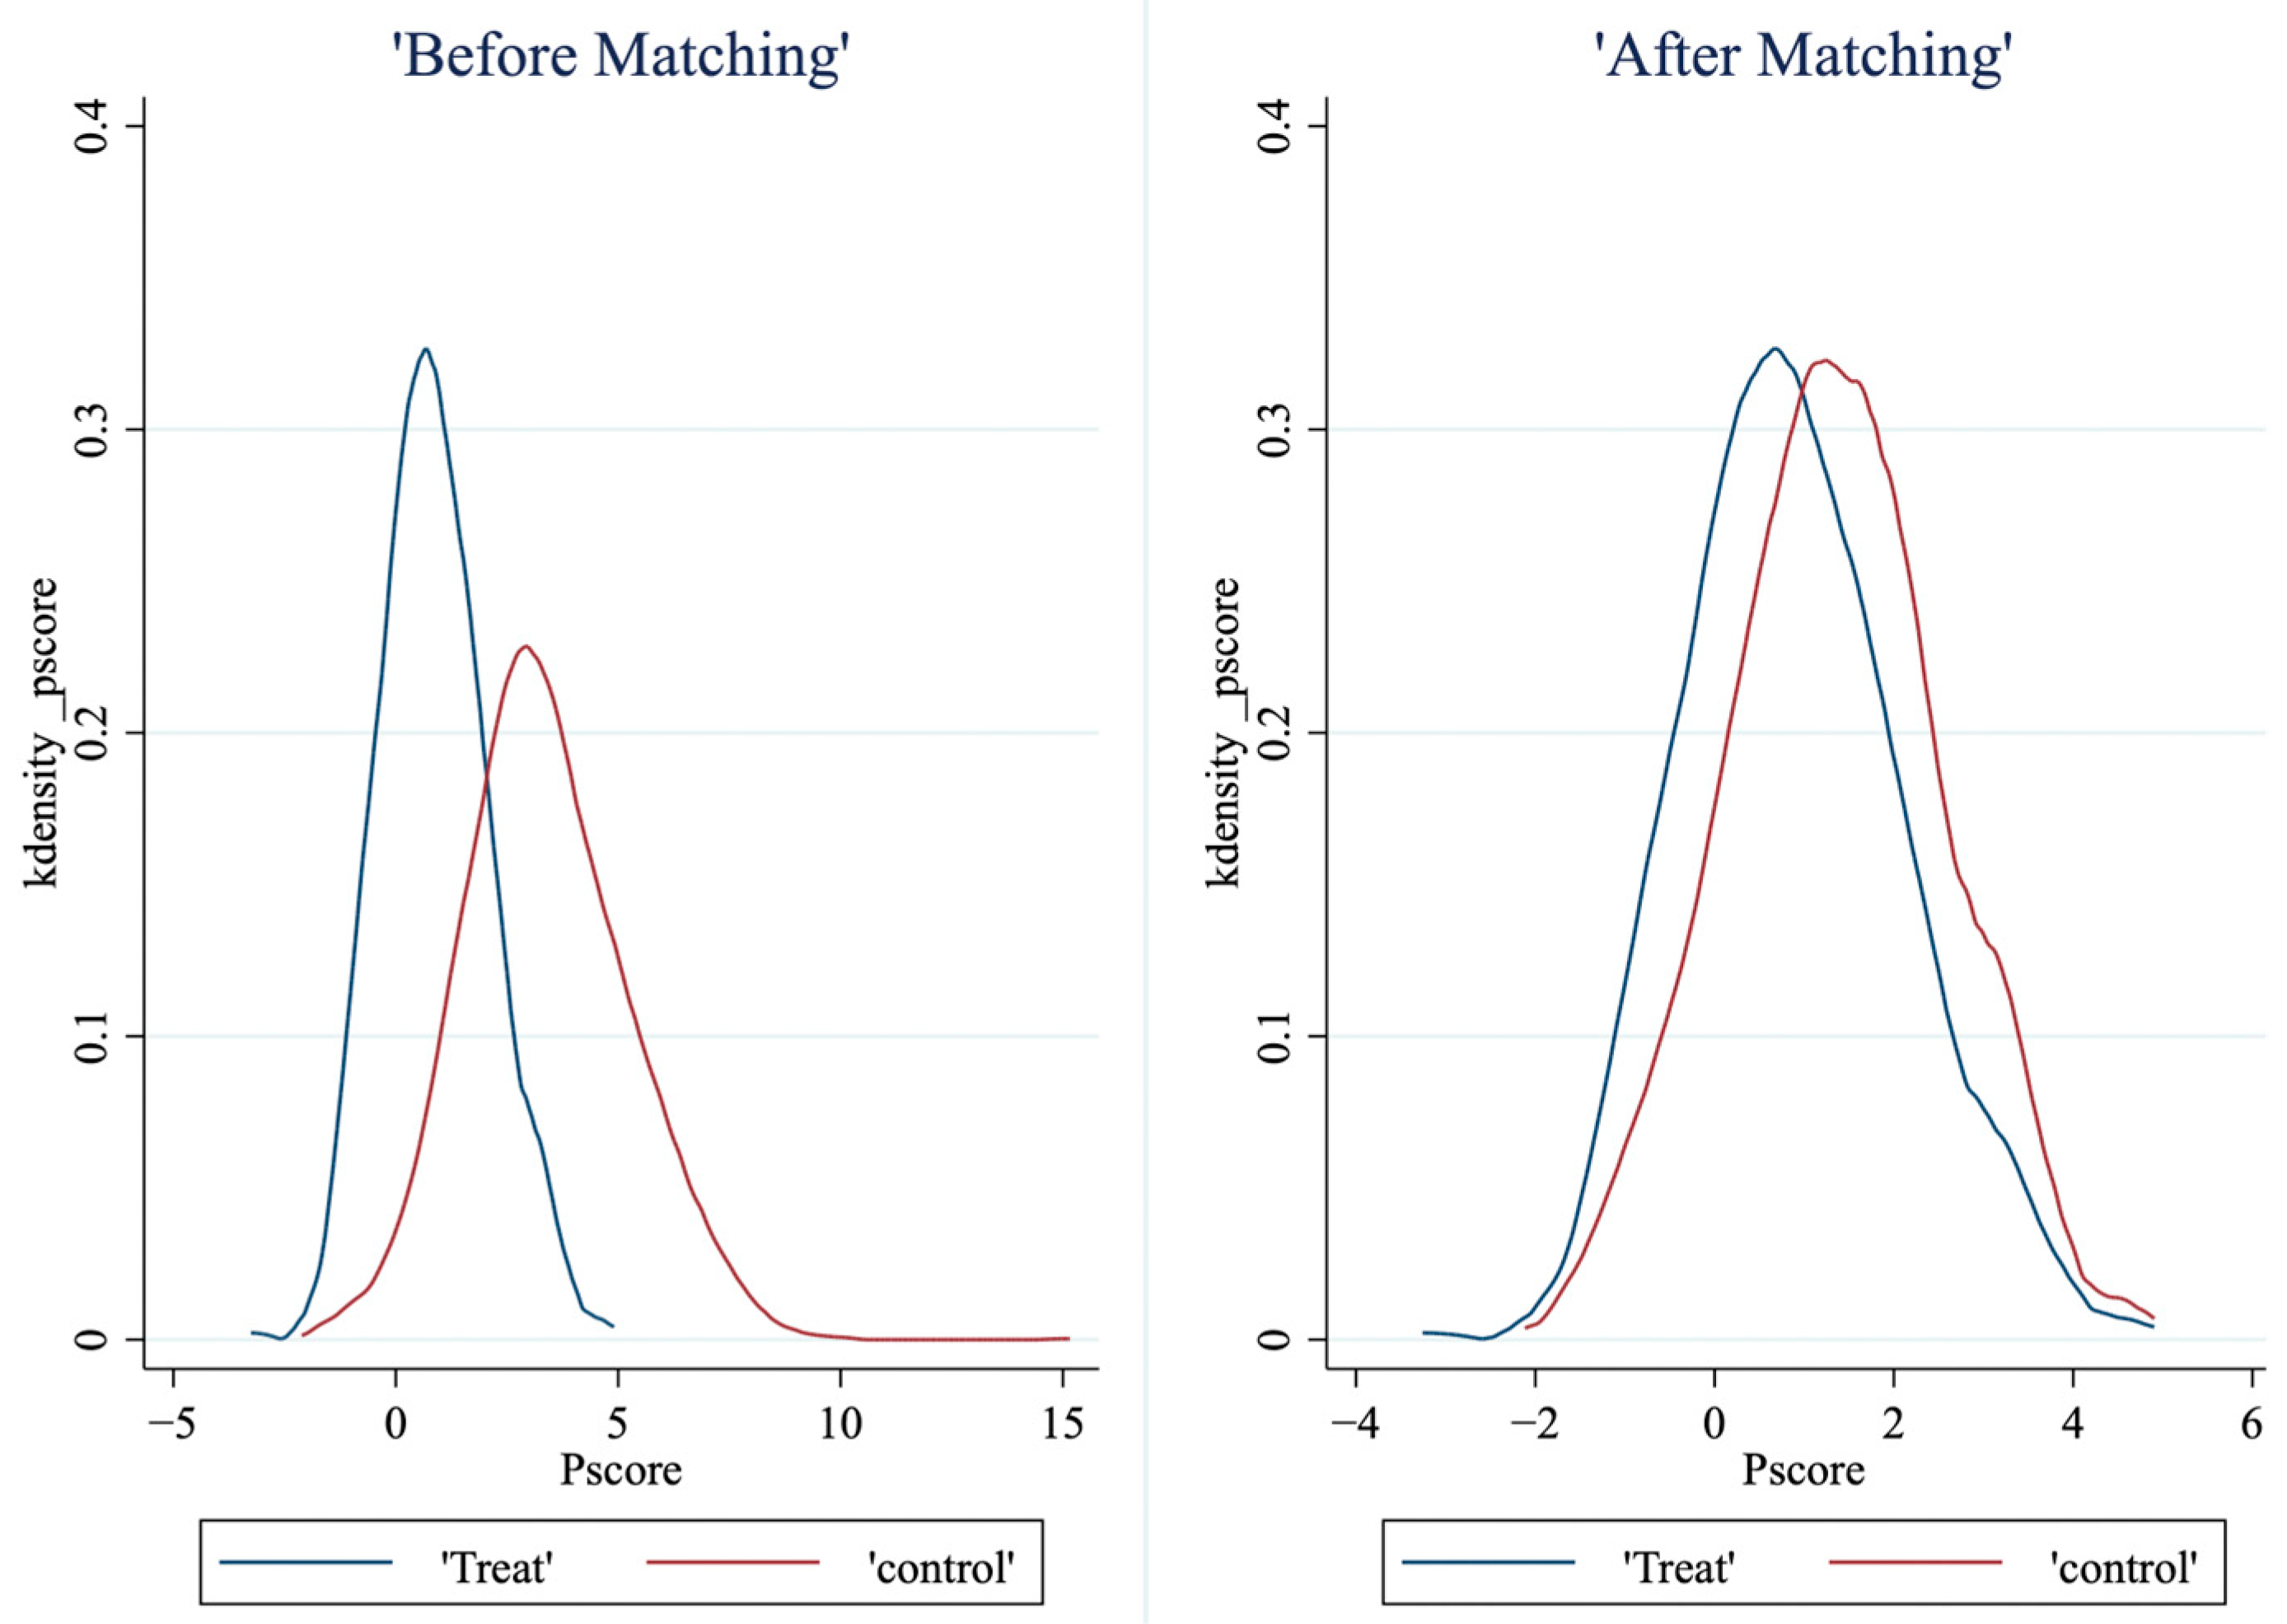
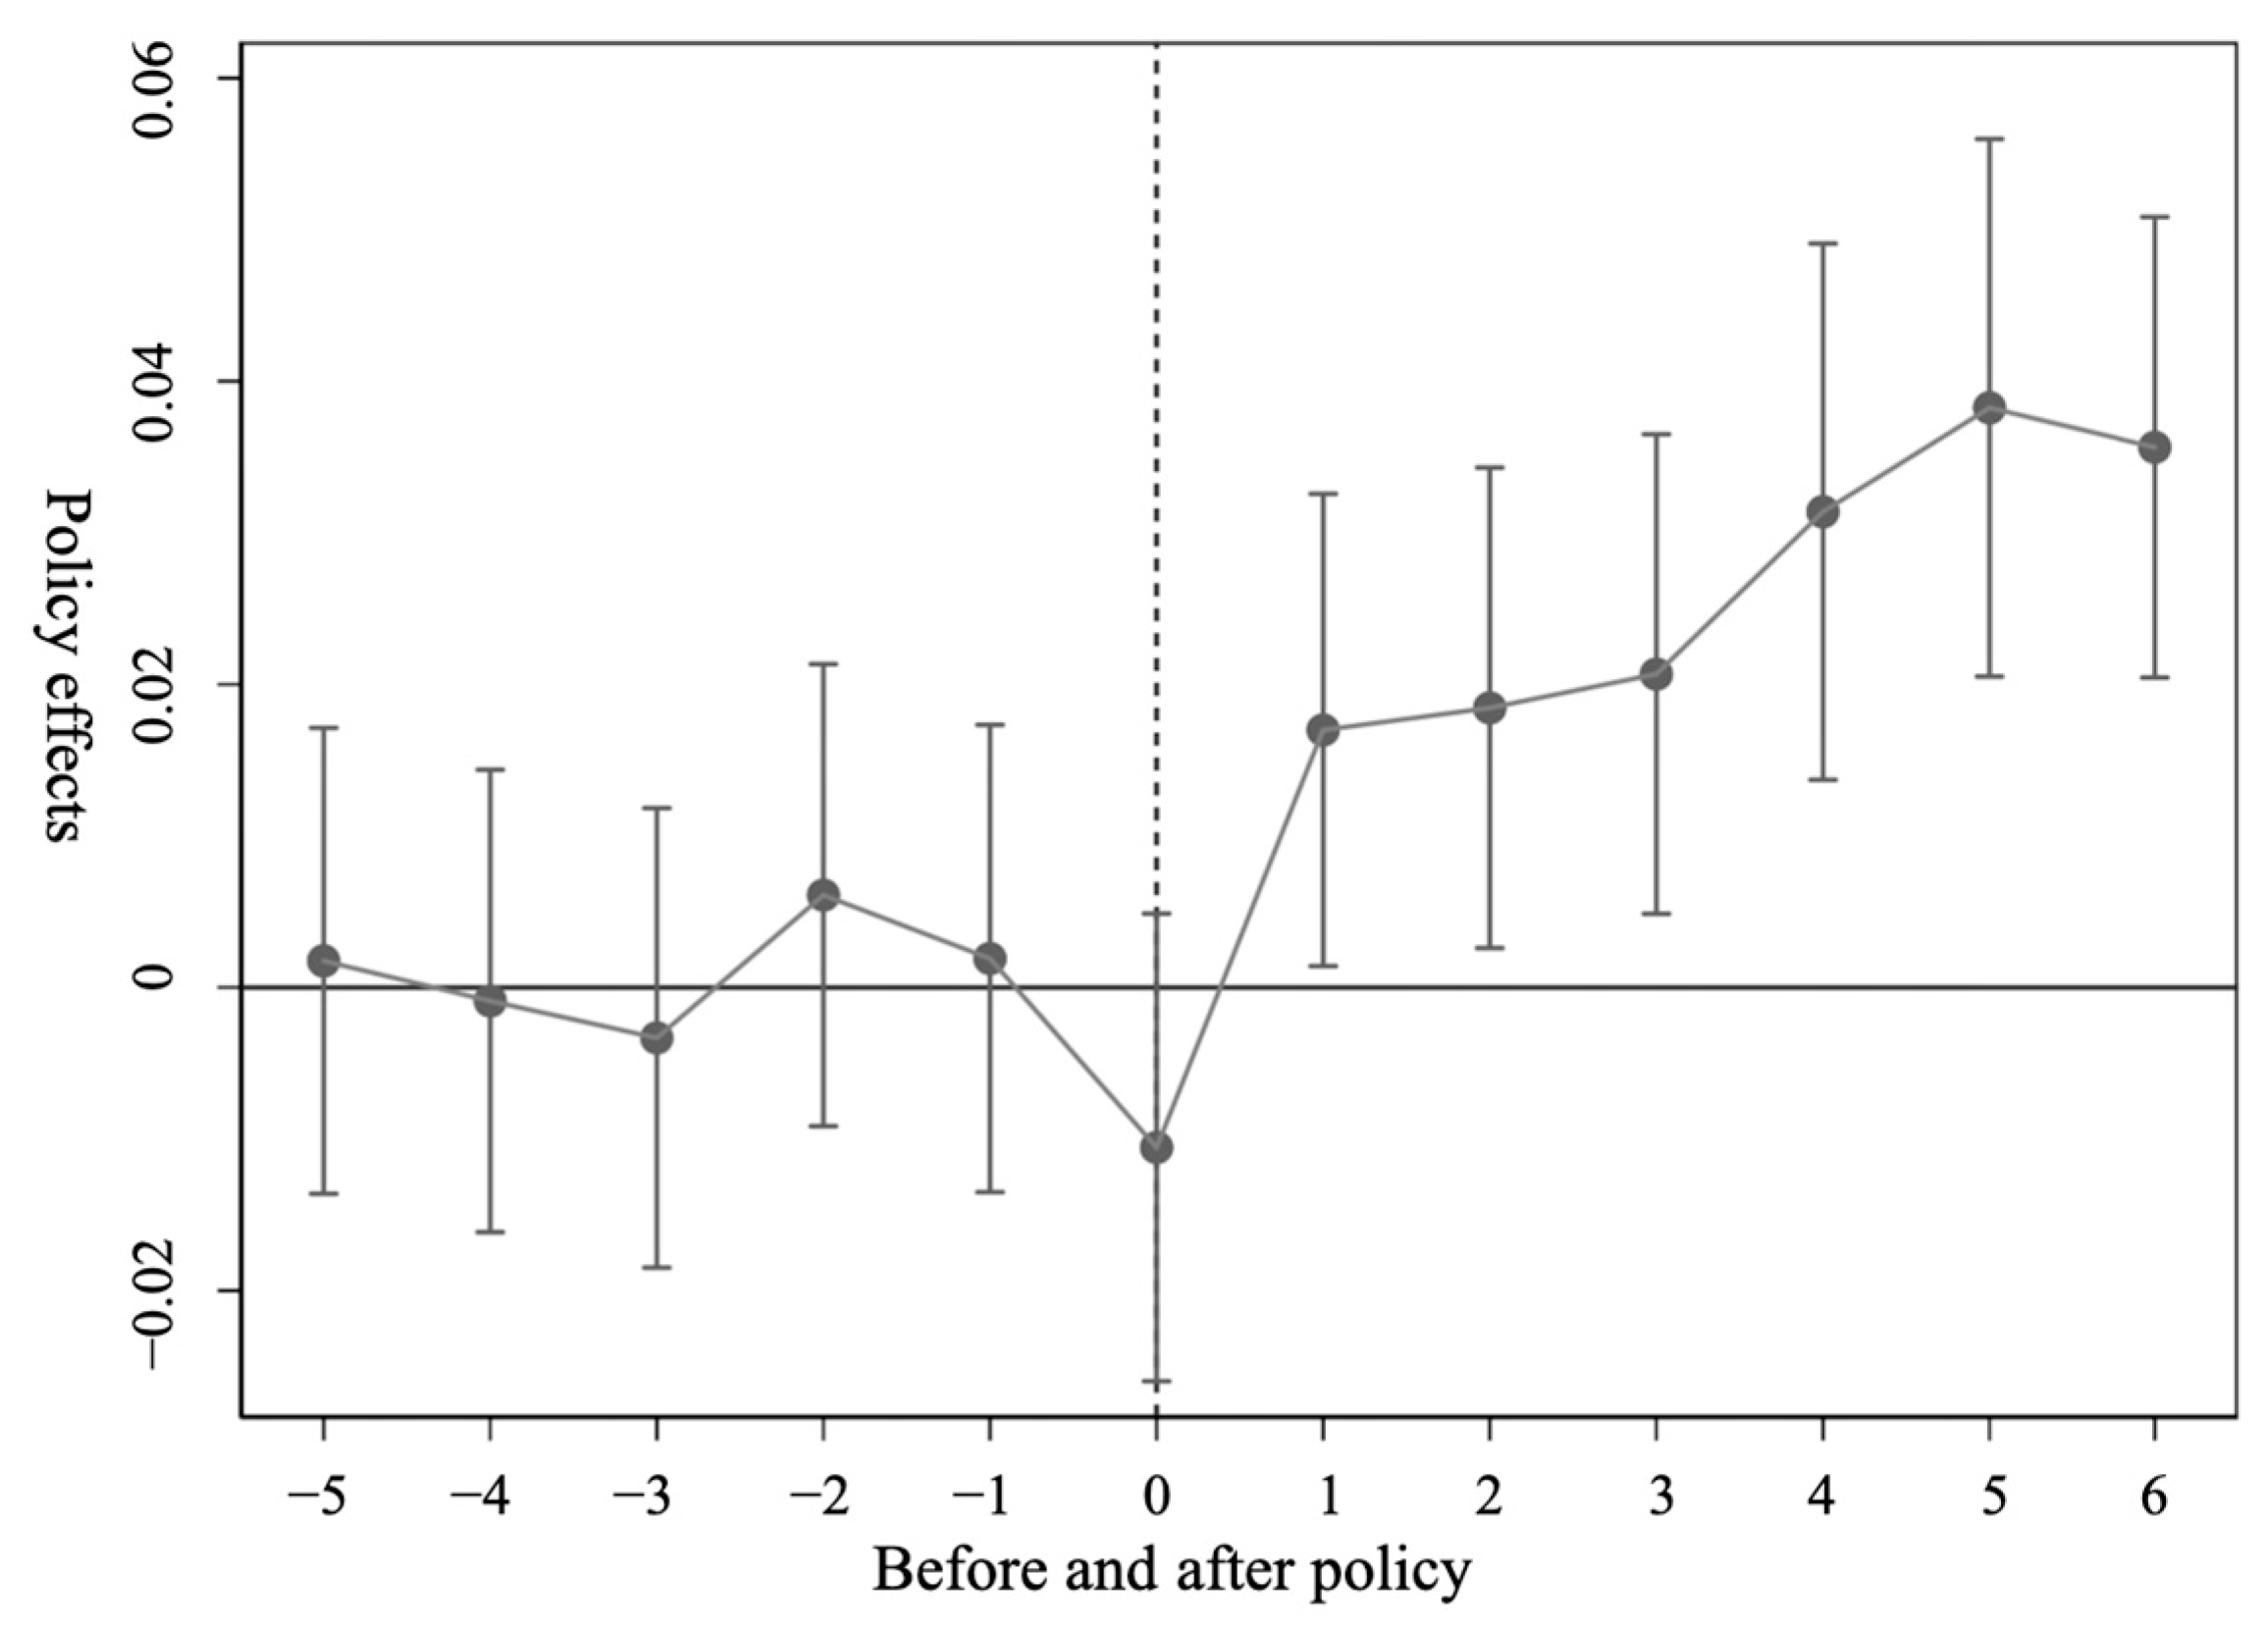
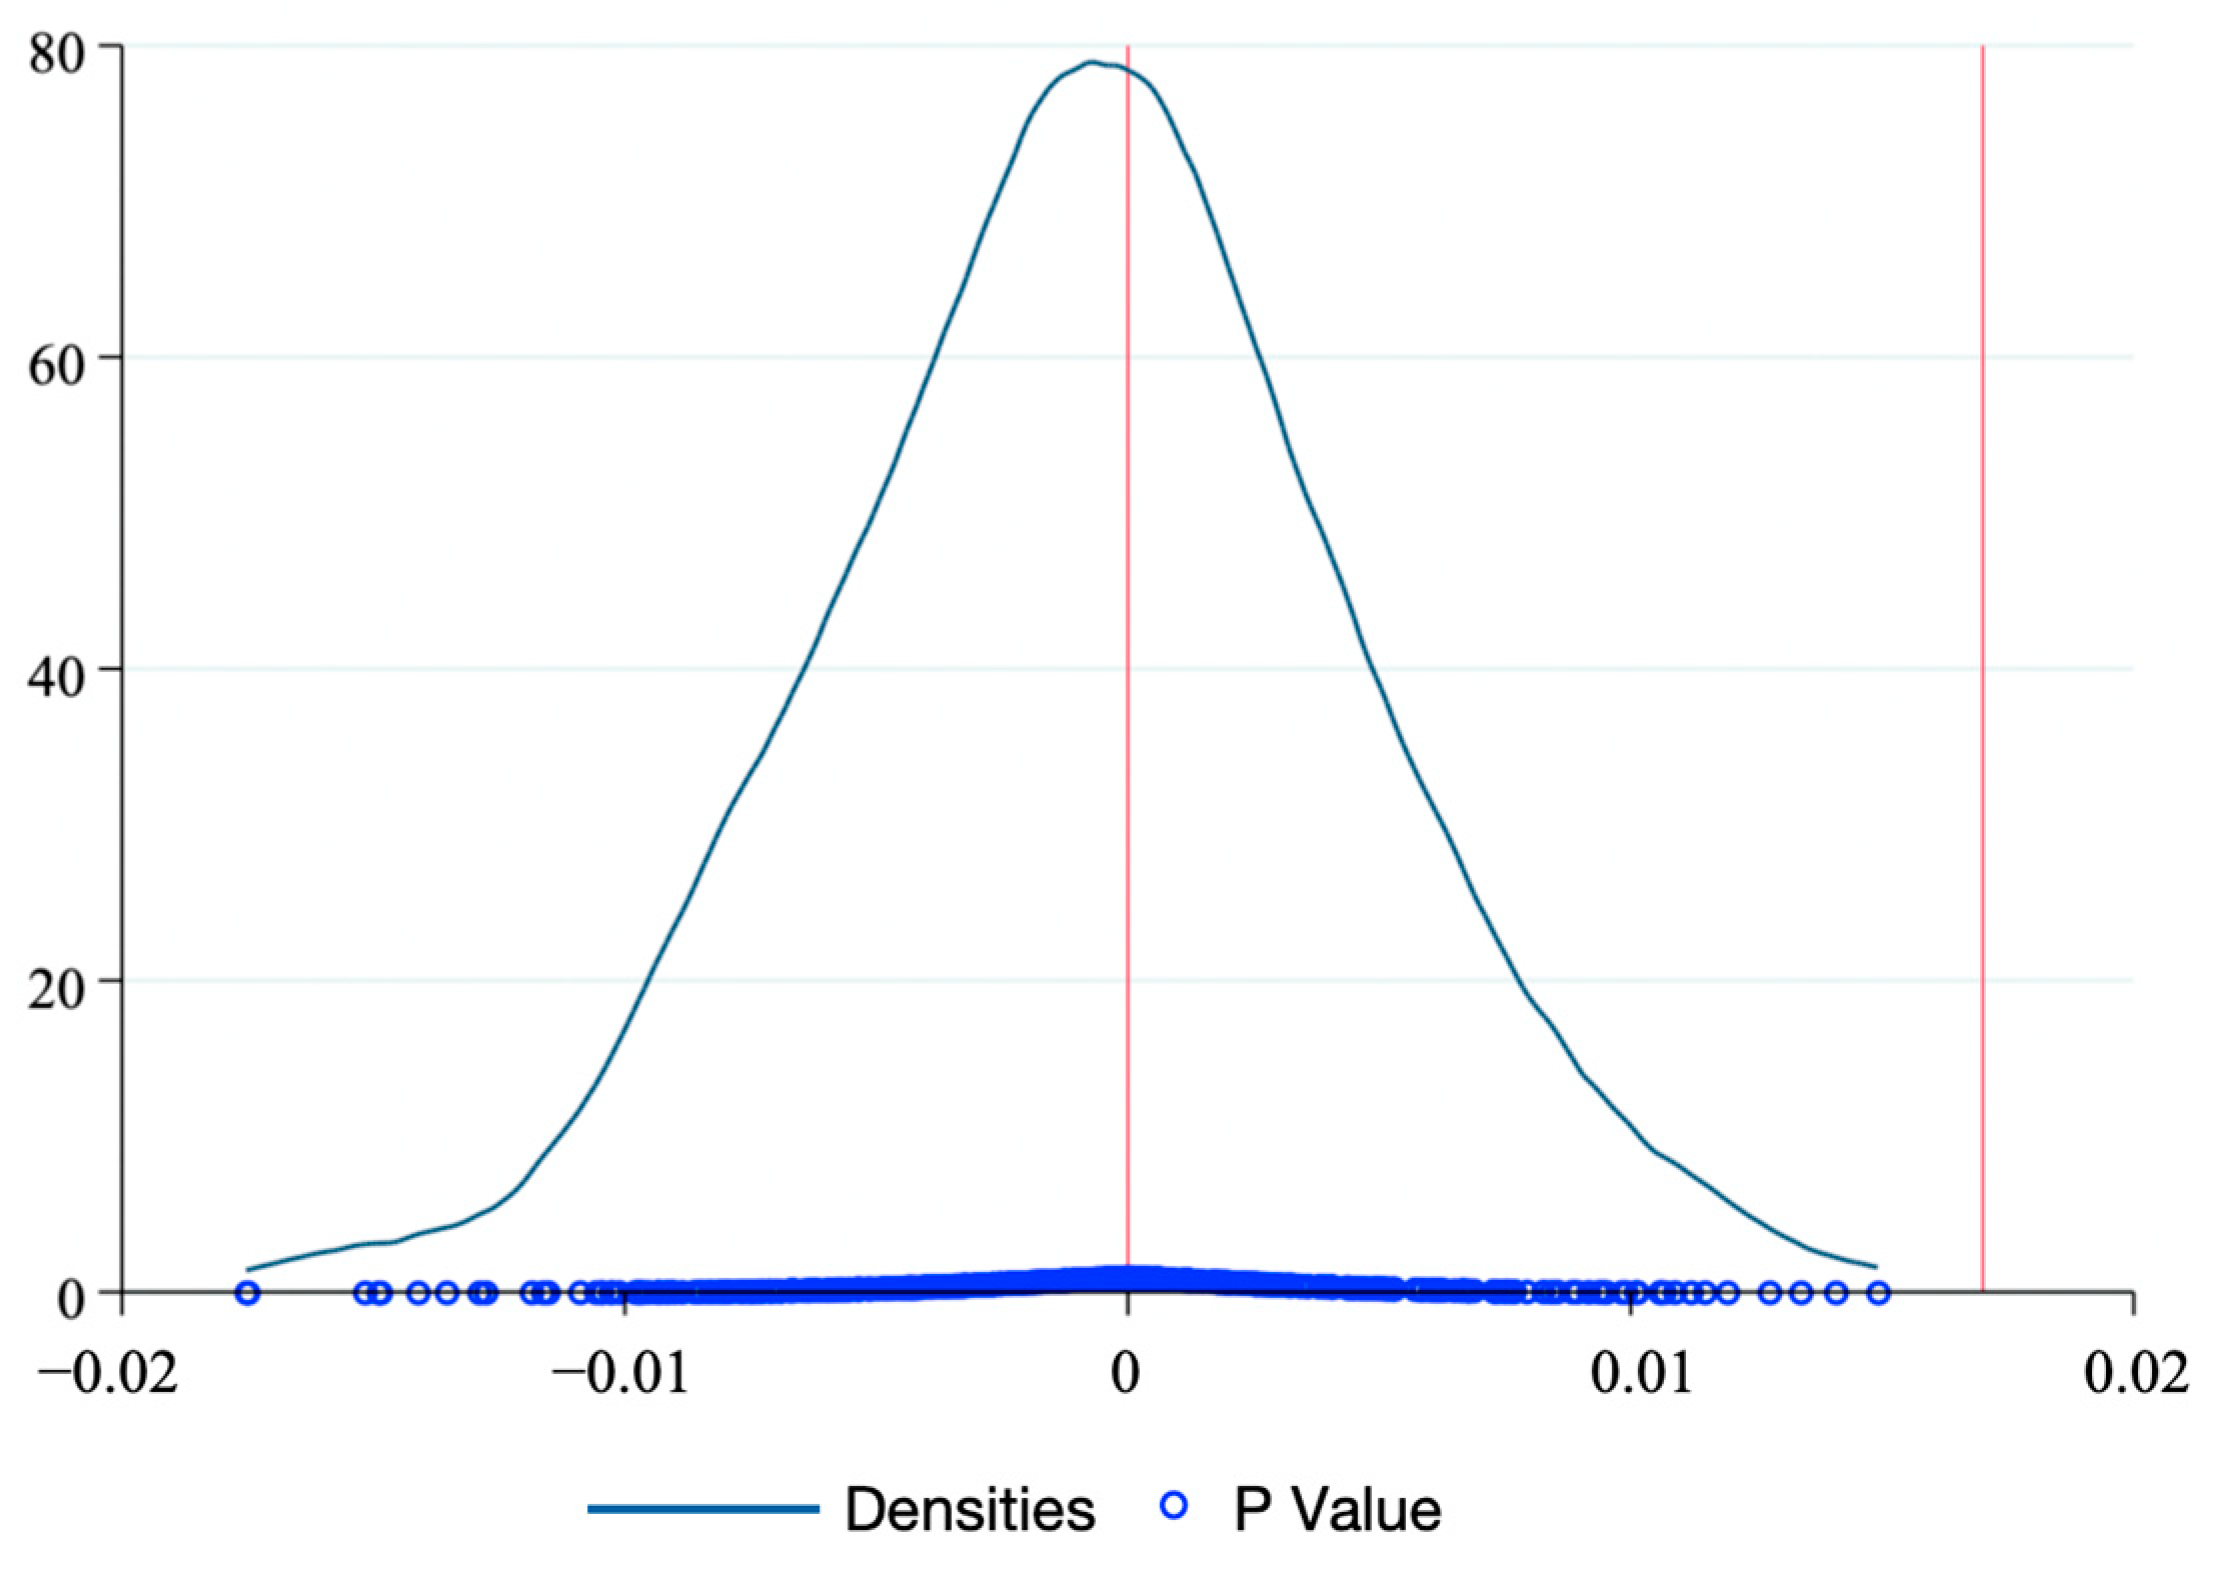
This paper uses prefecture-level urban panel data from 2005 to 2021 to study the impact of urban e-commerce-oriented transformation policies on green total factor productivity in pilot regions using the multi-period PSM-DID model, based on which the impact mechanisms are tested, respectively. The results showed that: (1) urban e-commerce-oriented transformation policies can significantly promote regional green total factor productivity; in order to test the reliability of the benchmark regression results, this paper further conducts a robustness test on the benchmark regression results by changing the time point of the policy occurrence for the counterfactual test, the placebo test, and transforming the matching method, etc., and the results prove the validity as well as the reliability of the benchmark regression results. (2) There is regional heterogeneity in the effect of urban e-commerce transformation policy, and the effect of urban e-commerce transformation policy on the improvement of urban green total factor productivity is greater in large cities, eastern cities, central cities, and non-resource cities than in small and medium-sized cities, western cities, and resource cities. (3) Urban e-commerce transformation mainly affects urban green total factor productivity through three channels: the industrial structure upgrading effect, the economic agglomeration effect, and the green technology innovation effect. The above findings support the hypotheses H1 and H2 proposed in this paper. Meanwhile, the conclusions of this paper are similar to the findings of Zhang et al. (2022) [20], Di and Zhi-Ping (2023) [21], Liu et al. (2023) [22], etc., which confirm that the policy of building e-commerce demonstration cities can reduce urban environmental pollution.
The research in this paper is of great importance for developing countries and globally. On the one hand, it provides empirical evidence for the construction of national e-commerce model cities. On the other hand, it also provides a reference for the promotion of e-commerce model cities in developing countries. The empirical evidence in this paper shows that such policies are effective even in developing countries. Therefore, governments can further extend these experiences to more countries and regions and use policies conducive to the development of e-commerce to effectively promote green development. Based on the above conclusions, this paper makes the following policy recommendations from the macro and industry perspectives. From the macro perspective, it is necessary to make full use of the policy implementation effect of the national e-commerce demonstration city to further play its strategic role in reducing environmental pollution and improving the efficiency of resource allocation. At the same time, it is necessary to focus on relevant infrastructure construction and investment in small and medium-sized cities and western regions to further narrow the technology gap and improve innovation capacity. In addition, the transformation of e-commerce is both an opportunity and a challenge for resource-oriented cities, which should actively plan and carry out the construction of e-commerce demonstration cities with urban characteristics and advantages according to local conditions and eliminate blind promotion. At the industrial level, in conjunction with the center of gravity of China’s economic development, we should accelerate the development of intelligent manufacturing industry with e-commerce as the link, cultivate new industries and new kinetic energy by improving the innovation capacity of green technology, build green and low-carbon industrial clusters, and further promote green and high-quality developments.
Although this paper discusses the e-commerce transformation of cities to promote green total factor productivity, the research object of this paper is only the “national e-commerce demonstration city” policy implemented in China, and it does not compare with the policies of other countries around the world, which can be considered for comparative analysis in the future.

Author Contributions

Conceptualization, M.D.; Methodology, M.D.; Writing—original draft, M.D.; Writing—review & editing, M.D. and Q.G. All authors have read and agreed to the published version of the manuscript.

Funding

This research was funded by Research on Inter-organizational Proximity and Organizational Aggregation in Cooperative Agricultural Extension (71173219) and Tracking Analysis of Characteristic Agricultural Products E-commerce Transaction (202107211210316).

Institutional Review Board Statement

Not applicable.

Informed Consent Statement

Not applicable.

Data Availability Statement

Data are available on request due to restrictions, e.g., privacy or ethical. The data presented in this study are available on request from the corresponding author. The data are not publicly available due to the strict management of various data and technical resources within the research teams.

Conflicts of Interest

The authors declare no conflict of interest.

References

  1. Fragkos, P.; Tasios, N.; Paroussos, L.; Capros, P.; Tsani, S. Energy system impacts and policy implications of the European Intended Nationally Determined Contribution and low-carbon pathway to 2050. Energy Policy 2017, 100, 216–226. [Google Scholar] [CrossRef]
  2. Abukhader, S.M. Eco-efficiency in the era of electronic commerce–should ‘Eco-Effectiveness’ approach be adopted? J. Clean. Prod. 2008, 16, 801–808. [Google Scholar] [CrossRef]
  3. Shi, Y. The Establishment of National E-Commerce Model Cities and Economic Development—A Quasi-Natural Experimental Study. Enterp. Econ. 2022, 4, 141–152. [Google Scholar]
  4. Jin, H.; Yu, L.; Wei, J. The Influence and Mechanism of the National E-commerce Demonstration City on Green Technological Innovation of Enterprises. Sci. Technol. Prog. Policy 2022, 10, 81–90. [Google Scholar]
  5. Zhou, K.; Yu, L. Transformation of Urban E-Commerce Research on the Impact and Mechanisms of FDI. Study Pract. 2021, 12, 82–92. [Google Scholar]
  6. Gao, C.; Zou, Y. Has E-Commerce Promoted Industrial Structure Transformation?—Evidence from National E-Commerce Demonstration Cities. Enterp. Econ. 2021, 10, 132–142. [Google Scholar]
  7. Liu, N.; Deng, M.; Gao, X. Does the E-commerce Transformation of Cities Promote Green and High-quality Development? Evidence from a Quasi-natural Experiment Based on National E-commerce Demonstration Cities. J. Financ. Econ. 2021, 04, 49–63. [Google Scholar]
  8. Hu, X.; Yang, L. Analysis of Growth Differences and Convergence of Regional Green TFP in China. J. Financ. Econ. 2011, 04, 123–134. [Google Scholar]
  9. Wang, F.; Xie, J. Research on provincial green total factor productivity growth rate in China. Chin. J. Popul. Sci. 2015, 2, 53–62. [Google Scholar]
  10. Yu, Y.Z.; Yang, X.Z.; Zhang, S.H. Research on the characteristics of time and space conversion of China’s economy from high-speed growth to high-quality development. J. Quant. Tech. Econ. 2019, 36, 3–21. [Google Scholar]
  11. Li, L.; Tao, F. Selection of optimal environmental regulation intensity for Chinese manufacturing industry—Based on the green TFP perspective. China Ind. Econ. 2012, 5, 70–82. [Google Scholar]
  12. Yuan, Y.J.; Xie, R.H. FDI, environmental regulation and green total factor productivity growth of China’s industry: An empirical study based on Luenberger index. J. Int. Trade 2015, 8, 84–93. [Google Scholar]
  13. Chen, C.; Lan, Q.; Gao, M.; Sun, Y. Green total factor productivity growth and its determinants in China’s industrial economy. Sustainability 2018, 10, 1052. [Google Scholar] [CrossRef]
  14. She, S.; Wang, Q.; Zhang, A. Technological innovation, industrial structure and urban GTFP—Channel test based on national low-carbon city pilots. Res. Econ. Manag. 2020, 41, 44–61. [Google Scholar]
  15. Ge, P.; Huang, X.; Han, X. Innovation Driven and Green Total Factor Productivity Enhancement in ‘One Belt and One Road’—A Heterogeneous Innovation Analysis Based on New Economic Growth Modeling. Econ. Sci. 2018, 01, 37–51. [Google Scholar]
  16. Shangguan, X.; Ge, B. Scientific and technological innovation, environmental regulation and high-quality economic development:empirical evidence from 278 Chinese cities at prefecture level and above. China Popul. Resour. Environ. 2020, 30, 95–104. [Google Scholar]
  17. Huang, Q.H.; Shi, P.H.; Hu, J.F. Industrial agglomeration and high-quality economic development: Examples of 107 prefecture-level cities in the Yangtze River Economic Belt. Reform 2020, 311, 87–99. [Google Scholar]
  18. Sui, D.Z.; Rejeski, D.W. Environmental impacts of the emerging digital economy: The e-for-environment e-commerce? Environ. Manag. 2002, 29, 155–163. [Google Scholar] [CrossRef]
  19. Tiwari, S.; Singh, P. Environmental impacts of e-commerce. Int. Conf. Environ. Sci. Eng. 2011, 8, 202–207. [Google Scholar]
  20. Zhang, Z.; Sun, Z.; Lu, H. Does the e-commerce city pilot reduce environmental pollution? Evidence from 265 cities in China. Front. Environ. Sci. 2022, 10, 813347. [Google Scholar] [CrossRef]
  21. Di, L.; Zhi-Ping, Q. Can e-commerce reduce urban CO2 emissions? Evidence from National E-commerce Demonstration Cities policy in China. Environ. Sci. Pollut. Res. 2023, 30, 58553–58568. [Google Scholar] [CrossRef] [PubMed]
  22. Liu, M.; Hou, Y.; Jiang, H. The Energy-Saving Effect of E-Commerce Development—A Quasi-Natural Experiment in China. Energies 2023, 16, 4718. [Google Scholar] [CrossRef]
  23. Shao, S.; Zhang, K.; Dou, J.M. Effects of economic agglomeration on energy saving and emission reduction: Theory and empirical evidence from China. Manag. World 2019, 35, 24–42. [Google Scholar]
  24. Glaeser, E. Triumph of the City: How Our Greatest Invention Makes Us Richer, Smarter, Greener, Healthier, and Happier; Penguin: New York, NY, USA, 2012. [Google Scholar]
  25. Feng, H.; Chen, Y. Research on platform business model innovation-based on a time-spatial correspond analysis under internet environment. China Ind. Econ. 2016, 3, 99–113. [Google Scholar]
  26. Bertrand, M.; Duflo, E.; Mullainathan, S. How much should we trust differences-in-differences estimates? Q. J. Econ. 2004, 119, 249–275. [Google Scholar] [CrossRef]
  27. Yu, Y.; Wei, P. Study on urban green total factor productivity measurement in China. Ecol. Econ. 2021, 37, 43–52. [Google Scholar]
  28. Jun, Z.; Guiying, W.; Jipeng, Z. The estimation of China’s provincial capital stock: 1952–2000. Econ. Res. J. 2004, 10, 35–44. [Google Scholar]
  29. Wu, J.S.; Liu, H.; Peng, J.; Ma, L. Hierarchical structure and spatial pattern of China’s urban system: Evidence from DMSP/OLS nightlight data. Acta Geogr. Sin. 2014, 69, 759–770. [Google Scholar]
  30. Li, J.; Xu, B. Curse or blessing: How does natural resource abundance affect green economic growth in China. Econ. Res. J. 2018, 53, 151–167. [Google Scholar]
  31. Lin, B.; Tan, R. Economic agglomeration and green economy efficiency in China. Econ. Res. J. 2019, 54, 119–132. [Google Scholar]
  32. Liu, Q.; Lu, Y. Firm investment and exporting: Evidence from China’s value-added tax reform. J. Int. Econ. 2015, 97, 392–403. [Google Scholar] [CrossRef]
  33. Quan, X.; Li, C. Cost stickiness mitigation effect of intelligent manufacturing: On a quasi-natural experiment of Chinese intelligent manufacturing demonstration project. Econ. Res. J. 2022, 4, 68–84. (In Chinese) [Google Scholar]
Figure 1. Kernel density distribution before and after PSM.
Sustainability 15 16734 g001
Figure 2. Parallel trend test.
Sustainability 15 16734 g002
Figure 3. Distribution of coefficient estimates after stochastic treatment.
Sustainability 15 16734 g003
Table 1. Definition of variables and descriptive statistics.
Type of VariableDefinition of VariablesVariable SymbolMeanSDMedian
Explained variablesGreen total factor productivityGtfp0.9980.0540.997
Core explanatory variablesDummy variable for urban e-commerce transformation policiesEco_city × Time0.1100.3130.000
Control variablesForeign direct investment as a share of GDPFdi0.0190.0200.012
Natural logarithm of GDP per capitaPgdp10.3800.76710.424
Local government fiscal expenditure as a share of GDPGov0.1770.0960.154
Import and export as a share of GDPTrade0.1680.3280.064
Urbanization rateUrban3.9200.3113.926
Table 2. Results of the propensity score matching balance test.
VariableSampleMean Difference TestStandardized Deviation Test
Treatment Group MeanControl Group Meant-Value
(p-Value)
Standardized DeviationDeviation Drop in Deviation (%)
FdiBefore matching0.024560.01787.02 (0.000)33
After matching0.024570.024060.37 (0.710)2.592.4
PgdpBefore matching11.24810.27329.12 (0.000)160.2
After matching11.24511.2430.06 (0.953)0.399.8
GovBefore matching0.155190.1799−5.40 (0.000)−29.1
After matching0.155260.150121.14 (0.255)679.2
TradeBefore matching0.30910.1508510.24 (0.000)45.8
After matching0.305820.300260.23 (0.822)1.696.5
UrbanBefore matching4.23443.88125.52 (0.000)140.9
After matching4.23374.2414−0.63 (0.532)−3.197.8
Table 3. Test results of the impact of the construction of national e-commerce model cities on green total factor productivity.
(1)(2)(3)(4)(5)(6)
Eco_city × Time0.017 ***0.016 ***0.016 ***0.015 ***0.014 ***0.014 ***
(3.95)(3.71)(3.72)(3.39)(3.29)(3.31)
Fdi −0.375 ***−0.369 ***−0.352 ***−0.343 ***−0.343 ***
(−4.96)(−4.85)(−4.60)(−4.49)(−4.48)
Pgdp −0.004−0.010−0.009−0.009
(−0.59)(−1.50)(−1.28)(−1.33)
Gov −0.061 **−0.058 **−0.058 **
(−2.42)(−2.30)(−2.30)
Trade −0.009 **−0.010 **
(−2.39)(−2.41)
Urban 0.005
(0.38)
_cons0.956 ***0.969 ***1.004 ***1.073 ***1.061 ***1.045 ***
(139.09)(131.79)(16.85)(16.28)(16.07)(13.25)
YearYesYesYesYesYesYes
CityYesYesYesYesYesYes
N373637363736373637363736
R20.1080.1140.1140.1160.1170.117
Note: ** and *** denote significance at 5% and 1% significance levels, respectively, with t-values in parentheses.
Table 4. Counterfactual test for the point at which the change in policy occurs.
(1)(2)(3)(4)
Eco_cityplacebo40.005
(1.03)
Eco_cityplacebo5 0.002
(0.37)
Eco_cityplacebo6 −0.001
(−0.24)
Eco_cityplacebo7 −0.007
(−0.95)
Fdi−0.347 ***−0.350 ***−0.354 ***−0.358 ***
(−4.52)(−4.56)(−4.61)(−4.66)
Pgdp−0.009−0.010−0.010−0.010
(−1.38)(−1.40)(−1.41)(−1.41)
Gov−0.066 ***−0.067 ***−0.069 ***−0.069 ***
(−2.61)(−2.68)(−2.73)(−2.77)
Trade−0.010 **−0.010 **−0.010 **−0.010 **
(−2.52)(−2.53)(−2.52)(−2.49)
Urban0.0030.0030.0030.004
(0.22)(0.22)(0.23)(0.25)
_cons−0.347 ***−0.350 ***−0.354 ***−0.358 ***
(−4.52)(−4.56)(−4.61)(−4.66)
YearYesYesYesYes
CityYesYesYesYes
N3736373637363736
R20.1150.1150.1140.114
Note: ** and *** denote significance at 5% and 1% significance levels, respectively, with t-values in parentheses.
Table 5. Robustness test of transformed matching methods.
(1)(2)(3)(4)
Radius MatchingRadius MatchingKernel MatchingKernel Matching
Eco_city × Time0.034 ***0.014 ***0.037 ***0.014 ***
(8.39)(3.05)(10.28)(3.53)
Fdi −0.151 * −0.198 ***
(−1.69) (−2.69)
Pgdp 0.006 0.001
(0.69) (0.16)
Gov −0.035 −0.048 *
(−1.33) (−1.94)
Trade −0.013 * −0.023 ***
(−1.91) (−3.82)
Urban 0.007 0.016
(0.33) (0.94)
_cons0.999 ***0.889 ***0.998 ***0.897 ***
(715.50)(8.14)(907.26)(10.38)
YearYesYesYesYes
CityYesYesYesYes
R20.0380.1900.0360.157
Note: * and *** denote significance at 10% and 1% significance levels, respectively, with t-values in parentheses.
Table 6. Heterogeneity analysis of large and small and medium-sized cities.
(1)(2)
Large CitiesSmall and Medium Cities
Eco_city × Time0.016 **0.013
(2.25)(1.64)
Fdi−0.579 ***−0.122
(−4.13)(−1.61)
Pgdp0.0100.012 ***
(1.11)(3.86)
Gov−0.0090.040 **
(−0.20)(2.23)
Trade−0.020 **−0.004
(−2.10)(−1.13)
Urban0.078 **0.004
(2.45)(0.39)
_cons0.599 ***0.847 ***
(5.68)(25.06)
YearYesYes
CityYesYes
N15292207
R20.0730.027
Note: ** and *** denote significance at 5% and 1% significance levels, respectively, with t-values in parentheses.
Table 7. Heterogeneity analysis of eastern, central, and western cities.
(1)(2)(3)
Eastern CitiesCentral CitiesWestern Cities
Eco_city × Time0.015 *0.023 ***0.002
(1.82)(3.63)(0.28)
Fdi−0.399 ***−0.247 **−0.038
(−2.86)(−2.51)(−0.18)
Pgdp0.000−0.027 ***0.024 ***
(0.02)(−2.79)(4.65)
Gov−0.090 *−0.061 *0.035
(−1.82)(−1.68)(1.07)
Trade−0.011 *0.003−0.009
(−1.89)(0.23)(−1.37)
Urban−0.0120.044 ***−0.015
(−0.30)(2.81)(−0.94)
_cons1.034 ***1.061 ***0.798 ***
(5.48)(10.29)(14.26)
YearYesYesYes
CityYesYesYes
N14911288957
R20.1140.1990.047
Note: *, ** and *** denote significance at 10%, 5% and 1% significance levels, respectively, with t-values in parentheses.
Table 8. Heterogeneity analysis of resource-based and non-resource-based cities.
(1)(2)
Resource-Based CitiesNon-Resource-Based Cities
Eco_city × Time0.0120.012 **
(1.44)(2.47)
Fdi−0.146−0.145 *
(−1.15)(−1.66)
Pgdp0.0120.002
(1.33)(0.25)
Gov0.015−0.076 **
(0.43)(−2.42)
Trade−0.002−0.010 **
(−0.15)(−2.05)
Urban0.017−0.022
(0.91)(−0.88)
_cons0.813 ***1.026 ***
(8.30)(8.69)
YearYesYes
CityYesYes
N14662270
R20.1450.117
Note: *, ** and *** denote significance at 10%, 5% and 1% significance levels, respectively, with t-values in parentheses.
Table 9. Mechanism test of industrial structure upgrading effect.
(1)(2)(3)(4)(5)(6)
IS_TSIS_TS < p50IS_TS > p50IS_UpgradeIS_Upgrade < p50IS_Upgrade > p50
Eco_city × Time0.071 ***0.057 *−0.0140.025 ***0.038 ***−0.004
(4.39)(1.68)(−1.50)(6.37)(10.07)(−0.45)
Fdi−1.089 ***−1.378 ***−0.262 *−0.223 ***−0.371 ***−0.048
(−3.78)(−2.66)(−1.66)(−3.27)(−5.44)(−0.43)
Pgdp−0.341 ***−0.308 ***−0.280 ***0.061 ***0.032 ***0.047 ***
(−12.46)(−5.03)(−18.96)(17.70)(7.73)(10.35)
Gov1.071 ***1.631 ***0.1010.192 ***0.385 ***0.033
(10.86)(7.01)(1.29)(9.96)(10.22)(1.61)
Trade−0.007−0.003−0.017−0.003−0.008 ***−0.002
(−0.40)(−0.12)(−1.56)(−0.85)(−2.62)(−0.32)
Urban0.0620.0900.302 ***0.246 ***0.169 ***0.184 ***
(0.96)(0.74)(8.68)(21.49)(11.12)(12.79)
_cons3.664 ***3.239 ***2.078 ***0.622 ***1.303 ***0.975 ***
(11.44)(4.76)(12.26)(16.18)(22.00)(20.10)
YearYesYesYesYesYesYes
CityYesYesYesYesYesYes
N373618681868373618681868
R20.6350.5660.6360.5050.5410.309
Note: * and *** denote significance at 10% and 1% significance levels, respectively, with t-values in parentheses.
Table 10. Mechanism test of economic agglomeration effect and green technology innovation effect.
(1)(2)(3)(4)(5)(6)
Agag < p50ag > p50TechTech < p50Tech > p50
Eco_city × Time0.226 ***0.190 ***0.0030.023 ***0.032 ***−0.010
(9.96)(4.86)(0.75)(6.11)(8.52)(−1.17)
Fdi−1.188 ***0.337−0.047−0.245 ***−0.352 ***−0.069
(−3.00)(0.50)(−0.86)(−3.64)(−4.98)(−0.66)
Pgdp−0.0520.0310.034 ***0.037 ***0.029 ***0.013 ***
(−1.48)(0.41)(8.32)(10.12)(6.65)(2.75)
Gov−0.833 ***−1.910 ***−0.069 ***0.252 ***0.486 ***0.075 ***
(−6.37)(−3.26)(−4.55)(12.70)(11.85)(3.67)
Trade−0.396 ***−0.464 ***−0.001−0.006−0.008 **−0.004
(−19.24)(−14.35)(−0.38)(−1.56)(−2.24)(−0.55)
Urban−0.495 ***−1.516 ***0.071 ***0.357 ***0.176 ***0.347 ***
(−6.71)(−8.35)(8.27)(26.30)(9.90)(19.33)
_cons2.576 ***5.921 ***−0.412 ***0.424 ***1.291 ***0.685 ***
(6.31)(6.47)(−8.93)(10.11)(19.62)(12.95)
YearYesYesYesYesYesYes
CityYesYesYesYesYesYes
N373618681868345517281727
R20.3170.4220.1330.5340.5400.383
Note: ** and *** denote significance at 5% and 1% significance levels, respectively, with t-values in parentheses.
Disclaimer/Publisher’s Note: The statements, opinions and data contained in all publications are solely those of the individual author(s) and contributor(s) and not of MDPI and/or the editor(s). MDPI and/or the editor(s) disclaim responsibility for any injury to people or property resulting from any ideas, methods, instructions or products referred to in the content.

