Article

Changes in Soil Chemistry and Soil Nutrient Stocks after 30 Years of Treated Municipal Wastewater Land Disposal: A Natural Experiment

1
Institute of Environmental Science and Research (ESR), Christchurch 8041, New Zealand
2
School of Physical and Chemical Sciences, University of Canterbury, Christchurch 8041, New Zealand
3
Lowe Environmental Impact, Palmerston North 4410, New Zealand
*
Author to whom correspondence should be addressed.
Sustainability 2023, 15(23), 16230; https://doi.org/10.3390/su152316230
Submission received: 25 September 2023 / Revised: 10 November 2023 / Accepted: 13 November 2023 / Published: 23 November 2023
(This article belongs to the Section Waste and Recycling)

Abstract

:
The benefits and risks of irrigation with treated municipal wastewater (TMW) on soil quality and crop production have been largely investigated. However, there is a lack of knowledge on the effect of plant species on the interaction between soil quality and TMW. We leveraged a natural experiment investigating the effect of 30 years of TMW irrigation at a rate of 4 m y−1 (eq. 1860 kg N ha−1 y−1, and 264 kg P ha−1 y−1) on a sandy soil under pine plantation and pasture, compared with soil under New Zealand native Kunzea robusta. There was a consistent increase in soil P with irrigation under both pasture (Olsen P in topsoil 40 mg kg−1 vs. 74 mg kg−1) and pine (18 mg kg−1 vs. 87 mg kg−1), which was significant down to 2 m deep. The pH, electrical conductivity, total organic C and N, inorganic N and Na were affected by both irrigation and vegetation type. Beyond P soil accumulation, there was no evidence of soil degradation by Na or trace element accumulation. Estimations of nutrient mass balance indicated that 80% and 60% of the total applied P was lost under pine and pasture, respectively. This percentage increased to 96% and 83% for N, respectively. Although plant species had a significant effect on soil quality and N and P losses from TMW-irrigated areas, adjusting irrigation rates to levels that can be managed by plants is the only way to design sustainable TMW irrigation schemes.

1. Introduction

Three-quarters of the wastewater produced in developed countries is treated before it is discharged into the environment [1]. Depending on the treatment process, treated municipal wastewater (TMW) contains elevated concentrations of organic matter, macro- and micronutrients, and contaminants, which can cause water pollution and eutrophication in receiving environments [2,3,4]. Applying TMW to land can provide an extra level of protection to ground and surface waters because the plants and other organisms in terrestrial ecosystems can metabolise some of the macro- and micronutrients added to the TMW [5]. They can also degrade or attenuate, to a certain extent, some other contaminants [6,7].
In countries with a water deficit, TMW is an important alternative water source that can alleviate or substitute the extraction of freshwater resources [6]. Research worldwide has demonstrated the benefits of TMW irrigation as an alternative water source, with the extra opportunity to recover plant nutrients to grow a wide range of plants, such as crops, fruit trees, timber trees, or recreational areas such as golf courses or urban parks [5,8,9,10,11,12,13,14,15,16]. No differences in plant health and growth [5,15,16] or increased crop yield with TMW irrigation compared with freshwater irrigation or no irrigation were found [5,10,11,13,16]. Although there are no records of the deleterious effect of TMW irrigation on plant growth, there are risks associated with the reuse of TMW. Pedrero and colleagues [5] demonstrated the potential for the plant uptake of trace elements after TMW irrigation; however, the concentrations were not considered to be concerning for human health. Asgari and Cornelis [17] found no significant accumulation of trace elements in soil irrigated with TMW compared with freshwater irrigation; however, Cd, Cr, and Ni were taken up by crops at concentrations that exceeded guideline values.
Changes in soil quality due to repeated TMW irrigation may be more detrimental than the impacts of TMW on plant health due to the long-term consequences of soil degradation. Results have consistently shown a general increase in P, Na, electrical conductivity (EC), and trace elements after long-term TMW irrigation compared with soils that received freshwater irrigation [14,18,19,20,21]. An increase in salinity (EC) and sodicity (Na, SAR—sodium adsorption ratio, and ESP—exchangeable sodium percentage) of TMW-irrigated soils can reduce soil fertility and soil permeability through Na-induced clay dispersion [19,22]. The results of other soil parameters, such as pH, texture, total N (TN), or total organic C (TOC), are less consistent between experiments. Angin and colleagues [18], for example, demonstrated a significant decrease in soil pH after 30 years of TMW irrigation of sandy alluvial soils, while Bedbabis and co-authors [10] reported an increase in soil pH of a sandy-silt soil irrigated for 10 years. Qian and Mecham [14] reported no differences in soil organic carbon (SOC) in five golf courses irrigated with TMW for 5–30 years compared with the other five that were irrigated just with freshwater. However, Khajanchi-Lal and colleagues [21] demonstrated an increase in TOC in different crop soils irrigated with TMW compared with groundwater. The differences in the time periods of irrigation, soil types, and vegetation make it difficult to draw conclusions.
Beyond TMW, the type of vegetation irrigated can also significantly change the effects that TMW has on the soil. Plants can affect nutrient cycling in the soil in different ways, for example, through biological nitrification inhibition [23,24]. In an experiment where TMW was applied to different plant species, Meister and co-authors [25] demonstrated that some soil chemical properties (SOC, TN, Mg, and Na) were as affected by four-year TMW irrigation as they were by the type of vegetation. They also demonstrated that the effect of irrigation on some soil parameters (such as NH4+, Na, Cr, and Li) was different depending on the type of vegetation present.
Understanding the relationships between soil, vegetation, and TMW is important for well-designed TMW irrigation systems that are sustainable in the long term, rather than the normal irrigation design based solely on TMW quality and soil properties. This work presents soil chemistry results of a natural experiment [26] of a TMW irrigation site planted with Pinus radiata and pasture irrigated for 30 years, with some areas that did not receive any irrigation during that period but were managed similarly. We aimed to quantify the changes in soil properties in a soil profile after a long-term TMW irrigation and determine how vegetation types can modify those changes, including a soil under native vegetation that did not receive irrigation for comparison. Further, we sought to estimate a mass balance of nutrients in the soil–plant systems.

2. Materials and Methods

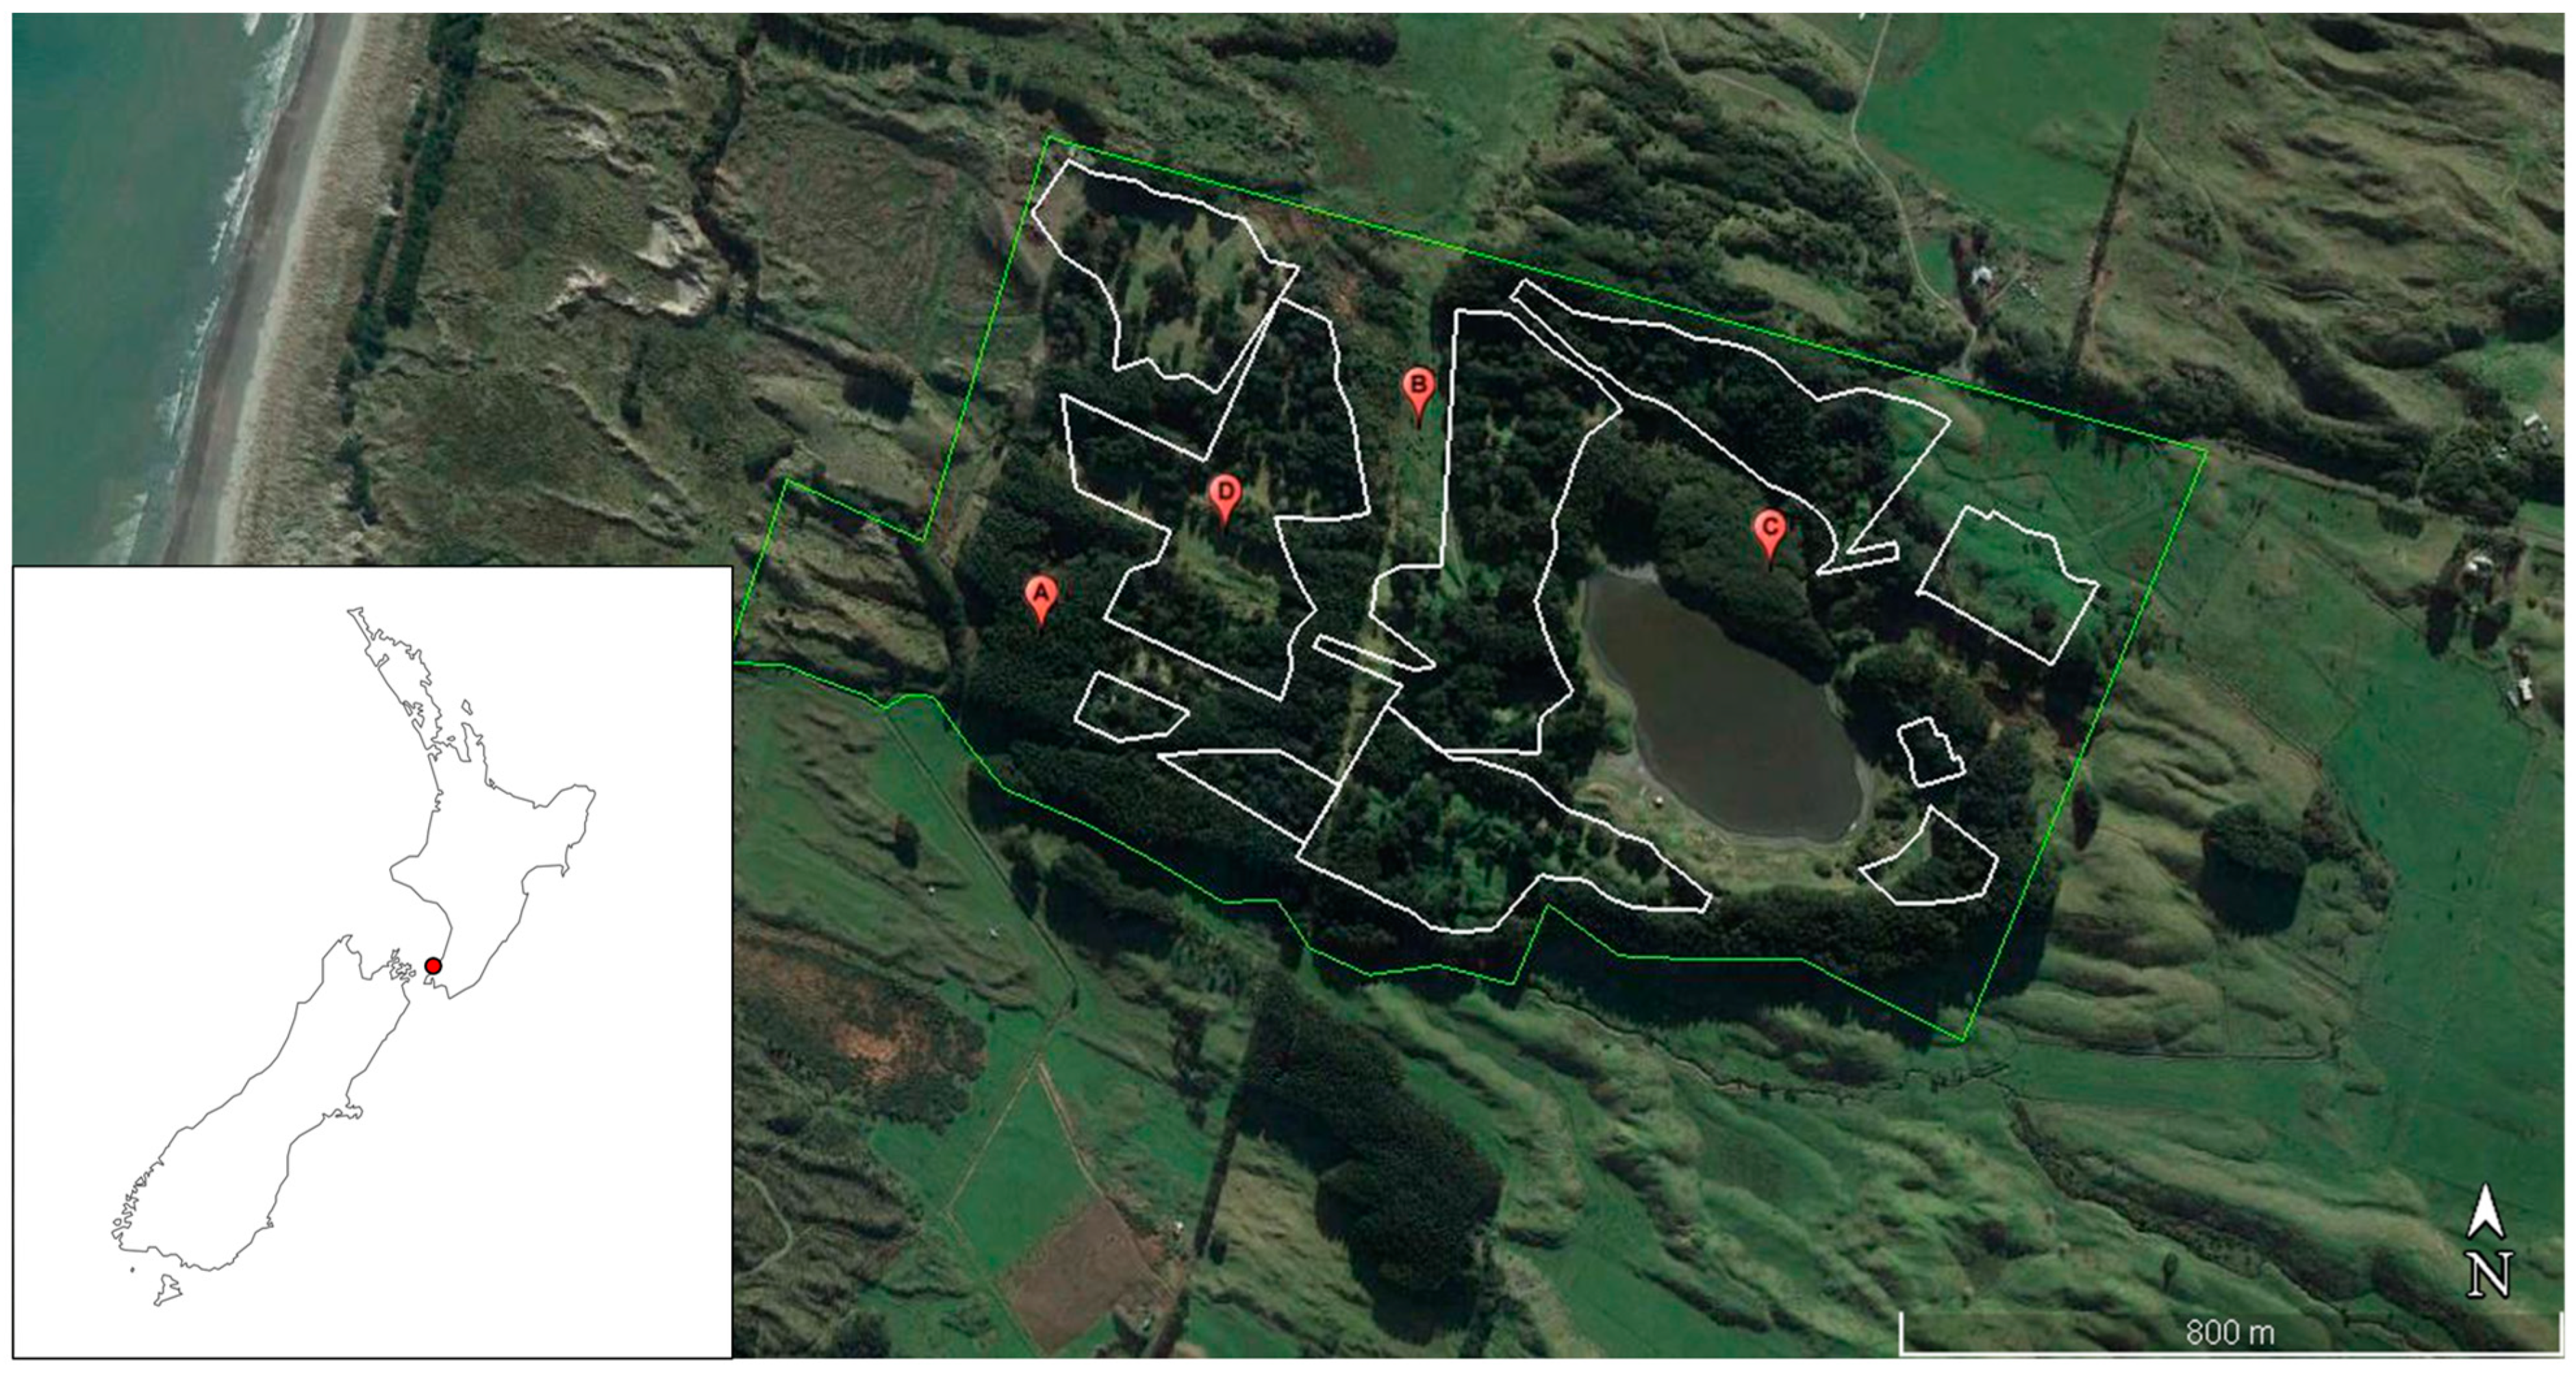
2.1. Study Site and Soil Collection

Since 1987, TMW from a wastewater treatment plant that serves a population of 19,000 people in New Zealand (NZ) (40°37′07″ S, 175°15′37″ E) has been pumped 7 km to a 7 ha effluent infiltration pond (40°37′47″ S, 175°11′22″ E), with the remaining volume sprayed over 40.5 ha of Pinus radiata D. Don plantation and grazed pasture (mostly Lolium perenne L.) (Figure 1). Located 2 km from the sea, the total area of operation was 110 ha, and the underlying soil is classified as Sandy Recent [27].
The irrigation system has been applying between 75 and 100 mm of TWW once per week to the 40.5 ha area, with an approximate annual irrigation rate of 4000 mm y−1, ranging between 3700 mm y−1 and 4400 mm y−1 depending on seasons, years, and areas of the irrigated land. Since 2016, the wastewater has been regularly monitored in different irrigation pumps and in the pond for the parameters shown in Table 1. The non-irrigated area also contained sections with radiata pine and pasture, as well as remnants of indigenous vegetation, comprised mostly of kānuka (Kunzea robusta de Lange & Toelken) (Figure 1).
Ten locations were selected randomly from each plant cover type (pine, pasture, and kānuka) and irrigated and non-irrigated areas (Figure 1). In each location, the soil profile was sampled at different depths (0–7.5 cm, 7.5–15 cm, 15–30 cm, 30–45 cm, 45–60 cm, 60–80 cm) using a soil corer. At each sampling point, three to five cores in an area not bigger than 1 m2 were dug to obtain a sufficient sample for chemical analysis. An additional three soil cores per plant type and irrigation were dug with a soil auger to reach the water table, with samples collected at 100 cm, 200 cm, and/or at the water table. The 339 soil samples were transported in chilly bins to the laboratory, passed through a 4 mm stainless steel sieve, and stored at −20 °C until analysis of inorganic N. For the rest of the analyses, the soil samples were dried at room temperature for 15 days, and a subsample was dried at 104 °C for one week to calculate soil moisture.
Figure 1. Aerial image of the area utilised for long-term TMW irrigation, indicated by a red dot in the left figure The area of operation is marked in green. Area within the white lines had been irrigated since 1987. Areas outside of the lines had not been irrigated in that period. Markers represent approximate areas around which samples were collected: A: non-irrigated pine, B: non-irrigated pasture, C: non-irrigated kānuka, D: irrigated pine and pasture.
Sustainability 15 16230 g001

2.2. Chemical Analysis

All samples collected were analysed for inorganic N, pH, and EC. NO3-N and NH4+-N were determined in 2 M KCl soil extracts [28] using an FIA—Flow Injection Analyser (QuikChem 8500, Lachat Instruments, Milwaukee, WI, USA). The pH and electrical conductivity (EC) were analysed in a 1:5 soil/water extraction with a pH and conductivity meter, respectively (Con700 and pH700, respectively, Eutech Instruments, Singapore). The following analyses were performed in 5–10 replicates per selected area and at every second soil depth (see Supplementary Material). Total N (TN) and total organic C (TOC) were determined using an Vario-Max CN Elementar Analyser (Elementar®, Langenselbold, Germany). The Olsen-extractable P was extracted with 0.5 M NaHCO3 [28], and the extracts were analysed with a SmartChem 200 Discrete Analyzer (AMS/Alliance Instruments, Frépillon, France). Total P (TP) was extracted by the Ignite P method described in [28] and analysed with QuikChem 8500 FIA. Phosphate retention was analysed only in pasture and pine areas, irrigated and non-irrigated. This was calculated as the decrease in P in a 1000 mg L−1 P solution at pH 4.6 after shaking for 16 h [29]. After that period, the remaining P in the solution was analysed by FIA. Total elements were microwave acid extracted (MARSXpress, CEM, Matthews, NC, USA) according to the equipment specifications (0.5 g soil, 4.0 mL 69% trace element grade HNO3, and 4.0 mL 30% H2O2) and analysed using an inductively coupled plasma optical emission spectrometry (ICP-OES Varian 720ES, ICP-OES (Varian 720-ES, Varian Inc., Walnut Creek, CA, USA). The results were corrected for samples oven-dried at 104 °C for one week.

2.3. Data Analysis

Soil C, N, P, and Na stocks were calculated. Given the raw sand nature of the soil, we assumed that sample density was equivalent to soil density. We determined sample density by weighing a known volume of dry sample in 16 samples selected randomly from different locations, treatments, and soil depths from the 339 collected. Sample density was calculated for the remaining samples as a function of TOC (p < 0.0001, R2 = 0.91, see Supplementary Material). The element concentration of each sample was used to calculate the total mass of the selected element at that soil depth. For the soil depths where analyses were not performed, an average of the concentration of the samples below and above was used. Only the data of 0–80 cm of soil was used for these calculations.
Table 1. Chemical parameters of the treated wastewater.
Parameter 1# Analysis
(N =)
Mean ± SE 2MedianRangeDW 3 StandardsWW 4 StandardsApplication 5
kg ha−1 y−1
TSS23.3, 3.8 10–150
EC (mS m−1)12168 ± 1.966(29–167) 100–700
TN246, 47 15–701860
NO3-N12312 ± 1.23.9(<0.005–61.8)11.310–50480
NH4+-N1236.2 ± 0.990.32(<0.005–37) 248
Inorganic N12518 ± 1.220(<0.005–73) 720
TP26.1, 7.1 264
DR-P 61231.3 ± 0.20.1(<0.005–10) 2–3052
Ca211, 12 460
Mg23.1, 3.3 128
K223, 24 940
Na263, 65 2560
Zn (μg L−1)455.8 ± 1.81.0(1–54) 231
Cu (μg L−1)456.0 ± 1.82.0(<1–59)2000 0.23
As (μg L−1)451.4 ± 0.3<1(<1–10)10 0.06
B (μg L−1)43163 ± 12160(<5–614)2400 6.5
Cd (μg L−1)450.1 ± 0<0.06(<0.06–2)4 4 (g ha−1 y−1)
Cr (μg L−1)451.4 ± 0.30.9(<0.15–12)50 0.06
Hg (μg L−1)45<0.5<0.5<0.57 <20 (g ha−1 y−1)
Ni (μg L−1)45<8<8<880 <0.32
Pb (μg L−1)1251<1(<1–2)10 0.04
SAR 714.4 8–10
1 Units are mg L−1, unless otherwise specified. 2 Mean ± SE: mean and standard error for parameters where N > 3; otherwise, the values are indicated. 3 DW standards: drinking water standards for NZ [30]. 4 WW standards: range from review of different countries [6]. 5 Application rate calculated for the average annual irrigation of 4000 mm y−1 and the average concentration value in the TMW. 6 DR-P: dissolved reactive phosphorus. 7 SAR: sodium adsorption ratio calculated based on Ayers and Westcot [31], using total concentration of Na, Ca, and Mg in the TMW in meq L−1. # number of samples analysed.
An analysis of variance (three-way ANOVA) was calculated to assess significant differences in soil chemical parameters depending on irrigation, plant, depth, and their interactions (Table 2). Further, a one-way ANOVA was calculated to assess differences between treatments at each depth (Supplementary Material). The model assumptions of normality and homoscedasticity were assessed by plotting the residuals in Q-Q plots and Residuals vs. Fitted plots. If the assumptions were not fulfilled, the data were Log-transformed. A Tukey’s Honestly Significant Difference test was performed to determine significant differences between groups. When assumptions were not fulfilled even after data transformations, a non-parametric Kruskall–Wallis test was used instead. The soil stocks of C, N, P, and Na were compared between treatments with a one-way ANOVA, and differences between groups were assessed with Tukey’s test. A principal component analysis (PCA) of the standardized results of the topsoil was performed, and results were plotted and grouped by treatments. These calculations were completed with RStudio version 4.2.2 (R Core Team, 2021) and the packages stats [32] and agricolae [33]. The graphs were created with the packages ggplot2 [34] and esquisse [35]. Graphs created with the colour-blind friendly palettes from viridis [36] are shown in Supplementary Material.

3. Results

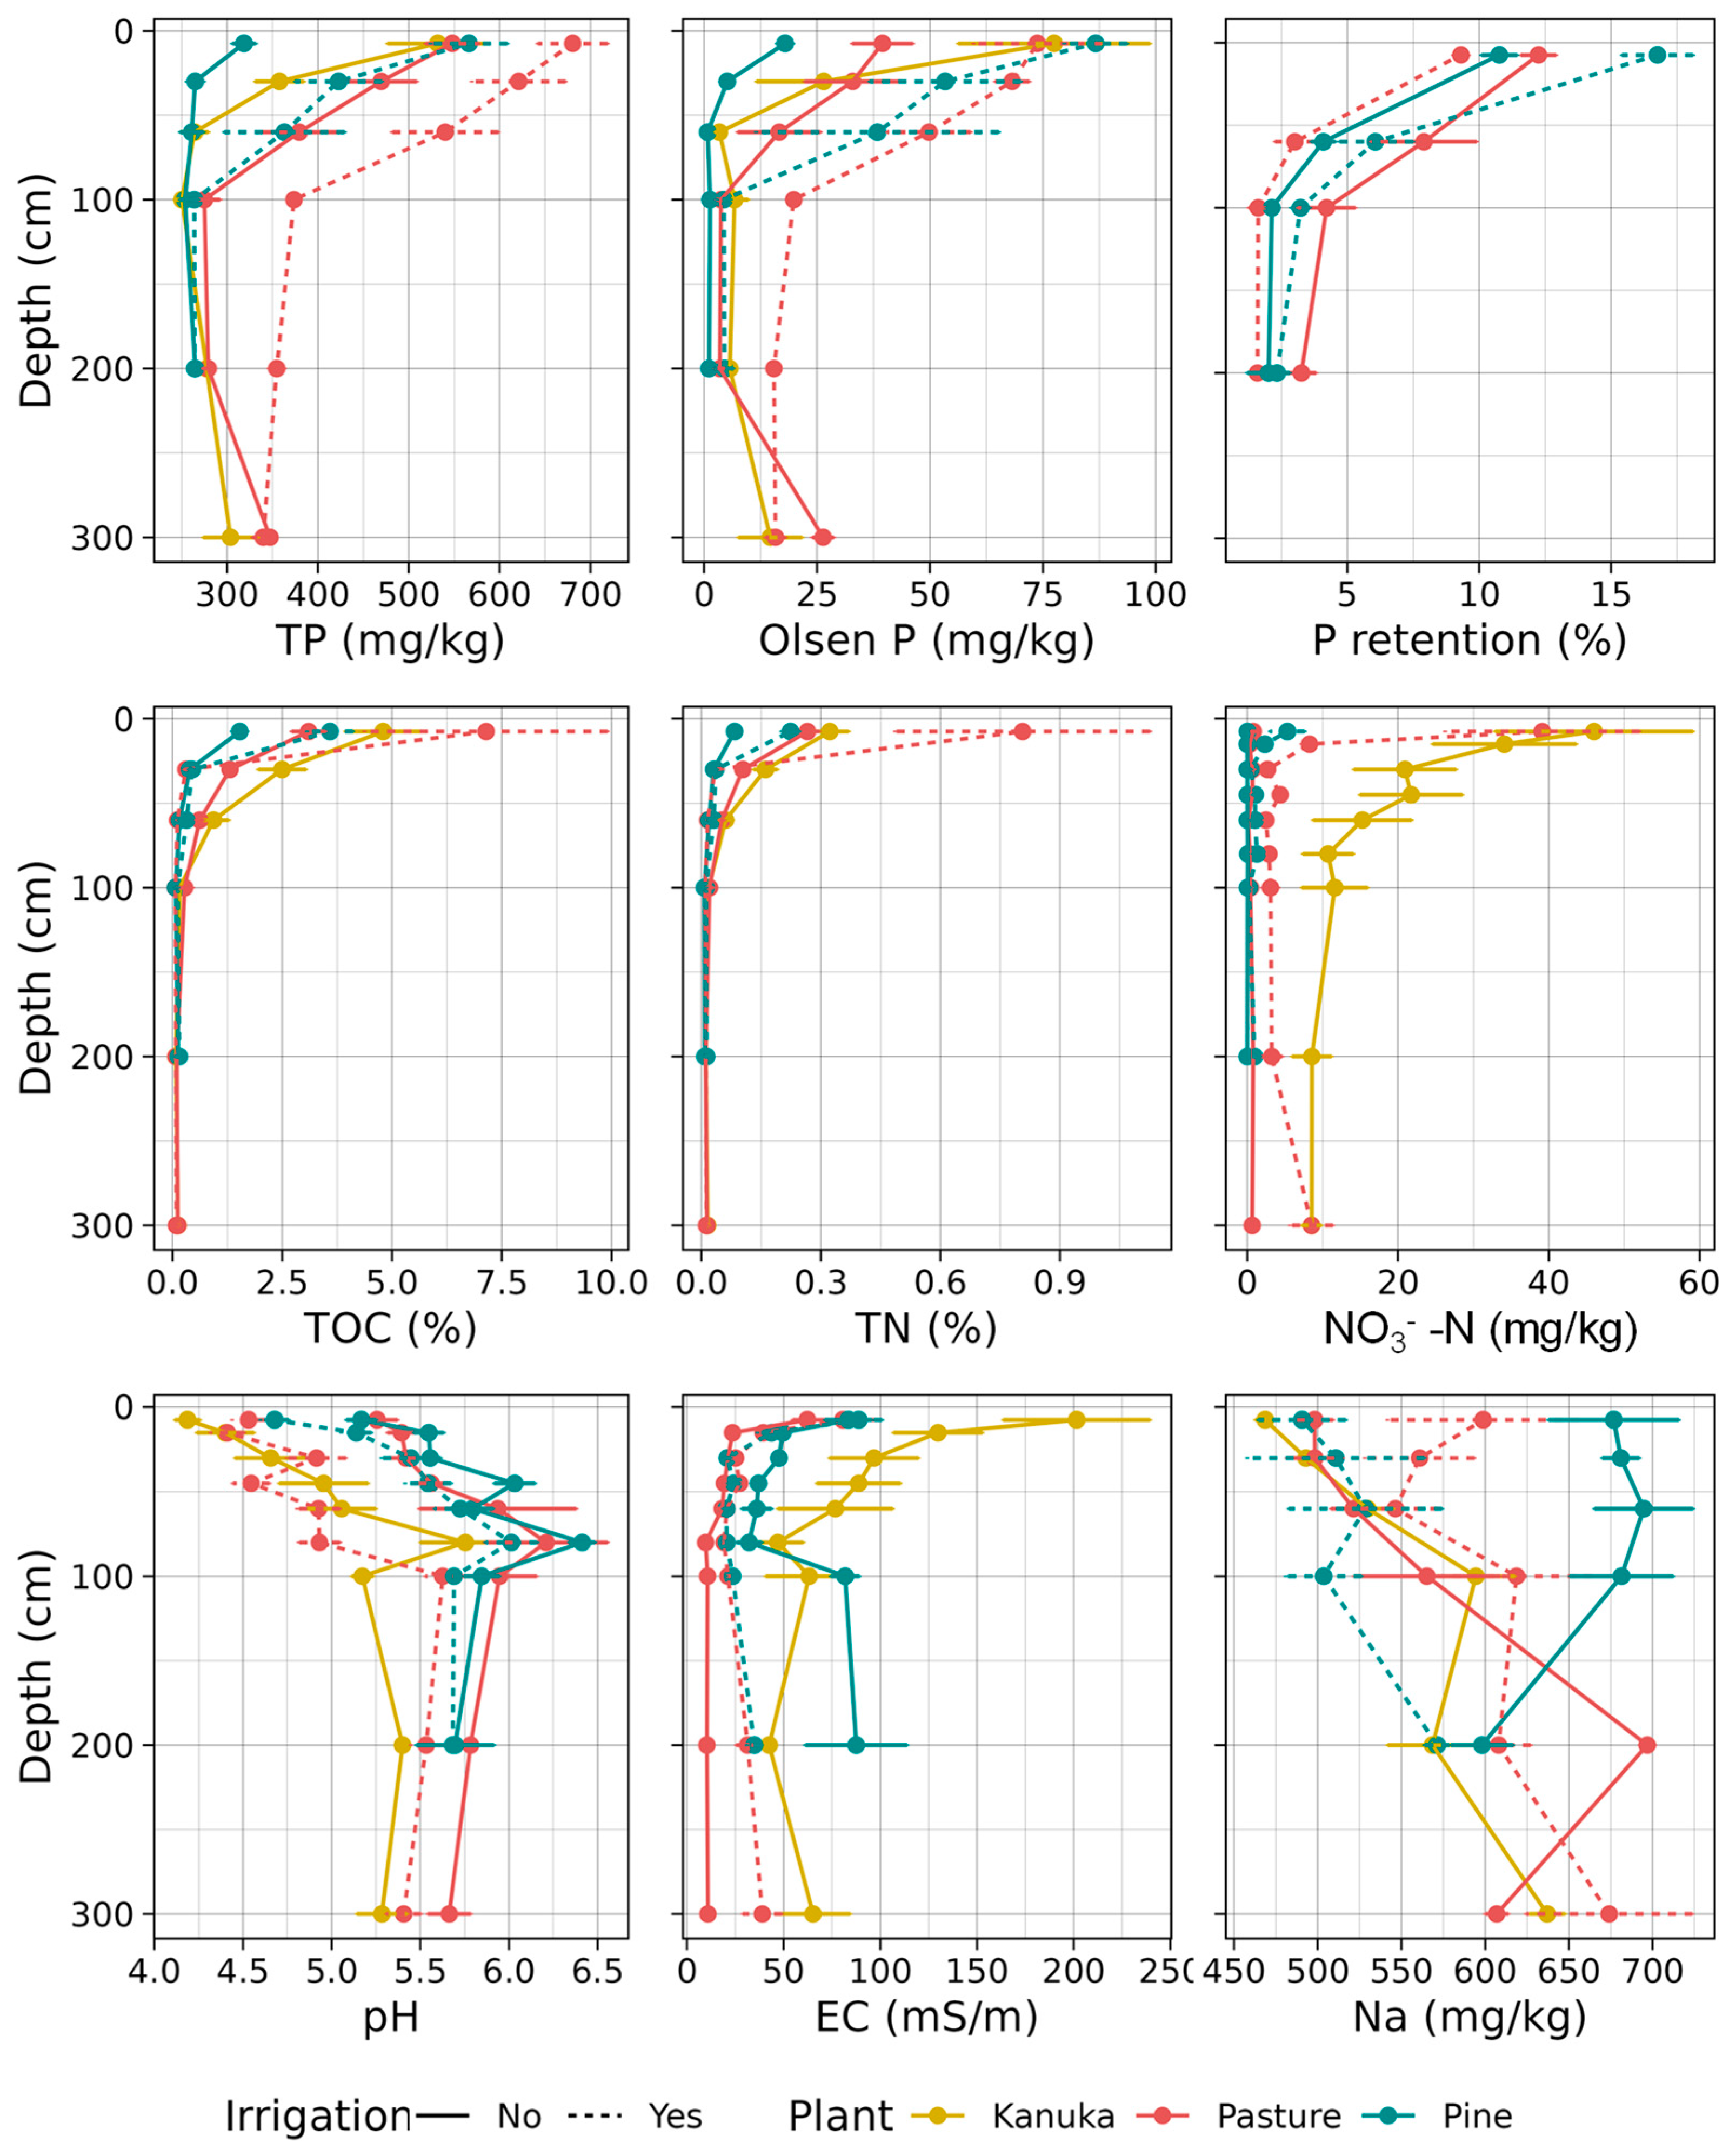
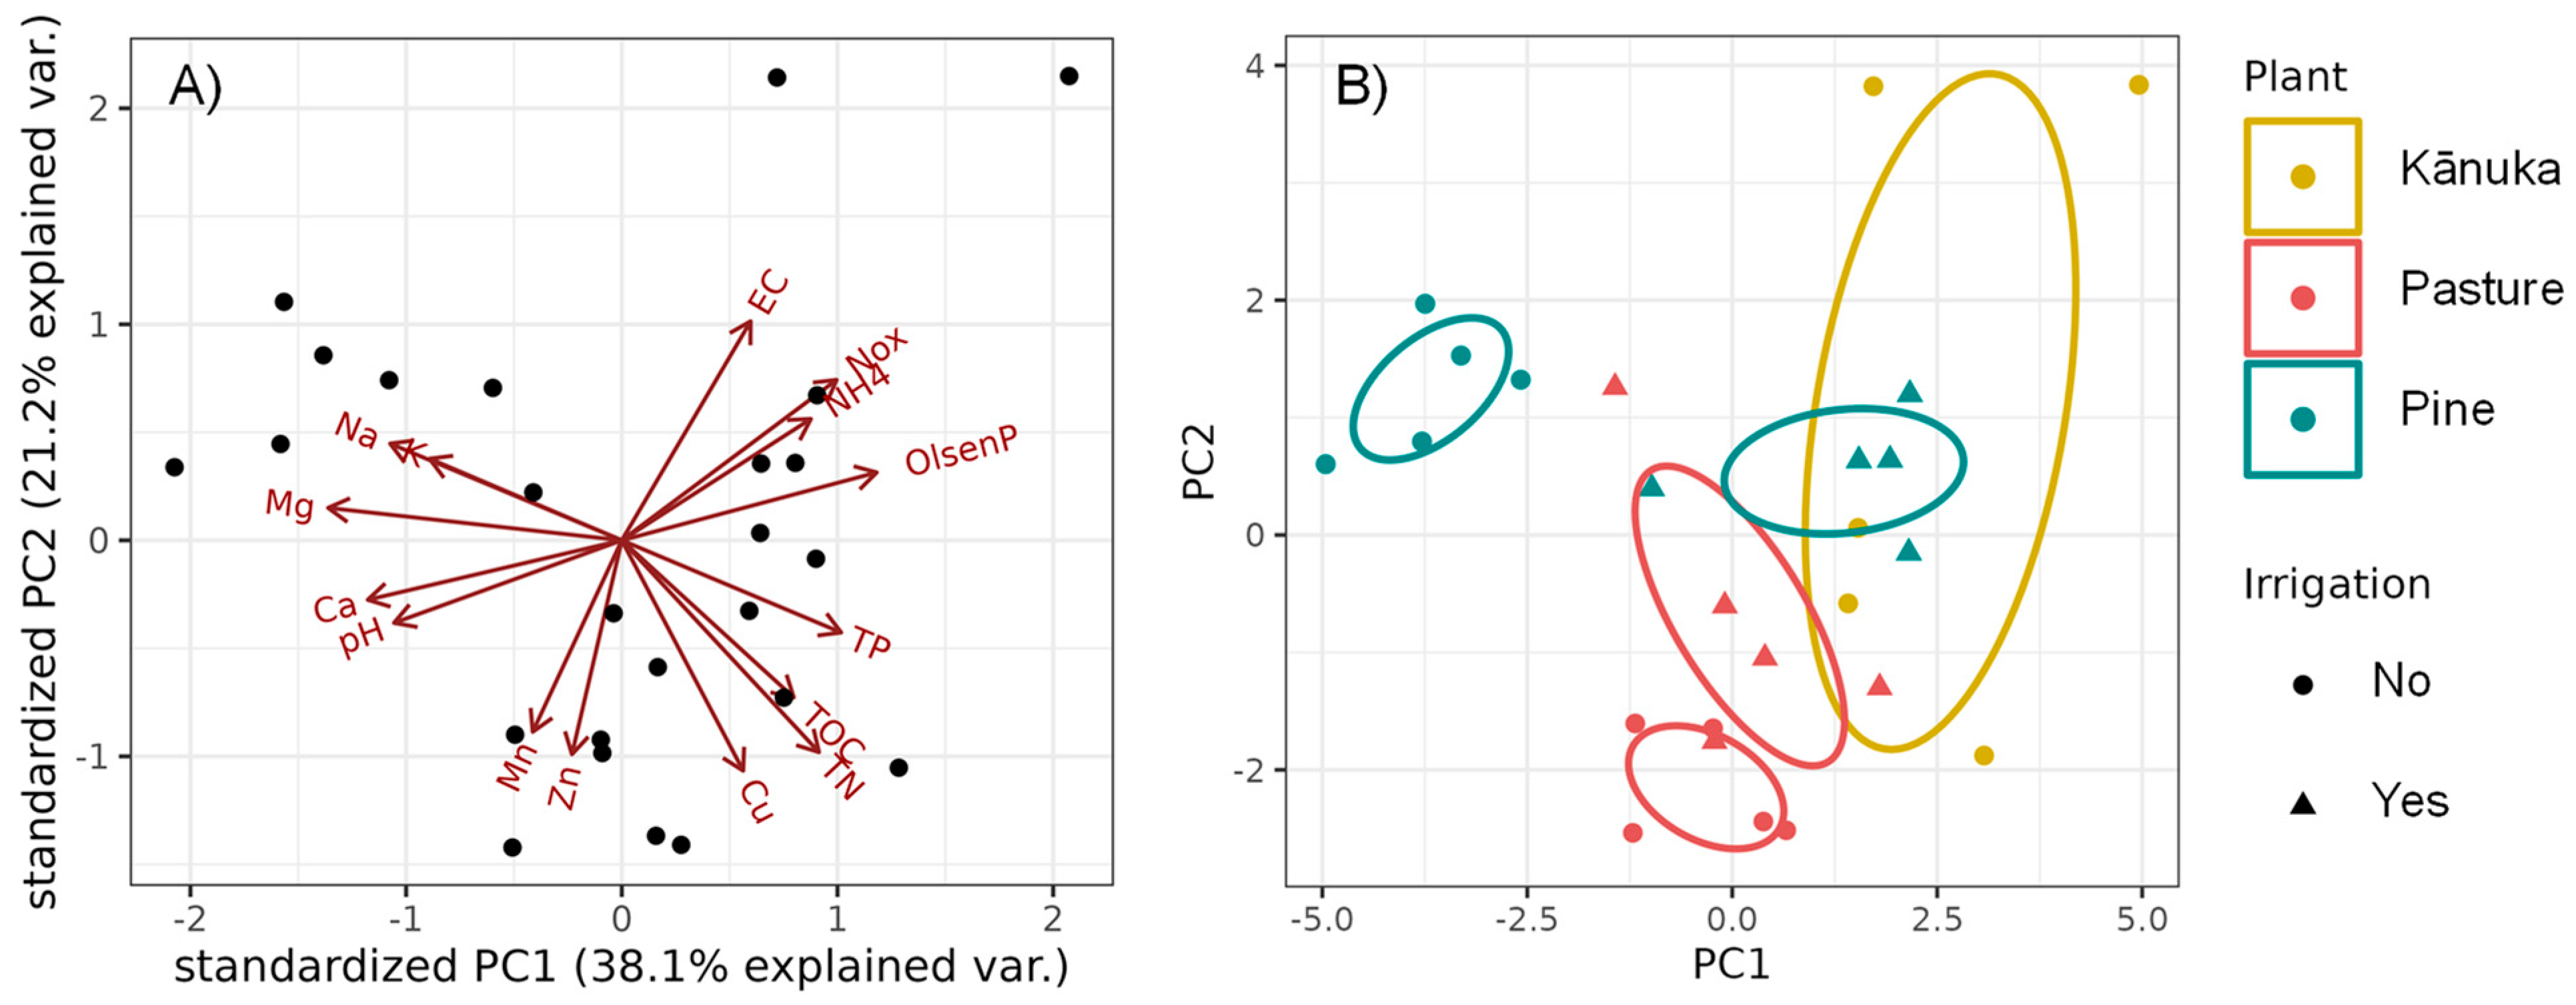
3.1. Changes in Soil Chemical Properties

The concentrations of total P and Olsen extractable P were consistently higher in soils under long-term irrigation in both types of vegetation, and this trend continued down the soil profile (Figure 2 and Table 2). In the topsoil (0–7.5 cm), long-term irrigation increased total soil P by 24% under pasture and 77% under pine, although this difference was only significant under pine according to ANOVA (Supplementary Material). The Olsen P increase due to irrigation was more pronounced, with an 85% increase under pasture and a 380% increase under pine; however, the difference was only significant under pine (Supplementary Material). A higher Olsen P concentration in irrigated areas was consistently observed in the soil profile down to the water table. Soil P was also significantly affected by vegetation type, being consistently higher under pasture than under pine. Soil P under native vegetation (kānuka) was high in the topsoil. TP of 550 mg kg−1 was similar in irrigated pine and non-irrigated pasture, and Olsen P of 75 mg kg−1 was similar in both irrigated vegetation types. The soil P under kānuka significantly decreased in the deeper horizons of the soil profiles, and from 60 cm deep, it was comparable to non-irrigated areas.
Long-term irrigation also significantly affected pH, inorganic N, and Na (Figure 2, Table 2, Supplementary Material), but the differences depended on the type of vegetation (vegetation–irrigation interaction, Table 2). Inorganic N was mostly present as NO3 in soil samples from irrigated areas and from non-irrigated areas under kānuka. NH4+ was the predominant form of inorganic N in non-irrigated areas under pasture and pine. NO3 was higher in irrigated pine and pasture (5 mg kg−1 and 39 mg kg−1, respectively, in the topsoil) compared with the respective non-irrigated areas (<1 mg kg−1 in the topsoil) in all soil depths to the water table. Interestingly, soil NO3 was significantly higher in the whole soil profile under kānuka than the rest of the treatments. NH4+ was less affected by irrigation than NO3 (Table 2), and it was only higher in the topsoil under irrigated pine compared to non-irrigated pine (Supplementary Material). NH4+ was mostly affected by vegetation type, being consistently higher under pasture and kānuka than under pine. Most of the soil N was in the form of organic N, so the results of TN were highly correlated with TOC (Figure 2 and Figure 3, Table 2 and Supplementary Material). TN and TOC were not significantly affected by irrigation, except as an interaction with vegetation type (Table 2). TN and TOC were higher in the topsoil under irrigated areas than under non-irrigated areas of same vegetation type (Figure 2, Supplementary Material). However, from 30 cm, this trend changes depending on the vegetation type, with generally (although not consistently significant) higher TN and TOC under non-irrigated pasture (TOC 1.3% vs. 0.3% at 30 cm) and higher TN and TOC under irrigated pine (TOC 0.32% vs. 0.16% at 60 cm). Although TN under kānuka was not different from other treatments, TOC was generally higher under kānuka than under either pine treatments and irrigated pasture below the topsoil (Figure 2 and Supplementary Material).
Soil pH was significantly affected by irrigation, vegetation, and the interaction of both (Table 2). Irrigation significantly decreased soil pH under both plant types (pine and pasture) in the topsoil and occasionally at deeper soil horizons (Supplementary Material). Soil under kānuka had a significantly lower pH than any other treatment, although this difference was less evident at deeper soil depths (Figure 2 and Supplementary Material). Soil Na was significantly higher under irrigated than non-irrigated pasture, but only at the 0–60 cm soil depths. These results were contrary for pine, where Na was significantly lower under irrigated than non-irrigated. The soil under kānuka had a lower Na concentration in the topsoil horizons than the rest of the treatments, but Na increased with depth (Figure 2). Irrigation did not affect EC and P retention results, except as an interaction with vegetation (Table 2). EC was generally higher under kānuka in the whole soil profile, similar to NO3 results. P retention was only different between treatments in the topsoil, where irrigated pine presented a significantly higher P retention than the rest of the treatments.
The rest of the parameters analysed, i.e., Mg, K, Ca, Mn, and Cu, were not strongly affected by irrigation or the interaction with vegetation (Table 2). K and Ca were significantly lower in irrigated than in non-irrigated soil. However, this difference was minimal (Ca: 0.74% vs. 0.76%, K: 0.12% vs. 0.14%) and non-significant in the ANOVA (Supplementary Material). Mn was significantly lower in irrigated soil than in non-irrigated soil (203 mg kg−1 vs. 217 mg kg−1). Although the ANOVA test identified a significant effect of irrigation on soil Mg and Cu, Tukey’s test did not significantly differentiate the irrigated vs. non-irrigated. Zn was not significantly affected by irrigation. The rest of the analysed trace elements (Cd, Pb, Cr, Ni, As, Hg) were below the detection limit in the soil or did not present significant differences between irrigation vs. non-irrigation or between plant species.
A PCA demonstrated that the chemical parameters in the topsoil (where the biggest differences were identified) were generally different between vegetation type and irrigation (Figure 3). The two first components of the PCA (Figure 3) explained 59.3% of the variance in the topsoil. The grouping of the soil results (Figure 3B) clearly differentiated between vegetation type and irrigation, indicating that soil chemical parameters depended on both irrigation and vegetation type. The variability of results was greater in soil under kānuka compared with the other treatments.
Figure 3. Principal component analysis of the chemical results in the topsoil (0–7.5 cm). (A) Biplot with the variable weighting and the scatterplot. (B) Scatterplot with groups based on plant and irrigation. Ellipse shows confidence regions.
Sustainability 15 16230 g003

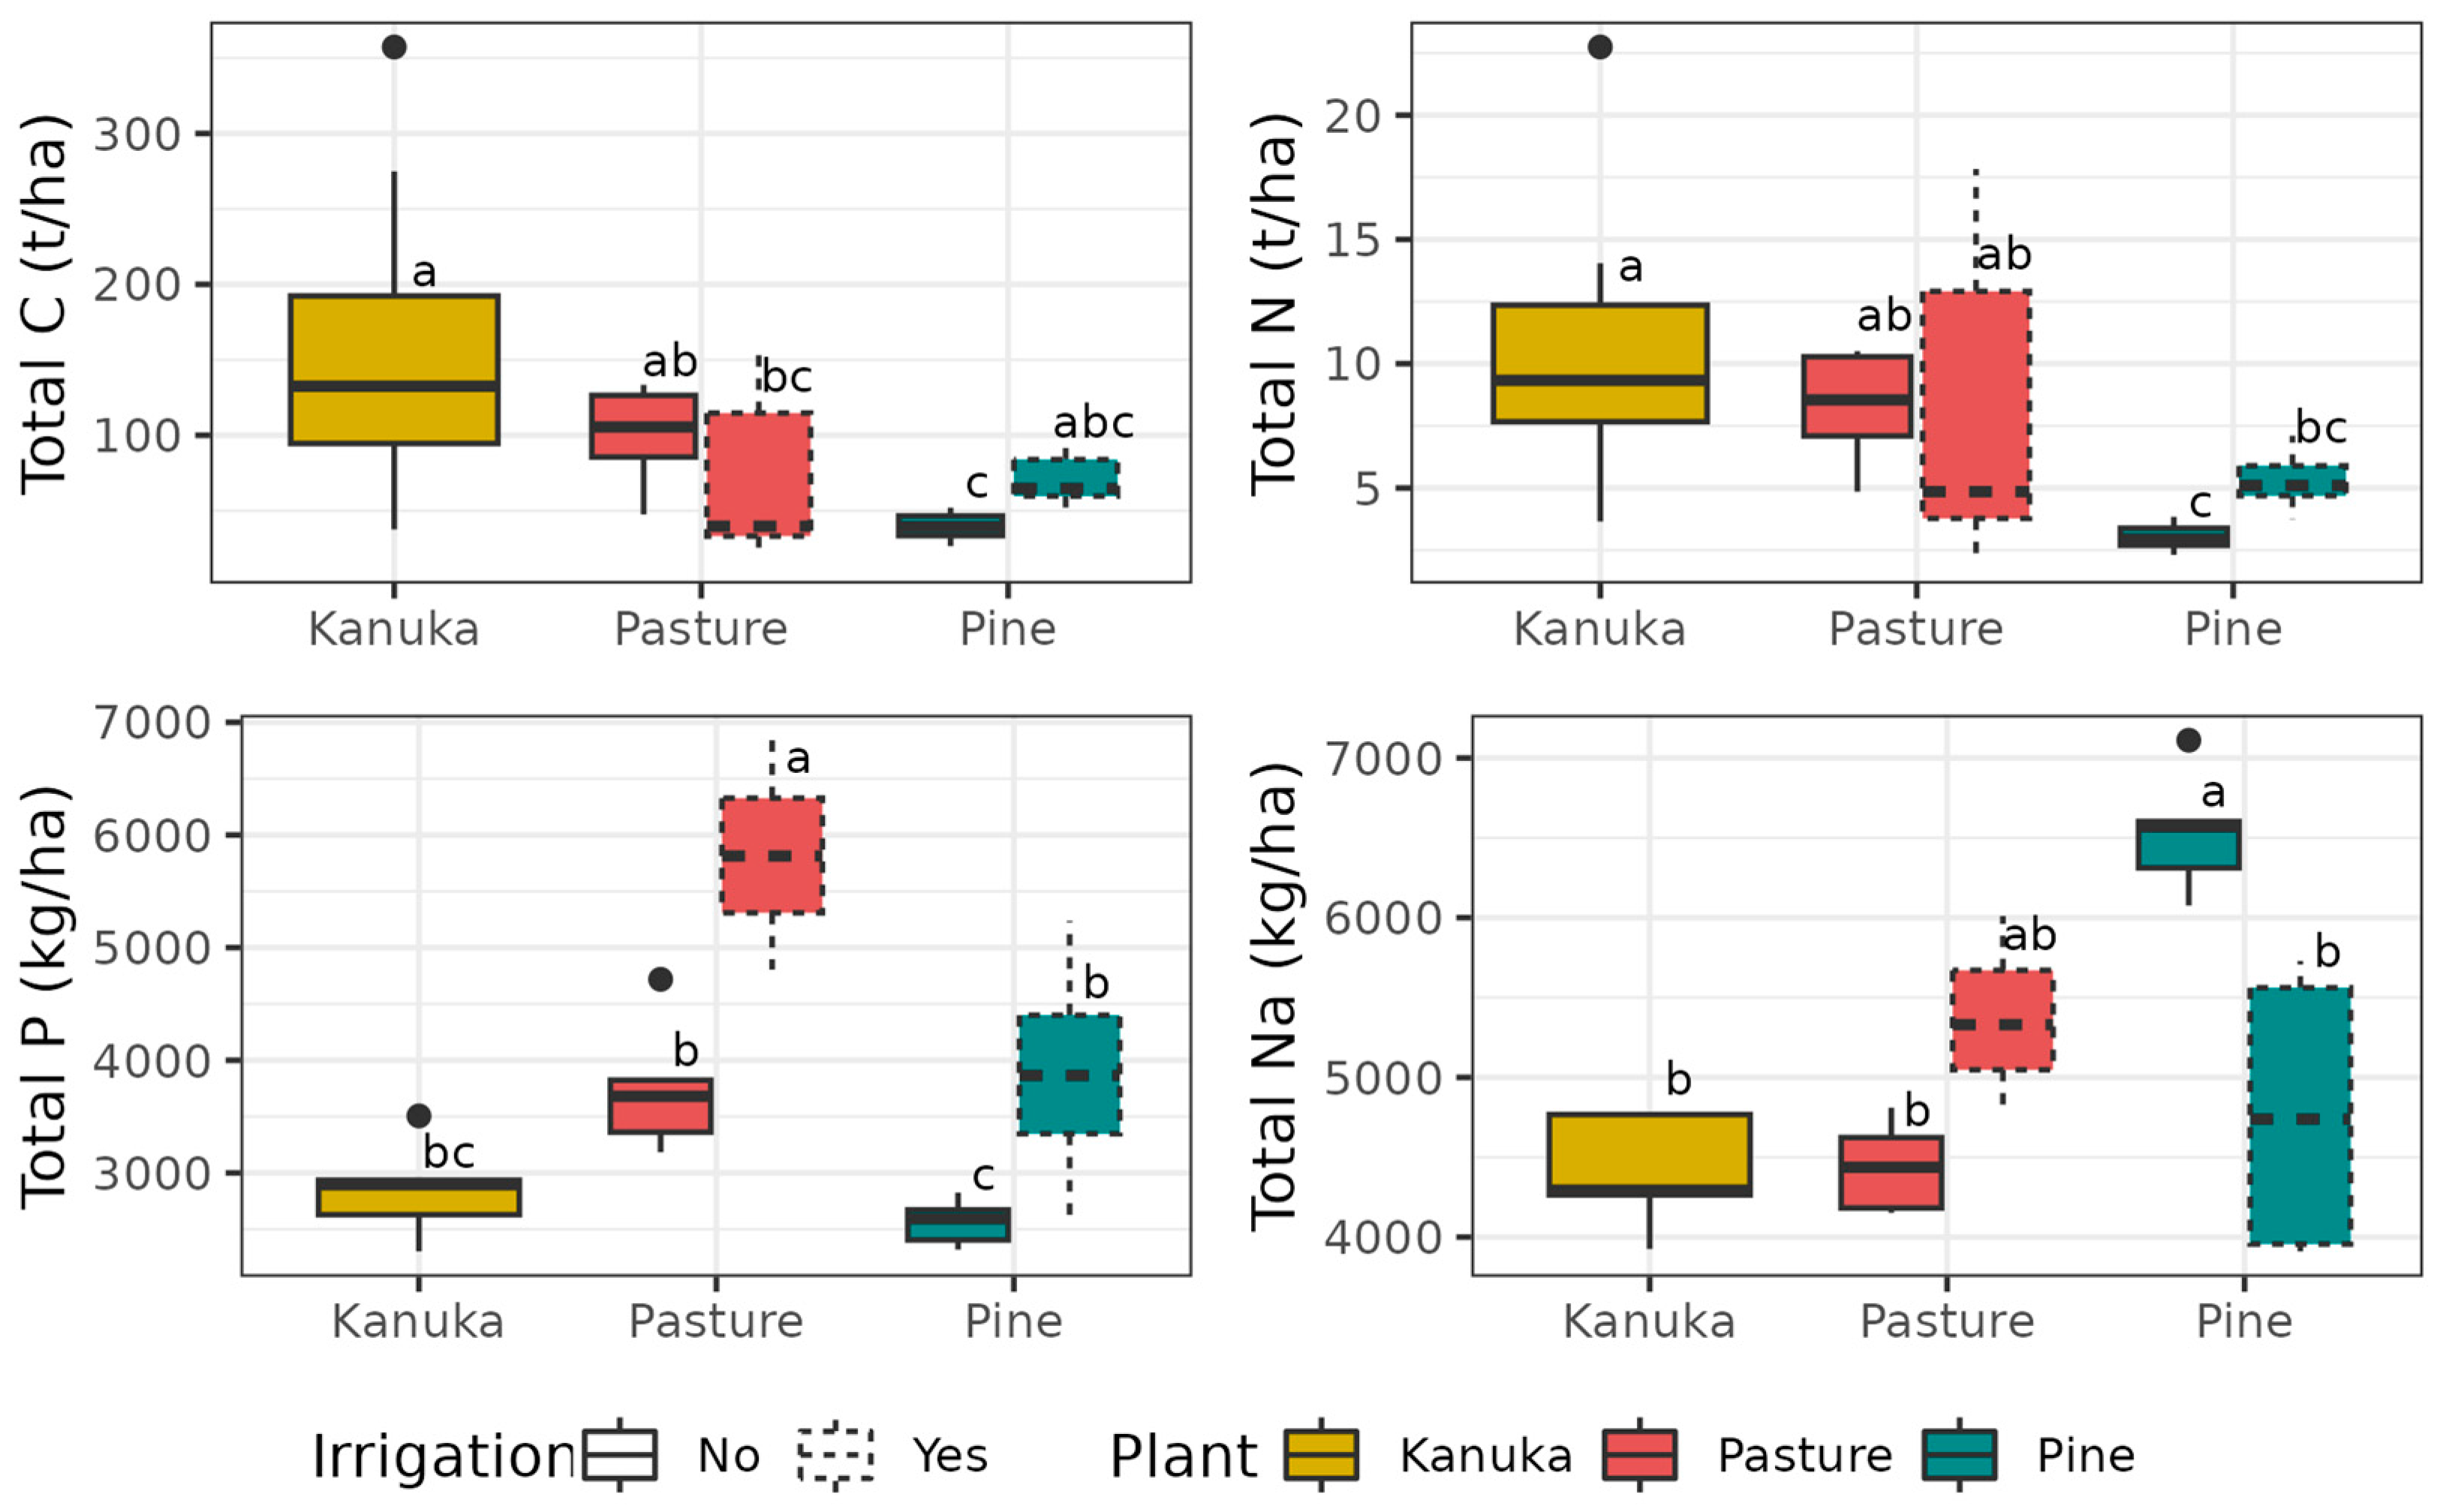
3.2. Changes in Soil Stocks

The soil stocks of C, N, P, and Na in the 0–80 cm of soil under each vegetation type and irrigation and non-irrigation are shown in Figure 4. Irrigation with TMW did not result in significant differences in C stocks, and the differences depended on vegetation type. Soil carbon stocks were most variable under kānuka, varying from 50 t ha−1 to >300 t ha−1. Soil C stock under kānuka (~130 t ha−1) was significantly higher than in soil under irrigated pasture and non-irrigated pine (<50 t ha−1). C stocks in soil under non-irrigated pasture (~100 t ha−1) were significantly higher than under non-irrigated pine. Similarly to C, soil N stocks did not differ between irrigated and non-irrigated areas, and the biggest difference was found between kānuka and pasture (~7–10 t N ha−1) with significantly higher N stock than pine (<5 t N ha−1).
Irrigation had the largest effect on soil stocks of P and Na. Soil P stocks under kānuka were similar to unirrigated pasture and pine, although there was a significant difference between the last two (3.7 t ha−1 under pasture compared with 2.6 t ha−1 under pine). Long-term irrigation significantly increased the soil P stocks in both irrigated vegetation types, up to 6 t ha−1 under pasture and nearly 4 t ha−1 under pine. Na stocks were significantly higher under non-irrigated pine (6.5 t ha−1) than irrigated pine (4.7 t ha−1).

4. Discussion

4.1. Changes in Soil Chemical Properties

The accumulation of P in the soil profile due to TMW irrigation was consistent across vegetation types (Figure 2, Table 2), which is consistent with the general literature showing an increase in total and available P down the soil profile after long-term (>10 years) wastewater irrigation [13,14,18,20,37]. This is not surprising as P was applied at a high rate with TMW irrigation (Table 1). The average Olsen P concentration in the irrigated topsoil of 87 mg kg−1 under pine was within the adequate range of Olsen P required for pine forestry (50–100 mg kg−1, according to NZ soil quality indicators [38]). However, Olsen P of 74 mg kg−1 under pasture was higher than the adequate range for this type of vegetation (20–50 mg kg−1, [38]). This indicates that the accumulation of P in the soil can limit the future use of the area for P-susceptible plant species. Some authors [39,40] considered that the build-up of P in the soil is a factor affecting the lifespan of TMW irrigation areas and their future use.
The effect of irrigation on soil N was less consistent than for P and depended on the type of vegetation, as also demonstrated previously [25]. TN and TOC results were similar, mostly due to N being predominantly present in organic form. The fact that, in some instances, NO3 and TN (and TOC) concentrations in soil are higher under irrigated areas is consistent with some of the literature showing similar trends [10,13,41,42,43,44,45]. However, these results were not consistent for both plant species at all soil depths and all forms of N (TN, NO3 and NH4+), highlighting the complex N cycling processes in the soil with a myriad of compounding factors [25,46]. This may also explain the range of responses in soil N after long-term TMW irrigation, which includes an increase in TN and/or inorganic N with irrigation [10,13,41,42,43] or no differences [8,43,47]. Interestingly, the soil under kānuka had a consistently higher concentration of NO3 down the soil profile than under any other treatment, including irrigated or non-irrigated vegetation, even when TN in the soil was not significantly higher (Figure 2 and Supplementary Material). This suggests that kānuka, or its associated microorganisms [48], are more efficient at mineralising N from soil organic matter than pine and pasture. This contrasts with previous research indicating a potential nitrification inhibition by kānuka and other Myrtaceae NZ native plants [23,24].
Contrary to general findings of Na soil accumulation after long-term TMW irrigation [10,14,20], this research did not show a consistently higher Na soil concentration in irrigated areas compared with non-irrigated areas, nor an increase in EC with irrigation (Figure 2, Figure 4, and Supplementary Material). Furthermore, under pine plantation, Na was higher at all soil depths in the non-irrigated areas compared to irrigated areas, and EC was higher at some soil depths (Figure 2 and Figure 4, Supplementary Material). Although Na concentration in TMW (=2.78 meq L−1, Table 1) was within the recommended concentration for irrigation water (<3 meq L−1, [31]), its relation to other cations, as indicated by a SAR of 4.4, together with a moderate EC (68 mS m−1), indicates that this TMW should have a moderate restriction on use [31]. Irrigation with saline TMW over long periods of time can affect soil structure by clay dispersion [22] and has been shown to decrease infiltration rates over time [19,20]. Although the infiltration rate was not analysed in our study, the lack of evidence of Na accumulation, and the fact that the area is still used for TMW irrigation without any infiltration issues, indicate that soil salinity and sodicity are not problems in this region. This is likely due to the sandy texture of the soil, which is Sandy Recent soil formed over old dunes [49] with likely low CEC and, thus, low Na accumulation potential. Furthermore, the high irrigation rate (~4 m y−1) together with high annual rainfall (1000–1100 mm y−1) evenly distributed over the year, with mild summer temperatures rarely exceeding 25 °C and an average annual evapotranspiration of 900 mm (and so without a period of significant water deficit) [50], likely resulted in the leaching of excess salts out of the soil. The higher concentration of Na in soil under non-irrigated pine, although surprising, could potentially be explained by microclimate conditions in the area, with a higher salt spray from the nearby ocean in the sampling area of unirrigated pine compared with other areas, as seen in Figure 1. Another explanation could be the different soil moisture and soil hydrology under pine plantations resulting from decreased rainfall infiltration due to canopy interception. In a review study, Rowe and colleagues [51] calculated that the range of throughfall rain in pine canopy was between 50 to 80% of the annual rainfall. In a recent study under Leptospermum scoparium (Myrtaceae) canopy, [52] it was demonstrated that throughfall rain was ~60% less than total rainfall, and it was suggested this was the main reason for the measured lower soil moisture and higher Na soil concentration under mānuka canopy than pasture. Given the proximity of unirrigated pine sampling areas to the irrigated pine and pasture, rain interception is likely to partially explain the increase in Na in the soil. Given that the area under kānuka is further from the sea and separated from the other sampled areas by a range of dunes, it is likely that the different microclimate and the salt-spray effect explain the difference in this vegetation type.

4.2. Exports of Contaminants and Soil Nutrient Stocks

The significant P accumulation found in the TMW-irrigated soil poses a risk to nearby waterbodies, where an excessive concentration of this nutrient can exacerbate eutrophication. Although most of the exports of soil P to waterbodies are attributed to run-off [53], there is evidence that P from wastewater-irrigated areas can also leach in large quantities to groundwater [37,54]. In accordance with [20,37,54], the fact that we found significantly higher concentrations of P through the soil profile and down to the water table level under irrigated areas compared with non-irrigated areas demonstrated the movement of P down the soil profile.
The fact that the significant increase in soil P stocks (Figure 4) in the irrigated areas cannot account for the total P application of ~7.9 t ha−1 over 30 years indicates the likelihood of P leaching to groundwater. Under pasture, the total accumulation of P in the soil under irrigated areas was, on average, 2 t ha−1 higher than under non-irrigated areas. Under pine, this increase was 1.3 t ha−1. In a mass balance estimation, the total P inputs by TMW irrigation (Table 1) must have been either accumulated into the soil (Figure 4), either taken up by vegetation, or lost to groundwater. That indicates that ~6 t ha−1 and ~6.6 t ha−1 of P have been lost under pasture and pine, respectively, over the course of 30 years of TMW application. The P uptake by the pine plantation could be estimated by the following: (a) using the NZ Ministry of Primary Industries C sequestration estimates for a 30-year-old radiata pine plantation (~900 t CO2 eq. ha−1 [55]) and (b) transforming this estimate into C and into P by using C:P stoichiometry of a range of wood trees [56] or coniferous trees [57]. With this estimation, the P uptake by pine trees was ~50–300 kg P ha−1 over 30 years. Will [58] calculated that fertilised pine plantations can uptake an extra ~30 kg P ha−1 over 8 years compared with unfertilised. This means that under pine plantation, the area has lost an estimated average of 215 kg P ha−1 y−1 or 80% of the total P applied. In the case of pasture, and supposing a best-case scenario of a cut-and-carry system with highly productive pasture [39] with an annual P removal with vegetation of 45 kg P ha−1, the estimated losses of P are 155 kg P ha−1 y−1 or 60% of applied P.
Contrary to P, there was no evidence of N accumulation in the soil due to long-term TMW irrigation (Figure 4). Using similar mass balance calculations and the same sources [55,56,57], the estimated N uptake over 30 years is 1–3 t N ha−1 by pine plantation and 9.4 t N ha−1 by pasture. This indicates a loss of N of >1700 kg N ha−1 y−1 (~96% of the applied N) under pine plantation and >1500 kg N ha−1 y−1 (~83% of the applied N) under pasture. Nitrogen may have been lost to groundwater via leaching or to the atmosphere via denitrification. In a meta-analysis of >200 studies [59], the average N loss from soil through denitrification was calculated to be 4.8% of the applied N as fertiliser or manure, 33% of which was as N2O. In very wet areas—as could be the case in our research due to high irrigation with 4 m y−1— the increased denitrification rate due to applied N could be up to 27%, as was the case in paddy fields reviewed by [59]. A global mass balance of N in terrestrial ecosystems [60] calculated that N2O is ~12% of the denitrification emissions. This indicates that it is likely that most of the losses of N are via leaching to groundwater (eq. ~1600 kg N ha−1 y−1 under pine and ~1400 kg N ha−1 y−1 under pasture, or ~1000–1300 kg N ha−1 y−1 in a situation similar to paddy fields due to high irrigation). Assuming N2O ratios as an average of the global average values calculated by [59,60], potentially, N2O emissions from this area would be 28 kg N2O ha−1 y−1 under pine and 25 kg N2O ha−1 y−1 under pasture, which equates to 8.5 t CO2 eq. ha−1 y−1 and 7.4 t CO2 eq. ha−1 y−1. This represents about one-quarter of the potential carbon sequestration by pine [55] plantations over 30 years.
Soil C concentrations were higher in the topsoil of irrigated areas (Figure 2, Supplementary Material), which agrees with the general literature [45,61]. Despite that, the C stocks were not influenced by irrigation (Figure 4), mostly due to the strong decrease in bulk density, which is an exponential function of soil C concentration (Supplementary Material). It is challenging to compare our results with the other literature since most reports claiming changes in soil C pools or stocks base their assumptions on soil C concentrations [44,45,61] and use a generic and constant soil density for transforming C concentration to Mg ha−1. As we have demonstrated in this work, that approach can significantly overestimate the real soil C pools and drive erroneous conclusions about the effects of different practices on soil carbon sequestration. Nevertheless, the results reported by Sánchez–González and colleagues [61] indicated that, despite an increase in soil C after untreated wastewater irrigation, soil C concentrations were lower than in the natural forest. This agrees with our results showing generally higher C stock in soil under kānuka than in any other sampled area. Authors attributed these differences to losses of C during the conversion of forest land to crops due to the degradation of soil structure and higher mineralisation of organic matter. Our results show that soil C stocks are more related to the type of vegetation growing in the soil than to irrigation (Figure 4). The fact that C stocks were higher under pasture than pine agrees with the previous literature [62]. However, the difference was more pronounced in our study, with C stocks under unirrigated pine 50% lower than under unirrigated pasture, while the difference in the mentioned study [62] was only 11–33%.

5. Conclusions

The type of vegetation established in areas irrigated with treated municipal wastewater can have as much effect on the resulting soil quality as the irrigation itself. This was demonstrated for pH, EC, N, C, and Na. In contrast, P was consistently higher in irrigated areas of both pasture and pine and down the soil profile until the water table. Soil P accumulation, which could potentially cause toxicity in less tolerant plants, is the only evidence of soil degradation since there was no significant accumulation of Na or trace elements in the soil. Excess losses of nutrients to groundwater and/or the atmosphere were identified as the biggest negative environmental impacts of this irrigation scheme. A mass balance estimated that the loss of P to groundwater was approximately 215 kg P ha−1 y−1 under pine and 155 kg P ha−1 y−1 under pasture. The loss of N to groundwater was estimated at 1300–1600 kg N ha−1 y−1 under pine and 1000–1400 kg N ha−1 y−1 under pasture. Emissions of N2O were estimated to be up to 28 kg N2O ha−1 y−1. Designing systems that take into consideration the specific remediation potential of the vegetation to be irrigated is fundamental to protecting the soil, the water, and the atmosphere. Despite that, irrigation rates must not exceed the capacity of plants to uptake nutrients or contaminants if irrigation systems are to be sustainable in the long term.

Supplementary Materials

The following supporting information can be downloaded at: https://www.mdpi.com/article/10.3390/su152316230/s1, Interpolation of sample density based on soil C concentration; Table S1: Results of chemical analysis in the soil; Table S2: Results of chemical analysis in the soil (continuation). Figure S1. Relationship between soil C concentration and sample density. Figure S2. Average and standard error of the soil parameters at the different treatments (irrigated vs. non-irrigated, pine vs. pasture vs. kānuka) and at increasing soil depths. Figure S3. Principal component analysis of the chemical results in the topsoil (0–7.5 cm). (A) Biplot with the variable weighting and the scatterplot. (B) Scatterplot with groups based on plant and irrigation. Ellipse shows confidence regions. Figure S4. Boxplots of the element stocks in the soil (0–80 cm) calculated per hectare. Different letters in each graph indicate significant differences between groups (Tukey’s test, p < 0.05).

Author Contributions

Conceptualization, B.H.R. and J.H.; methodology, M.J.G.-G., S.H., I.A. and V.A.; formal analysis, M.J.G.-G., S.H., I.A. and V.A.; investigation, M.J.G.-G., B.H.R. and J.H.; resources, H.L.; data curation, M.J.G.-G.; writing—original draft preparation, M.J.G.-G.; writing—review and editing, M.J.G.-G., S.H., I.A., B.H.R., H.L., J.H. and V.A.; visualization, M.J.G.-G.; project administration, H.L.; funding acquisition, H.L., B.H.R. and J.H. All authors have read and agreed to the published version of the manuscript.

Funding

This study was funded by the Ministry for the Environment of New Zealand’s Freshwater Improvement Fund [grant number 22127] and the Institute of Environmental Science and Research Ltd. (ESR) Strategic Science Investment Funding from the Ministry of Business, Innovation and Employment, New Zealand [grant number C03X1701], under a Pioneer Project and Native Ecosystems Project.

Institutional Review Board Statement

Not applicable.

Informed Consent Statement

Not applicable.

Data Availability Statement

The data presented in this study are available on request from the corresponding author.

Acknowledgments

We would like to acknowledge the considerable work of Charlotte Sitz in helping with the soil collection.

Conflicts of Interest

Author Hamish Lowe is director of the company Lowe Environmental Impact, who collaborated in the application for research funds, and managed and administered the project. The authors declare that the research was conducted in the absence of any commercial or financial relationships that could be construed as a potential conflict of interest.

References

  1. WWAP (United Nations World Water Assessment Programme). The United Nations World Water Development Report 2017. Wastewater: The Untapped Resource; UNESCO: Paris, France, 2017. [Google Scholar]
  2. Krzmarzick, M.J.; Novak, P.J. Removal of chlorinated organic compounds during wastewater treatment: Achievements and limits. Appl. Microbiol. Biotechnol. 2014, 98, 6233–6242. [Google Scholar] [CrossRef]
  3. Preisner, M.; Neverova-Dziopak, E.; Kowalewski, Z. An Analytical Review of Different Approaches to Wastewater Discharge Standards with Particular Emphasis on Nutrients. Environ. Manag. 2020, 66, 694–708. [Google Scholar] [CrossRef] [PubMed]
  4. Rout, P.R.; Shahid, M.K.; Dash, R.R.; Bhunia, P.; Liu, D.; Varjani, S.; Zhang, T.C.; Surampalli, R.Y. Nutrient removal from domestic wastewater: A comprehensive review on conventional and advanced technologies. J. Environ. Manag. 2021, 296, 113246. [Google Scholar] [CrossRef] [PubMed]
  5. Pedrero, F.; Kalavrouziotis, I.; Alarcón, J.J.; Koukoulakis, P.; Asano, T. Use of treated municipal wastewater in irrigated agriculture—Review of some practices in Spain and Greece. Agric. Water Manag. 2010, 97, 1233–1241. [Google Scholar] [CrossRef]
  6. Becerra-Castro, C.; Lopes, A.R.; Vaz-Moreira, I.; Silva, E.F.; Manaia, C.M.; Nunes, O.C. Wastewater reuse in irrigation: A microbiological perspective on implications in soil fertility and human and environmental health. Environ. Int. 2015, 75, 117–135. [Google Scholar] [CrossRef]
  7. Overcash, M.; Sims, R.C.; Sims, J.L.; Nieman, J.K.C. Beneficial Reuse and Sustainability: The Fate of Organic Compounds in Land-Applied Waste. J. Environ. Qual. 2005, 34, 29–41. [Google Scholar] [CrossRef]
  8. Adrover, M.; Farrús, E.; Moyà, G.; Vadell, J. Chemical properties and biological activity in soils of Mallorca following twenty years of treated wastewater irrigation. J. Environ. Manag. 2012, 95, S188–S192. [Google Scholar] [CrossRef]
  9. Alguacil, M.d.M.; Torrecillas, E.; Torres, P.; García-Orenes, F.; Roldán, A. Long-Term Effects of Irrigation with Waste Water on Soil AM Fungi Diversity and Microbial Activities: The Implications for Agro-Ecosystem Resilience. PLoS ONE 2012, 7, e47680. [Google Scholar] [CrossRef]
  10. Bedbabis, S.; Trigui, D.; Ben Ahmed, C.; Clodoveo, M.L.; Camposeo, S.; Vivaldi, G.A.; Ben Rouina, B. Long-terms effects of irrigation with treated municipal wastewater on soil, yield and olive oil quality. Agric. Water Manag. 2015, 160, 14–21. [Google Scholar] [CrossRef]
  11. Dimitriou, I.; Aronsson, P. Wastewater and sewage sludge application to willows and poplars grown in lysimeters–Plant response and treatment efficiency. Biomass Bioenergy 2011, 35, 161–170. [Google Scholar] [CrossRef]
  12. Magesan, G.N.; McLay, C.D.A.; Lal, V.V. Nitrate leaching from a free-draining volcanic soil irrigated with municipal sewage effluent in New Zealand. Agric. Ecosyst. Environ. 1998, 70, 181–187. [Google Scholar] [CrossRef]
  13. Mohammad Rusan, M.J.; Hinnawi, S.; Rousan, L. Long term effect of wastewater irrigation of forage crops on soil and plant quality parameters. Desalination 2007, 215, 143–152. [Google Scholar] [CrossRef]
  14. Qian, Y.L.; Mecham, B. Long-Term Effects of Recycled Wastewater Irrigation on Soil Chemical Properties on Golf Course Fairways. Agron. J. 2005, 97, 717–721. [Google Scholar] [CrossRef]
  15. Segal, E.; Dag, A.; Ben-Gal, A.; Zipori, I.; Erel, R.; Suryano, S.; Yermiyahu, U. Olive orchard irrigation with reclaimed wastewater: Agronomic and environmental considerations. Agric. Ecosyst. Environ. 2011, 140, 454–461. [Google Scholar] [CrossRef]
  16. Zavadil, J. The effect of municipal wastewater irrigation on the yield and quality of vegetables and crops. Soil Water Res. 2009, 4, 91–103. [Google Scholar] [CrossRef]
  17. Asgari, K.; Cornelis, W.M. Heavy metal accumulation in soils and grains, and health risks associated with use of treated municipal wastewater in subsurface drip irrigation. Environ. Monit. Assess. 2015, 187, 410. [Google Scholar] [CrossRef]
  18. Angin, I.; Yaganoglu, A.V.; Turan, M. Effects of Long-Term Wastewater Irrigation on Soil Properties. J. Sustain. Agric. 2005, 26, 31–42. [Google Scholar] [CrossRef]
  19. Assouline, S.; Narkis, K. Effects of long-term irrigation with treated wastewater on the hydraulic properties of a clayey soil. Water Resour. Res. 2011, 47, W08530. [Google Scholar] [CrossRef]
  20. Bedbabis, S.; Ben Rouina, B.; Boukhris, M.; Ferrara, G. Effect of irrigation with treated wastewater on soil chemical properties and infiltration rate. J. Environ. Manag. 2014, 133, 45–50. [Google Scholar] [CrossRef]
  21. Lal, K.; Minhas, P.S.; Yadav, R.K. Long-term impact of wastewater irrigation and nutrient rates II. Nutrient balance, nitrate leaching and soil properties under peri-urban cropping systems. Agric. Water Manag. 2015, 156, 110–117. [Google Scholar] [CrossRef]
  22. Abrol, I.P.; Yadav, J.S.P.; Massoud, F.I. Salt-Affected Soils and Their Management; FAO Soils Bulletin; Food and Agriculture Organization of the United Nations, Ed.; FAO: Rome, Italy, 1988; Volume 39. [Google Scholar]
  23. Esperschuetz, J.; Anderson, C.; Bulman, S.; Katamian, O.; Horswell, J.; Dickinson, N.; Robinson, B. Response of Leptospermum scoparium, Kunzea robusta and Pinus radiata to contrasting biowastes. Sci. Total Environ. 2017, 587–588, 258–265. [Google Scholar] [CrossRef] [PubMed]
  24. Halford, S.; Gutiérrez-Ginés, M.J.; Rees, A.; Alderton, I.; Schaller, K.; Smith, R.; Horswell, J. Effect of mānuka (Leptospermum scoparium) on nitrogen and Escherichia coli reductions in soils: A field experiment. Plant Soil 2021, 465, 491–502. [Google Scholar] [CrossRef]
  25. Meister, A.; Li, F.; Gutierrez-Gines, M.J.; Dickinson, N.; Gaw, S.; Bourke, M.; Robinson, B. Interactions of treated municipal wastewater with native plant species. Ecol. Eng. 2022, 183, 106741. [Google Scholar] [CrossRef]
  26. Davies, G.M.; Gray, A. Don’t let spurious accusations of pseudoreplication limit our ability to learn from natural experiments (and other messy kinds of ecological monitoring). Ecol. Evol. 2015, 5, 5295–5304. [Google Scholar] [CrossRef]
  27. Landcare Research. New Zealand Soil Classifiation. Available online: https://soils-maps.landcareresearch.co.nz/#maps (accessed on 1 September 2023).
  28. Blakemore, L.C.; Searle, P.L.; Daly, B.K. Methods for chemical analysis of soils. In NZ Soil Bureau Scientific Report 80; Dept. Scientific and Industrial Research: Lower Hutt, New Zealand, 1987. [Google Scholar]
  29. Saunders, W.M.H. Phosphate retention by New Zealand soils and its relationship to free sesquioxides, organic matter, and other soil properties. N. Z. J. Agric. Res. 1965, 8, 30–57. [Google Scholar] [CrossRef]
  30. New Zealand Government. Water Services (Drinking Water Standards for New Zealand) Regulations 2022; New Zealand Government: Wellington, New Zealand, 2022.
  31. Ayers, R.S.; Westcot, D.W. Water Quality for Agriculture; FAO Irrigation and Drainage Paper; Food and Agriculture Organization of the United Nations: Rome, Italy, 1985; Volume 29. [Google Scholar]
  32. R Core Team. R: A Language and Environment for Statistical Computing; R Foundation for Statistical Computing: Vienna, Austria, 2021. [Google Scholar]
  33. Mendiburu, F.d.; Yaseen, M.; Agricolae: Statistical Procedures for Agricultural Research. R Package Version 1.4.0. 2020. Available online: https://cran.r-project.org/web/packages/agricolae/index.html (accessed on 1 September 2023).
  34. Wickham, H. ggplot2: Elegant Graphics for Data Analysis; Springer: New York, NY, USA, 2016. [Google Scholar]
  35. Meyer, F.; Perrier, V.; Carroll, I.; Dang, X.; Bevacqua, N.; Choi, D.Y.; Rocha, Z. Package ‘Esquisse’ Explore and Visualize Your Data Interactively. R Package Version 1.1.0. 2022. Available online: https://github.com/dreamRs/esquisse/ (accessed on 1 September 2023).
  36. Garnier, S.; Ross, N.; Rudis, B.; Sciaini, M.; Camargo, A.P.; Scherer, C. Colorblind-Friendly Color Maps for R. 2023. Available online: https://sjmgarnier.github.io/viridis/ (accessed on 1 September 2023).
  37. Lizarralde, C.A.; McDowell, R.; Condron, L.; Brown, J. The potential for phosphorus loss to groundwater from soils irrigated with dairy factory wastewater. N. Z. J. Agric. Res. 2023, 66, 189–207. [Google Scholar] [CrossRef]
  38. Sparling, G.; Lilburne, L.; Vojvodić-Vuković, M. Provisional Targets for Soil Quality Indicators in New Zealand; Landcare Research Science Series No. 34; Manaaki Whenua Press: Lincoln, New Zealand, 2008. [Google Scholar]
  39. Gutierrez-Gines, M.J.; Mishra, M.; McIntyre, C.; Chau, H.W.; Esperschuetz, J.; McLenaghen, R.; Bourke, M.P.; Robinson, B.H. Risks and benefits of pasture irrigation using treated municipal effluent : A lysimeter case study, Canterbury, New Zealand. Environ. Sci. Pollut. Res. 2020, 27, 11830–11841. [Google Scholar] [CrossRef]
  40. Hu, C.; Zhang, T.C.; Huang, Y.H.; Dahab, M.F.; Surampalli, R. Effects of Long-Term Wastewater Application on Chemical Properties and Phosphorus Adsorption Capacity in Soils of a Wastewater Land Treatment System. Environ. Sci. Technol. 2005, 39, 7240–7245. [Google Scholar] [CrossRef]
  41. Xu, J.; Wu, L.; Chang, A.C.; Zhang, Y. Impact of long-term reclaimed wastewater irrigation on agricultural soils: A preliminary assessment. J. Hazard. Mater. 2010, 183, 780–786. [Google Scholar] [CrossRef]
  42. Liu, Y.Y.; Haynes, R.J. Influence of land application of dairy factory effluent on soil nutrient status and the size, activity, composition and catabolic capability of the soil microbial community. Appl. Soil Ecol. 2011, 48, 133–141. [Google Scholar] [CrossRef]
  43. Ndour, N.Y.B.; Baudoin, E.; Guissé, A.; Seck, M.; Khouma, M.; Brauman, A. Impact of irrigation water quality on soil nitrifying and total bacterial communities. Biol. Fertil. Soils 2008, 44, 797–803. [Google Scholar] [CrossRef]
  44. Lal, K.; Minhas, P.S.; Yadav, R.K.; Rosin, K.G. GHG mitigation from sewage effluents: C sequestration after reuse in different urban cropping systems. Carbon Manag. 2020, 11, 281–290. [Google Scholar] [CrossRef]
  45. Somenahally, A.C.; McLawrence, J.; Chaganti, V.N.; Ganjegunte, G.K.; Obayomi, O.; Brady, J.A. Response of soil microbial Communities, inorganic and organic soil carbon pools in arid saline soils to alternative land use practices. Ecol. Indic. 2023, 150, 110227. [Google Scholar] [CrossRef]
  46. Cameron, K.C.; Di, H.J.; Moir, J.L. Nitrogen losses from the soil/plant system: A review. Ann. Appl. Biol. 2013, 162, 145–173. [Google Scholar] [CrossRef]
  47. Gelsomino, A.; Badalucco, L.; Ambrosoli, R.; Crecchio, C.; Puglisi, E.; Meli, S.M. Changes in chemical and biological soil properties as induced by anthropogenic disturbance: A case study of an agricultural soil under recurrent flooding by wastewaters. Soil Biol. Biochem. 2006, 38, 2069–2080. [Google Scholar] [CrossRef]
  48. de Lange, P.J. A revision of the New Zealand Kunzeaericoides (Myrtaceae) complex. PhytoKeys 2014, 40, 1–185. [Google Scholar] [CrossRef] [PubMed]
  49. MWLR. S-Map Online. 2023. Available online: https://smap.landcareresearch.co.nz/ (accessed on 1 September 2023).
  50. Baldi, M.; Burgess, S.; Mullan, B.; Salinger, J.; Ramsay, D.; Bell, R. Updated Climate Change Scenarios for the Kapiti Coast; NIWA: Wellington, New Zealand, 2007; p. 56. [Google Scholar]
  51. Rowe, L.; Jackson, R.B.; Fahey, B. Land Use and Water Resources: Hydrological Effects of Different Vegetation Covers; SMF2167: Report No 5.; Landcare Research: Lincoln, New Zealand, 2002; p. 142. [Google Scholar]
  52. Gutierrez-Gines, M.J.; Bishit, A.; Meister, A.; Robinson, B.H.; Clarke, D.; Tupuhi, G.; Alderton, I.; Horswell, J.; Wang, K.I.K.; Bohm, K.; et al. Maanuka Dominated Ecosystems to Improve Water and Soil Quality in Lake Waikare Catchment; ESR: Christchurch, New Zealand, 2022; Available online: https://waikatoriver.org.nz/wp-content/uploads/2022/06/WRA16-008-Final-Report-WRA-2022_10.pdf (accessed on 1 September 2023).
  53. Hart, M.R.; Quin, B.F.; Nguyen, M.L. Phosphorus Runoff from Agricultural Land and Direct Fertilizer Effects: A Review. J. Environ. Qual. 2004, 33, 1954–1972. [Google Scholar] [CrossRef] [PubMed]
  54. Gwenzi, W.; Munondo, R. Long-term impacts of pasture irrigation with treated sewage effluent on shallow groundwater quality. Water Sci. Technol. 2008, 58, 2443–2452. [Google Scholar] [CrossRef] [PubMed]
  55. Kimberley, M.O.; Bergin, D.; Beets, P. Carbon Sequestration by Planted Native Trees and Shrubs. In Technical Handbook Section 10: Native Tree Plantations; Tane’s Tree Trust: Hamilton, New Zealand, 2014; Volume 10, pp. 1–12. [Google Scholar]
  56. Piaszczyk, W.; Błońska, E.; Lasota, J.; Lukac, M. A comparison of C:N:P stoichiometry in soil and deadwood at an advanced decomposition stage. CATENA 2019, 179, 1–5. [Google Scholar] [CrossRef]
  57. Tang, Z.; Xu, W.; Zhou, G.; Bai, Y.; Li, J.; Tang, X.; Chen, D.; Liu, Q.; Ma, W.; Xiong, G.; et al. Patterns of plant carbon, nitrogen, and phosphorus concentration in relation to productivity in China’s terrestrial ecosystems. Proc. Natl. Acad. Sci. USA 2018, 115, 4033–4038. [Google Scholar] [CrossRef]
  58. Will, G.M. Increased Phosphorus Uptake by Radiata Pine in Riverhead Forest following Superphosphate Applications. N. Z. J. For. 1965, 10, 33–42. [Google Scholar]
  59. Pan, B.; Xia, L.; Lam, S.K.; Wang, E.; Zhang, Y.; Mosier, A.; Chen, D. A global synthesis of soil denitrification: Driving factors and mitigation strategies. Agric. Ecosyst. Environ. 2022, 327, 107850. [Google Scholar] [CrossRef]
  60. Scheer, C.; Fuchs, K.; Pelster, D.E.; Butterbach-Bahl, K. Estimating global terrestrial denitrification from measured N2O:(N2O + N2) product ratios. Curr. Opin. Environ. Sustain. 2020, 47, 72–80. [Google Scholar] [CrossRef]
  61. Sánchez–González, A.; Chapela–Lara, M.; Germán–Venegas, E.; Fuentes-García, R.; Río-Portilla, F.d.; Siebe, C. Changes in quality and quantity of soil organic matter stocks resulting from wastewater irrigation in formerly forested land. Geoderma 2017, 306, 99–107. [Google Scholar] [CrossRef]
  62. Oliver, G.R.; Beets, P.N.; Garrett, L.G.; Pearce, S.H.; Kimberly, M.O.; Ford-Robertson, J.B.; Robertson, K.A. Variation in soil carbon in pine plantations and implications for monitoring soil carbon stocks in relation to land-use change and forest site management in New Zealand. For. Ecol. Manag. 2004, 203, 283–295. [Google Scholar] [CrossRef]
Figure 2. Average and standard error of the soil parameters at the different treatments (irrigated vs. non-irrigated, pine vs. pasture vs. kānuka) and at increasing soil depths. 300 cm indicate either 300 cm, or less than that if the water table was found before 300 cm and lower than 200 cm.
Sustainability 15 16230 g002
Figure 4. Boxplots of the element stocks in the soil (0–80 cm) calculated per hectare. Different letters in each graph indicate significant differences between groups (Tukey’s test, p < 0.05).
Sustainability 15 16230 g004
Table 2. Results of the three-way ANOVA of all chemical parameters analysed.
Parameter and TransformationsVeg.Irrig.DepthVeg × IrrigVeg × DepthIrrig × DepthV × I × D
TP********* *°
Log10(OlsenP + 1)*********°**
Log10(P_ret) ******
pH************
Log10(NO3 + 1)************°*
Log10(Na)************ **
Log10(EC)*** ****** **
Log10(TOC)*** ******
Log10(TN)*** ******
NH4-******* °
Mg*** ****°*
Ca °**** *
K ****
Log10(Cu)**** *°
Mn******* °
Log10(Zn)*** *** **
Veg.: vegetation type, Irrig.: irrigation or non-irrigation. Depth: soil depth. P_ret: P retention. Level of significance: *** p < 0.001, ** p < 0.01, * p < 0.05, ° p < 0.1.
Disclaimer/Publisher’s Note: The statements, opinions and data contained in all publications are solely those of the individual author(s) and contributor(s) and not of MDPI and/or the editor(s). MDPI and/or the editor(s) disclaim responsibility for any injury to people or property resulting from any ideas, methods, instructions or products referred to in the content.

