1. Introduction
Steel appears to be the material of the future due to its special properties, 100% recyclability, and direct connection to several industries. Due to their light weight and lower requirements for steel consumption, using thin-walled cold-formed structural members is one of the possible ways to create sustainable construction, saving costs and energy during production of such members.
Adversely, due to local and/or global stability problems, most steel members are subjected to buckling before yielding, and their full resistance cannot be achieved. Increasing the cross-sectional dimensions of steel members leads to an increase in steel consumption and therefore is not the preferred solution. Therefore, consideration will be given to the possibility of utilizing concrete, due to its good properties in compressive stress. In addition to energy and cost reduction, the combination of steel and concrete into a composite unit allows for rational use of the properties of these materials to increase the resistance of structural members.
Composite structures created by an effective combination of two materials, such as steel and concrete, are undoubtedly considered progressive. Structural members such as composite columns play a significant role in these structural systems. These columns are widely used in the construction of multistory buildings and bridges as compressed structural members, with relatively low bending moments. One of the most widely used types of such structural members is a column made of a rectangular or circular steel tube filled with concrete.
Due to the problems with initial imperfections and local stability, according to Al Ali et al. [
1,
2], these composite members possess a number of advantages compared to members with a hollow steel cross-section. Their resistance to the loss of local and global stability enables the reduction of cross-sectional dimensions, Kanishchev [
3].
At the present time, many numerical and experimental works (Alatshan et al. [
4], Chepurnenko et al. [
5], Grzeszykowski and Szmigiera [
6], Florence and Senthil [
7], Zhen et al. [
8]) are devoted to the topic of columns having hollow profiles filled with concrete. Storozhenko et al. [
9] performed experiments on high-strength composite columns subjected to eccentric loading. Using the FE analysis, Ellobody and Young [
10] introduced a sufficiently accurate nonlinear model describing the behavior of axially compressed composite columns of circular and rectangular profiles. Ding et al. [
11] investigated the mechanical behaviors of concrete-filled rectangular steel tubes under pure torsion. Other authors, such as Lee [
12], Mouli et al. [
13], Uy [
14], Huang et al. [
15], Aslani et al. [
16,
17], Wang et al. [
18], and Espinos et al. [
19] investigated the resistance, ultimate strength, stability, and ductility characteristics of rectangular concrete-filled members under compression. Chen et al. [
20] experimentally showed the effect of elevated temperatures on the residual bond behavior of high-strength concrete-filled square steel tube. Patel et al. [
21] proposed a multiscale numerical model to simulate the interaction of local and global buckling of slender steel beam-columns with a high-strength rectangular concrete-filled tube. Yang and Han [
22] realized experimental research focused on rectangular concrete-filled steel tubes, loaded axially on a partially stressed cross-sectional area. Ding et al. [
23,
24] conducted a study on mechanical performance of stirrup-confined concrete-filled steel tubular stub columns under axial loading. Qiao et al. [
25] dealt with the effect of spiral spacing on the axial compressive behavior of square reinforced concrete columns made of steel tubes.
Many authors, such as Lu et al. [
26], Kanishchev and Kvocak [
27], demonstrated that a number of valid standards and regulations for the design of members mentioned above are only applicable in a limited extent with strict conditions.
For example, while Eurocode 3, EN 1993-1-1 [
28] allows the design and calculation of steel profiles and members regardless of cross-section class (i.e., class 1, 2, 3, and 4), Eurocode 4, EN 1994-1-1 [
29] allows the design and calculation of composite steel-concrete members with closed cross-sections, provided that the steel cross-section must be compact, i.e., class 1, 2, or 3.
The stated fundamental disadvantage in Eurocode 4 limits the use of positive properties of concrete for the effective design of a thin-walled steel part (class 4). This fact demonstrates the need for a sufficient number of large-scale analyses and research to obtain serious results and an expanded database that allows the implementation of class 4 cross-sections in Eurocode 4 for the design of steel members with closed concrete-filled profiles.
2. Stability of Steel Tubes Filled with Concrete According to EN 1994-1-1
This standard applies to all composite columns and members made of steel grades S235 to S460 and concrete of strength classes C20/25 to C50/60, which are subjected to compressive loads.
According to this standard, the design for global stability of columns made of concrete-filled tubes shall take into account the second-order effects, including imperfections. The design shall also ensure that instability does not occur for the most unfavorable combination of actions at the ultimate limit state (ULS), and that the resistance of individual cross-sections concurrently subjected to bending and axial force is not exceeded. Second-order effects shall be considered in any direction in which column failure might occur.
For a composite compressed member with an initial imperfection subjected to a normal force and bending, it is necessary to reduce the cross-section resistance by a buckling coefficient
χ. The resistance of a column under axial load with the account taken for second-order effects is given as:
The cross-sectional plastic design resistance
Npl,Rd of a composite column subjected to an axial compressive load
NEd is to be calculated as the sum of the plastic resistances of its basic elements, as follows:
Taking into account Aa—the area of the steel shell, Ac—the area of the concrete core, and f—the corresponding material strength, the buckling coefficients are given for particular slenderness and displacement direction by buckling curves according to EN 1993-1-1, which are identical for both composite steel-concrete and steel columns.
3. Research Program and Test Members
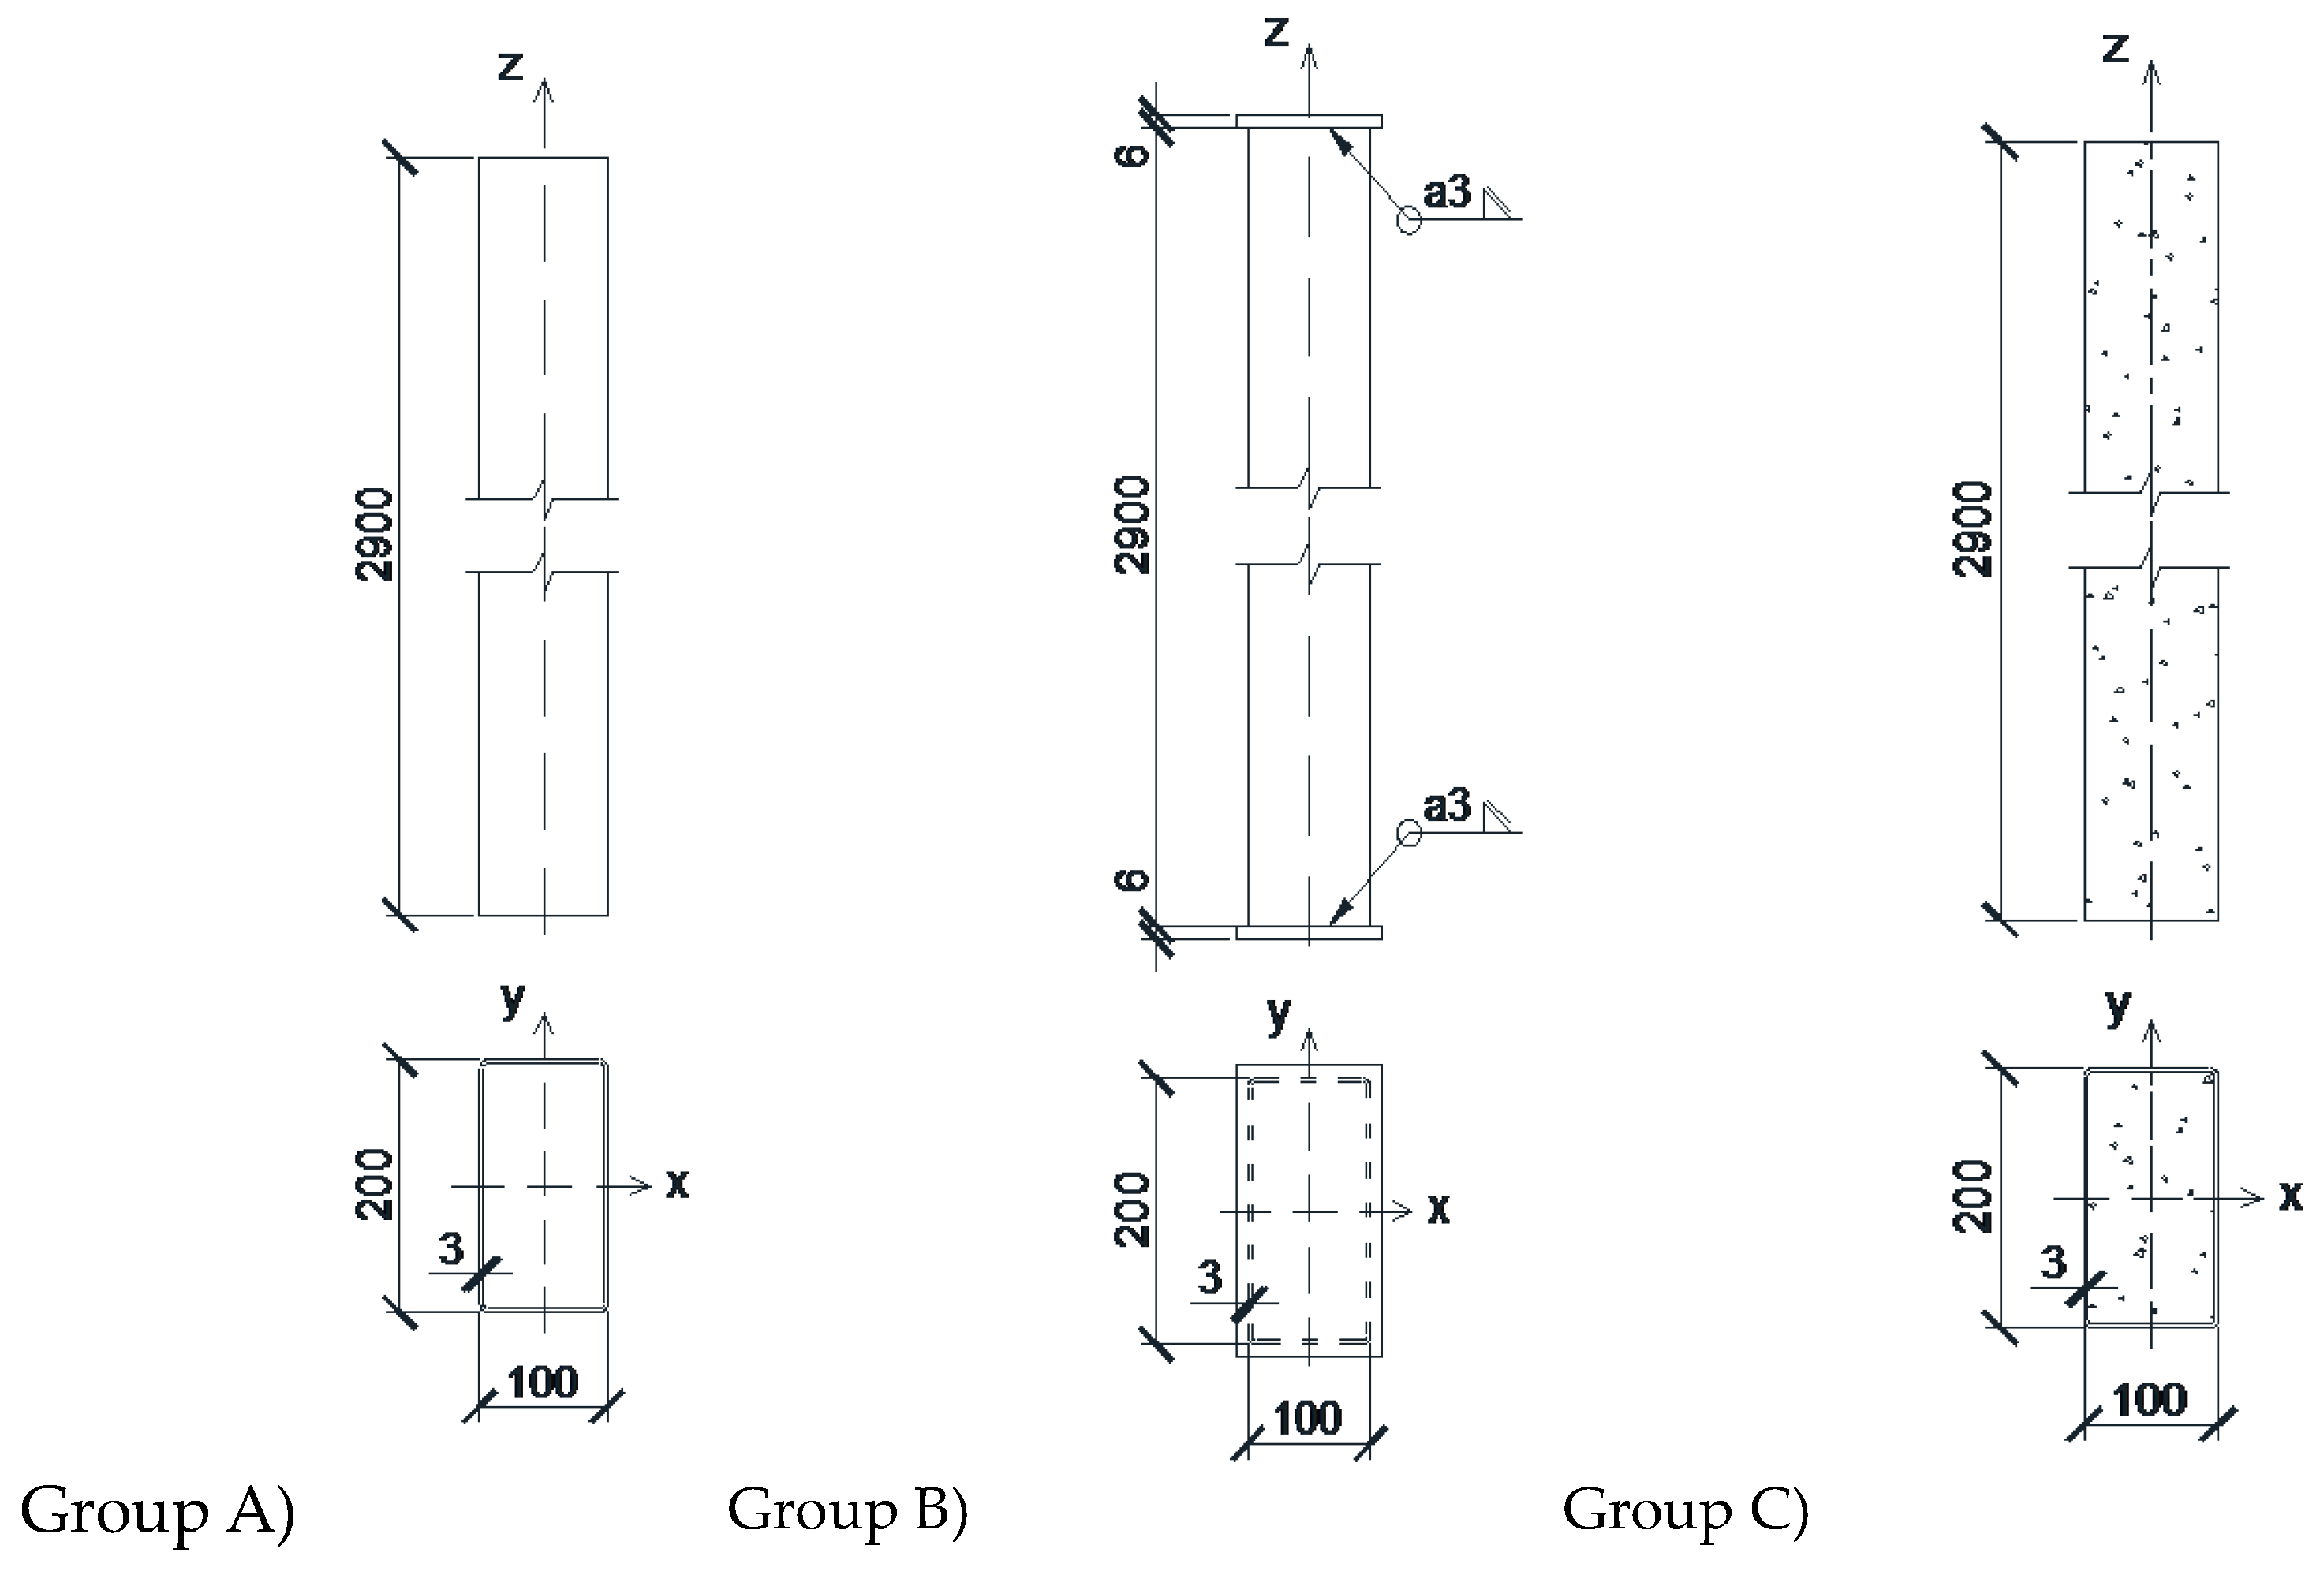
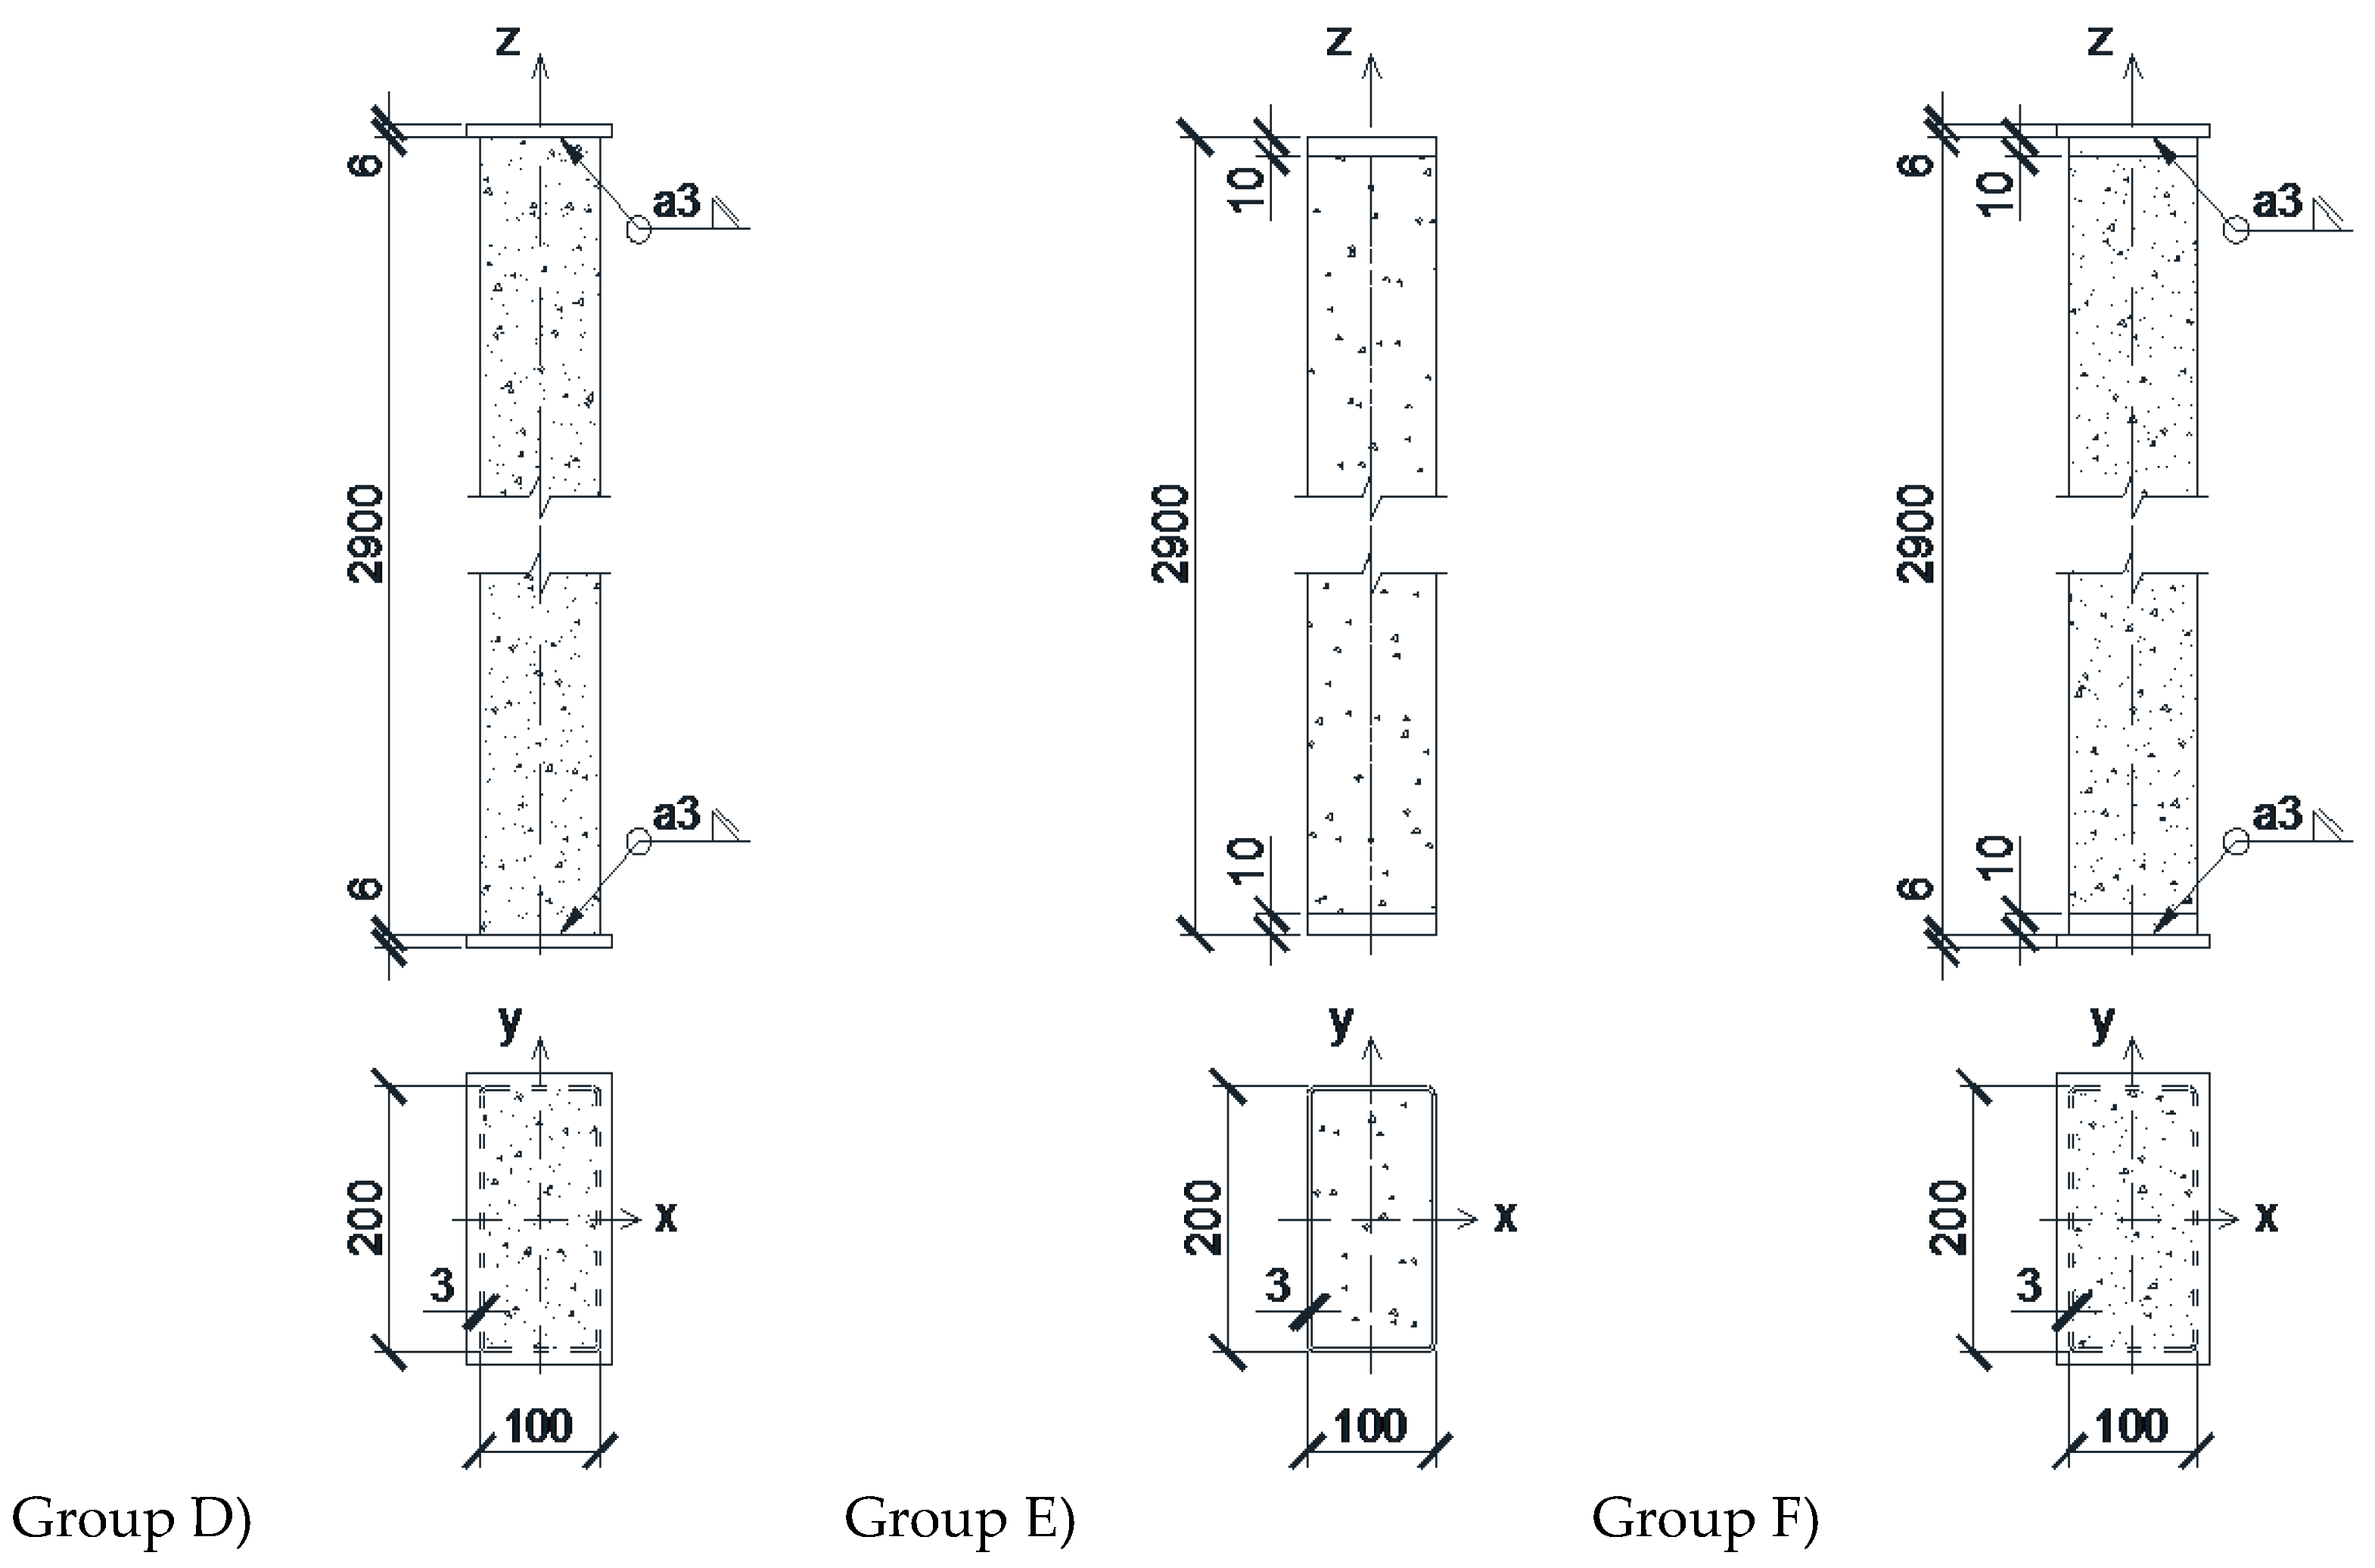
The main goal of the presented research was to verify the possibility of using steel tubes with thin webs (class 4) for concrete-filled columns, assuming a significant contribution of the concrete core to the elimination of local and global buckling. Before starting the aforementioned verification, a detailed analysis of the behavior of steel columns with a hollow cross-section was also necessary to compare the results and demonstrate the real benefit of the concrete filling. With this intention, 18 columns of RHS 200/100 × 3.0 mm profile with a length of 2900 mm were supplied by a specialized company for the purposes of experimental research. The columns were divided into six groups and each group consisted of three test members as shown in
Table 1. Schematic illustration of the test members is given by
Figure 1 and
Figure 2.
As presented in
Table 1, the same dimensions and materials were proposed for all test members. The difference lies in the characteristics of the individual groups:
Group A consists of 3 steel columns with hollow profiles without filling and without steel front plates at the ends, so that the compressive load acts directly on the edges of the steel profile;
Group B consists of 3 steel columns with hollow profiles without filling, but with steel front plates of dimensions 220 × 120 × 6.0 mm welded at the ends of the columns, so that the compressive load acts evenly on the edges of the steel profile through the plates;
Group C consists of 3 steel columns filled with concrete without steel front plates at the ends, so that the compressive load acts directly on the composite cross-section;
Group D consists of 3 steel columns filled with concrete with steel front plates of dimensions 220 × 120 × 6.0 mm welded at the ends of the columns, so that the compressive load is evenly distributed through the plates;
Group E consists of 3 steel columns filled with concrete without steel front plates at the ends. The concrete filling is shorter in the length, i.e., the steel tube protrudes 10 mm at the ends of the column, so that the compressive load acts directly on the edges of the steel profile;
Group F consists of 3 steel columns filled with concrete with steel front plates of dimensions 220 × 120 × 6.0 mm, welded at the ends of the columns. The concrete filling is shorter in length, i.e., the steel tube protrudes 10 mm at the ends of the column. The compressive load acts evenly on the edges of the steel profile through the plates.
4. Preparation for Experimental Tests
Before starting the experimental tests, detailed measurements of real dimensions such as width b, height h, thickness t, and length L were taken at several locations of all test members. The average values of the measured dimensions were considered as geometric characteristics and were used in the numerical analysis and 3D modeling of the test members.
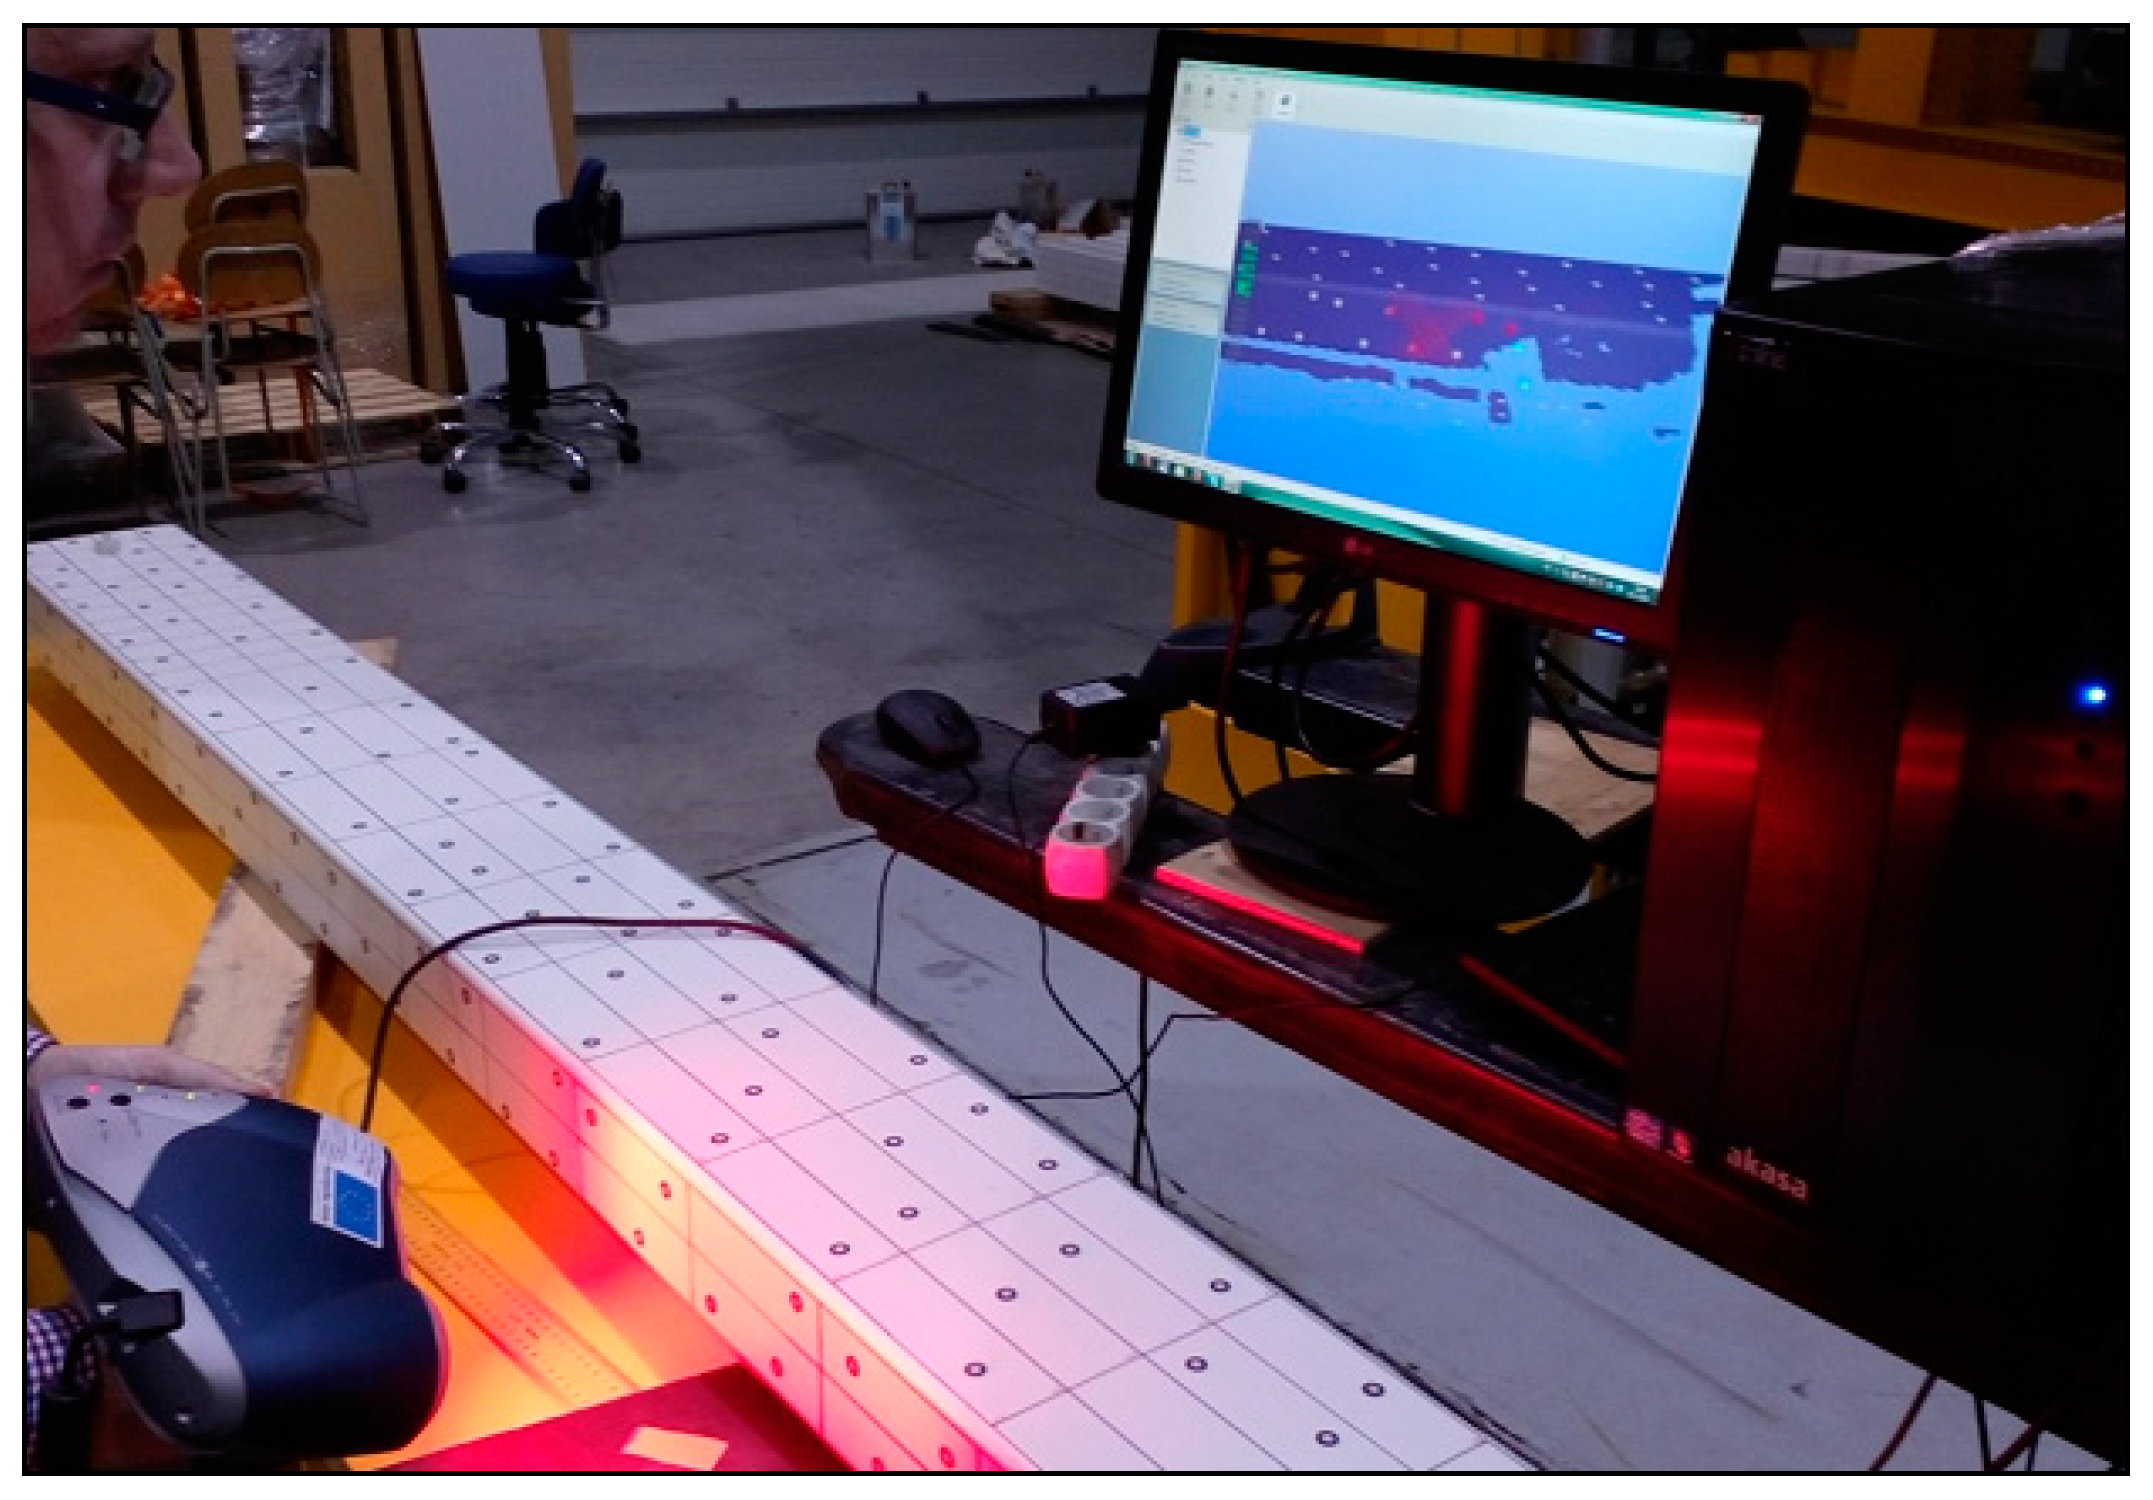
One of the main goals of the conducted research was the investigation of post-critical behavior of thin webs of the test members. Therefore, the initial imperfections of the slender webs are very important for the numerical analysis and evaluation of the results. In this context, the initial buckling shapes of all webs of the test members were measured using a previously generated raster, by means of a portable 3D scanner EXAscan 30326, as shown in
Figure 3 and
Figure 4.
Determining the actual material properties of utilized steel and concrete was essential for the purposes of experimental research and numerical analysis.
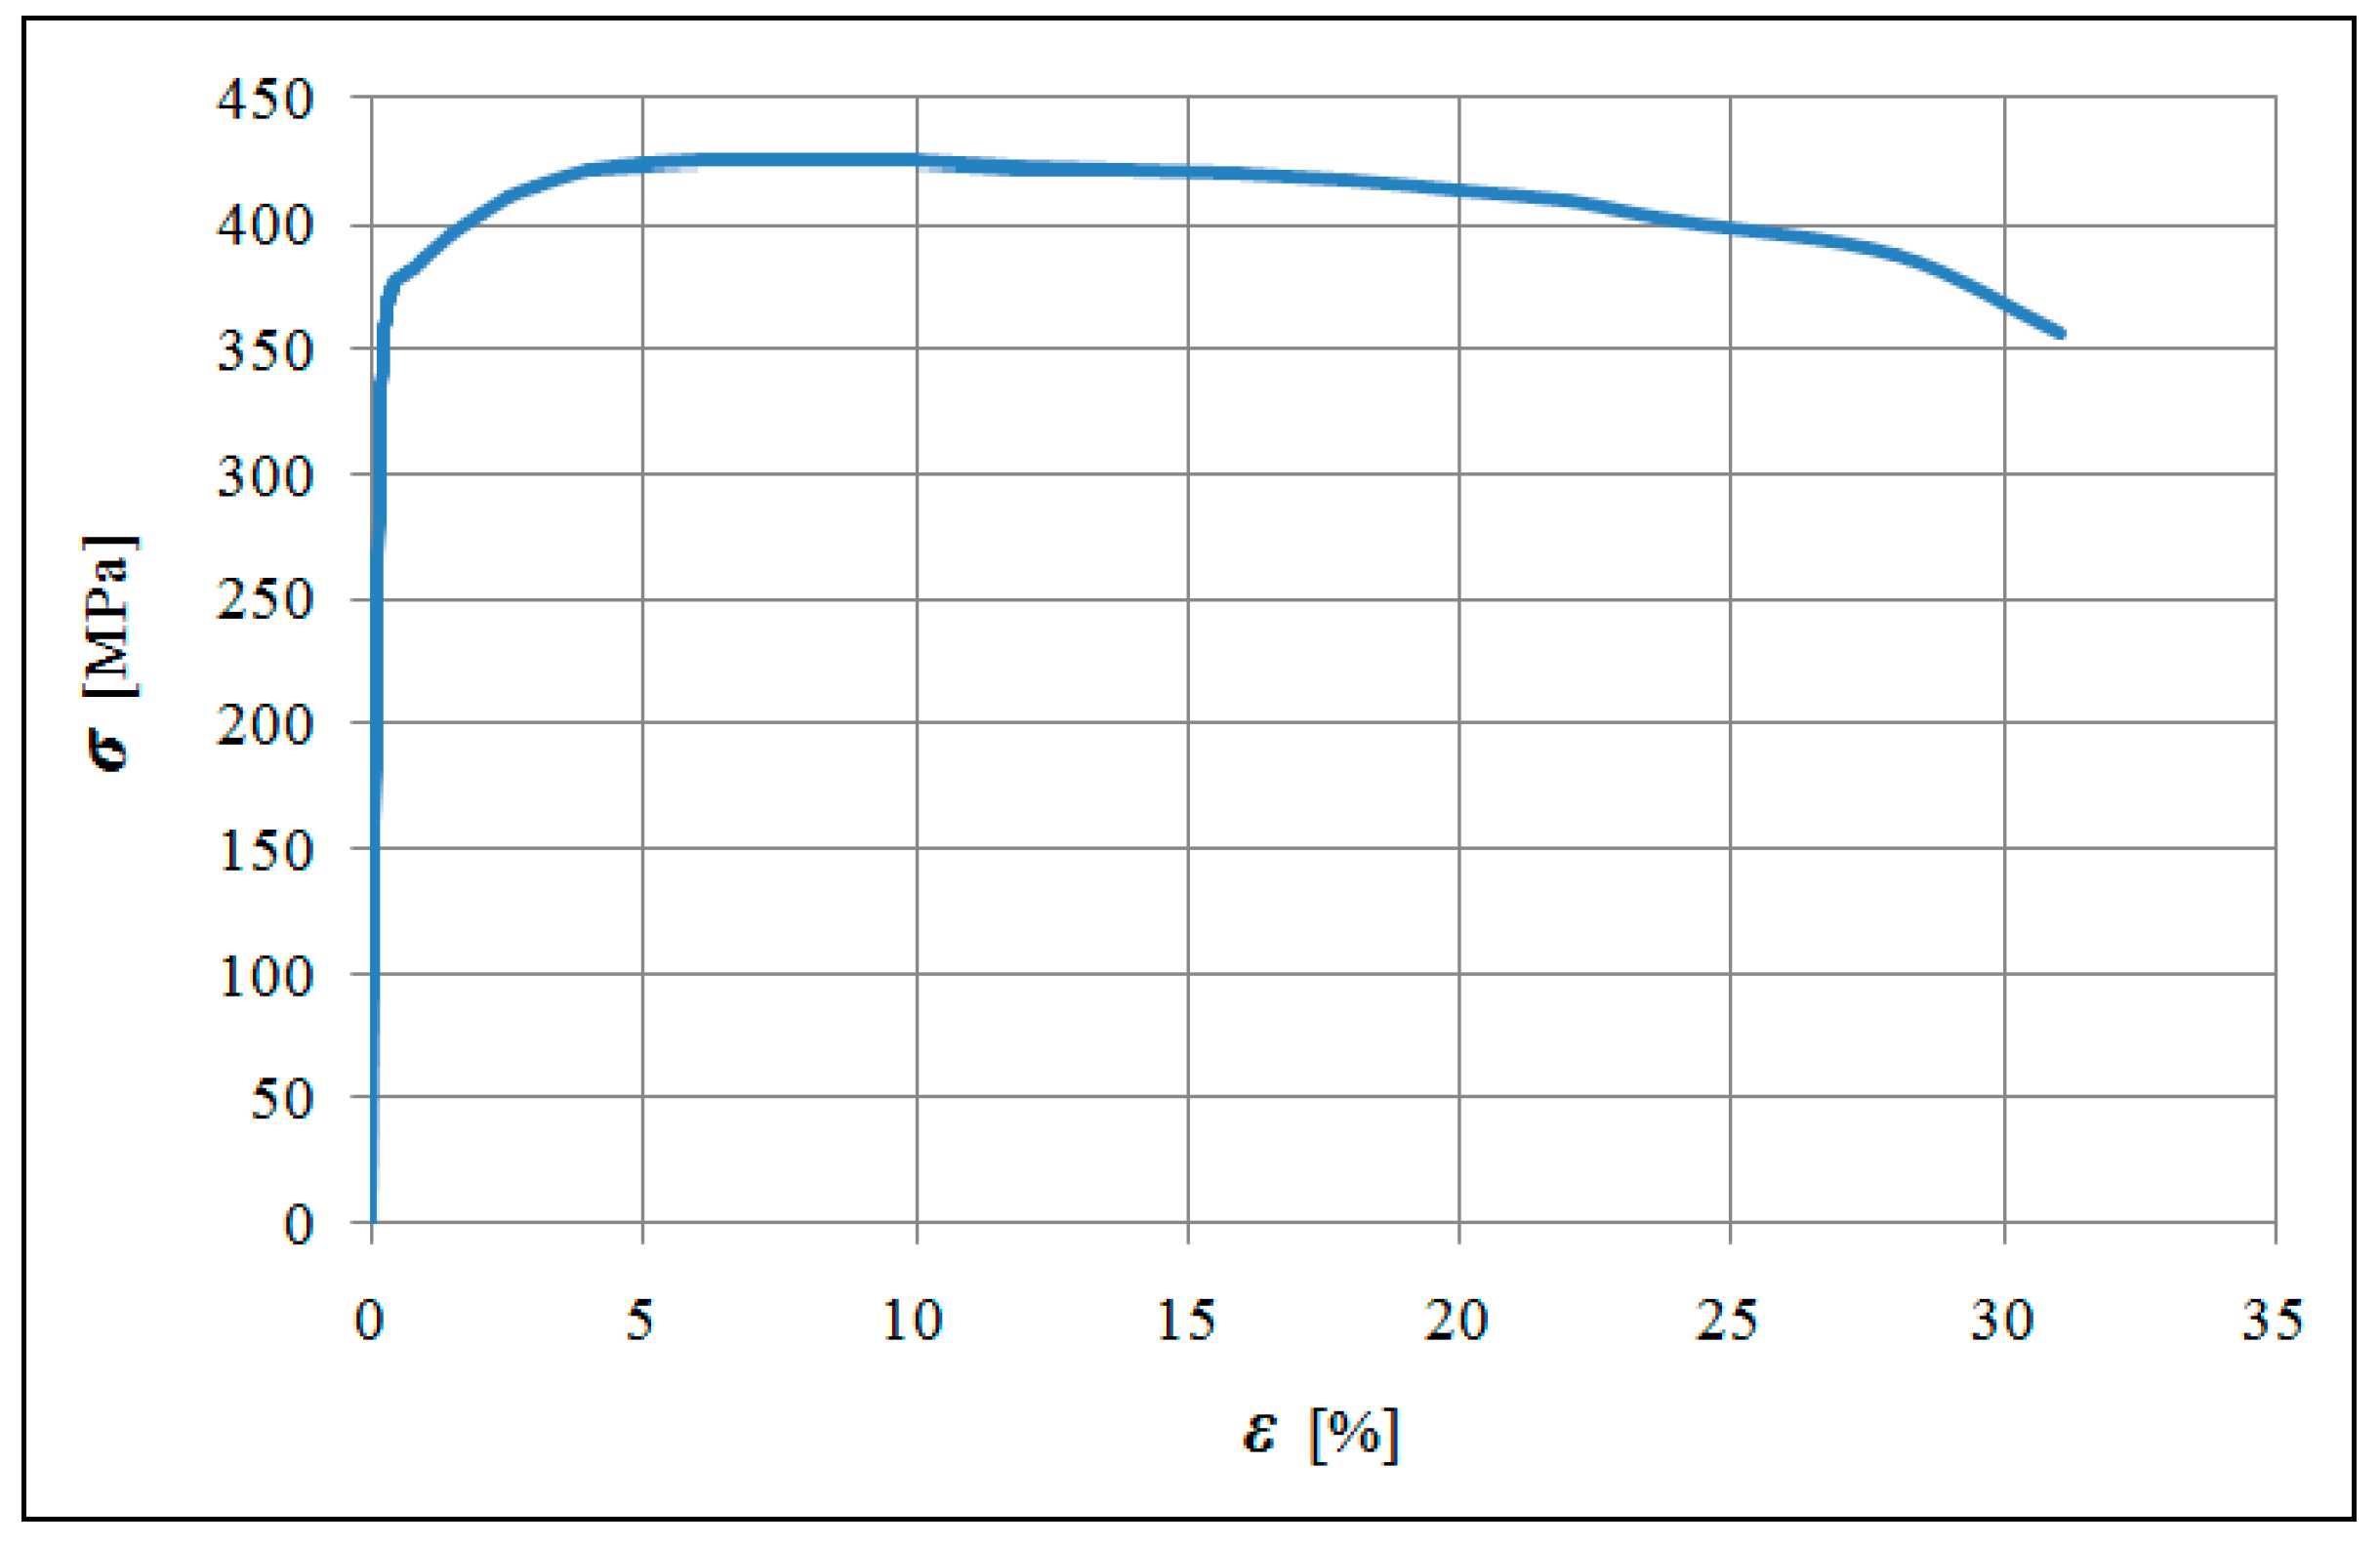
The material properties of the utilized steel were determined by tensile tests, and the average values of the obtained yield and ultimate stresses
fy and
fu were considered in the calculation and 3D modeling.
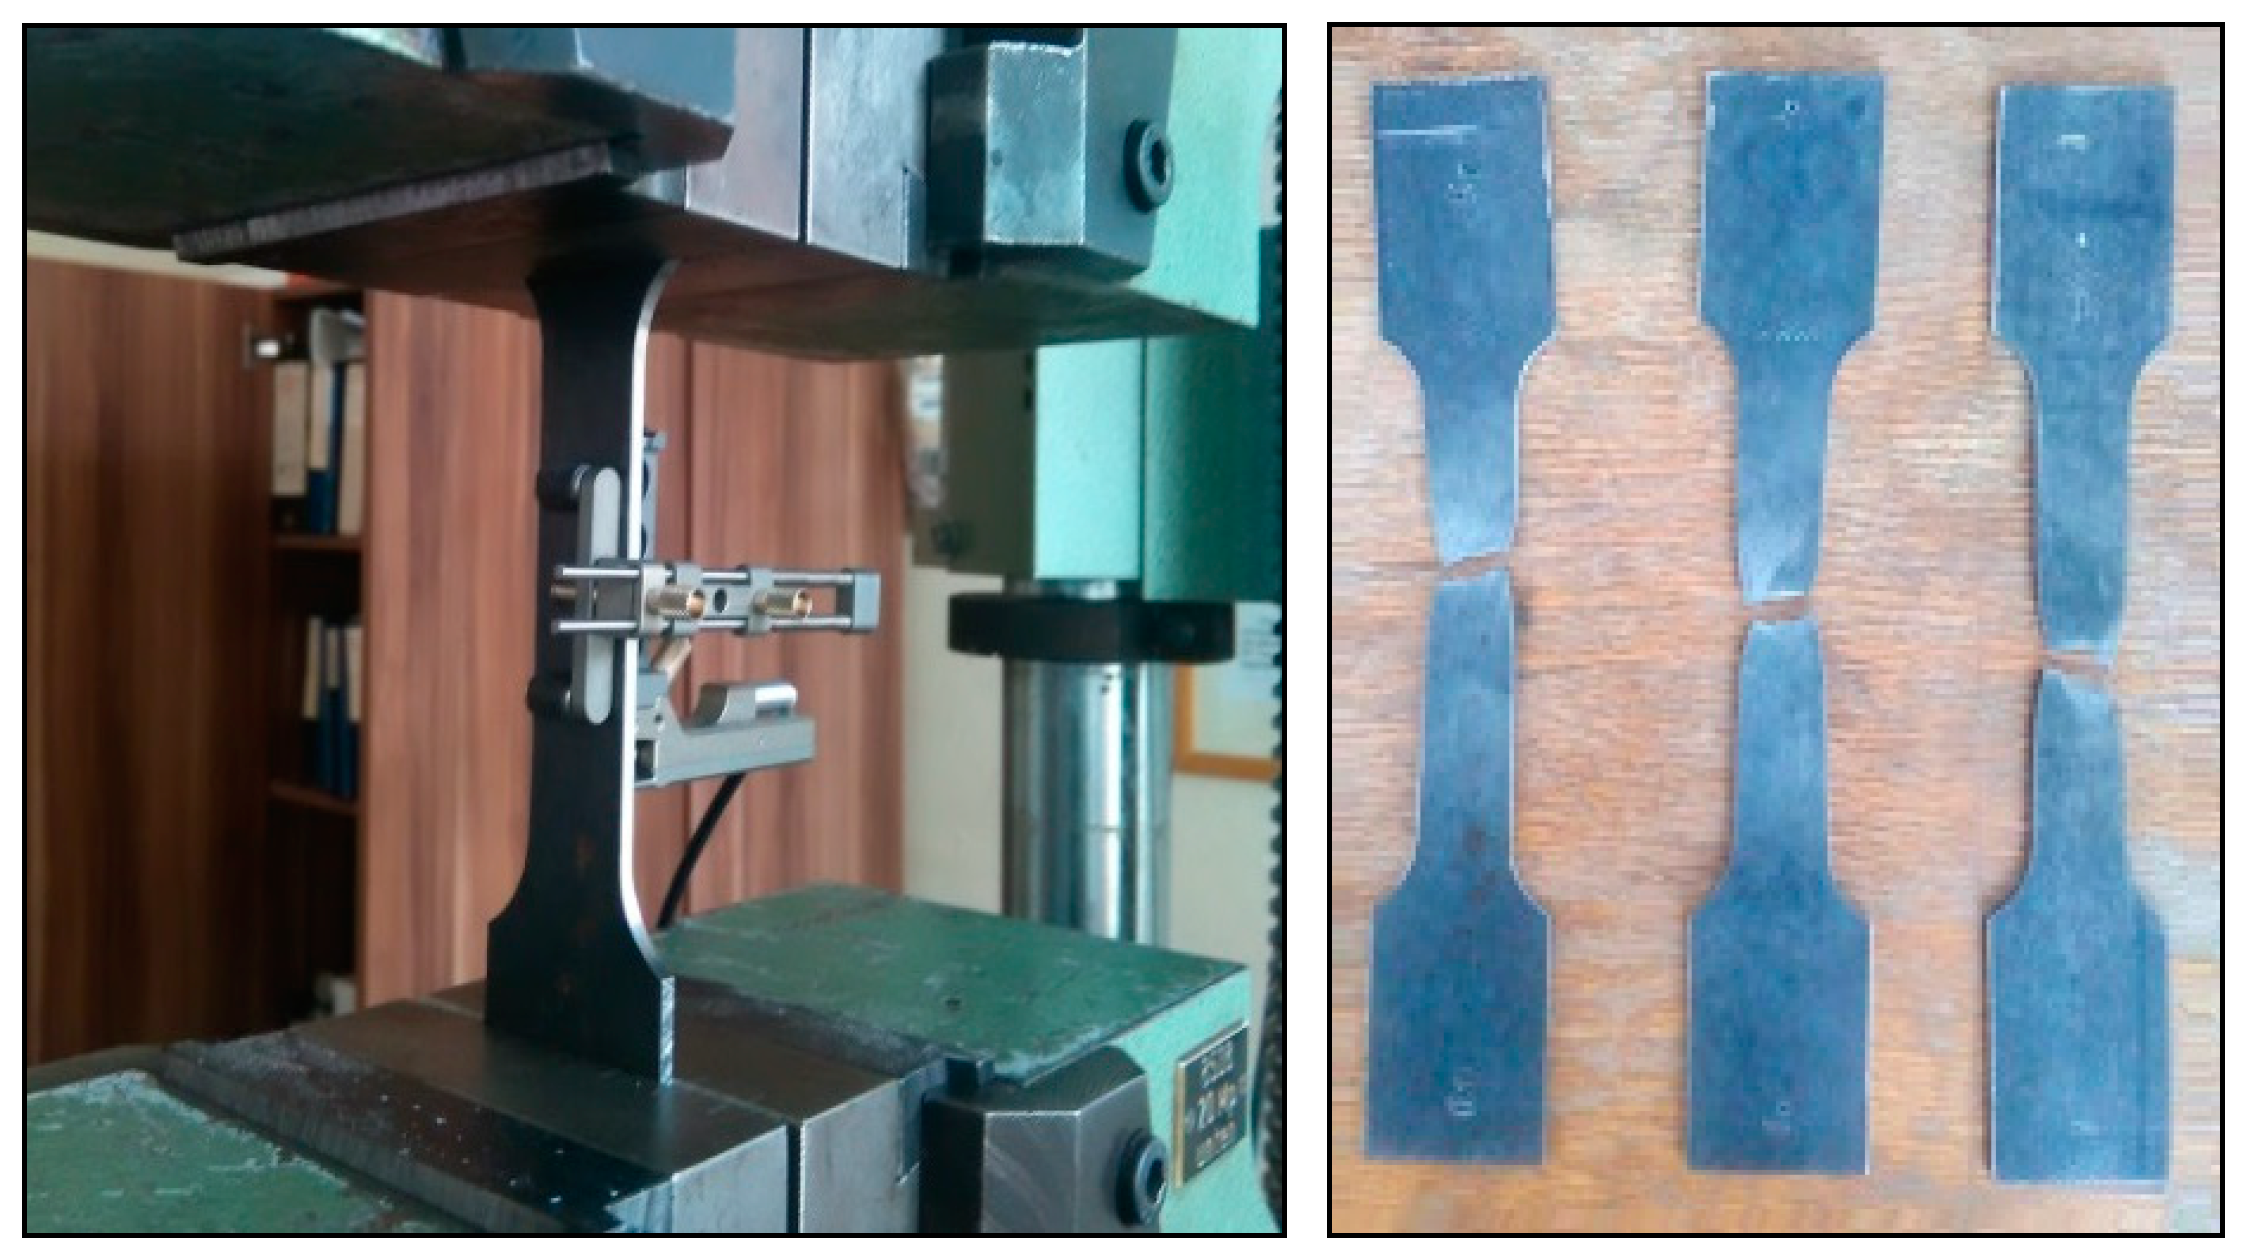
Figure 5 shows the tensile test configuration and some of the tested specimens. Fifteen tensile tests were performed. The obtained results from some tensile tests with average strength values are presented in
Table 2. One of the obtained strain–stress diagrams is illustrated in
Figure 6.
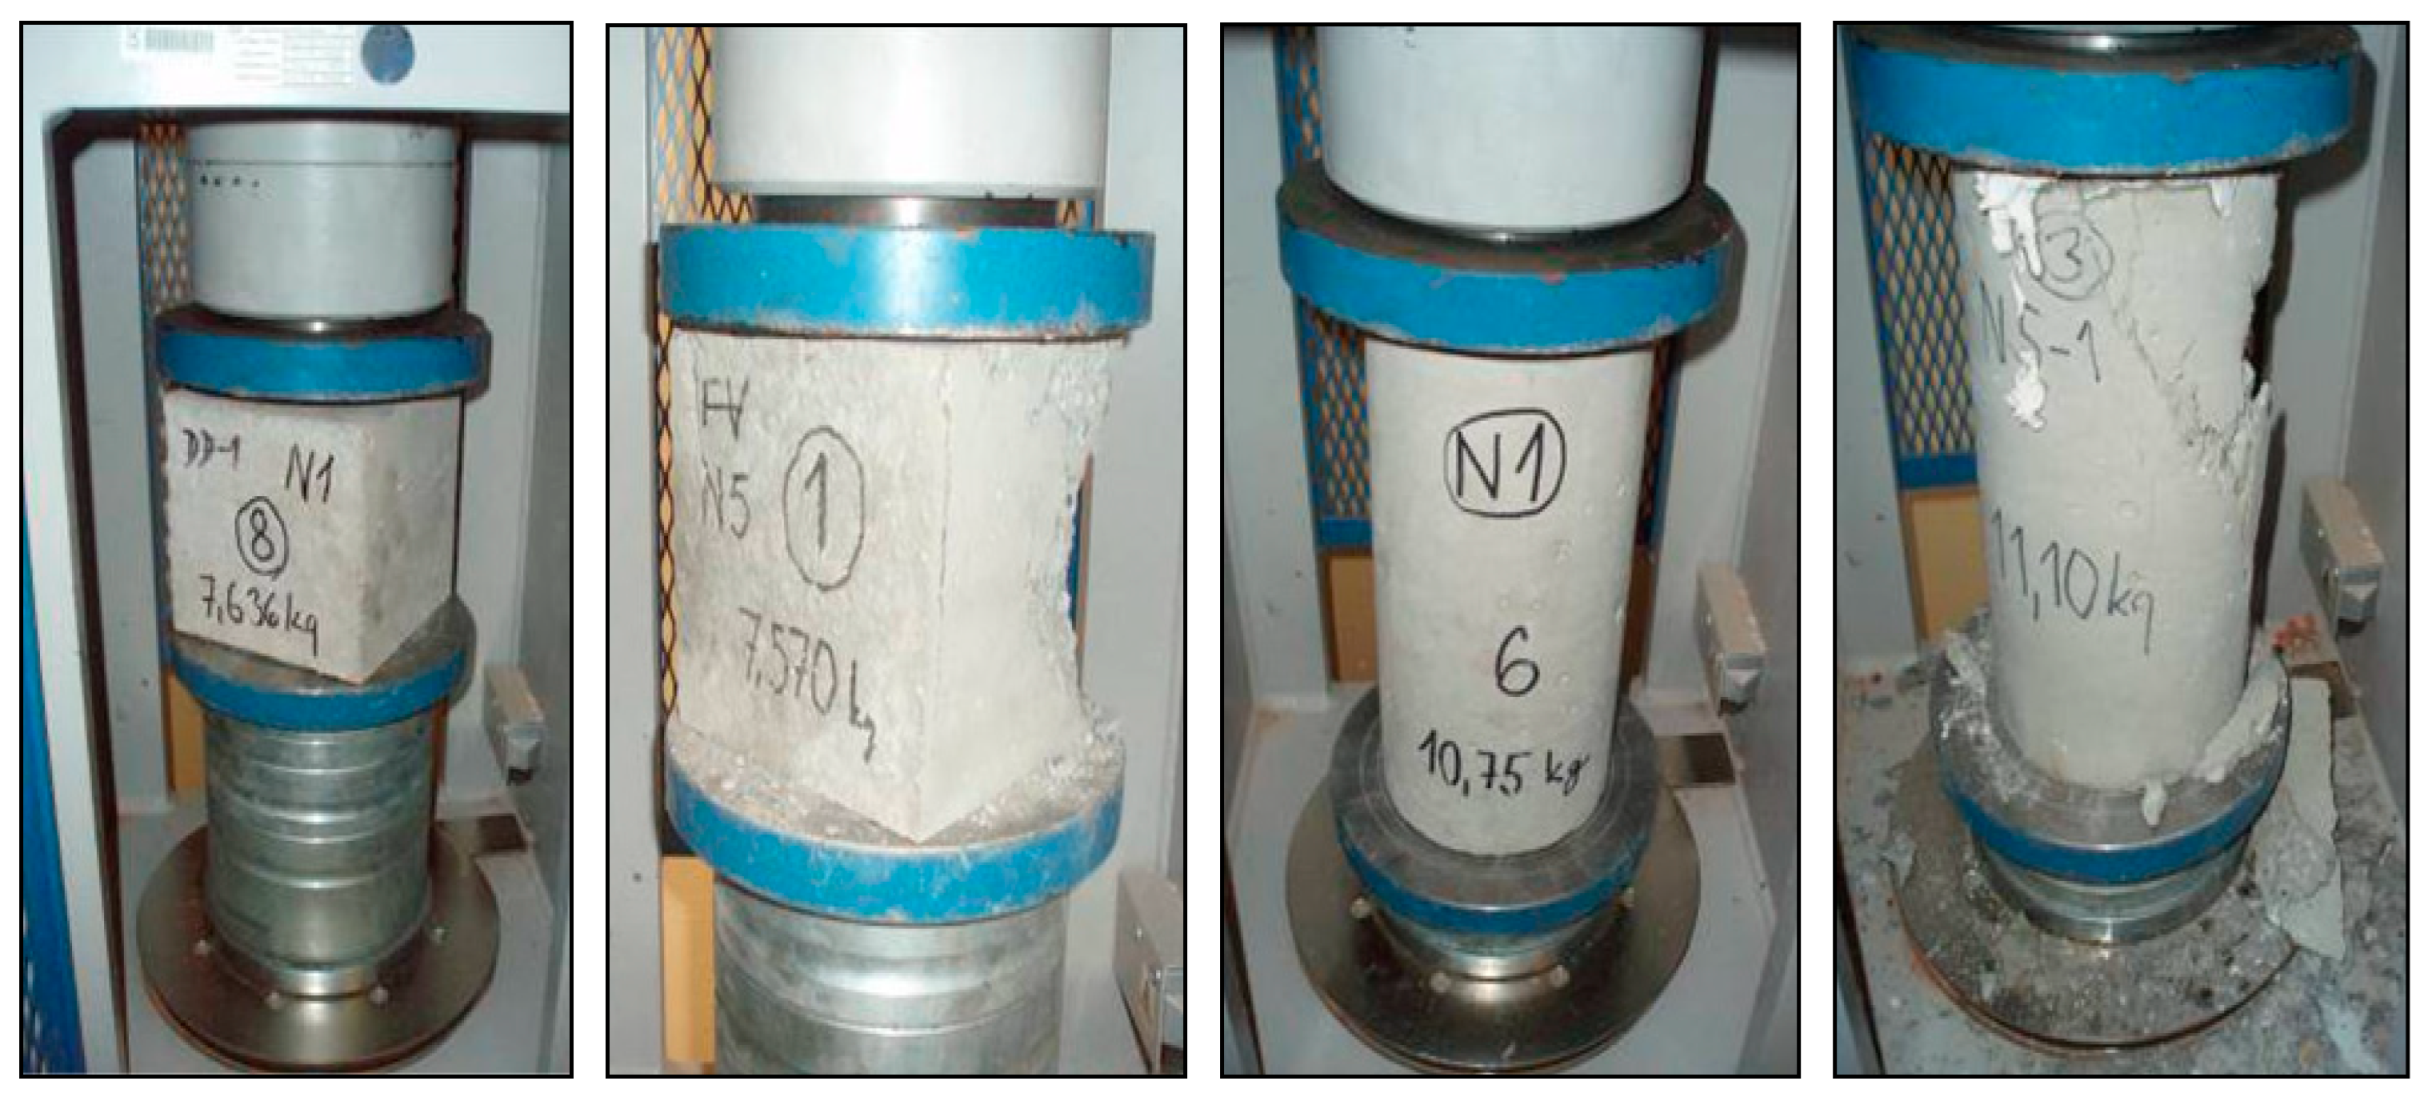
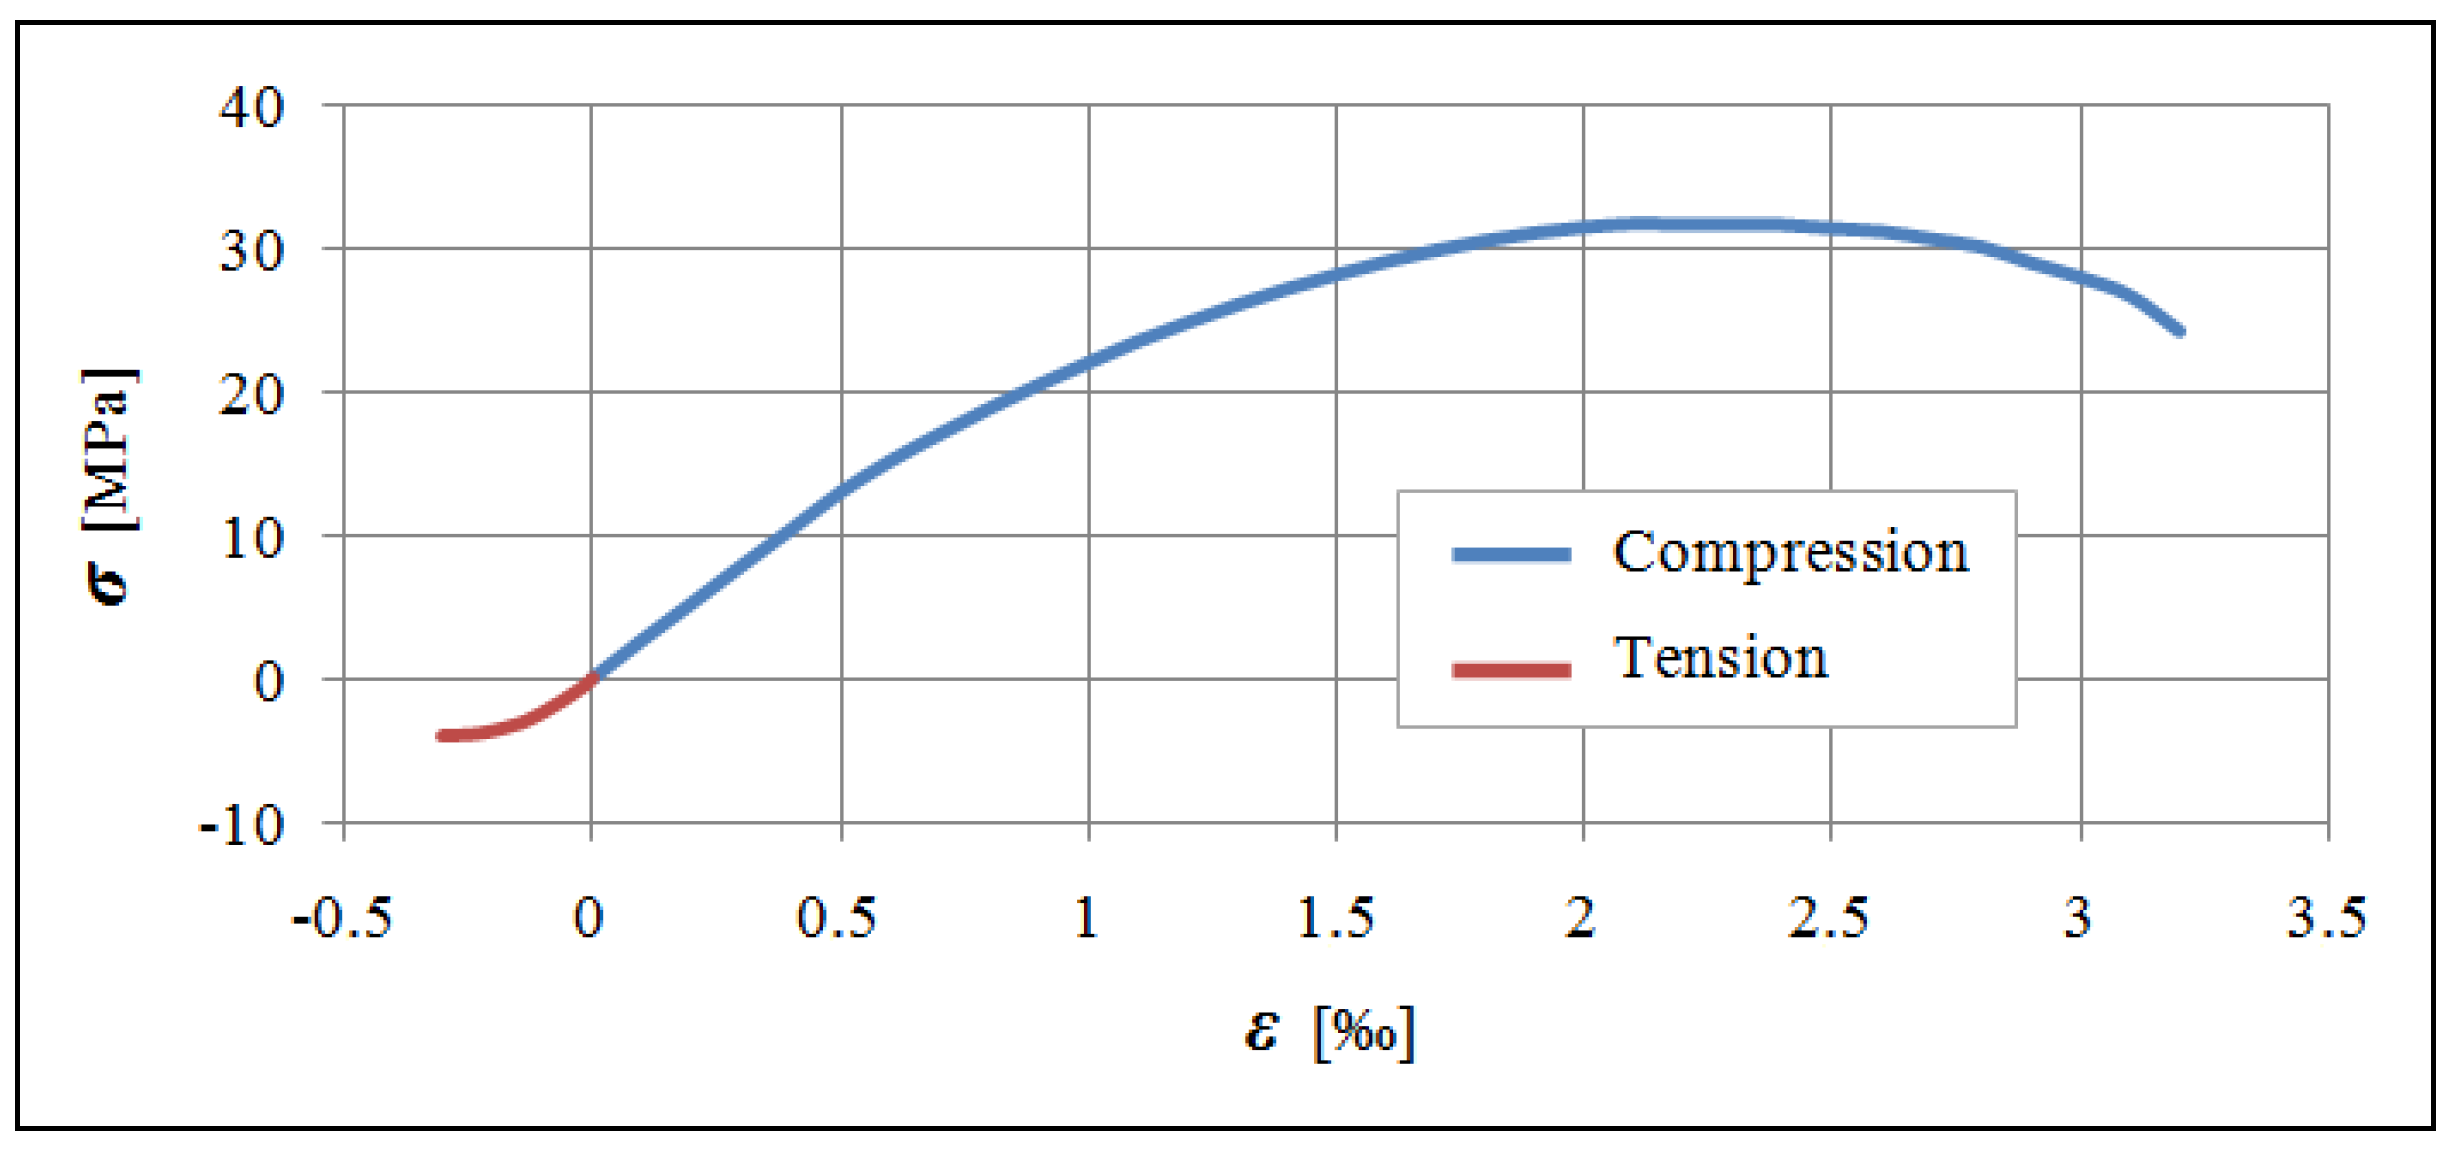
In order to determine the properties of the utilized concrete, cube and cylinder strength tests were carried out 28 days after the concreting. The average values of the obtained cube and cylinder strengths
fc were considered in the calculation and 3D modeling. More than 20 cube and cylinder strength tests were performed 28 and 150 days after concreting. The results obtained from some of these tests with average strength values are presented in
Table 3.
Figure 7 shows some specimens from the cube and cylinder strength tests. A selected strain–stress diagram obtained from the concrete strength tests is shown in
Figure 8.
To prepare the loading process and levels of loading steps during experimental tests, the theoretical resistances of the test members must be determined according to the relevant European standards. In this context, after obtaining the above-mentioned data, the theoretical resistances of the test members were calculated, except for the members of groups E and F, since there is no standard that deals with the calculation of these types. Therefore, limit loads and other results for members of groups E and F were obtained only from experimental tests and 3D simulation.
Except for the demanding works that required special preparations, all other works presented in this paper were carried out directly at the Center of Research and Innovation in Construction of the Technical University of Kosice, under the management of the Institute of Structural and Transportation Engineering and its research team.
5. Implementation of Experimental Tests
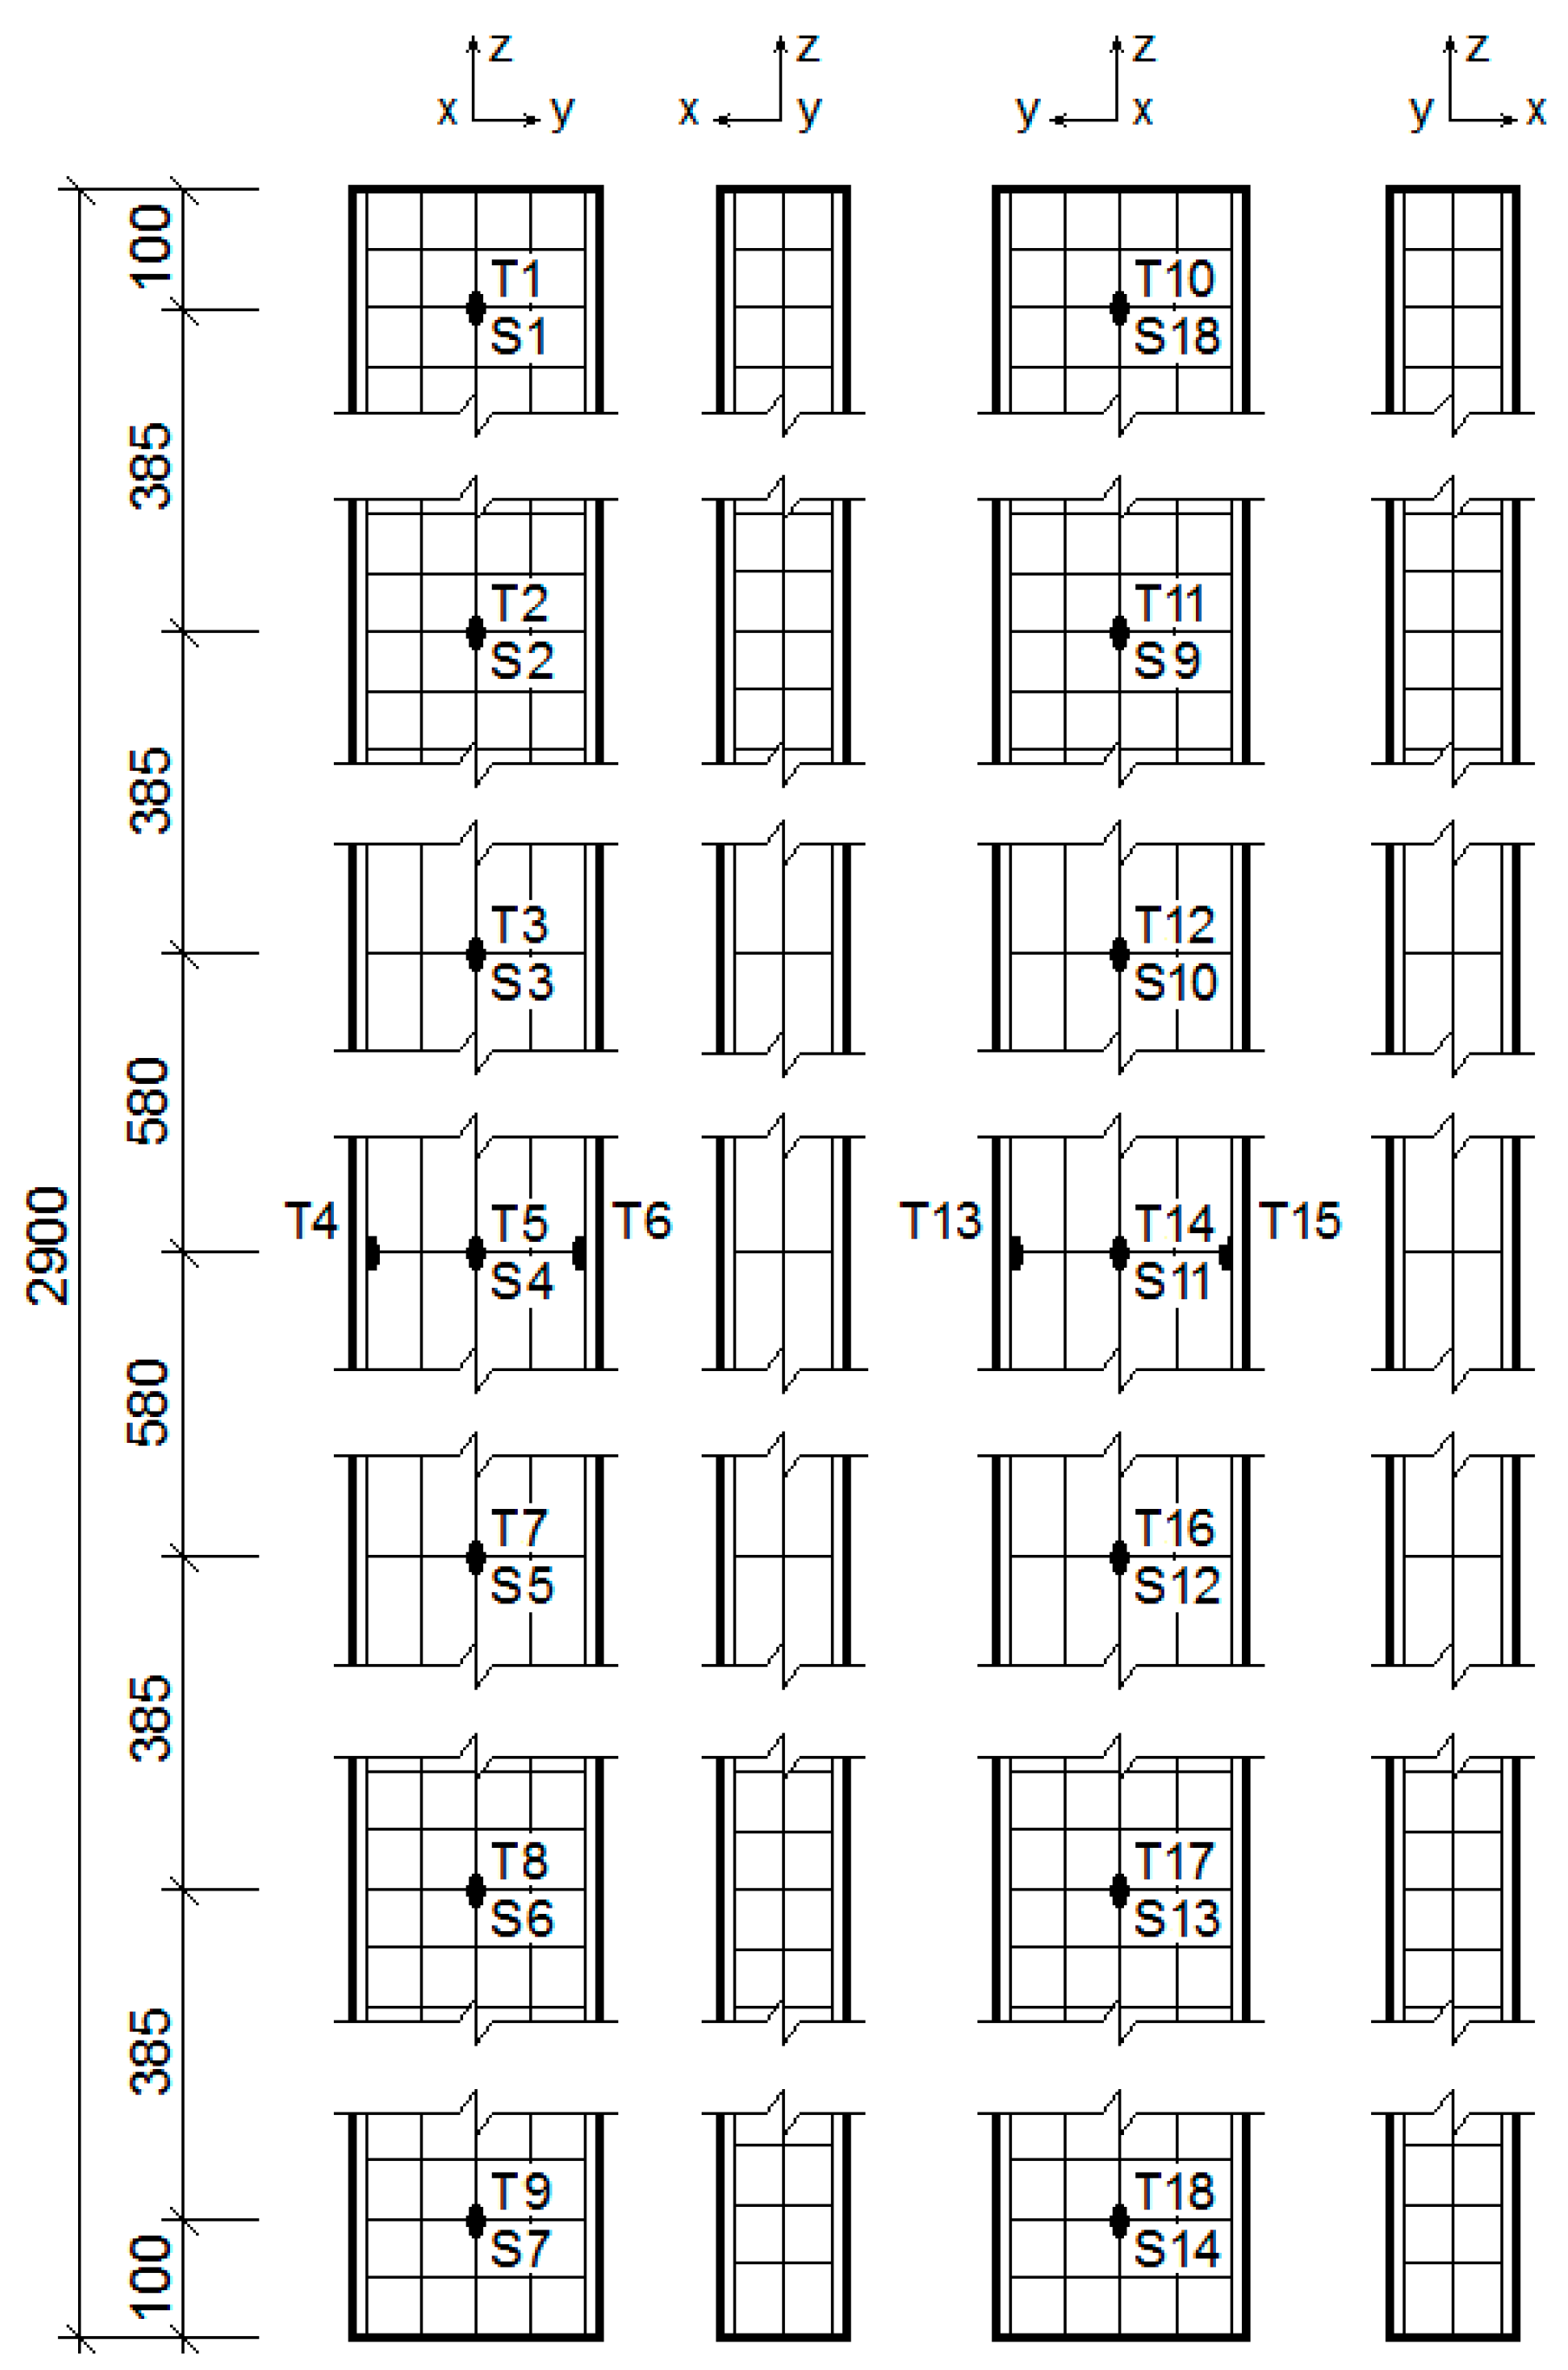
Strain gauges and inductive sensors were applied to the wider webs to monitor the strains
ε, deformations
w, and overall behavior of the test members. Their locations are shown in
Figure 9, where the strain gauges are marked as T and the inductive sensors are marked as S.
Strain gauges FLAB-6-11, with factor K = 2.09 ± 1%, were connected as a quarter-bridge to calibrated data bus MX1615B from HBM. The data bus was connected to computer Lenovo YOGA510. Software Catman Easy V5.1.3 was used for data recording and evaluation. Inductive sensors MESSOTRON WT20K and WA-100/200 were connected to the computer, also via data bus MX1615B.
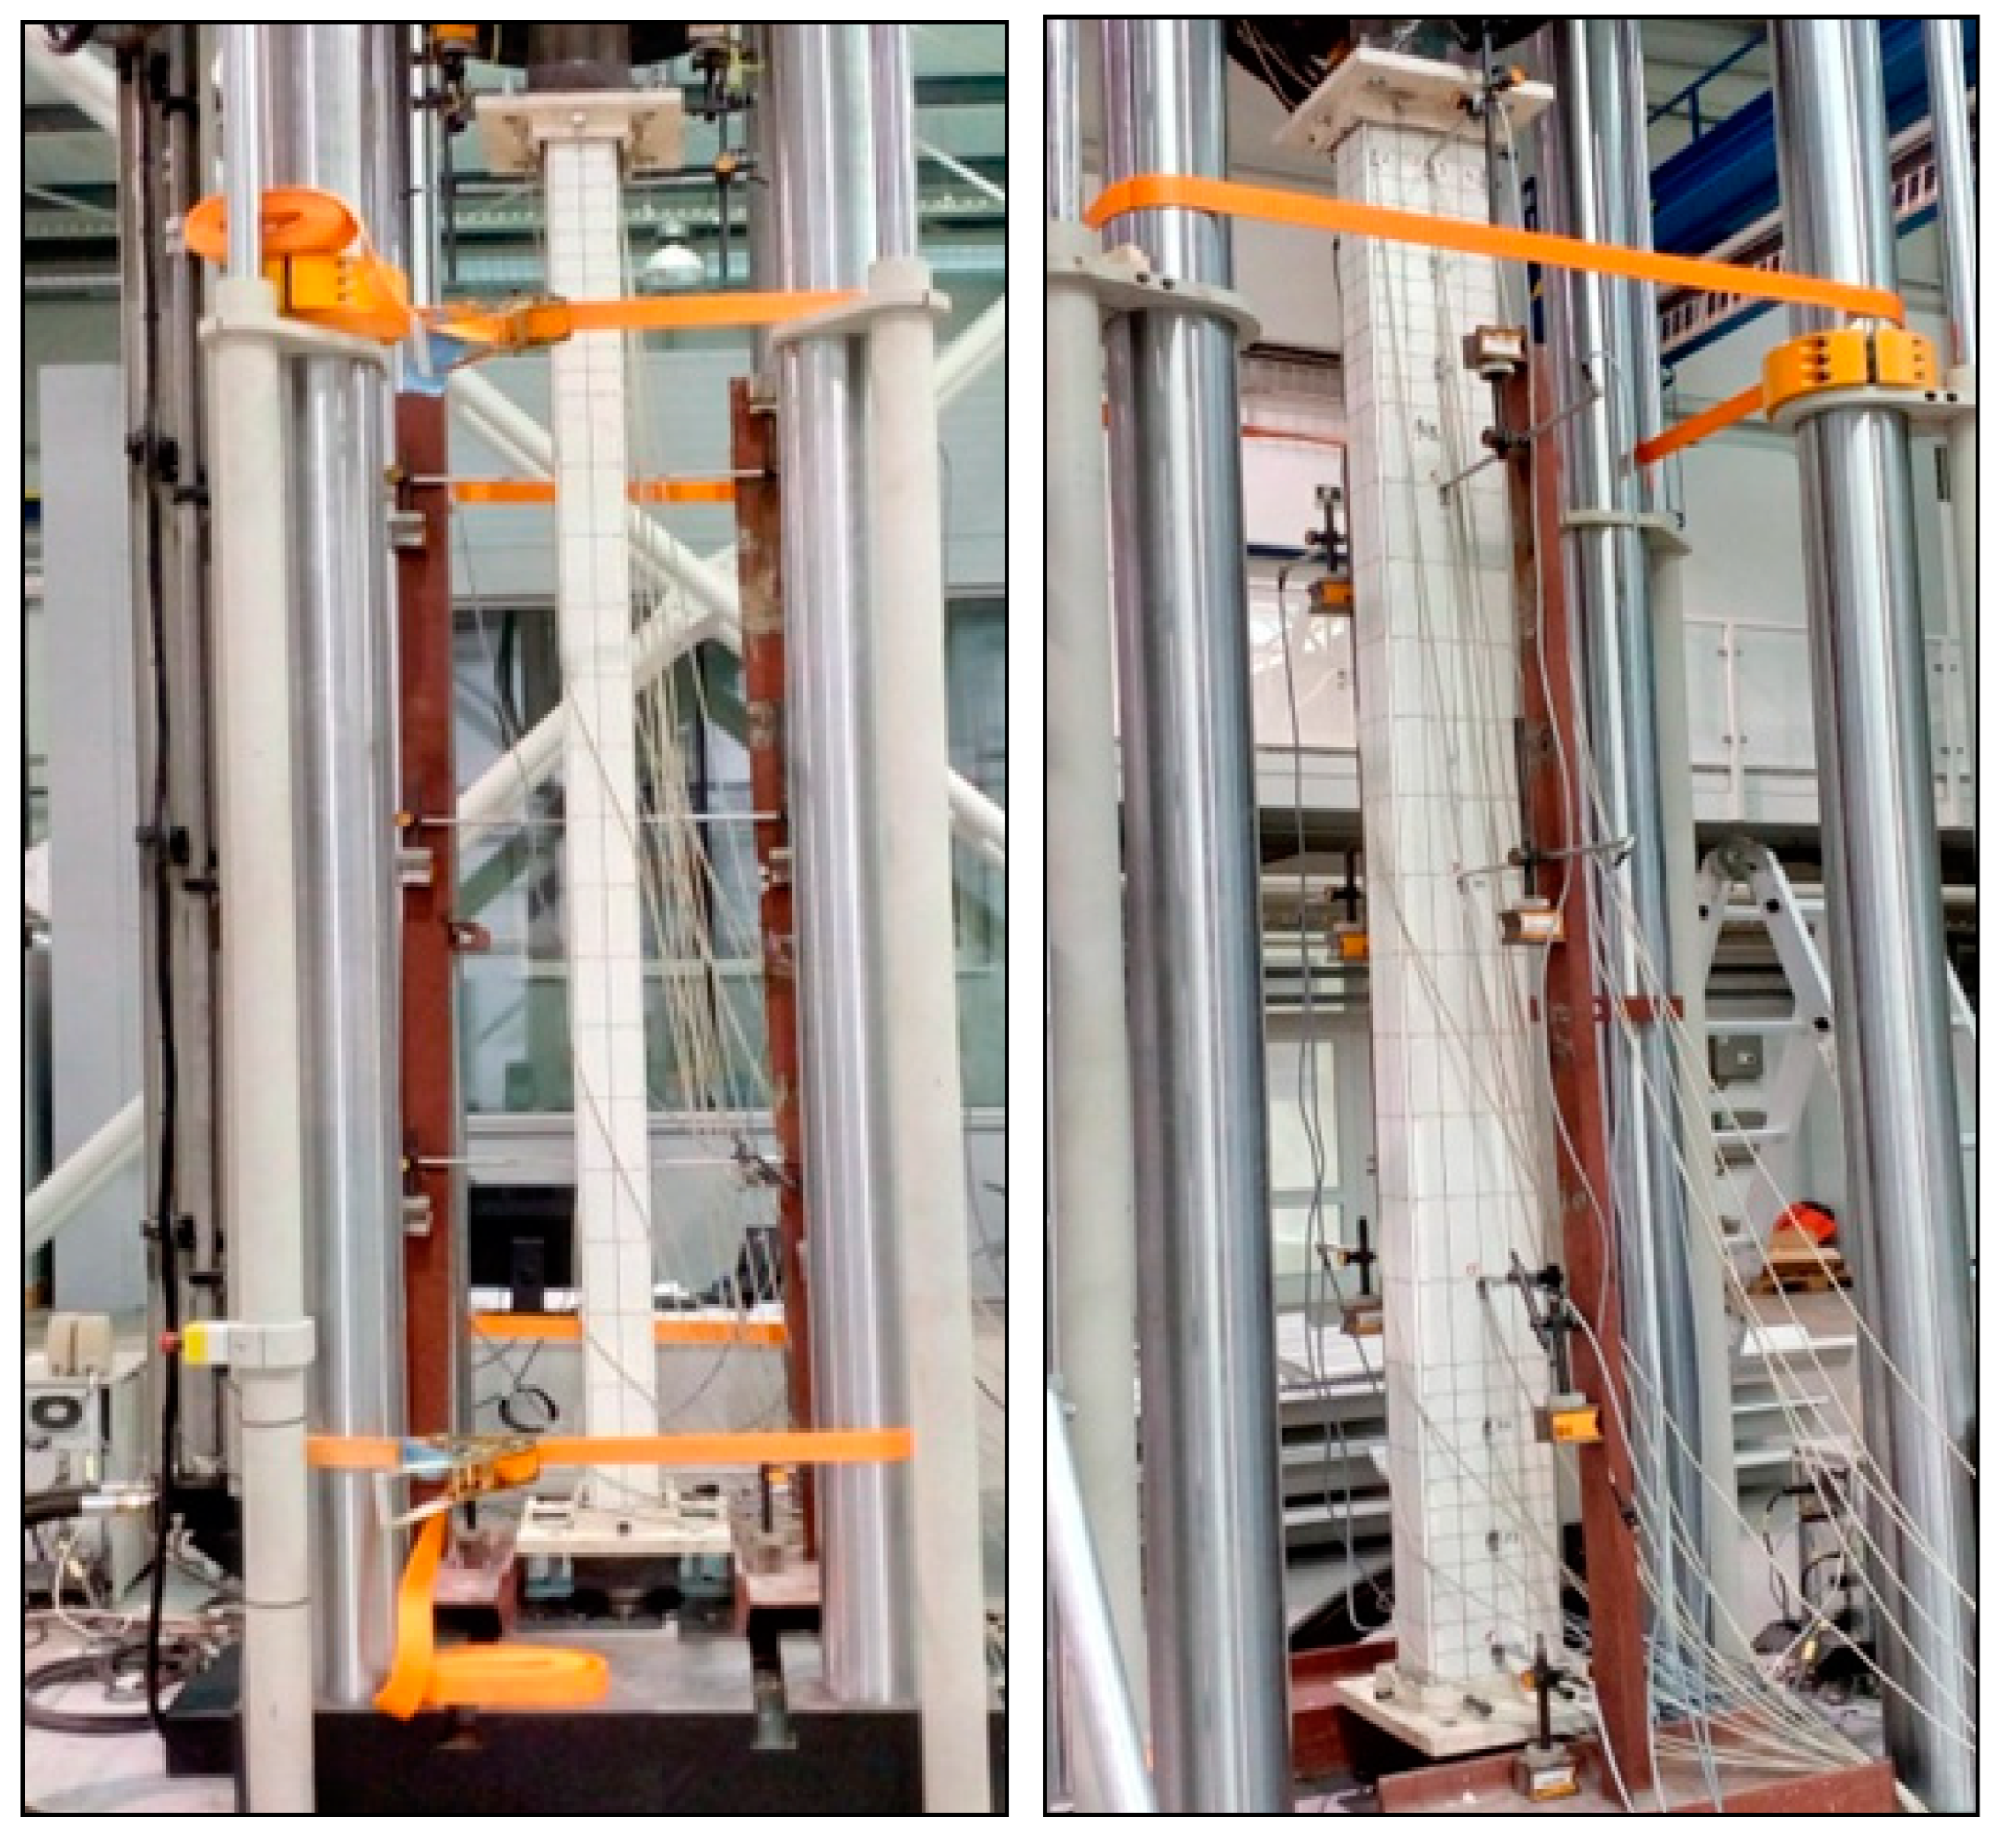
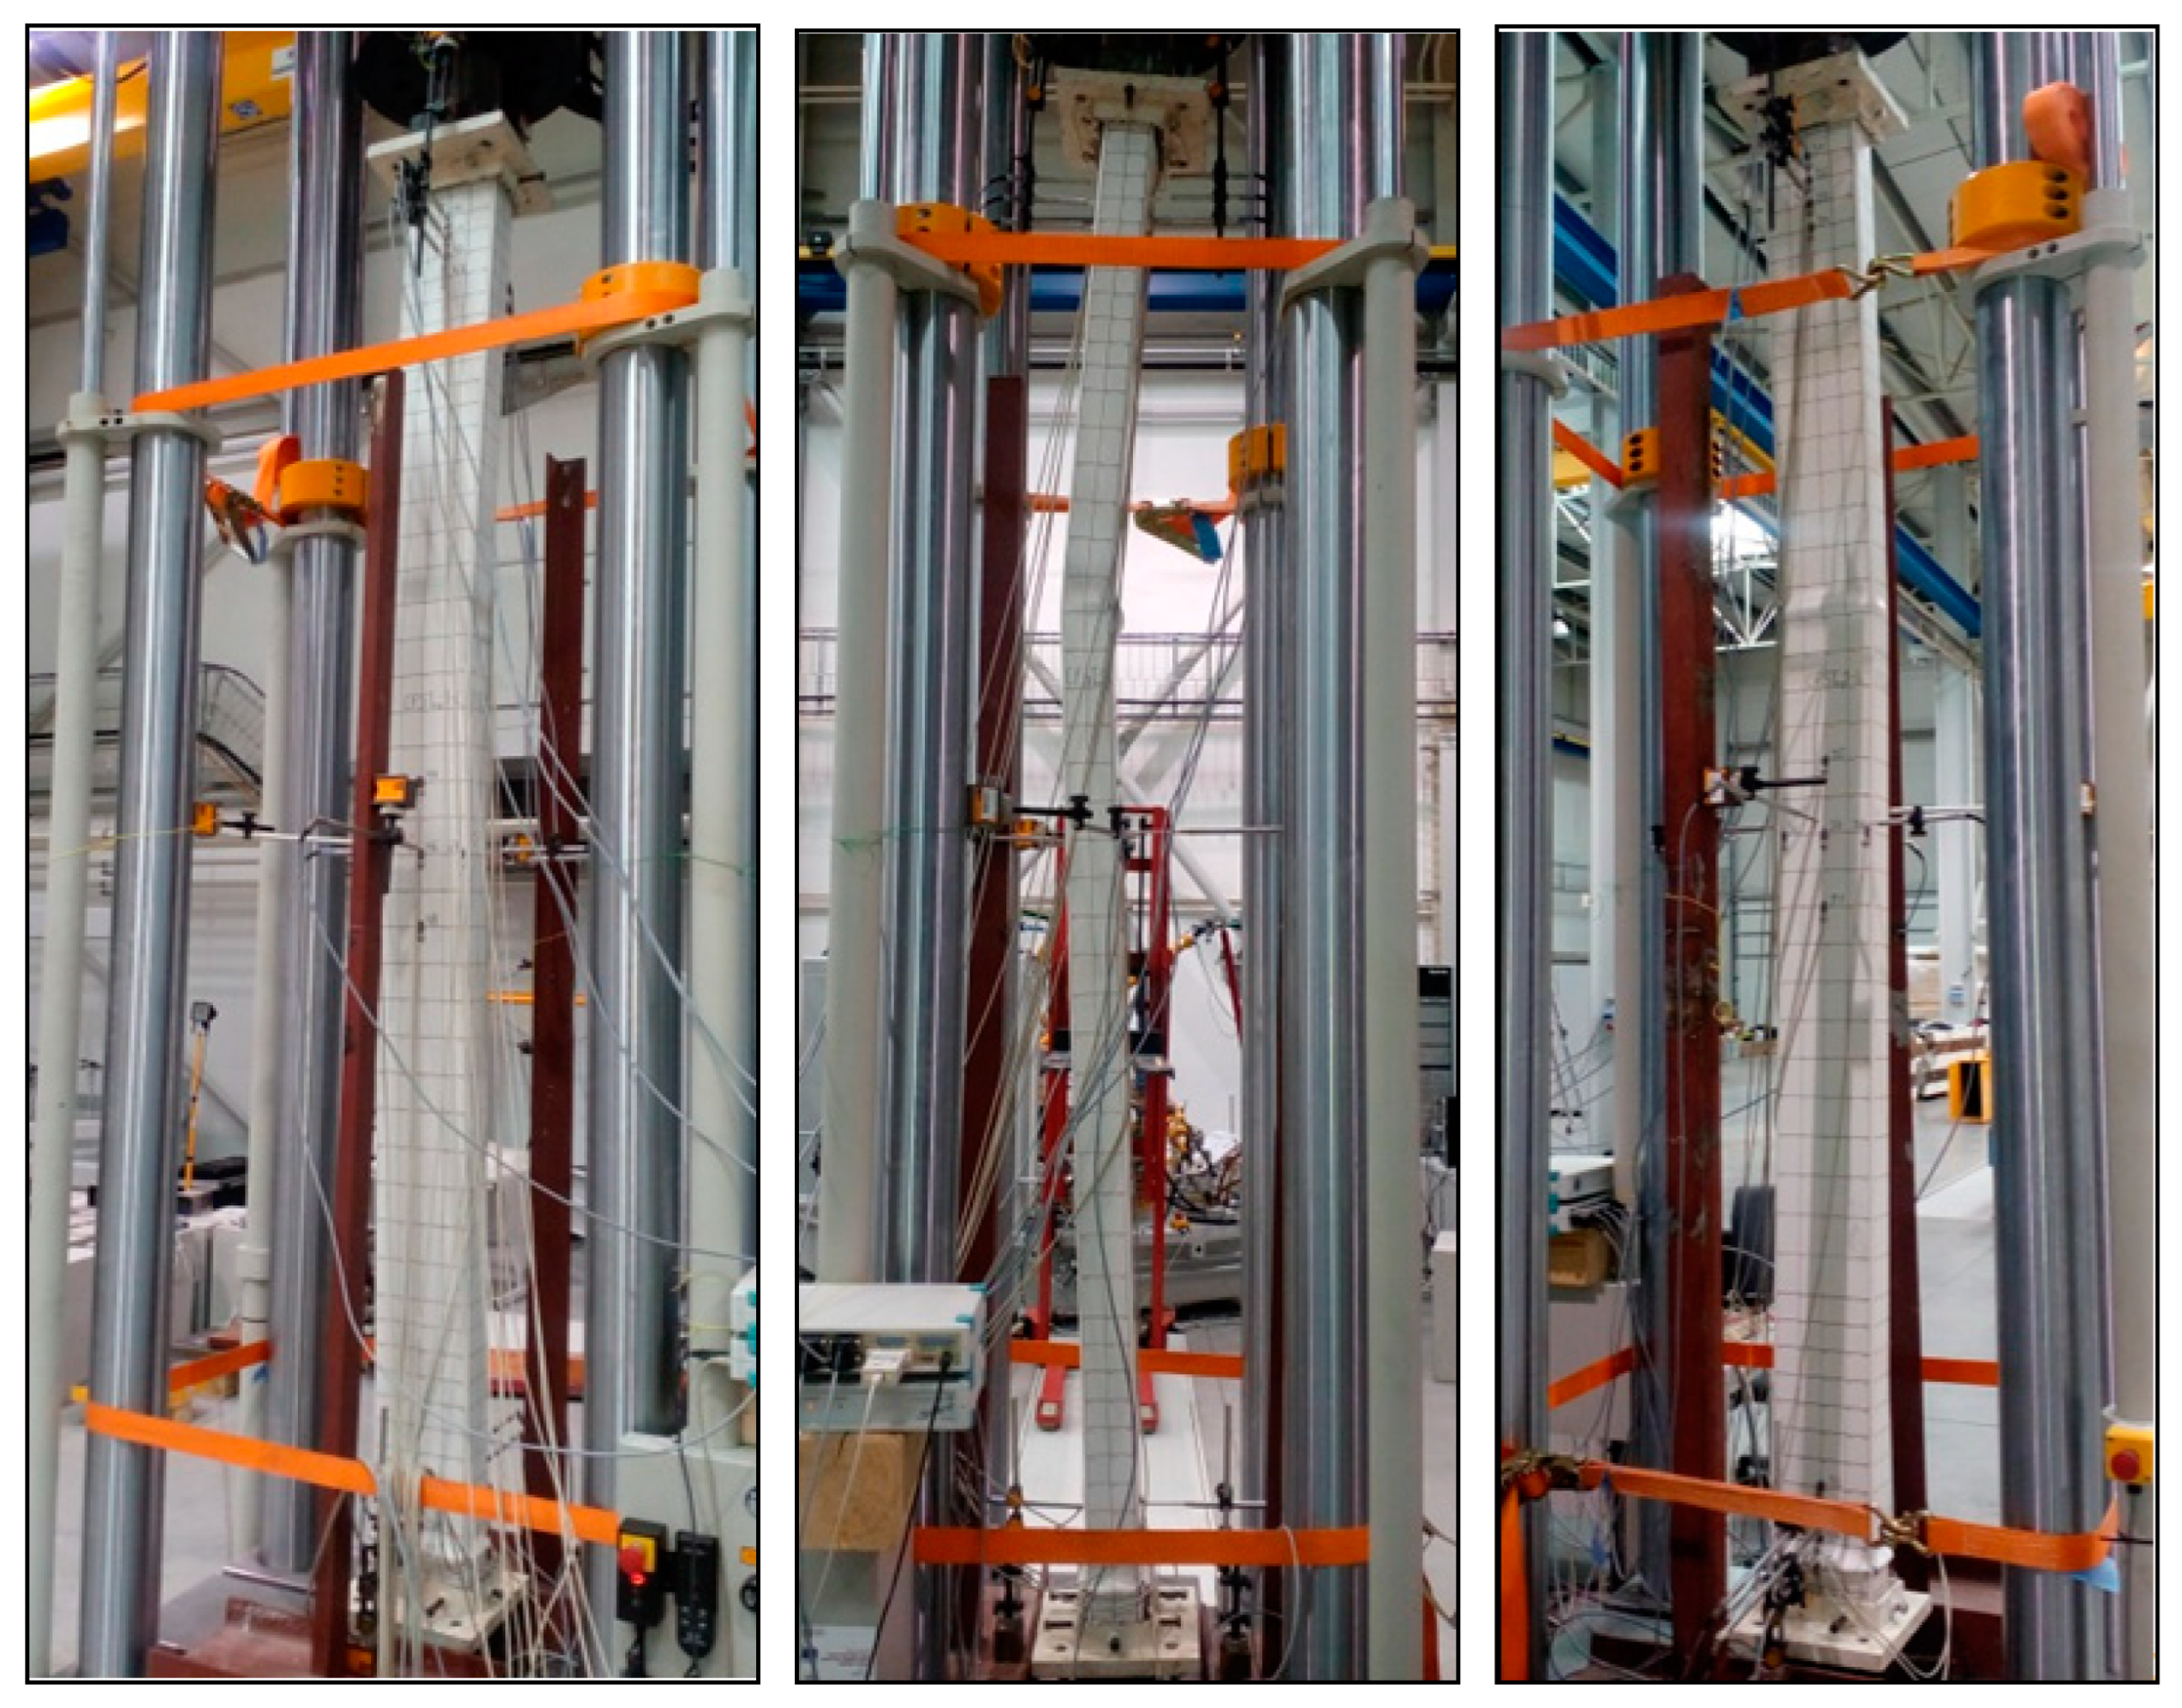
The loading process of the test members was carried out using high-capacity servo-hydraulic testing machine INSTRON 8806, see
Figure 10.
The tests were carried out under consecutive programmed loading, which continued until complete failure, defined by the continuous increase of strains ε and deformations w. The loading process of each tested member was regulated according to its real behavior and measured deformations.
During the loading process, each tested member was twice unloaded up to a load value of 5 kN; the first time when reaching 25% of its predetermined theoretical resistance, and the second time at 50% of this resistance.
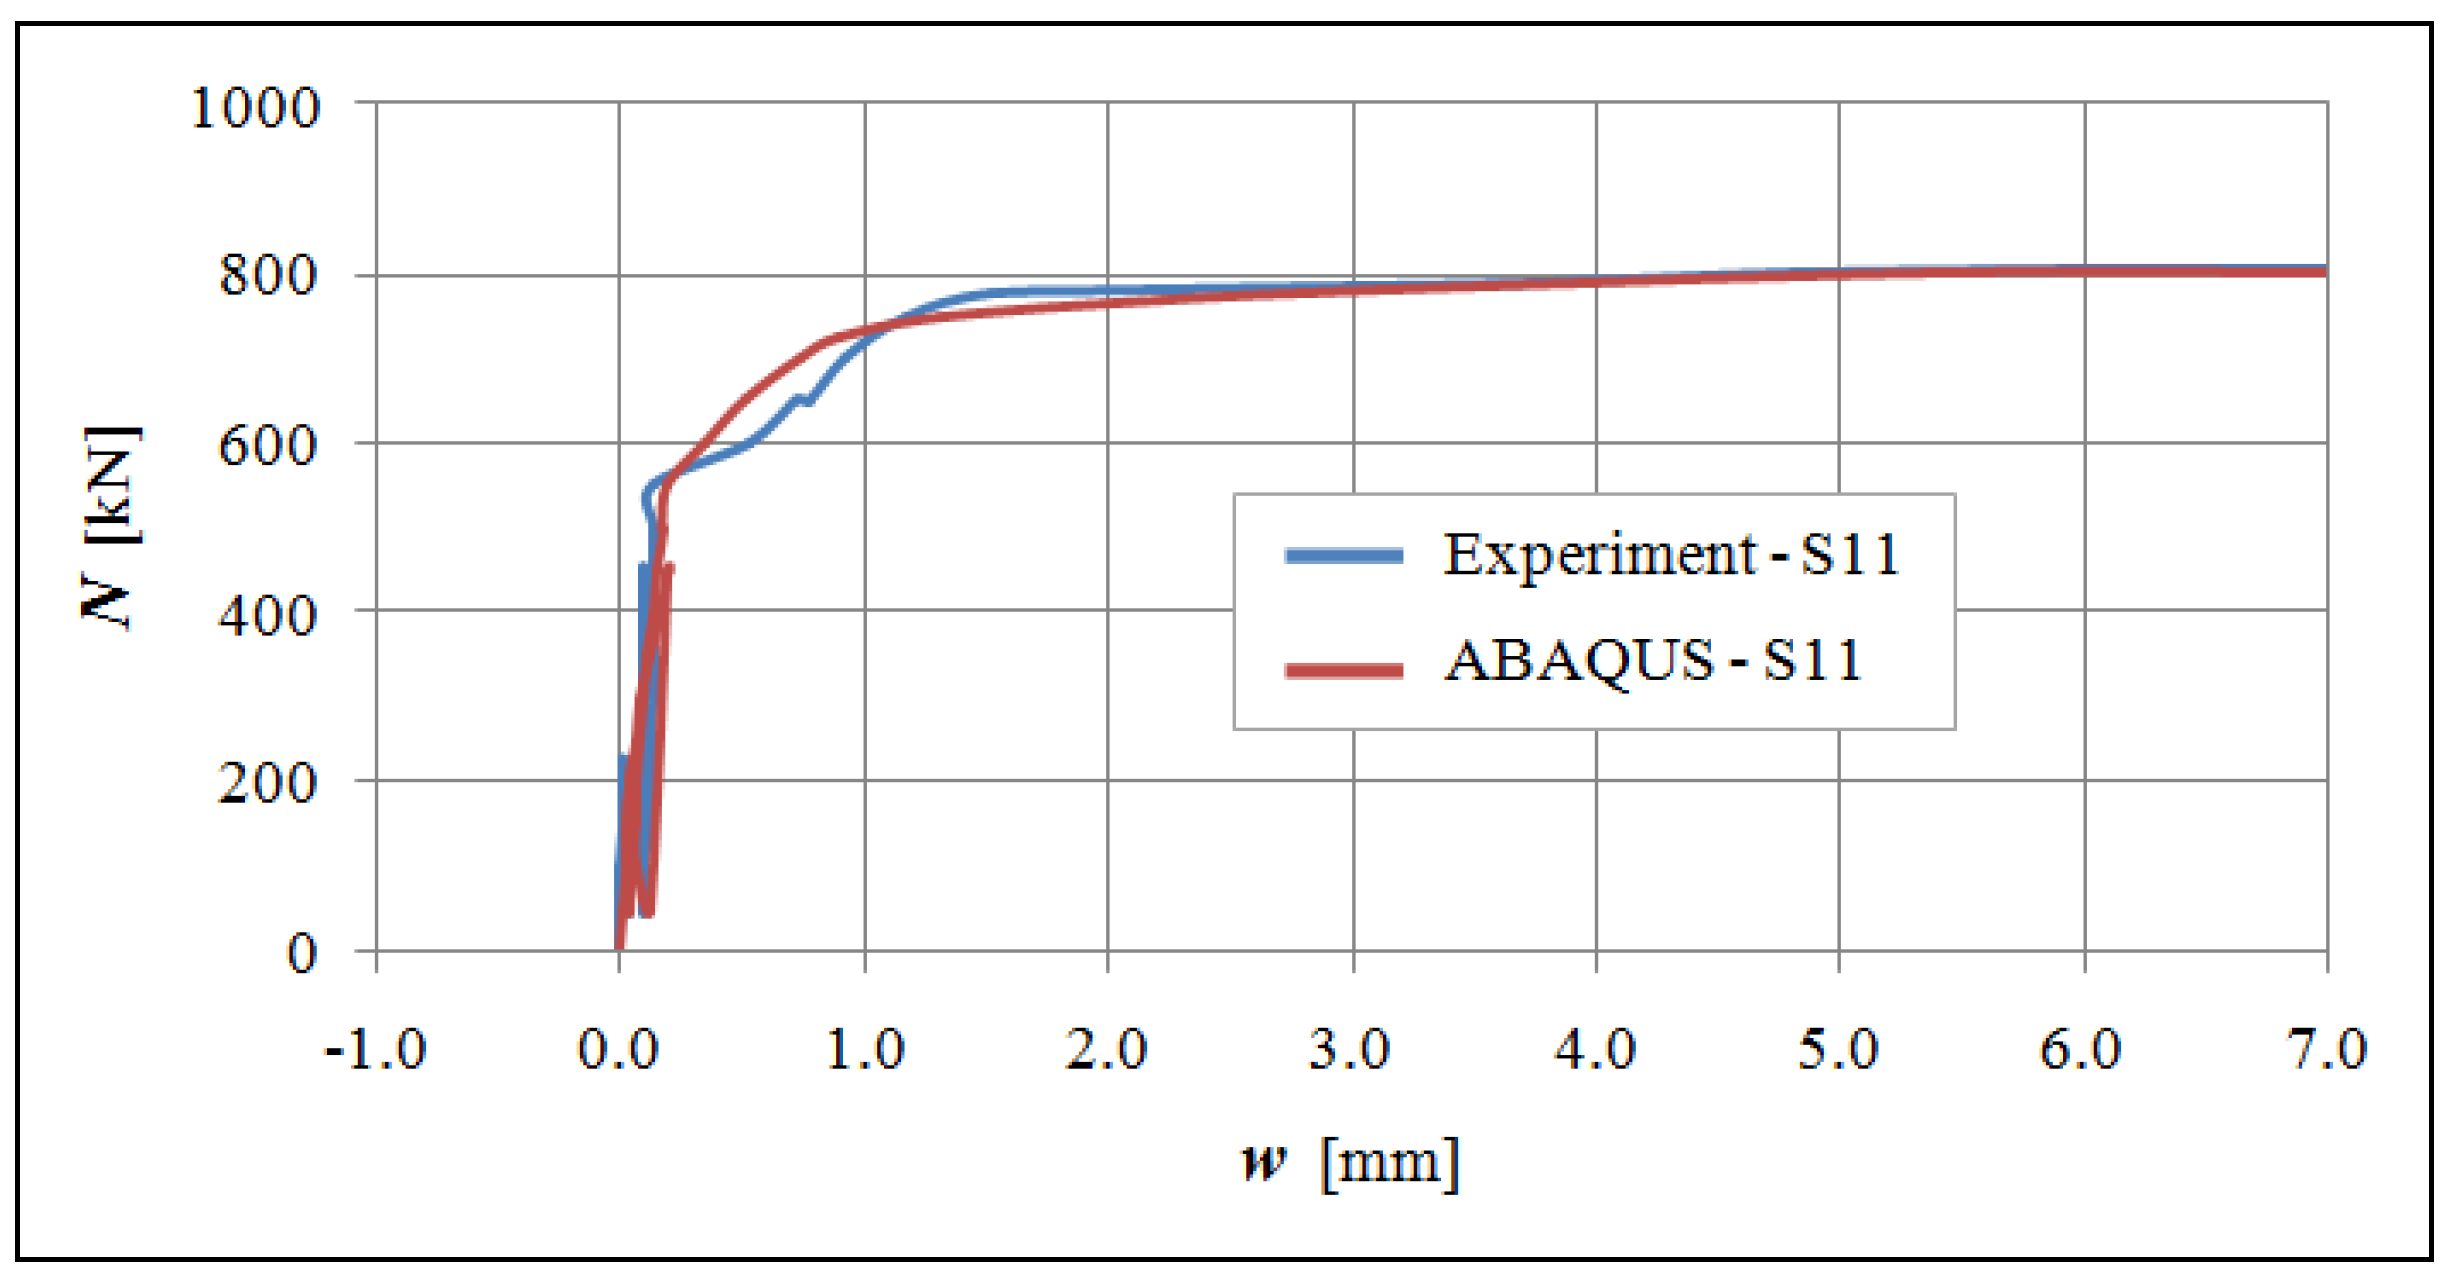
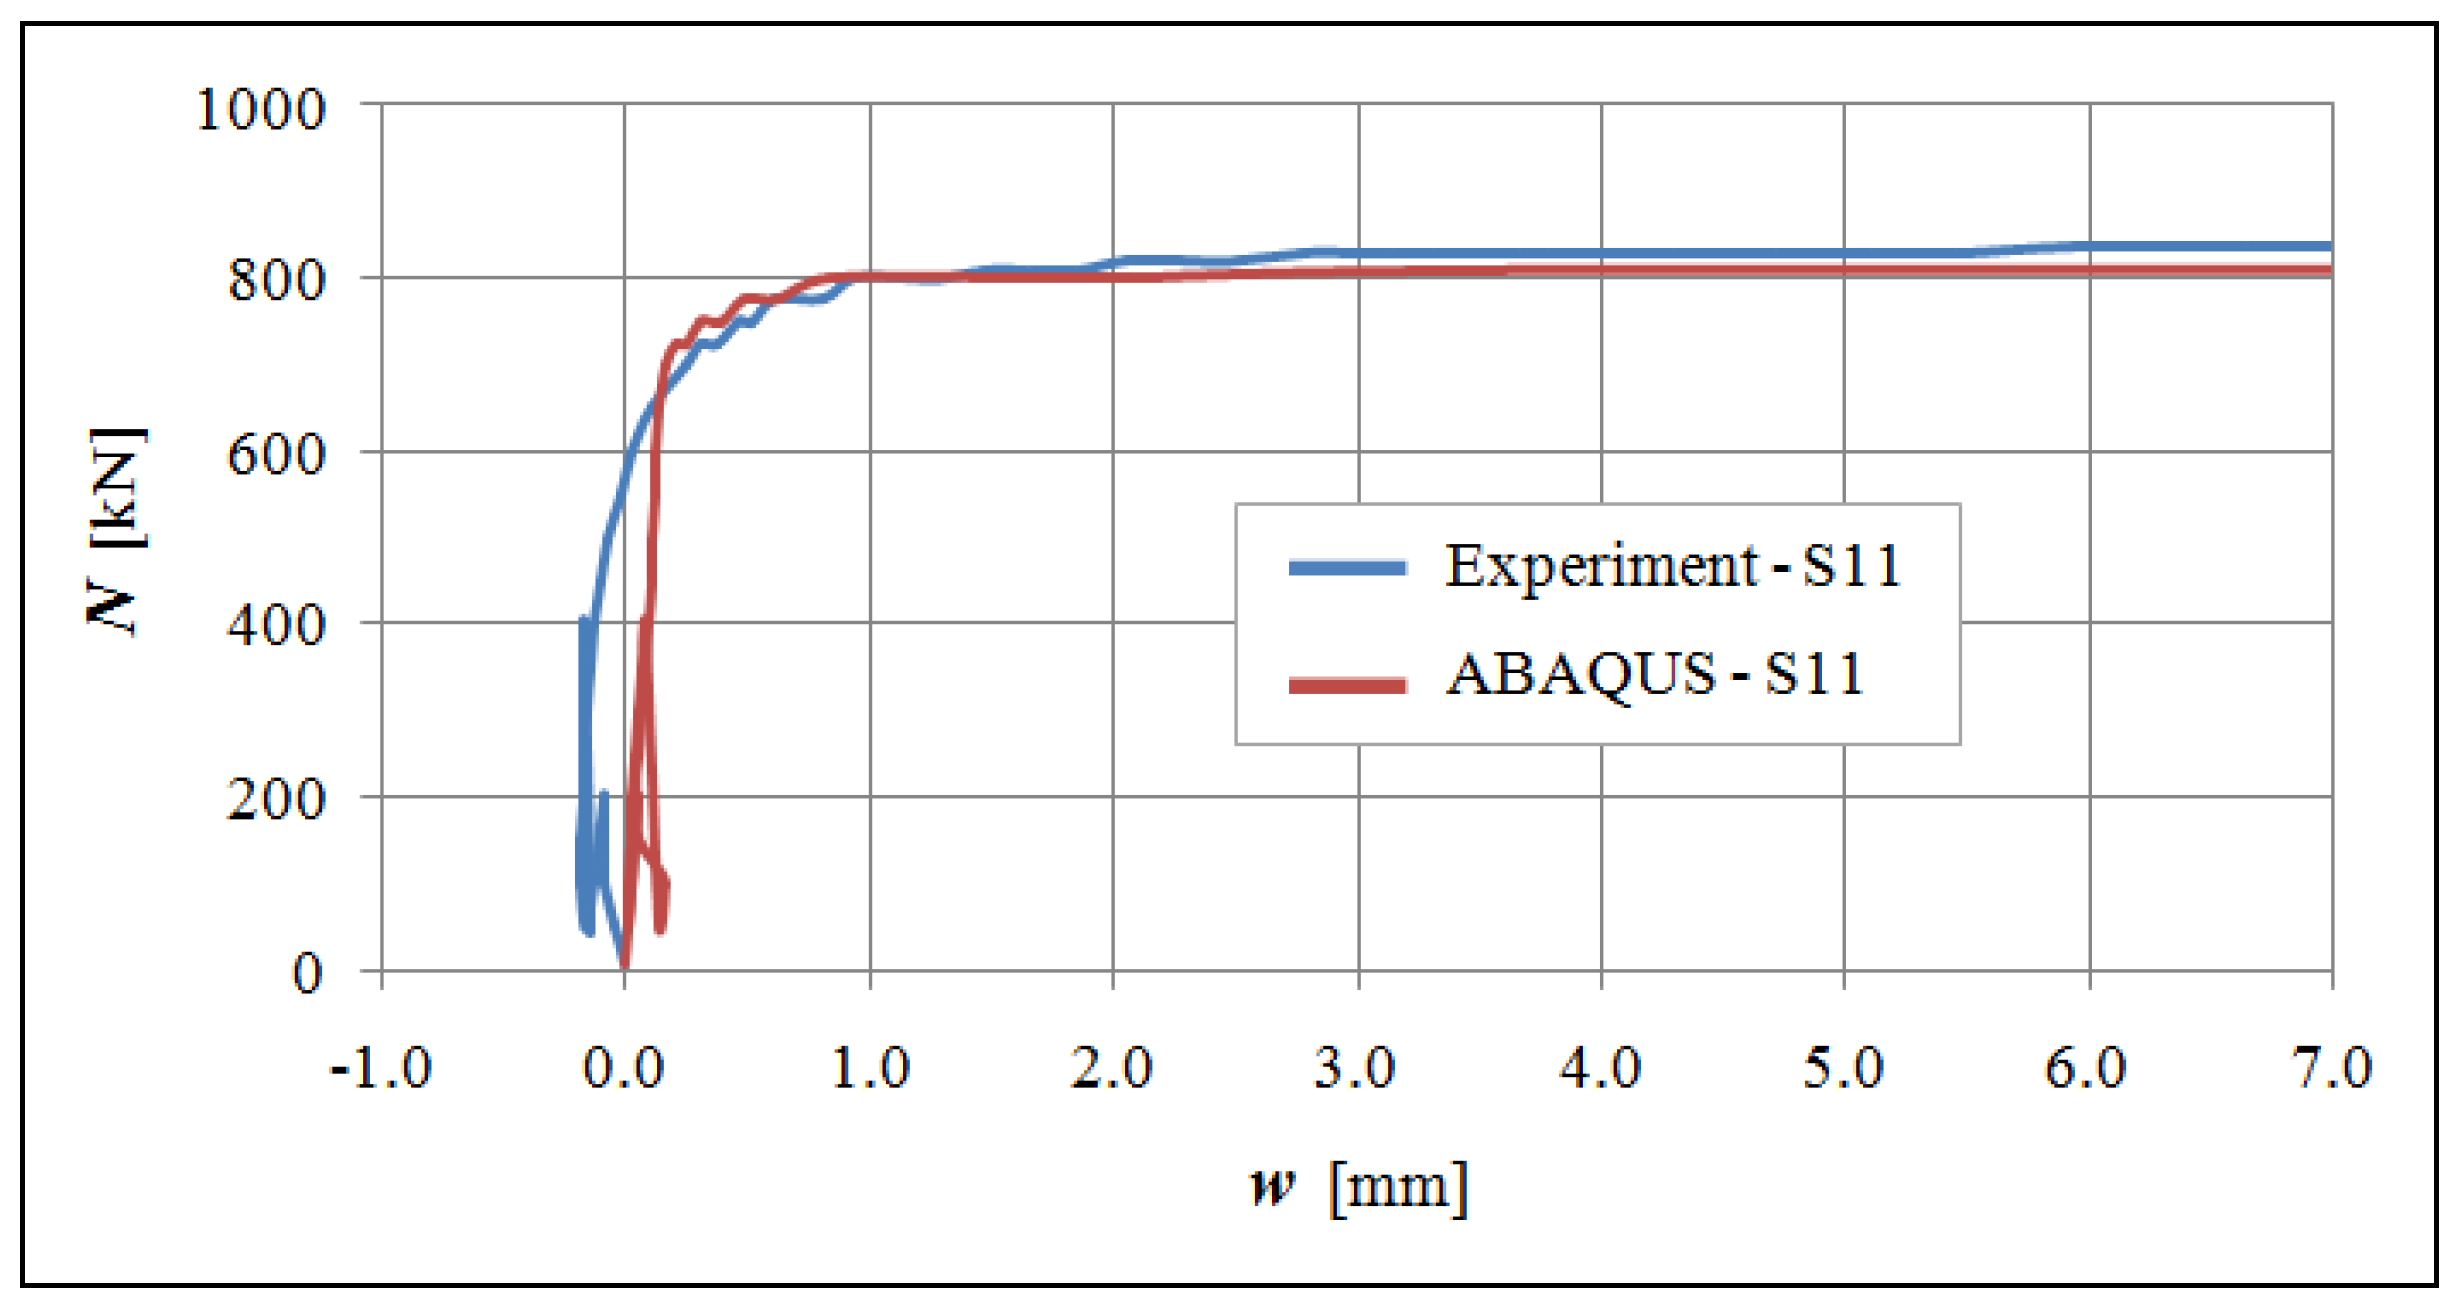
Figure 11 and
Figure 12 illustrate some selected relationships between loads
N and deflections
w.
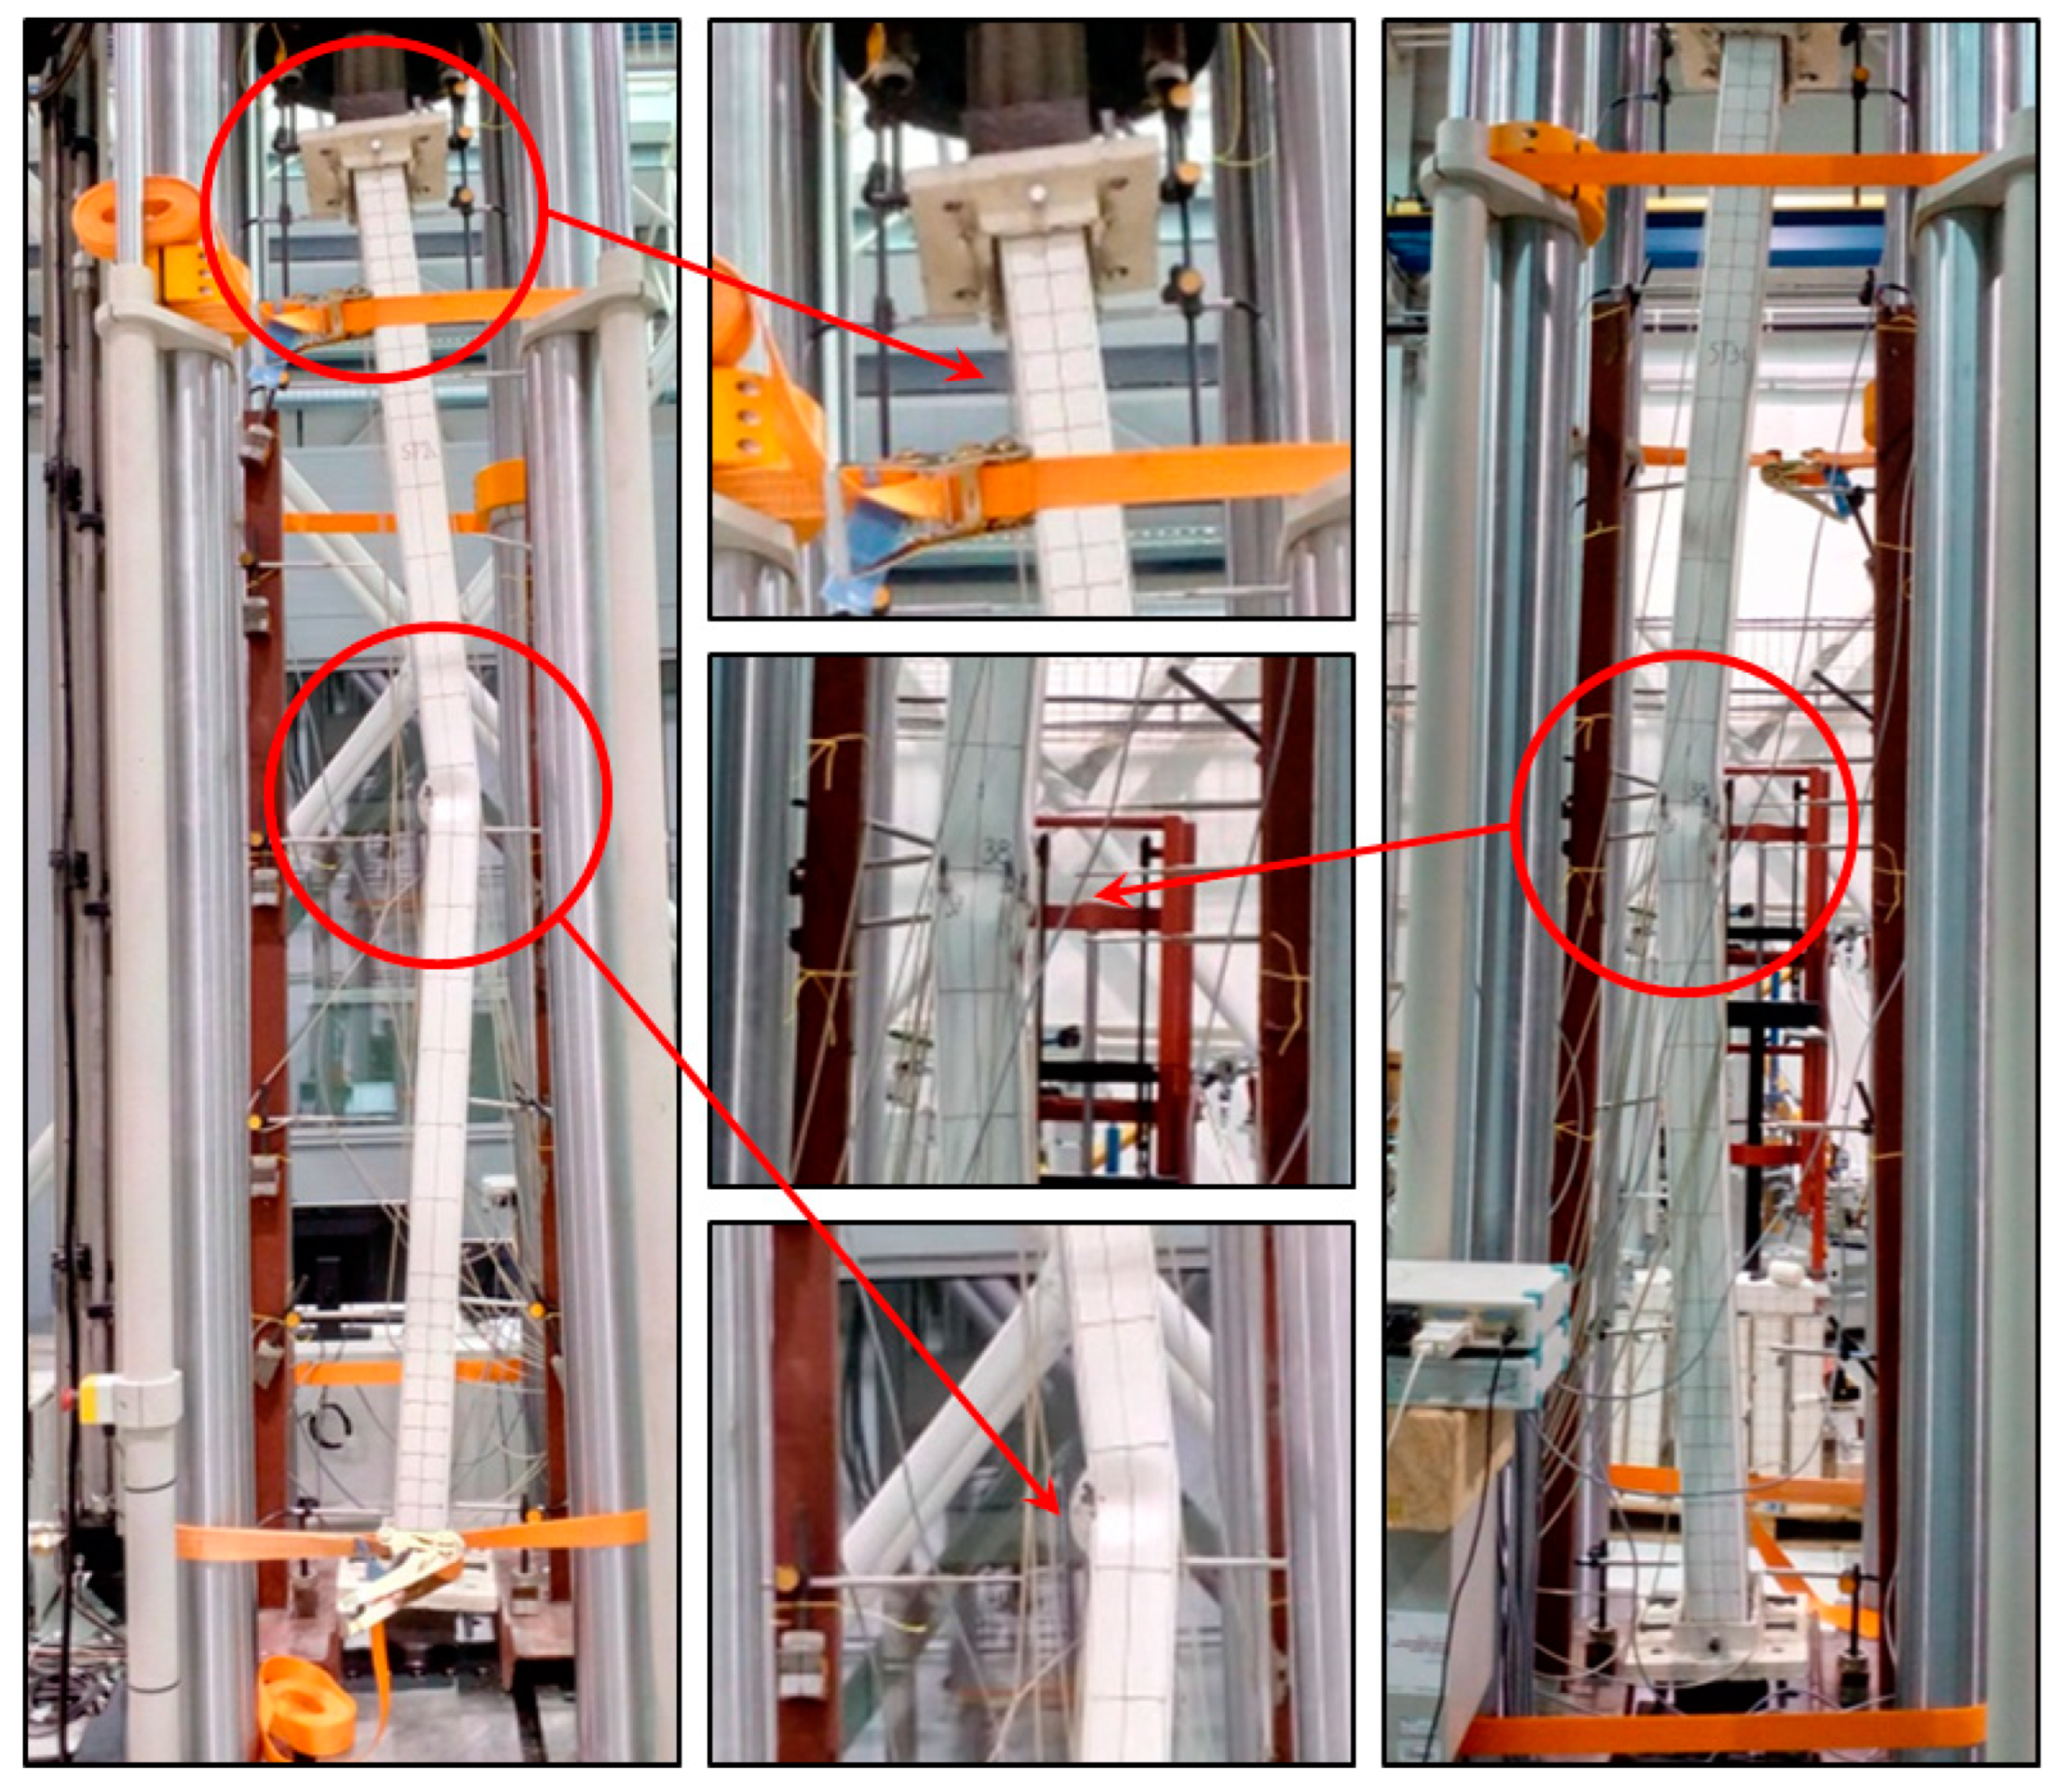
Figure 13 presents the final buckling shapes of selected tested members, including some detailed views of the characteristic locations. However, the experimental results and their description will be detailed in
Section 7 “Results and Discussion”.
6. Simulation of Experiments—3D Numerical Modeling
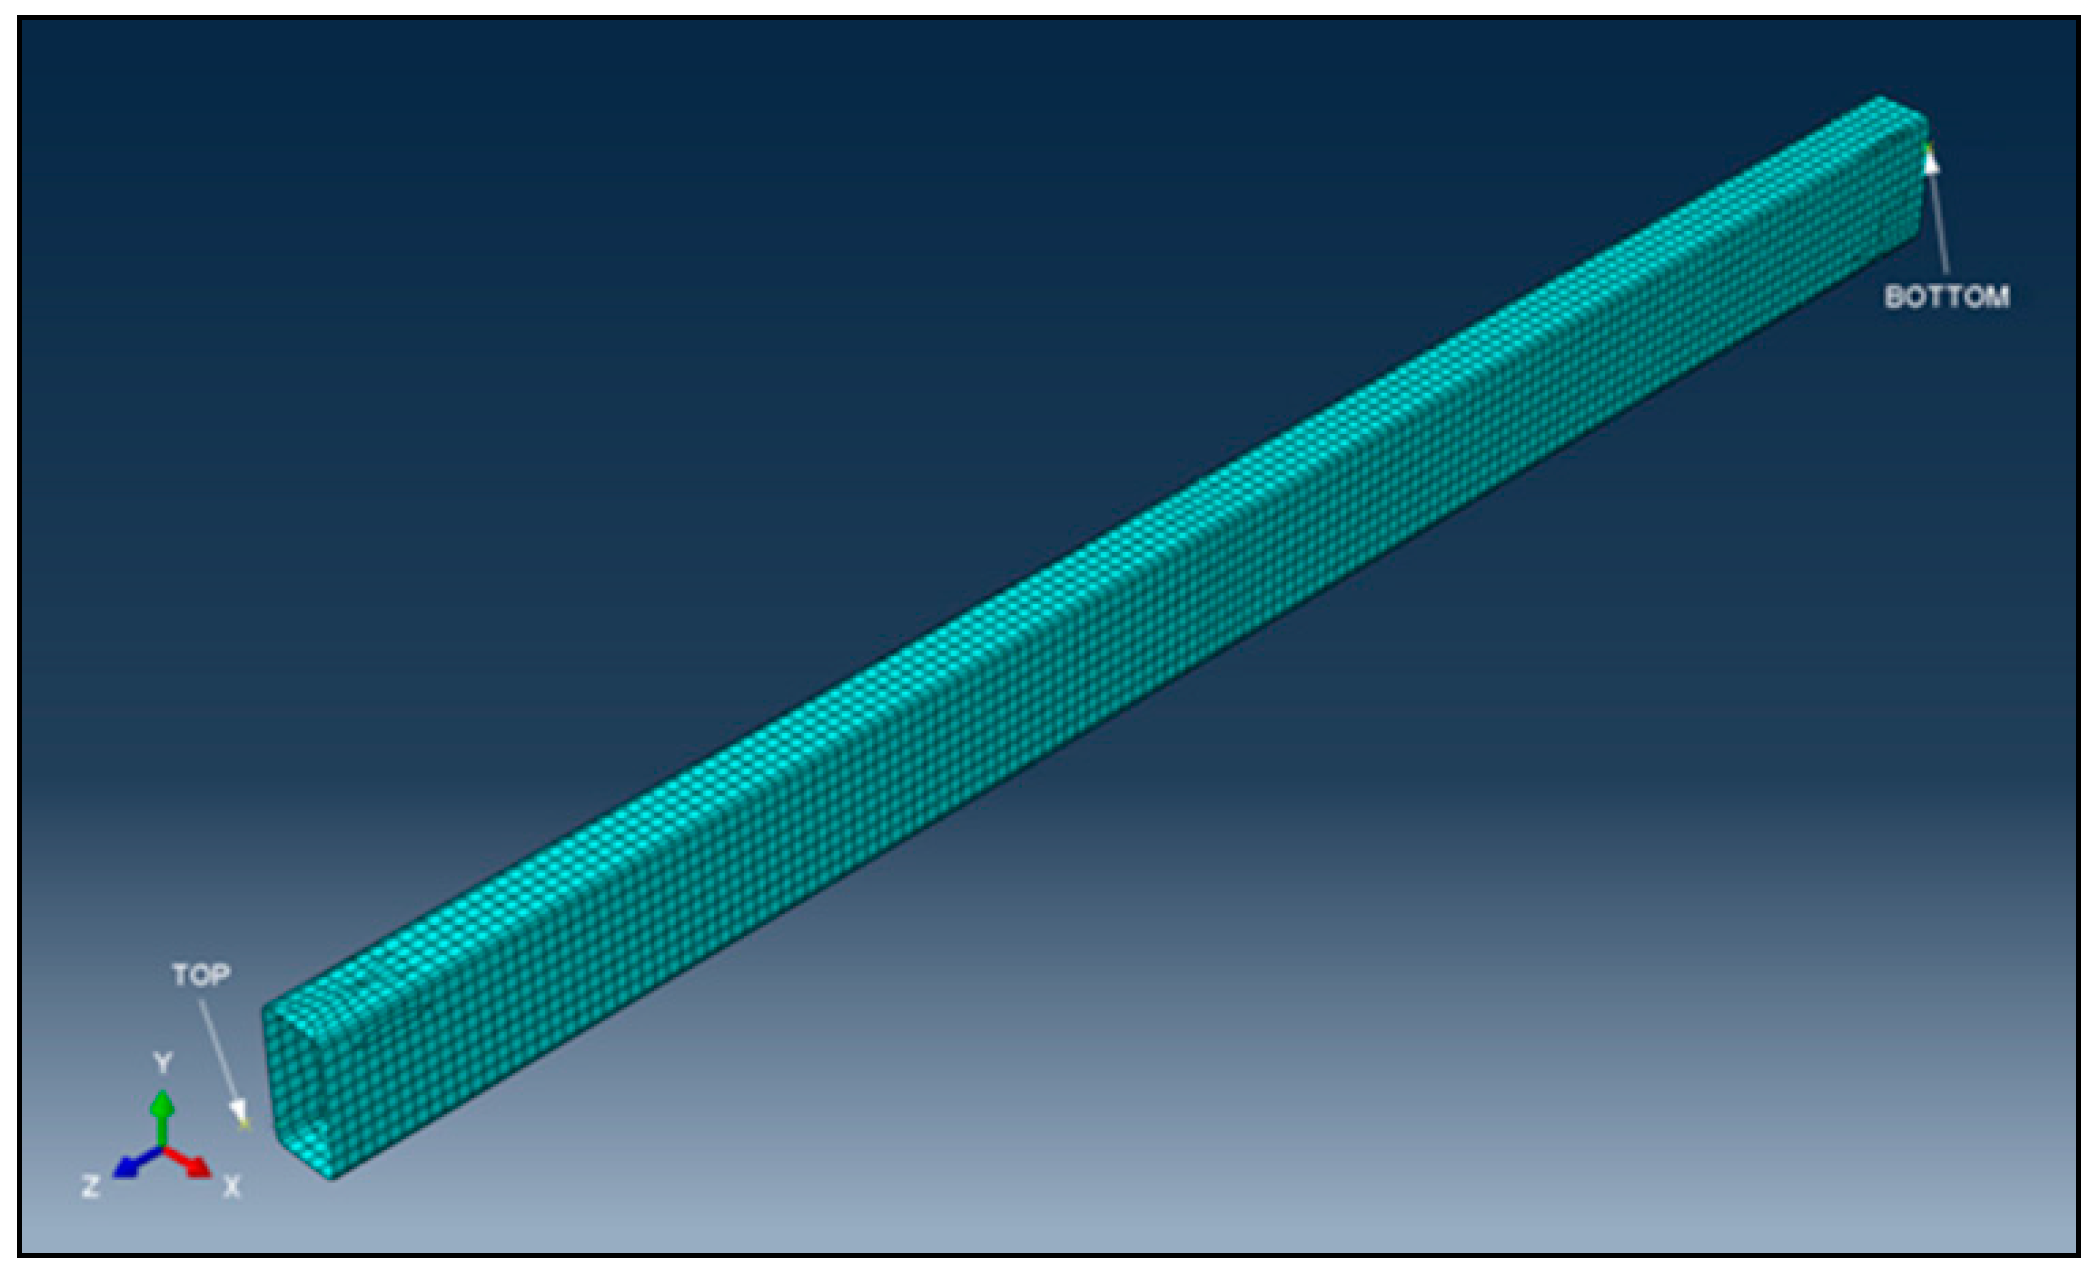
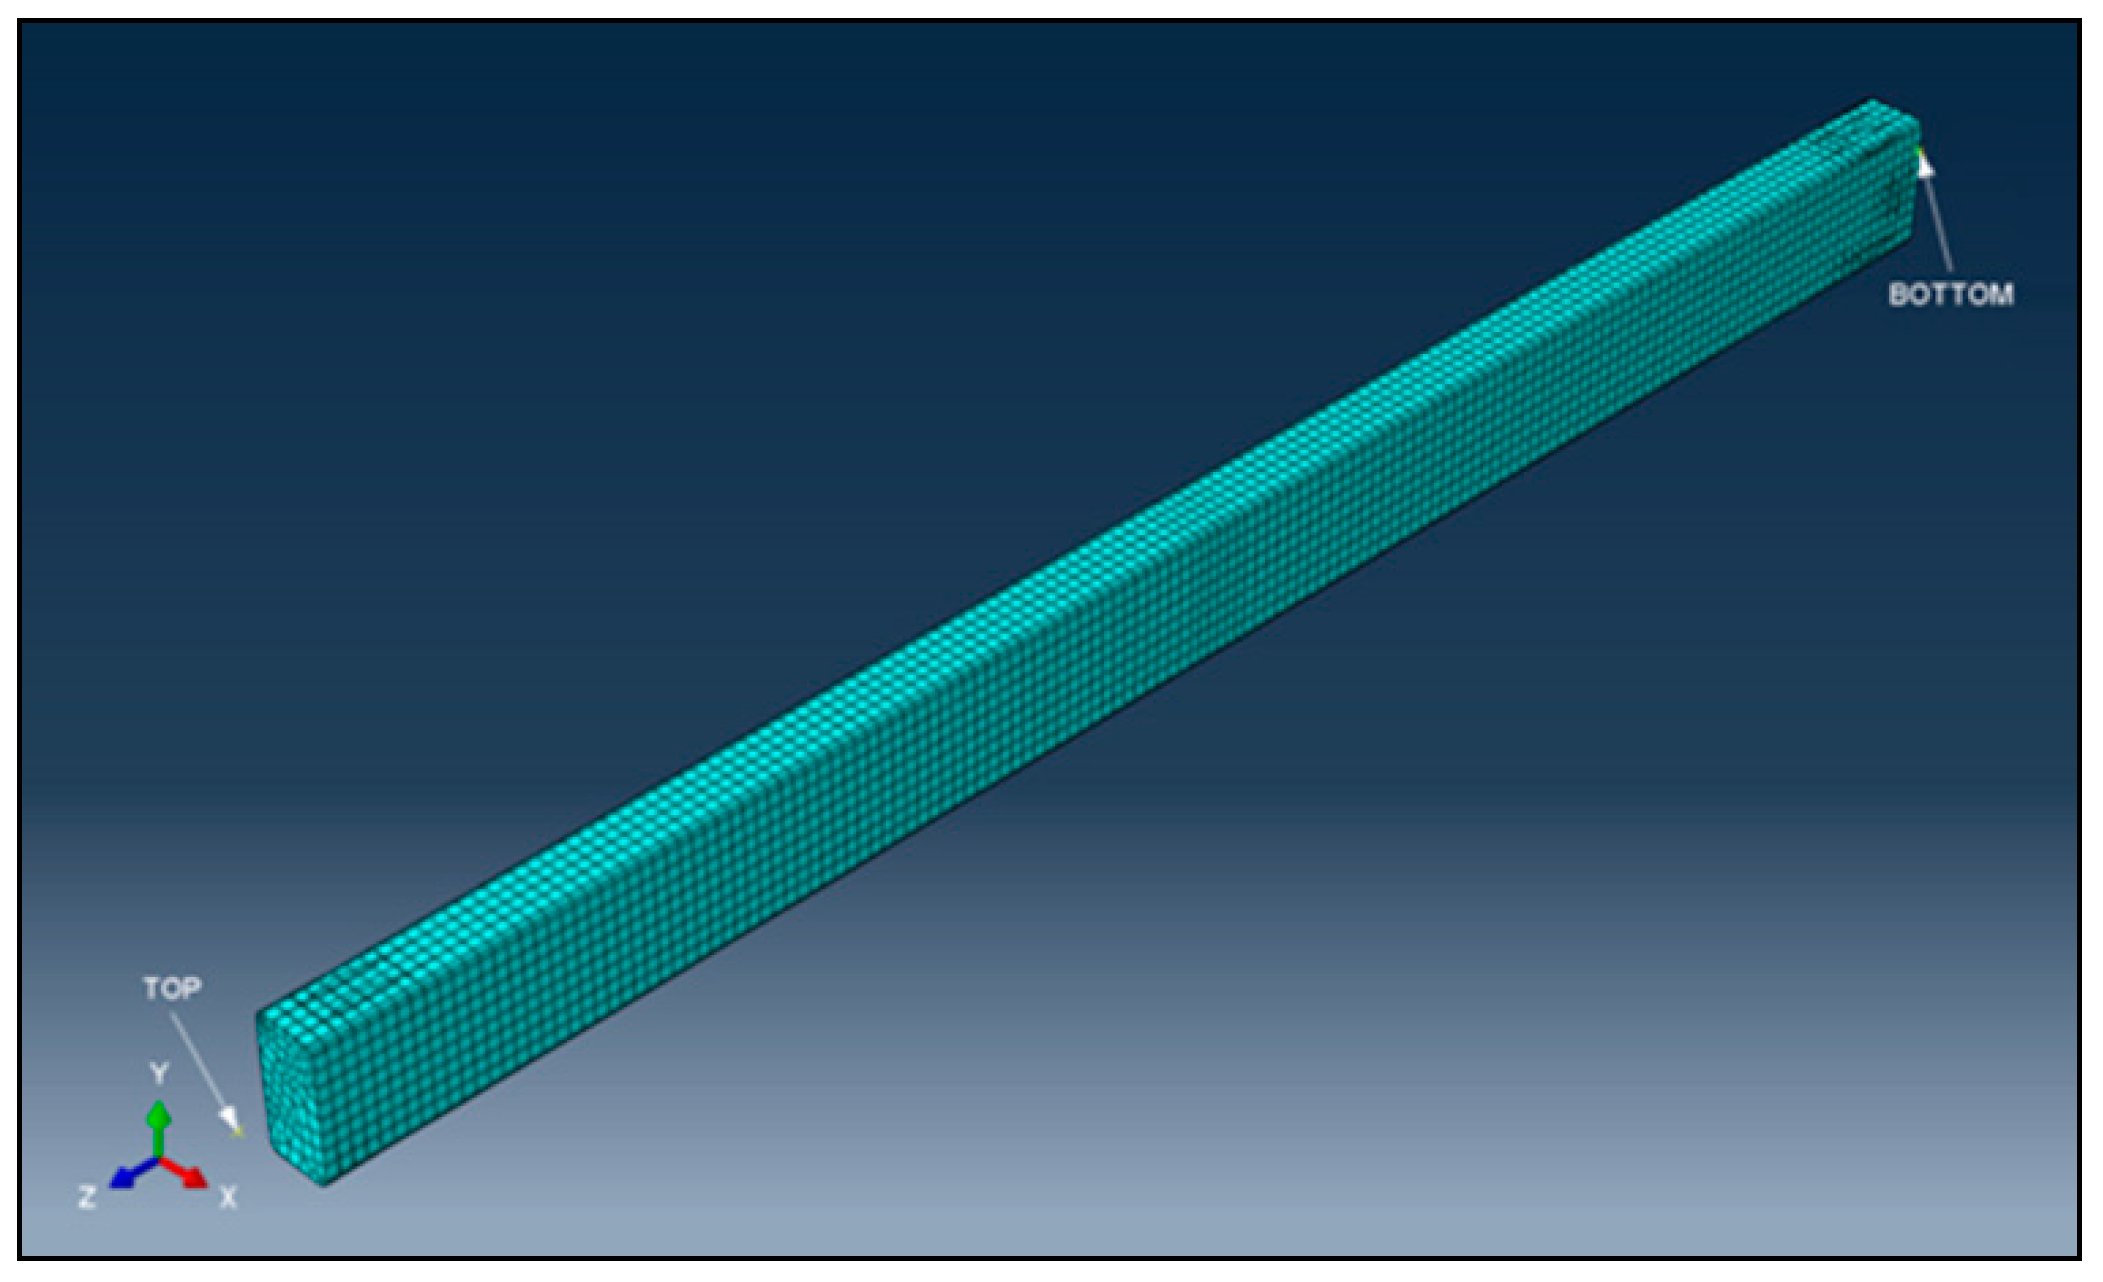
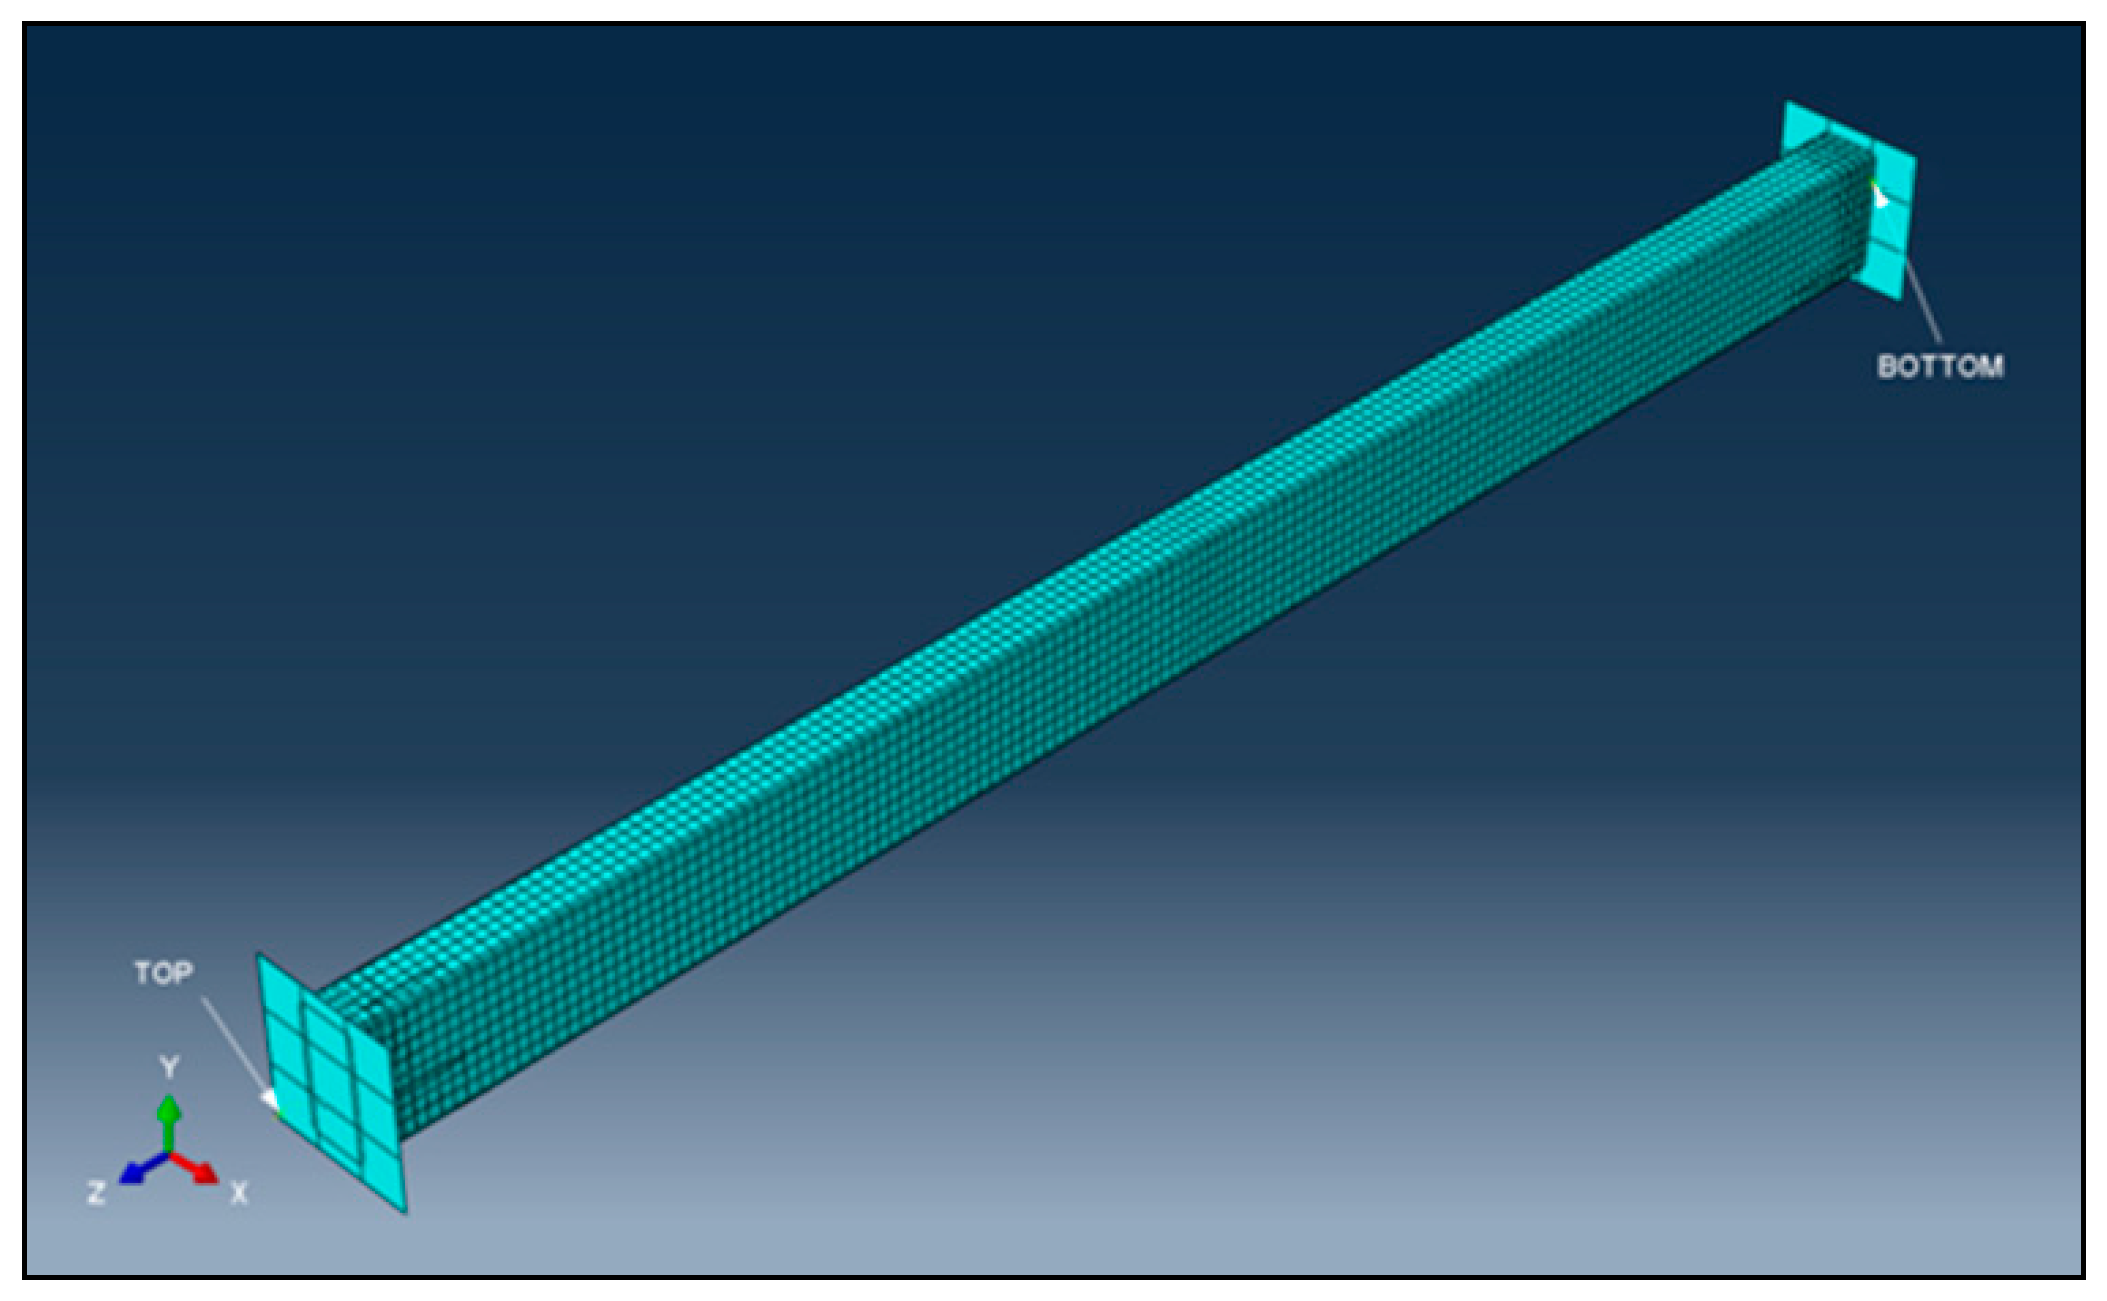
To simulate the experimental tests, 3D computational models of the test members were created using the computational-graphical software ABAQUS 6.13-4. Scans of initial geometric imperfections were transferred to graphics software CATIA V5-6 R2016 for further editing and then imported into ABAQUS. Elements of type S4R-shell were used to model the steel tubes, and elements of type solid C3D8R were used to create the concrete core.
Figure 14,
Figure 15 and
Figure 16 illustrate the configurations of the three basic types of 3D models created in ABAQUS.
As mentioned above, the initial geometric imperfections of all test members were imported into ABAQUS via CATIA software. For illustration,
Figure 17 shows the shape and size of these imperfections of test member E1.
The loading of the columns was modeled according to the real loading process during the experimental tests (
Section 5). The load was applied to edges of the steel tube webs in the case of groups A, B, E, and F, or to the entire cross-sectional area for group C and group D.
Real strain–stress diagrams of steel and concrete, obtained from tensile and strength tests (
Section 4), were imported into ABAQUS and used in FE computational analysis. The behavior of the steel was simulated following the equations according to SIMULIA [
30]. The concrete was simulated using the “Concrete damaged plasticity” model in ABAQUS considering the Drucker–Prager’s theory of plasticity, and specific concrete properties for this theory were determined according to Hu et al. [
31].
“Normal” and “Tangential” components were used to model the interaction between the steel and concrete elements of the composite cross-section. In ABAQUS, the tangential component was considered as the friction between the concrete core and the steel shell. The effect of the friction coefficient is significant only if the load is directly applied to the concrete core, which is irrelevant for the presented research. Due to this fact, the coefficient of friction was considered as its average value of 0.3 when modeling the analyzed composite columns.
The FE analysis and calculation of the 3D computational models were performed in ABAQUS, taking into account the above-mentioned description. Some comparisons of the dependence of deflections
w on loads
N according to the results of experimental tests and ABAQUS are presented in
Figure 11 and
Figure 12 (
Section 5).
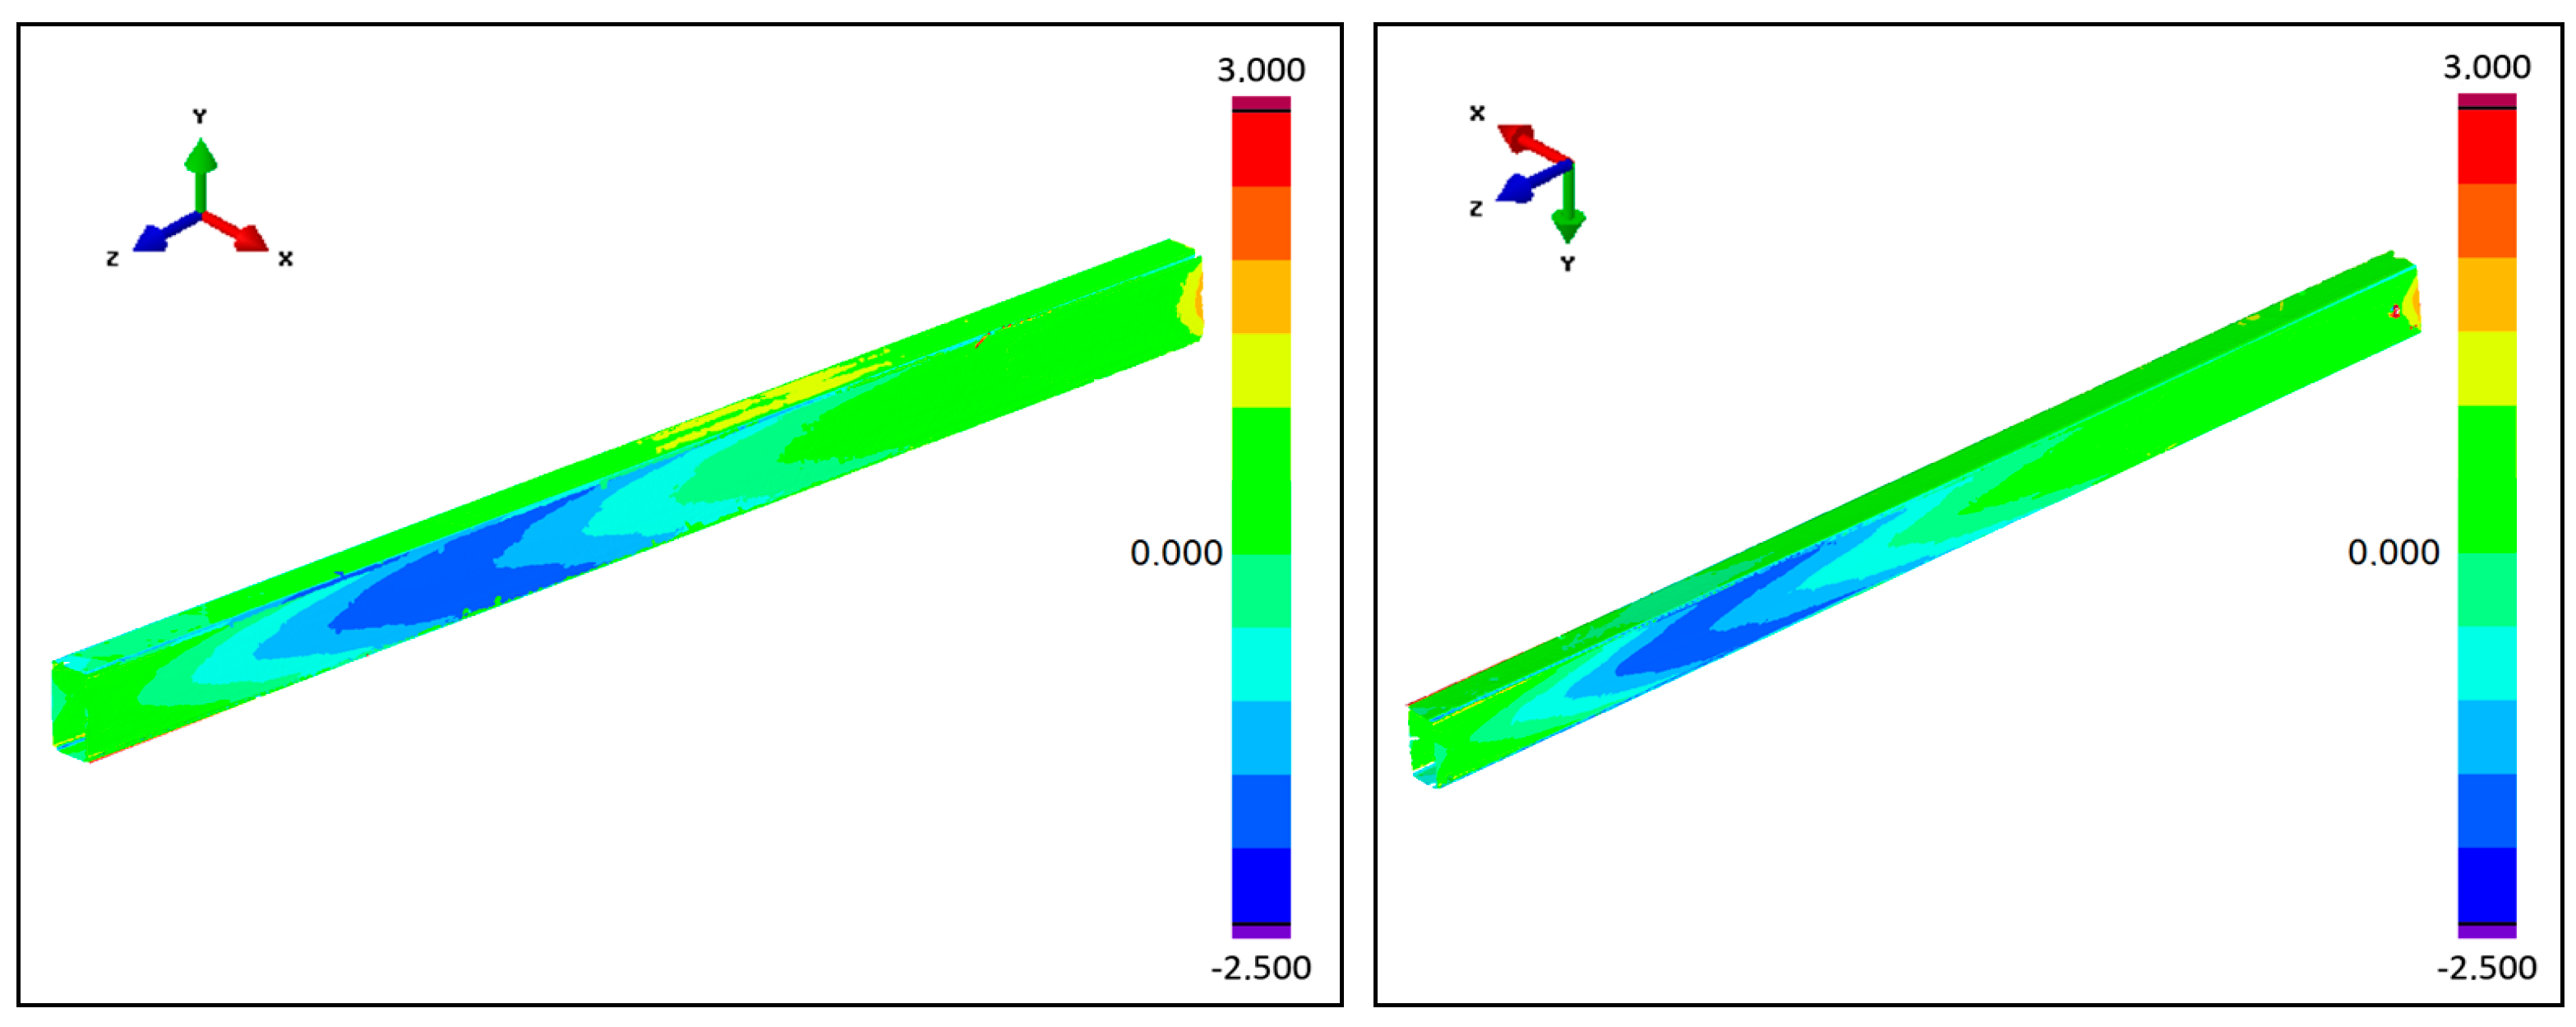
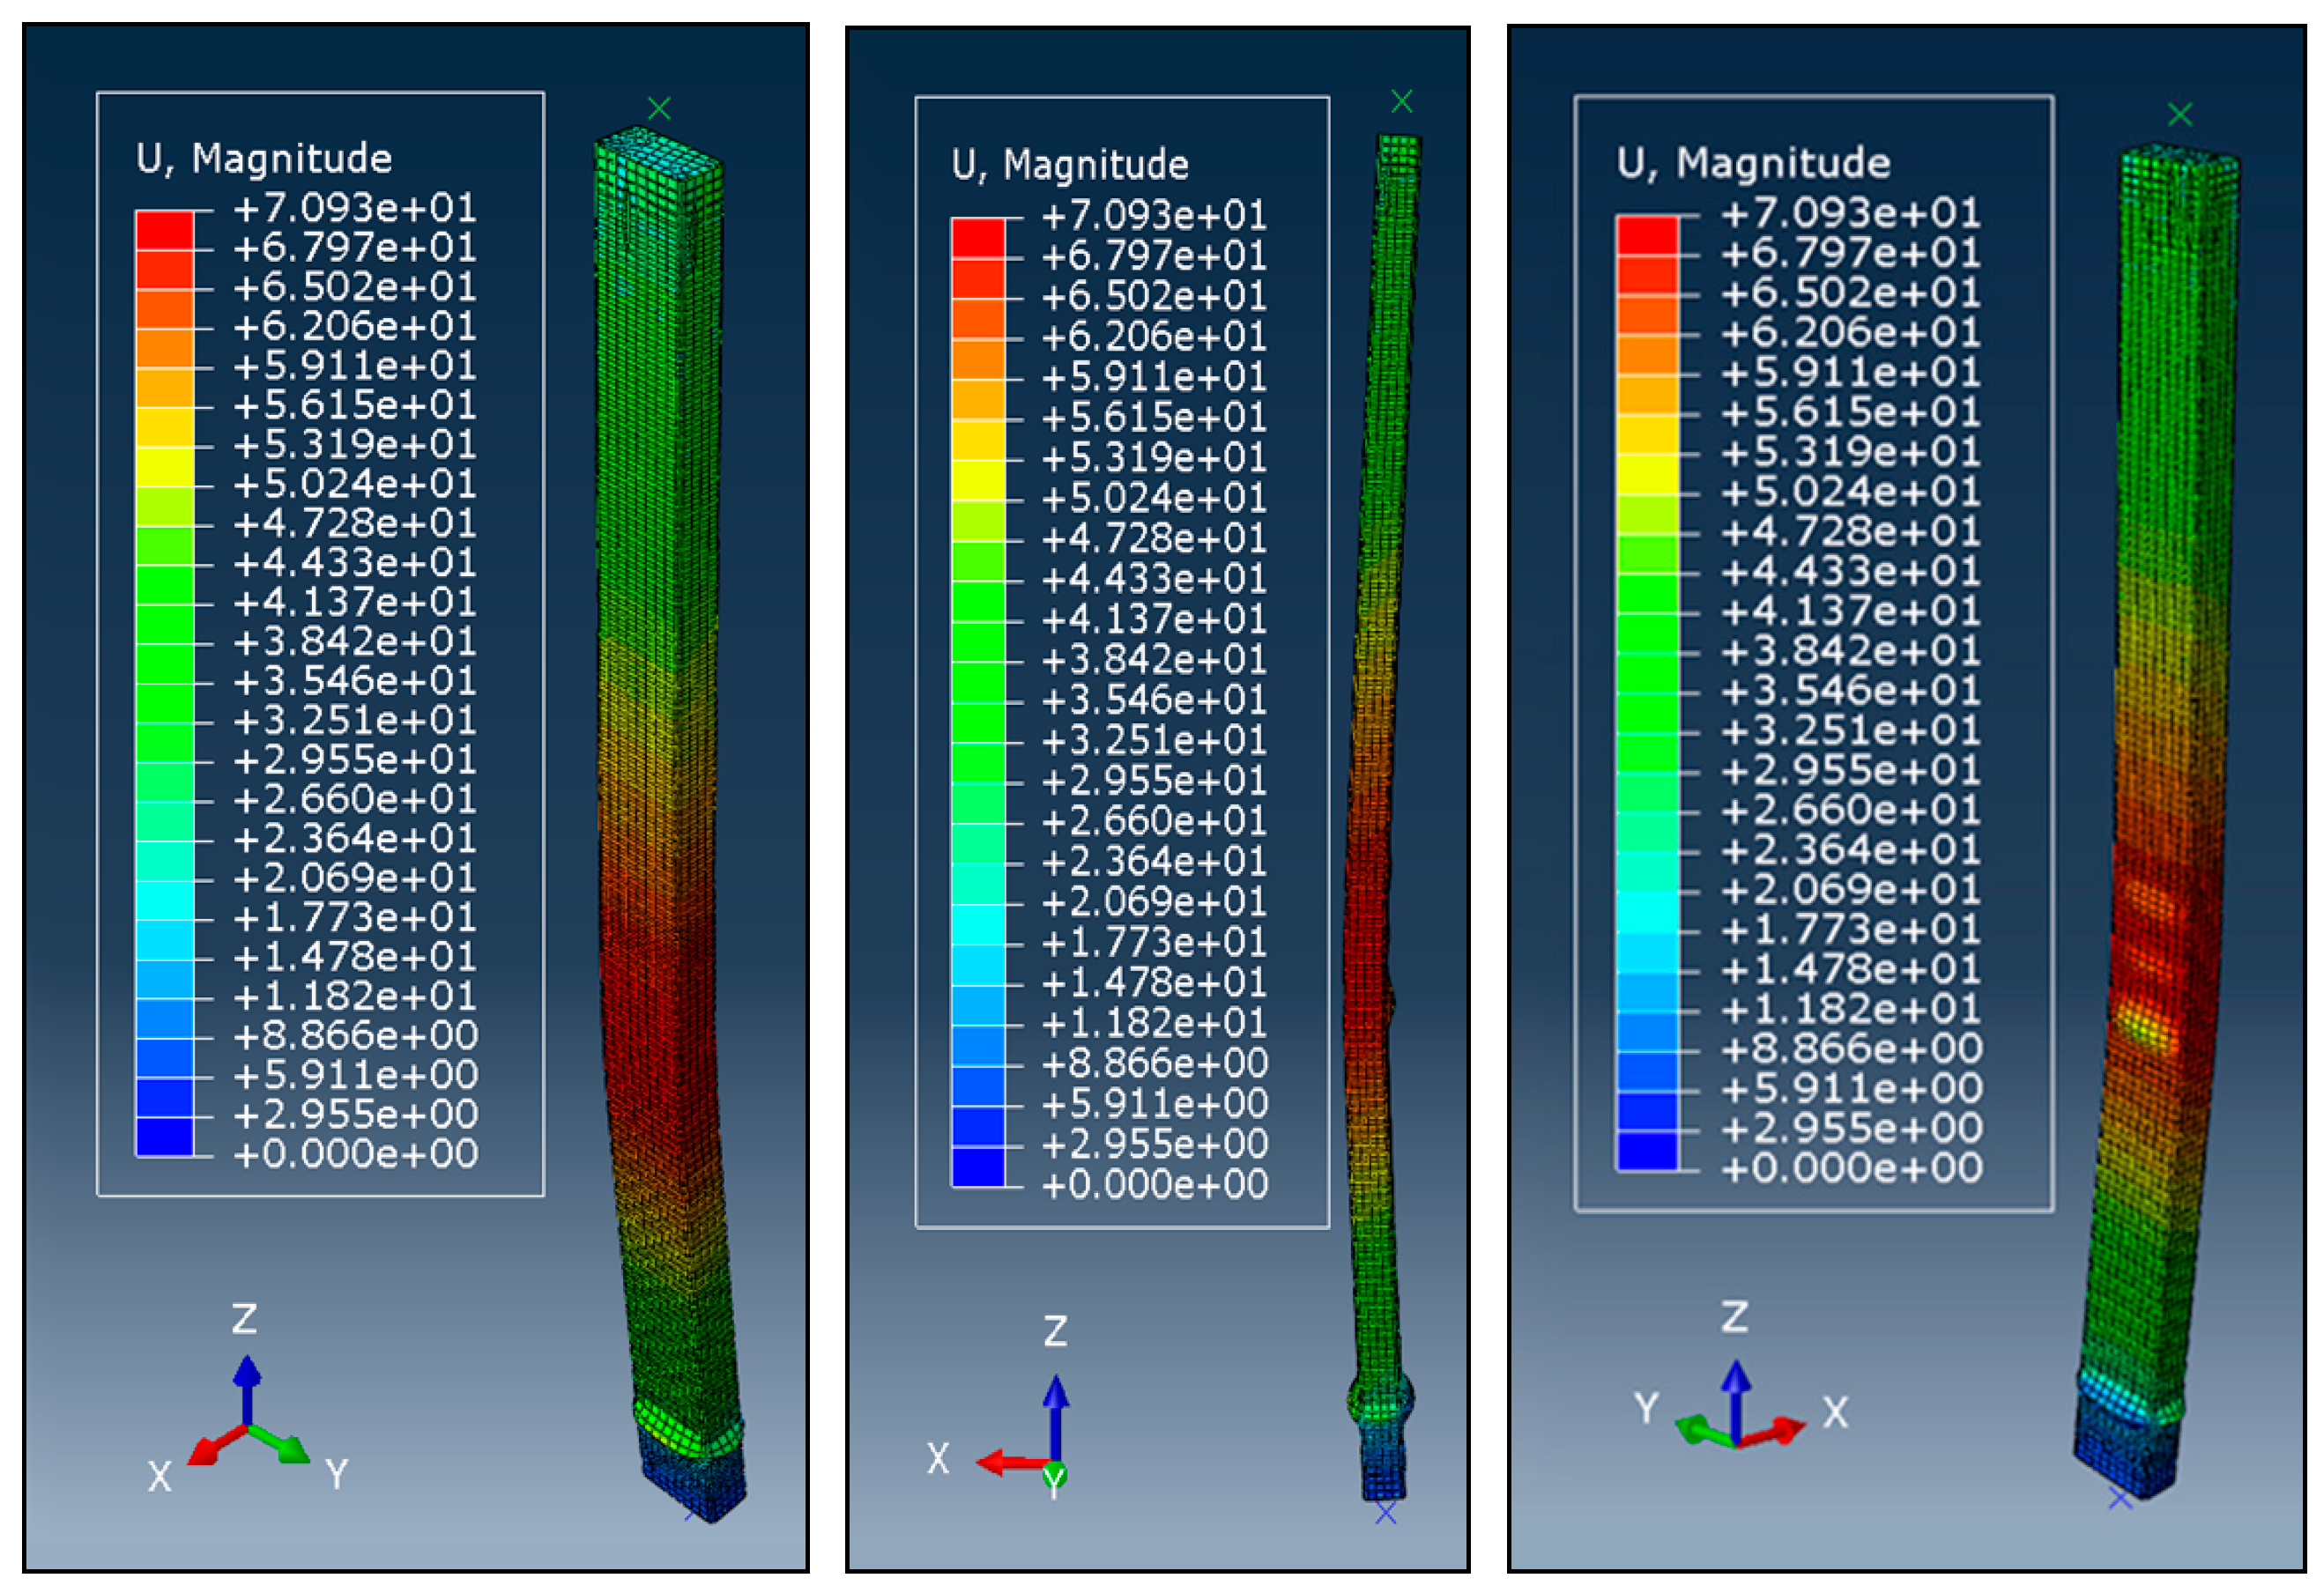
Figure 13 shows the final buckling shapes of selected tested members from the experiments. The final buckling shapes of other selected members generated by ABAQUS are shown in
Figure 18.
7. Results and Discussion
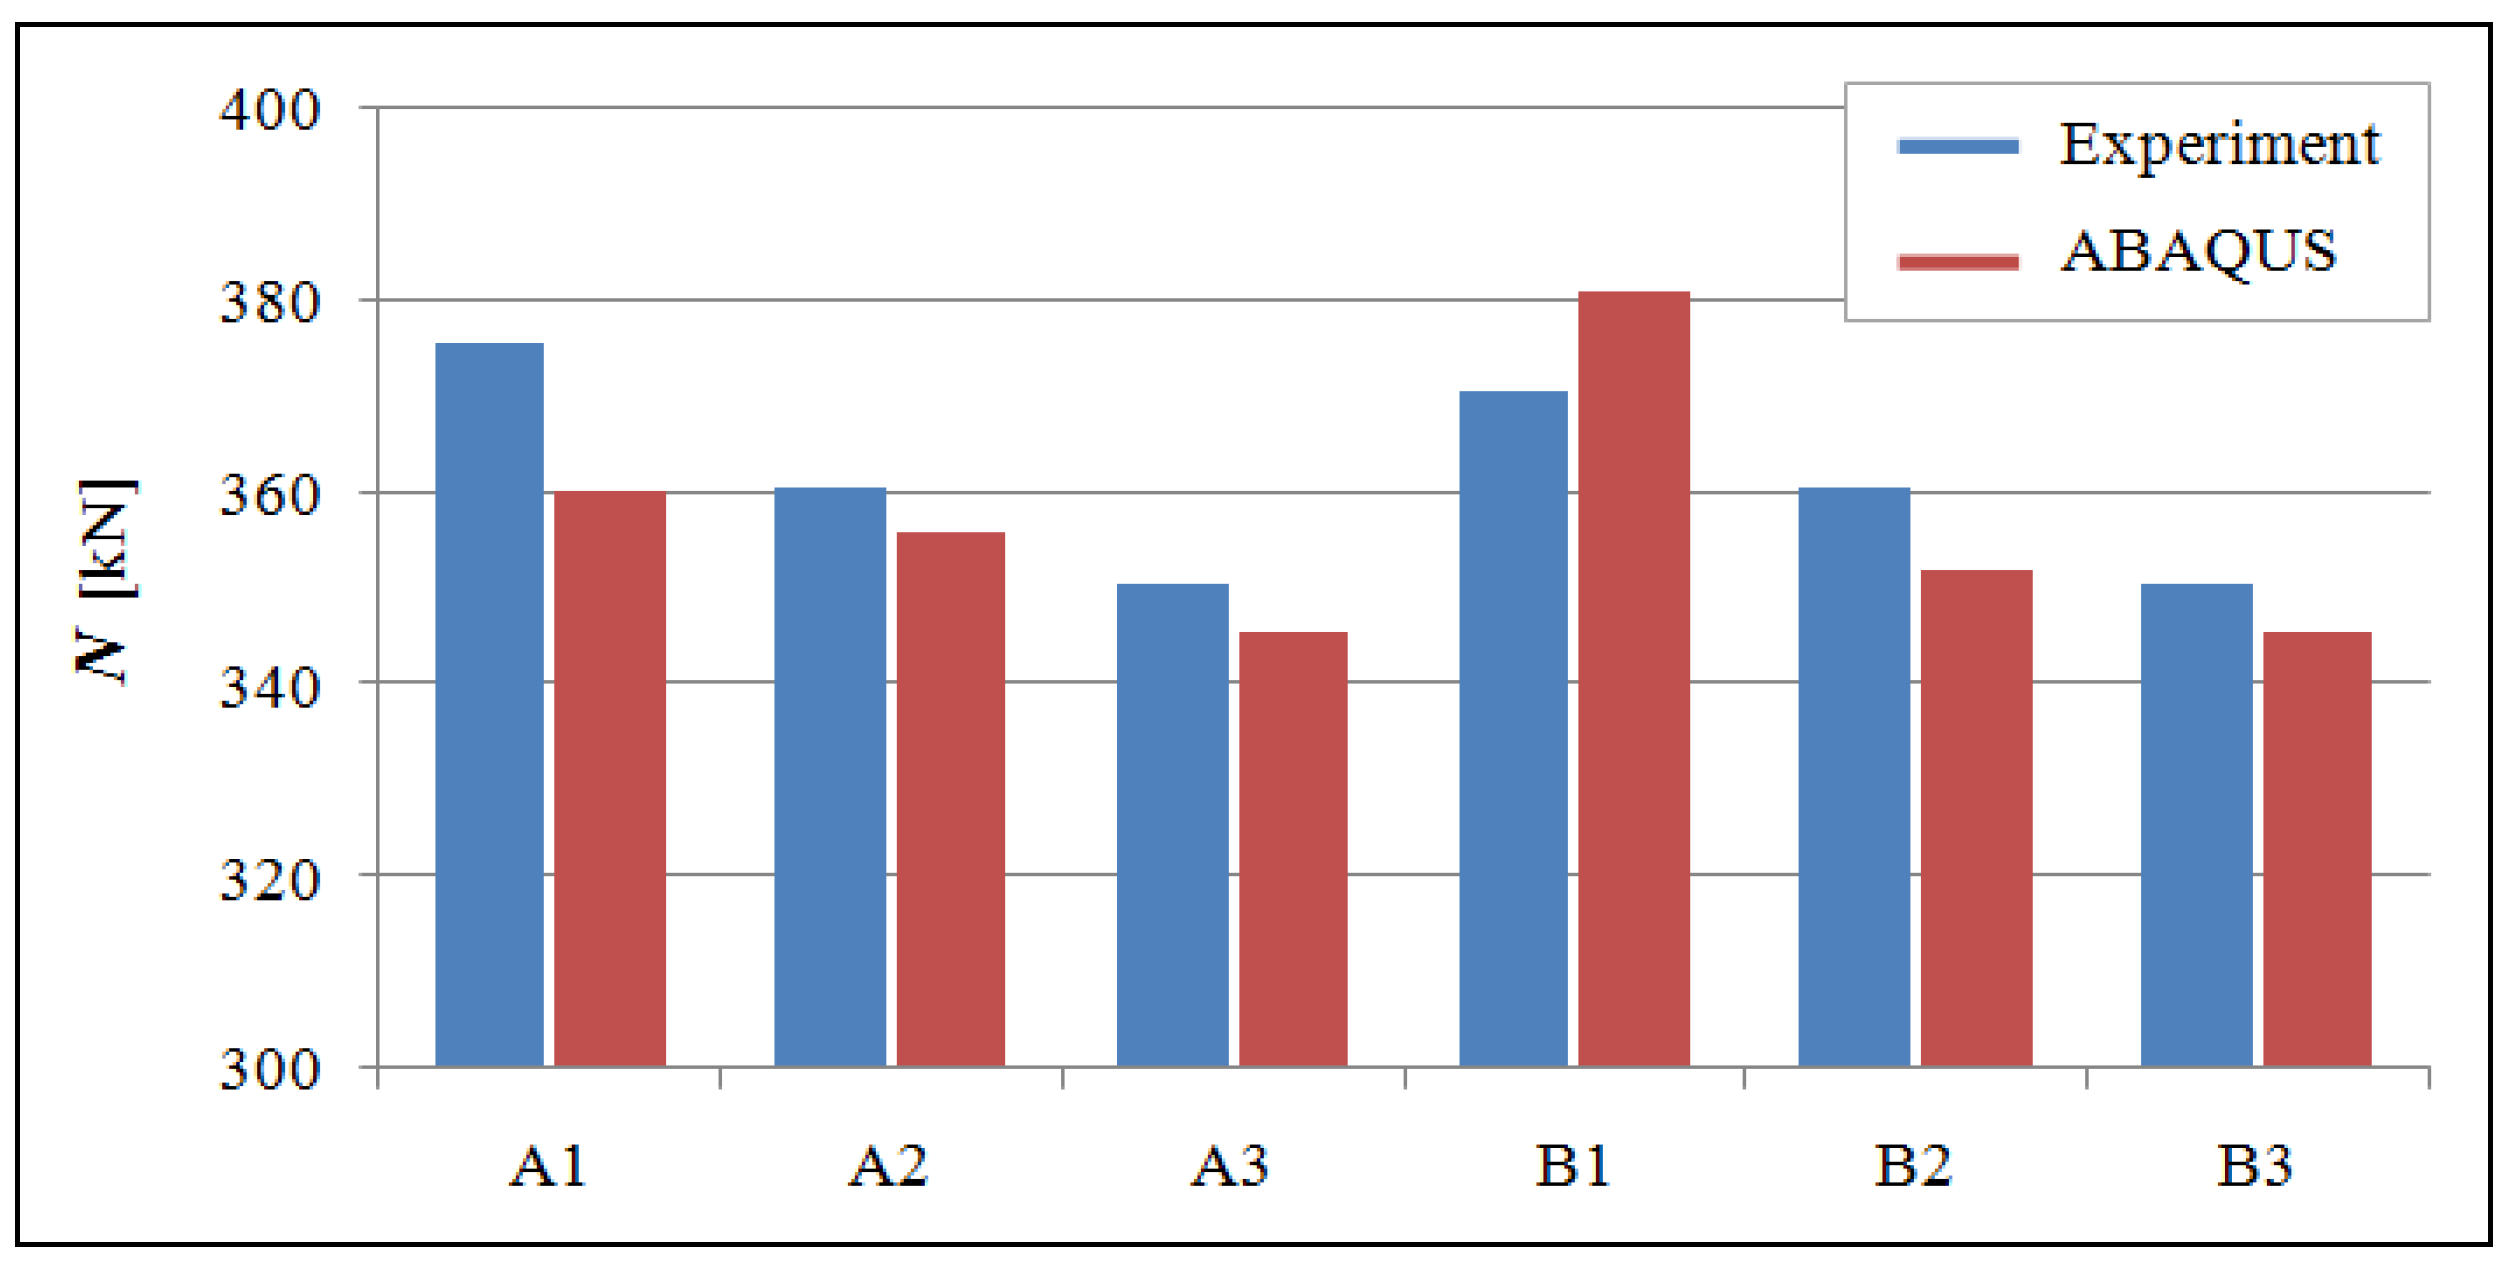
Based on the obtained results from experimental tests and numerical analysis using 3D models, it was found that the steel plates welded to the ends of the test members did not have a significant contribution to the resulting buckling resistance. Their average contribution was up to 3.47%.
As mentioned in
Section 1, Eurocode 4, EN 1994-1-1 [
29] allows the design and calculation of composite steel–concrete members with closed cross-sections, provided that the steel cross-section must be compact, i.e., class 1, 2, or 3. Despite the fact that all test members have a cross-section of class 4, the obtained results proved the possibility of their use for composite concrete-filled tubular columns.
The obtained limit loads from experimental tests and 3D numerical simulations (ABAQUS) for test members with hollow cross-section are listed in
Table 4.
Table 5 shows the average limit loads of groups A and B.
Figure 19 presents a graphical illustration of these limit loads.
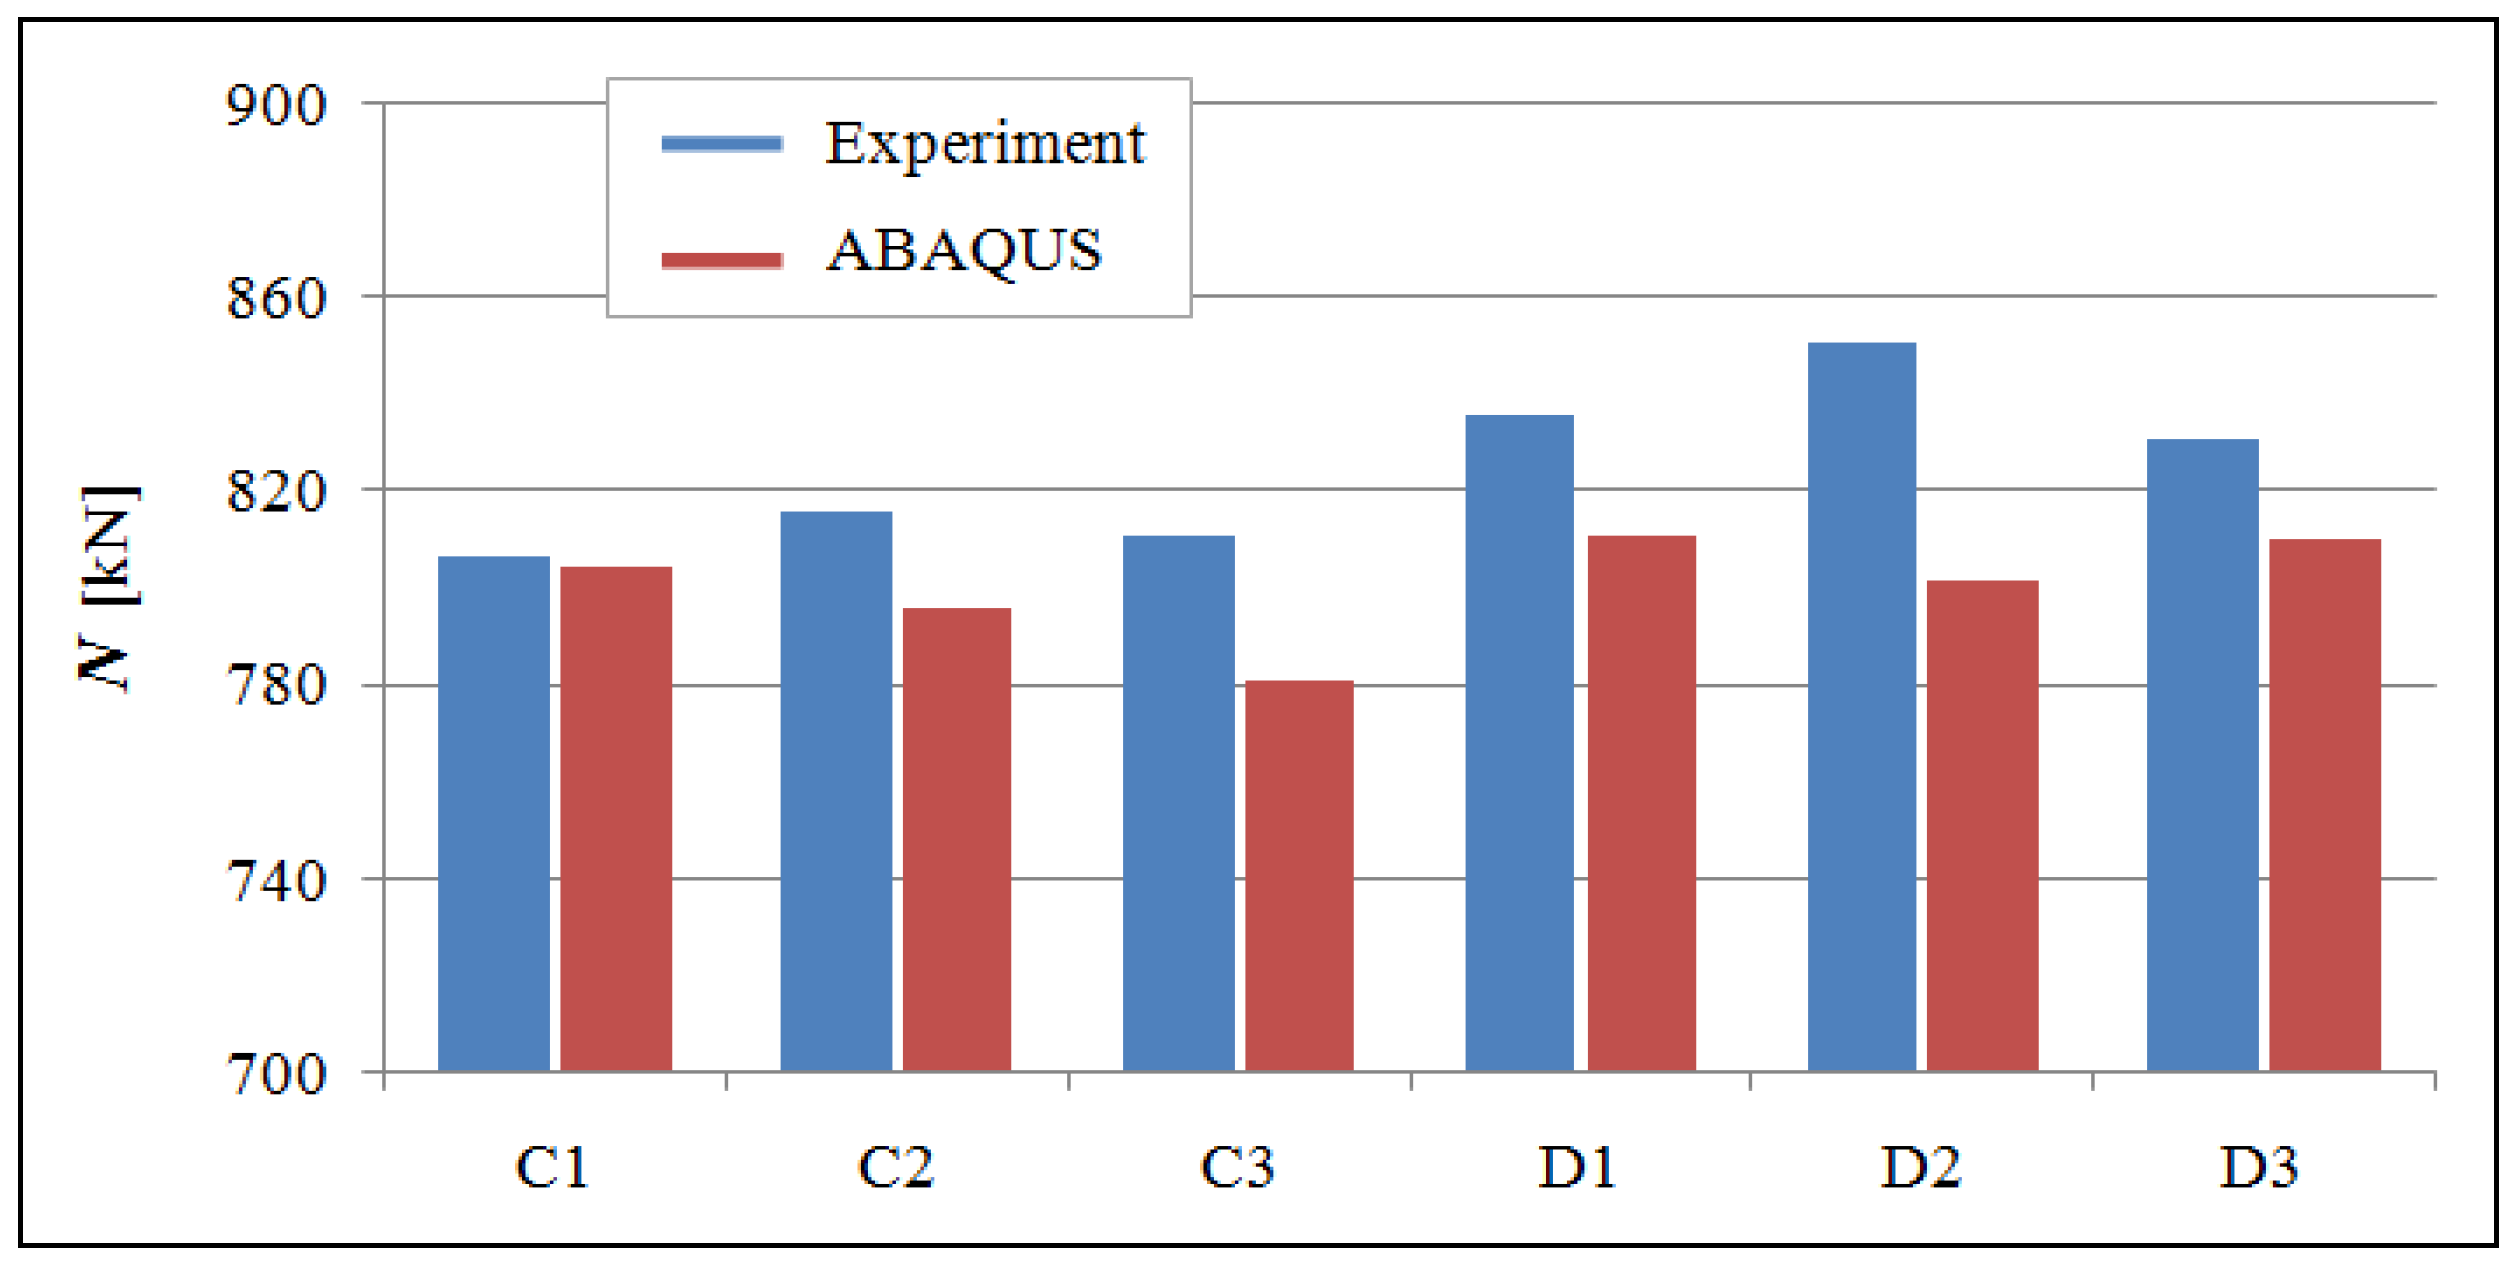
Table 6 and
Table 7 and
Figure 20 present the obtained limit loads for members of groups C and D, i.e., columns made of thin-walled tubes fully filled with concrete.
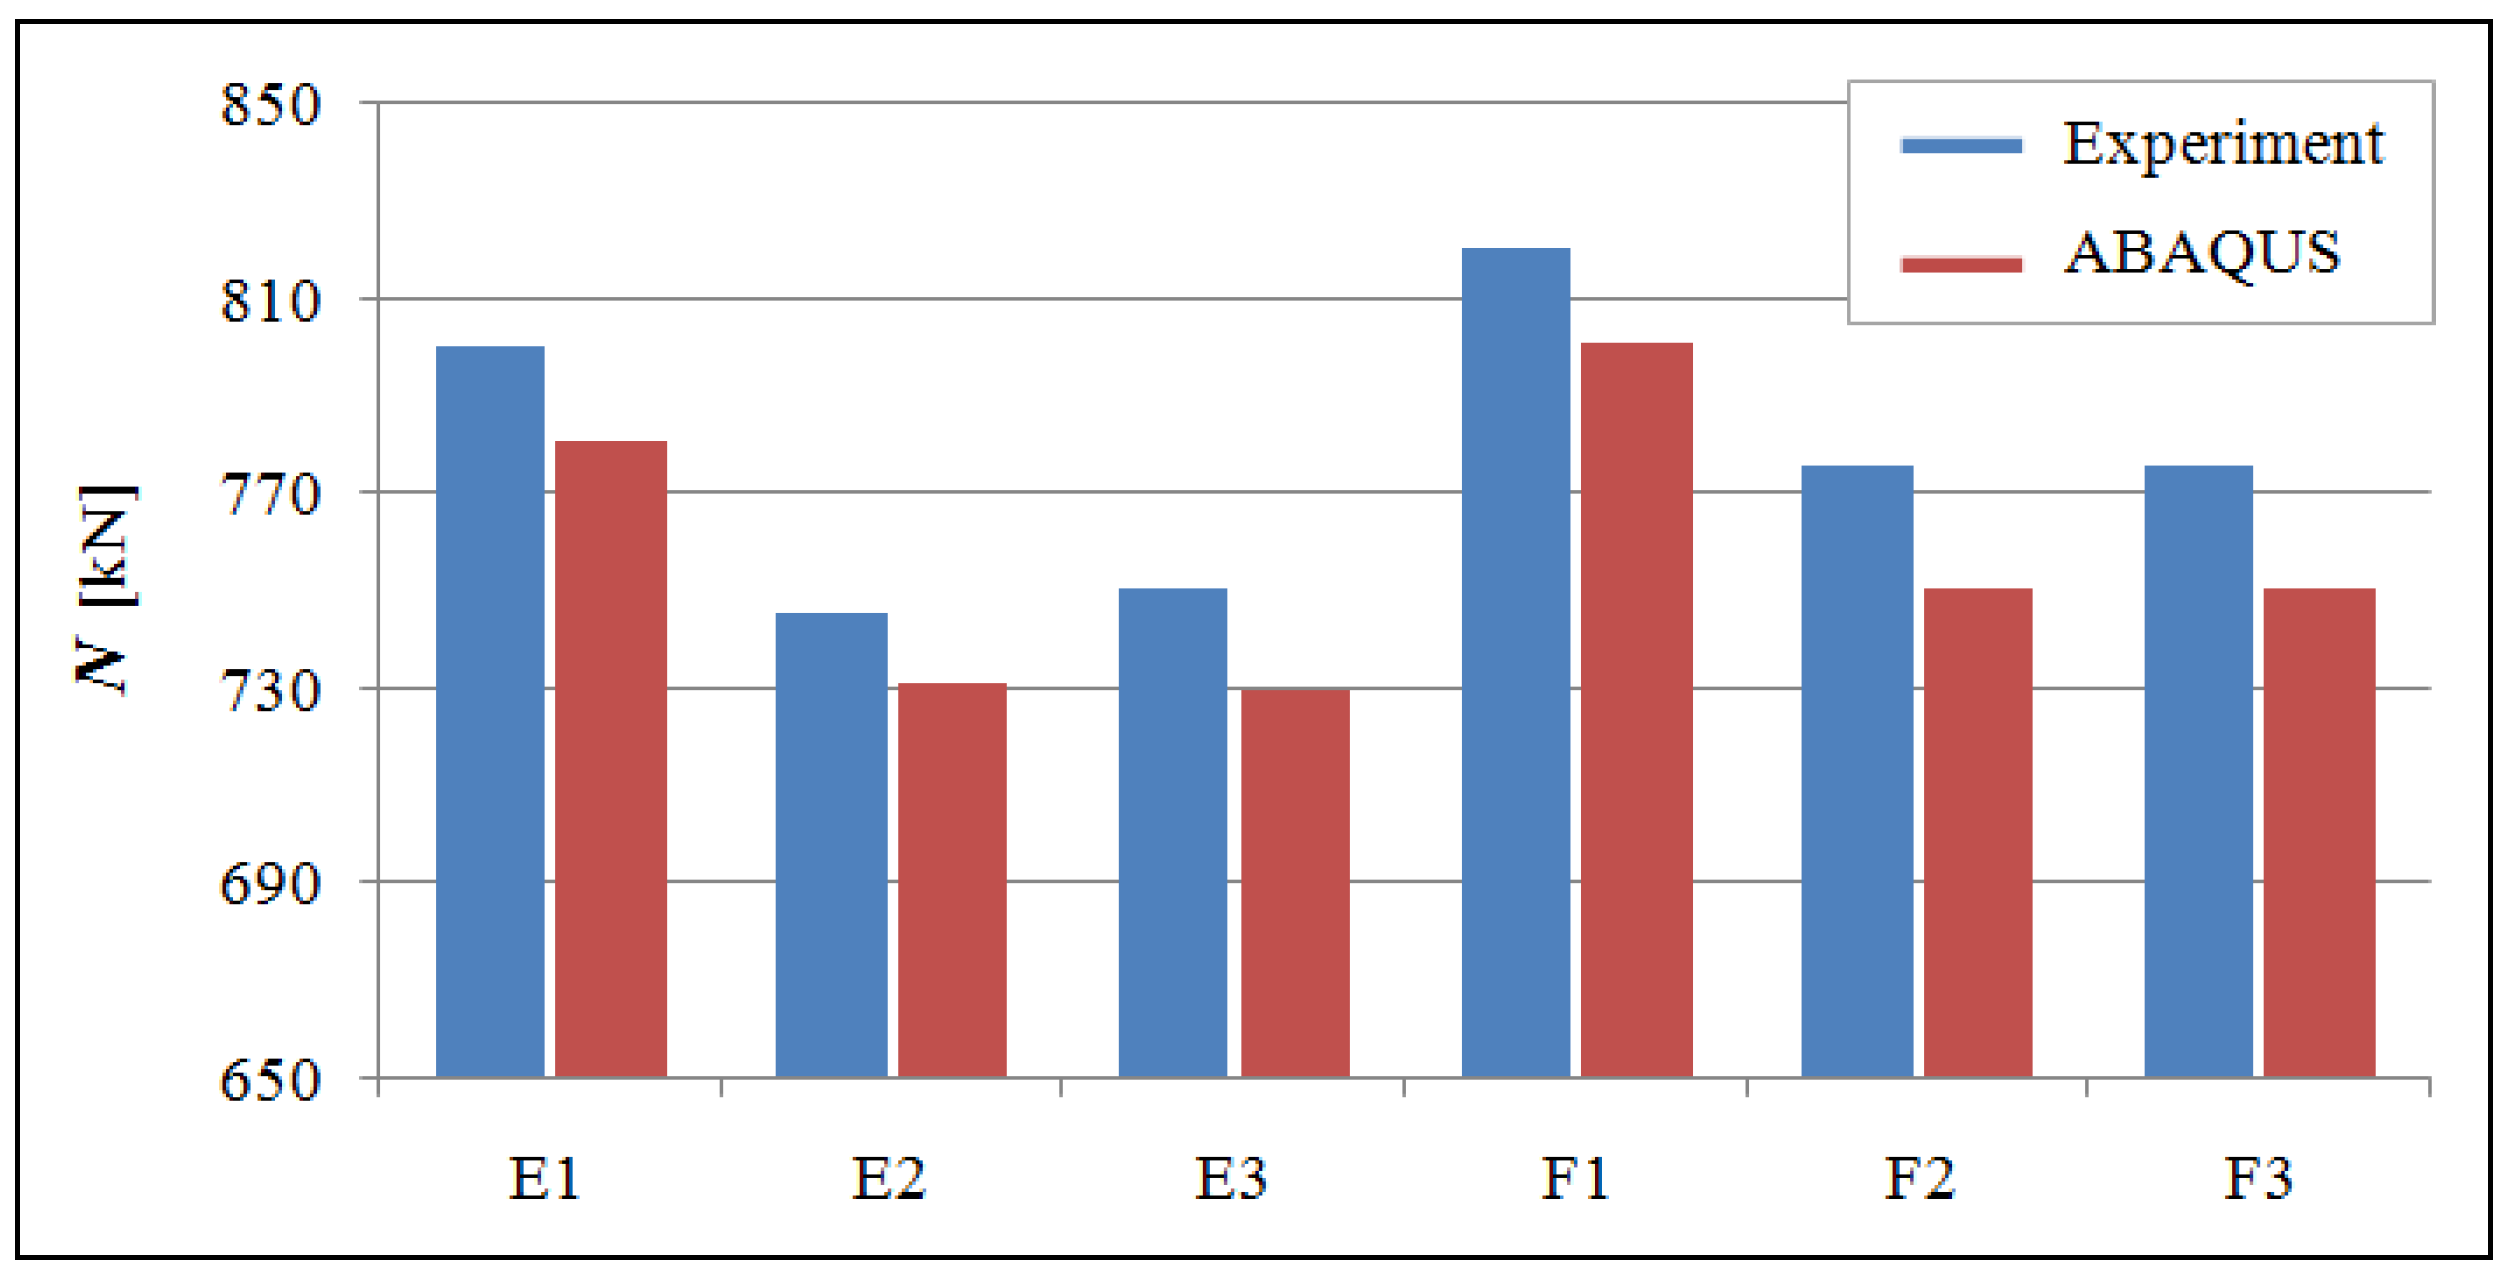
Groups E and F represent a specific case. The concrete filling is shorter than the length of the column and the load acts on the protruded steel shell. These groups are representative in the case of reconstruction and strengthening of existing steel columns of hollow cross-section by additional filling with concrete, as effectively achieving complete filling of the columns to their edges would be significantly difficult in such instances.
In any case, there are currently no valid calculation procedures for the design and evaluation of such members. The obtained limit loads from experimental tests and 3D simulations for members of groups E and F, including their average values, are listed in
Table 8 and
Table 9. The limit loads of the individual tested members (E1 to E3 and F1 to F3) are listed in
Table 8, while the average values of these limit loads for groups E and F are presented in
Table 9.
Figure 21 illustrates the above-mentioned limit loads in graphical form. These results show that the contribution of concrete filling is smaller compared to groups C and D.
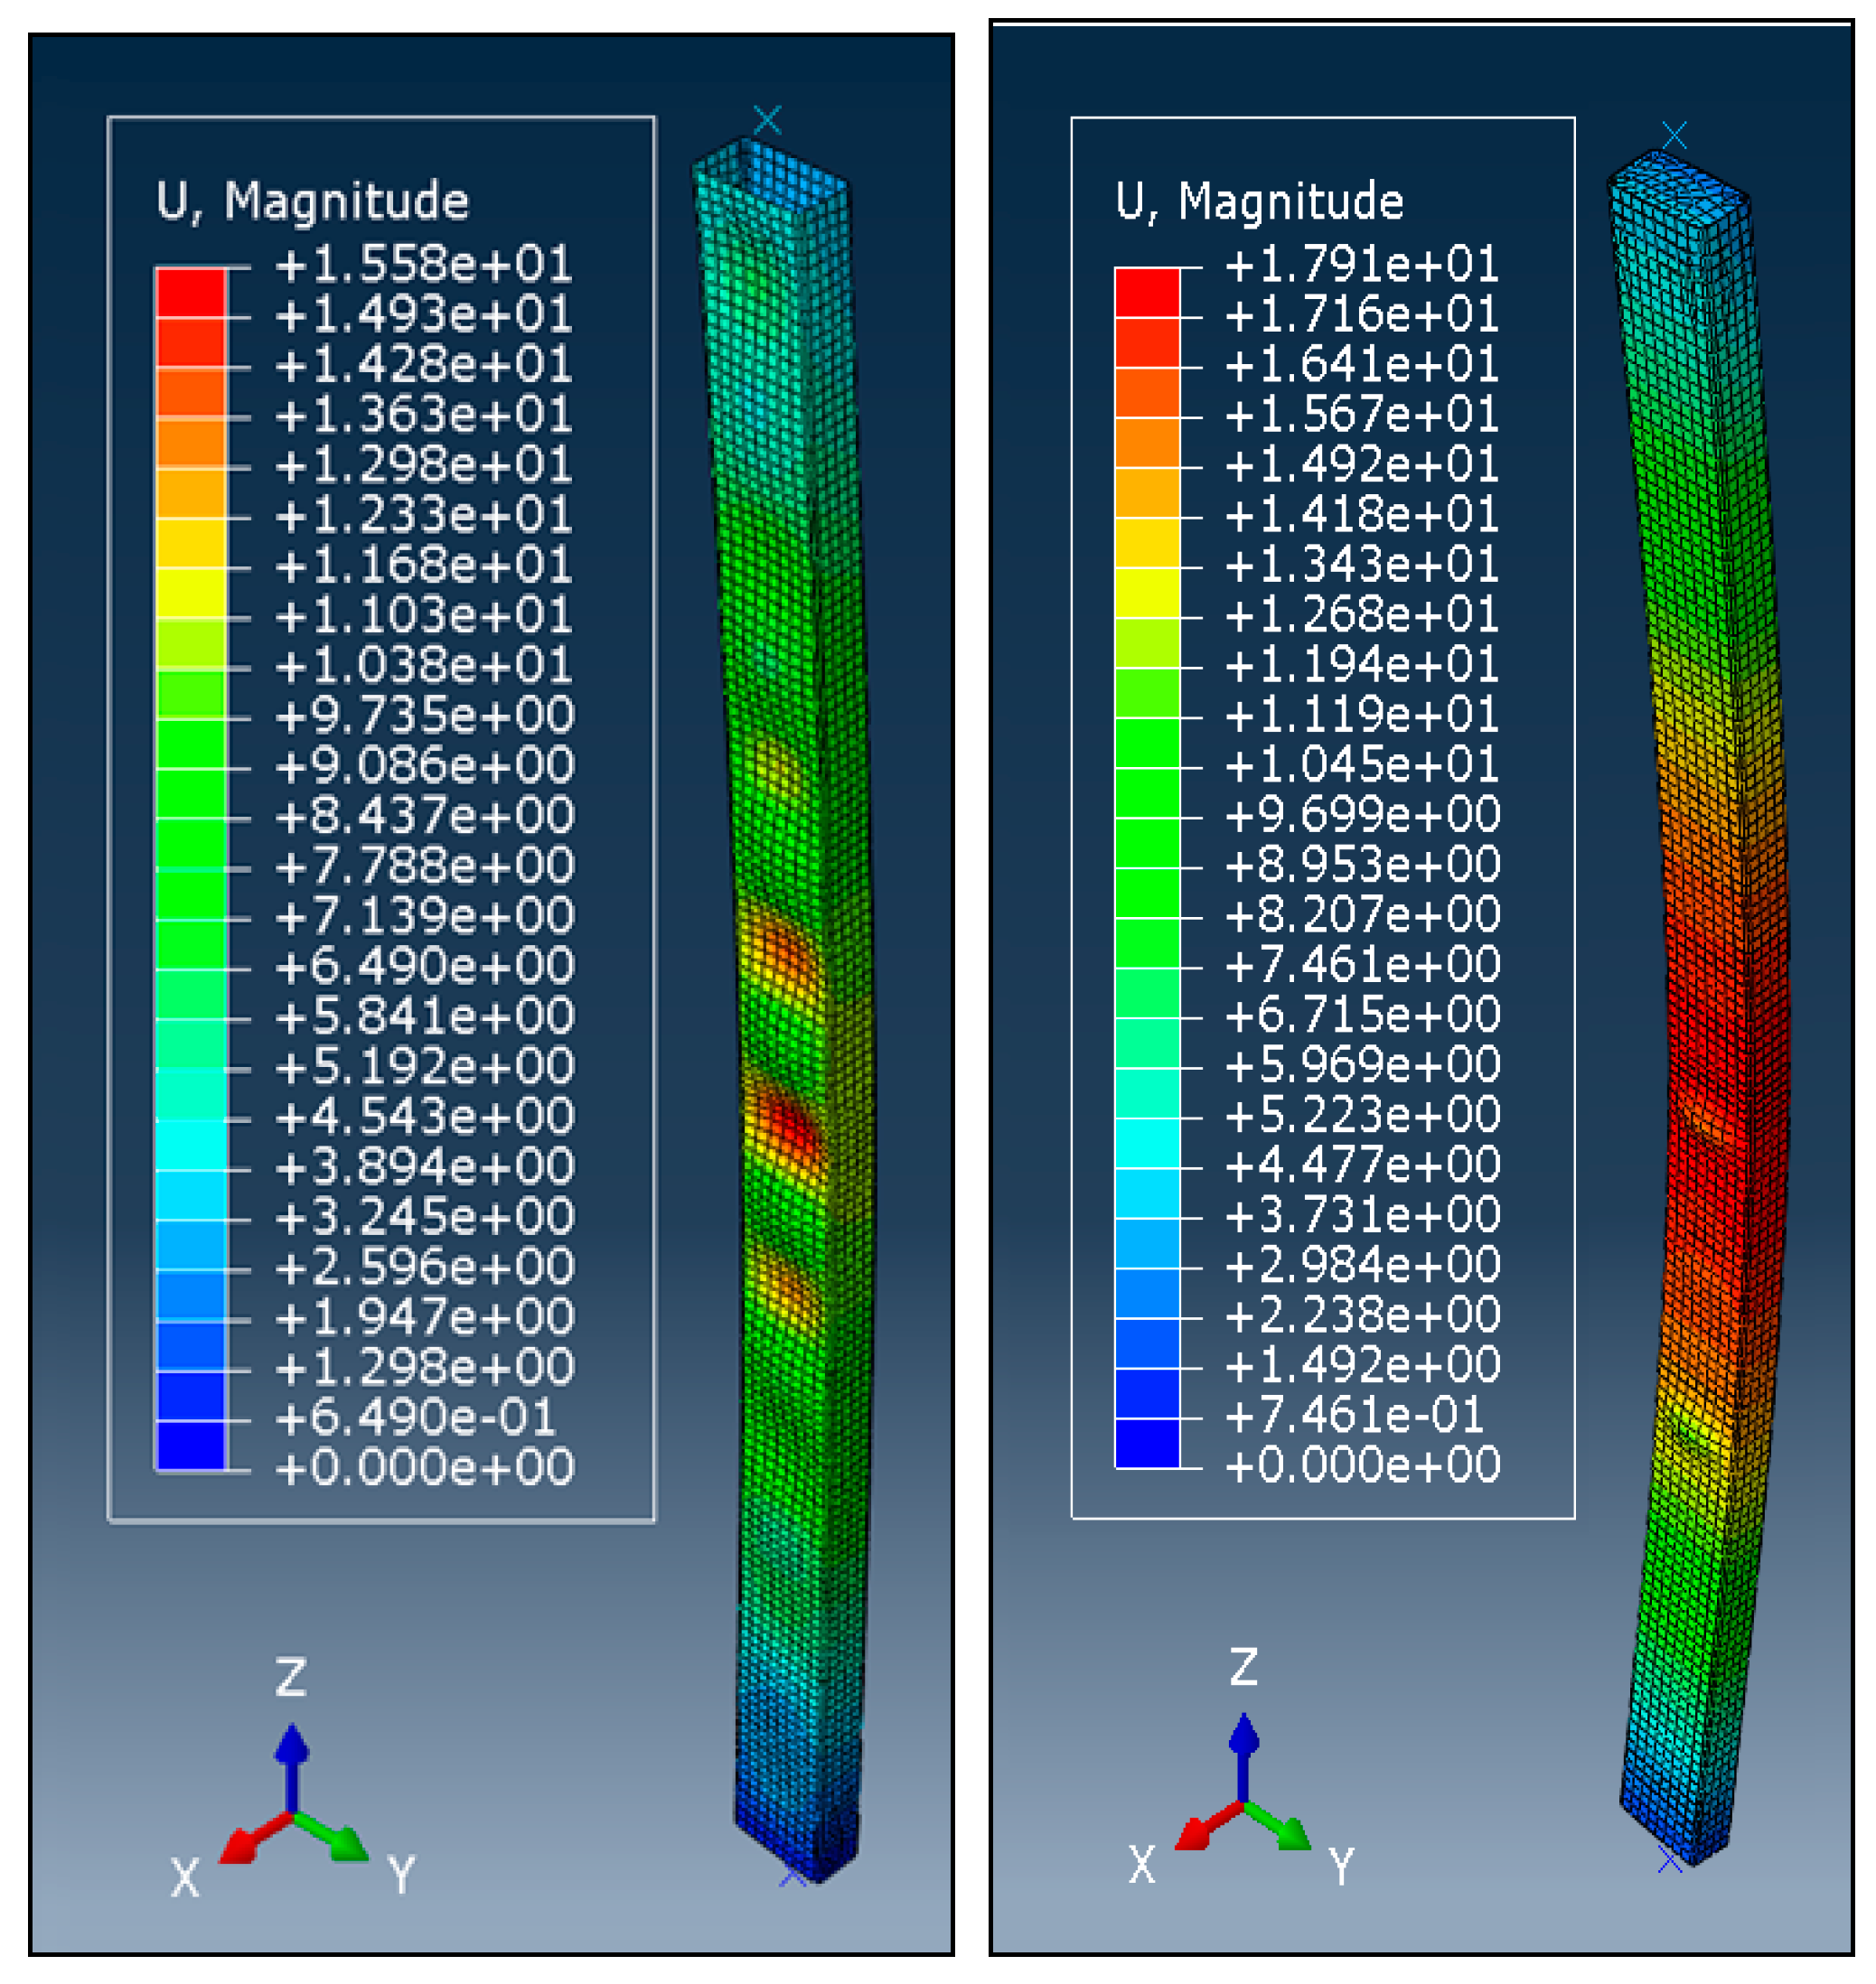
For illustration,
Figure 22 and
Figure 23 show comparisons of the final failure of a selected tested member. According to the experimental test,
Figure 22 shows the final failure configuration of the tested member F1. The final failure configuration of the tested member F1 according to the FE analysis using ABAQUS is shown in
Figure 23.
8. Conclusions
Based on the analysis and results presented in the previous chapters, the conclusions can be summarized as follows:
Test members of groups A and B represent a standard situation for classical calculation according to EN 1993-1-1. The reason for their investigation was the creation and fine-tuning of 3D models for their further use in the numerical analysis of groups C, D, E, and F;
Based on the presented experimental and numerical analysis, it was found that the steel end-plates of the test members (groups B, D, and F) did not have a significant contribution to their resulting buckling resistance, contributing less than 4%;
The valid standards, including EN 1994-1-1, do not provide any design procedure for composite columns having a steel shell, with a slender cross-section of class 4. Therefore, the obtained results could not be compared with the results of any calculation procedure that is given by a standard or other regulation. However, the obtained results from experimental tests and 3D simulations of groups C and D proved a significant increase in the buckling resistance and the possibility of using class 4 profiles for composite concrete-filled tubular columns, see
Table 5 and
Table 7;
Members of group E and F are a case that may occur when strengthening existing steel columns of hollow cross-sections by additional filling with concrete, because completely filling the columns up to their edges would be difficult. There are no applicable standards or regulations for the design and evaluation of such members. Nevertheless, a comparison of
Table 5 and
Table 9 declares a positive composite interaction of the steel shell and the concrete core;
The main contribution of the presented research lies in the fact that it deals with cases that are not included in the currently valid standards. The work carried out within this research has provided reliable results that can be relied upon for further investigation, which will be needed to utilize these results;
Future work and analysis should focus on finding new relationships, alternatively extending existing ones, in order to develop a calculation and design procedure for concrete-filled composite steel columns with cross-sections of class 4.
Author Contributions
Conceptualization, V.K. and M.A.A.; methodology, V.K. and R.K.; validation, V.K., R.K. and M.A.A.; investigation, V.K. and R.K.; resources, P.P., E.H. and M.A.A.; writing—original draft preparation, R.K., P.P. and M.A.A.; writing—review and editing, V.K., P.P. and M.A.A.; visualization, P.P. and E.H.; supervision and funding acquisition, V.K. All authors have read and agreed to the published version of the manuscript.
Funding
This paper has been supported by the project VEGA 1/0172/20 “Stress and deformation analysis of load bearing components made out of steel, glass and composite materials” of the Scientific Grant Agency of the Ministry of Education, Science, Research and Sport of the Slovak Republic and the Slovak Academy of Sciences, and by the project APVV-15-0486 “Analysis of Shear Connection Influence in Bridges with Encased Beams” of the Slovak Research and Development Agency.
Institutional Review Board Statement
Not applicable.
Informed Consent Statement
Not applicable.
Data Availability Statement
Data are contained within the article.
Conflicts of Interest
The authors declare no conflict of interest.
References
- Al Ali, M.; Tomko, M.; Badak, M. Analysis of the resistance of thin-walled cold-formed compressed steel members with closed cross-sections, Part 1. Mag. Civ. Eng. 2013, 5, 38–43, ISSN 2071-4726. [Google Scholar] [CrossRef]
- Al Ali, M.; Tomko, M. Analysis of the resistance of thin-walled cold-formed compressed steel members with closed cross-sections, Part 2. Mag. Civ. Eng. 2014, 1, 53–58, ISSN 2071-4726. [Google Scholar] [CrossRef]
- Kanishchev, R.A. Analysis of local stability of rectangular tubes filled with concrete. Mag. Civ. Eng. 2016, 64, 59–68. [Google Scholar] [CrossRef]
- Alatshan, F.; Osman, S.A.; Altlomate, A.; Alkair, M.; Hamid, R.; Mashiri, F. Design model of rectangular concrete-filled steel tubular stub columns under axial compression. Buildings 2023, 13, 128. [Google Scholar] [CrossRef]
- Chepurnenko, A.; Turina, V.; Akopyan, V. Simplified Method for Calculating the Bearing Capacity of Slender Concrete-Filled Steel Tubular Columns. CivilEng 2023, 4, 1000–1015. [Google Scholar] [CrossRef]
- Grzeszykowski, B.; Szmigiera, E.D. Experimental investigation on the vertical ductility of rectangular CFST columns loaded axially. Materials 2022, 15, 2231. [Google Scholar] [CrossRef] [PubMed]
- Florence More, D.S.M.; Senthil, S.S. Experimental investigation on the axial compressive behaviour of cold-formed steel-concrete composite columns infilled with various types of fibre-reinforced concrete. Buildings 2023, 13, 151. [Google Scholar] [CrossRef]
- Zhen, W.; Zhe, L.; Xuejun, Z. Experimental investigation of special-shaped concrete-filled square steel tube composite columns with steel hoops under axial loads. Materials 2022, 15, 4179. [Google Scholar] [CrossRef]
- Storozhenko, L.I.; Ermolenko, D.A.; Demchenko, O.V. Rabota pod Nagruzkoi Szhatych Trubobetonnych Elementov s Usilennymi Jadrami [The Work under Load of Compressed Concrete Pipe Elements with Reinforced Cores]. In Proceedings of the XIX International Scientific and Methodological Seminar “Perspective Directions of Innovative Development of Construction and Training of Engineering Personnel”, Brest, Belarus, 23–25 April 2014. [Google Scholar]
- Ellobody, E.; Young, B. Non-linear analysis of concrete-filled steel SHS and RHS columns. Thin-Walled Struct. 2006, 44, 919–930. [Google Scholar] [CrossRef]
- Ding, F.; Sheng, S.; Yu, Y.; Yu, Z. Mechanical behaviours of concrete-filled rectangular steel tubular under pure torsion. Steel Compos. Struct. 2019, 31, 291–301. [Google Scholar] [CrossRef]
- Lee, S. Capacity and the moment-curvature relationship of high-strength concrete-filled steel tube columns under eccentric loads. Steel Compos. Struct. 2007, 7, 135–160. [Google Scholar] [CrossRef]
- Mouli, M.; Khelafi, H. Strength of short composite rectangular hollow section columns filled with lightweight aggregate concrete. Eng. Struct. 2007, 29, 1791–1797. [Google Scholar] [CrossRef]
- Uy, B. Stability and ductility of high performance steel sections with concrete infill. J. Constr. Steel Res. 2008, 64, 748–754. [Google Scholar] [CrossRef]
- Huang, Y.; Long, Y.; Cai, J. Ultimate strength of rectangular concrete-filled steel tubular (CFT) stub columns under axial compression. Steel Compos. Struct. 2008, 8, 115–128. [Google Scholar] [CrossRef]
- Aslani, F.; Uy, B.; Tao, Z.; Mashiri, F. Predicting the axial load capacity of high-strength concrete-filled steel tubular columns. Steel Compos. Struct. 2015, 19, 967–993. [Google Scholar] [CrossRef]
- Aslani, F.; Uy, B.; Wang, Z.; Patel, V. Confinement models for high-strength short square and rectangular concrete-filled steel tubular columns. Steel Compos. Struct. 2016, 22, 937–974. [Google Scholar] [CrossRef]
- Wang, Q.; Shi, Q.; Xu, Z.; He, H. Axial capacity of reactive powder concrete-filled steel tube columns with two load conditions. Steel Compos. Struct. 2019, 31, 13–25. [Google Scholar] [CrossRef]
- Espinos, A.; Alberto, V.; Romero, M.; Mund, M.; Meyer, P.; Schaumann, P. Non-constant biaxial bending capacity assessment of CFST columns through interaction diagrams. Steel Compos. Struct. 2019, 32, 521–536. [Google Scholar] [CrossRef]
- Chen, Z.; Liu, X.; Zhou, W. Residual bond behaviour of high strength concrete-filled square steel tube after elevated temperatures. Steel Compos. Struct. 2018, 27, 509–523. [Google Scholar] [CrossRef]
- Patel, V.I.; Liang, Q.Q.; Hadi, M. Inelastic stability analysis of high-strength rectangular concrete-filled steel tubular slender beam-columns. Interact. Multiscale Mech. 2012, 5, 91–104. [Google Scholar] [CrossRef]
- Yang, Y.; Han, L. Experiments on rectangular concrete-filled steel tubes loaded axially on a partially stressed cross-sectional area. J. Constr. Steel Res. 2009, 65, 1617–1630. [Google Scholar] [CrossRef]
- Ding, F.; Fang, C.; Bai, Y.; Gong, Y. Mechanical performance of stirrup-confined concrete-filled steel tubular stub columns under axial loading. J. Constr. Steel Res. 2014, 98, 146–157. [Google Scholar] [CrossRef]
- Ding, F.; Wen, B.; Liu, X.; Wang, H. Composite action of notched circular CFT stub columns under axial compression. Steel Compos. Struct. 2017, 24, 309–322. [Google Scholar] [CrossRef]
- Qiao, Q.; Zhang, W.; Mou, B.; Cao, W. Effect of spiral spacing on axial compressive behaviour of square reinforced concrete-filled steel tube (RCFST) columns. Steel Compos. Struct. 2019, 31, 559–573. [Google Scholar] [CrossRef]
- Lu, Z.-H.; Zhao, Y.-G.; Yu, Z.-W.; Chen, C. Reliability-based assessment of American and European specifications for square CFT stub columns. Steel Compos. Struct. 2015, 19, 811–827. [Google Scholar] [CrossRef]
- Kanishchev, R.; Kvocak, V. Effects of stability on the resistance of composite concrete-filled rectangular steel pipes according to world standards. In Proceedings of the IABSE Conference: Elegance in Structures, Nara, Japan, 13–15 May 2015. [Google Scholar]
- EN 1993-1-1; Eurocode 3: Design of Steel Structures—Part 1-1: General Rules and Rules for Buildings. European Committee for Standardization: Brussels, Belgium, 2005.
- EN 1994-1-1; Eurocode 4: Design of Composite Steel and Concrete Structures—Part 1-1: General Rules and Rules for Buildings. European Committee for Standardization: Brussels, Belgium, 2004.
- SIMULIA. Abaqus 6.13. Analysis Users Guide Volume I; Dassault Systems: Providence, RI, USA, 2013. [Google Scholar]
- Hu, H.-T.; Huang, C.-S.; Wu, M.-H.; Wu, Y.-M. Non-linear analysis of axially loaded concrete-filled tube columns with confinement effect. J. Struct. Eng. 2003, 129, 1322–1329. [Google Scholar] [CrossRef]
Figure 1.
Schematic illustration of groups A, B, and C of test members.
Figure 1.
Schematic illustration of groups A, B, and C of test members.
Figure 2.
Schematic illustration of groups D, E, and F of test members.
Figure 2.
Schematic illustration of groups D, E, and F of test members.
Figure 3.
Part of the generated raster intended for 3D scanning.
Figure 3.
Part of the generated raster intended for 3D scanning.
Figure 4.
General view of the scan setup.
Figure 4.
General view of the scan setup.
Figure 5.
Testing machine and specimens after tensile tests.
Figure 5.
Testing machine and specimens after tensile tests.
Figure 6.
Example of a strain–stress diagram obtained from the steel tensile test.
Figure 6.
Example of a strain–stress diagram obtained from the steel tensile test.
Figure 7.
Selected specimens before and after the strength tests.
Figure 7.
Selected specimens before and after the strength tests.
Figure 8.
Example of a strain–stress diagram obtained from a cube strength test.
Figure 8.
Example of a strain–stress diagram obtained from a cube strength test.
Figure 9.
Locations of the strain gauges (T) and inductive sensors (S).
Figure 9.
Locations of the strain gauges (T) and inductive sensors (S).
Figure 10.
Overall view of the test—INSTRON 8806.
Figure 10.
Overall view of the test—INSTRON 8806.
Figure 11.
Dependence of w on N—member C1 of group C.
Figure 11.
Dependence of w on N—member C1 of group C.
Figure 12.
Dependence of w on N—member D1 of group D.
Figure 12.
Dependence of w on N—member D1 of group D.
Figure 13.
Final buckling shapes of selected tested members with some detailed views.
Figure 13.
Final buckling shapes of selected tested members with some detailed views.
Figure 14.
Model of steel members with hollow cross-section.
Figure 14.
Model of steel members with hollow cross-section.
Figure 15.
Model of composite concrete-filled members.
Figure 15.
Model of composite concrete-filled members.
Figure 16.
Model of members with steel front plates.
Figure 16.
Model of members with steel front plates.
Figure 17.
3D model with configuration of initial geometric imperfections—member E1.
Figure 17.
3D model with configuration of initial geometric imperfections—member E1.
Figure 18.
Final buckling shapes generated by ABAQUS.
Figure 18.
Final buckling shapes generated by ABAQUS.
Figure 19.
Limit loads—groups A and B, graphical illustration.
Figure 19.
Limit loads—groups A and B, graphical illustration.
Figure 20.
Limit loads—groups C and D, graphical illustration.
Figure 20.
Limit loads—groups C and D, graphical illustration.
Figure 21.
Limit loads—groups E and F, graphical illustration.
Figure 21.
Limit loads—groups E and F, graphical illustration.
Figure 22.
Final failure of the tested member F1—Experimental test.
Figure 22.
Final failure of the tested member F1—Experimental test.
Figure 23.
Final failure of the tested member F1—FE analysis by ABAQUS.
Figure 23.
Final failure of the tested member F1—FE analysis by ABAQUS.
Table 1.
Designed dimensions and material of the test members.
Table 1.
Designed dimensions and material of the test members.
| Group | Marking | Dimensions | Material |
|---|
| A | A1, A2, A3 | b = 200 mm
h = 100 mm
t = 3.0 mm
L = 2900 mm | Steel S235
Concrete C25/30 |
| B | B1, B2, B3 |
| C | C1, C2, C3 |
| D | D1, D2, D3 |
| E | E1, E2, E3 |
| F | F1, F2, F3 |
Table 2.
Some results and average values from 15 performed steel tensile tests.
Table 2.
Some results and average values from 15 performed steel tensile tests.
| Test No. | fy [MPa] | fy,aver. [MPa] | fu [MPa] | fu,aver. [MPa] |
|---|
| T1 | 379 | 374.67 | 428 | 426.07 |
| T3 | 371 | 426 |
| T8 | 372 | 425 |
| T13 | 377 | 426 |
| T15 | 372 | 425 |
Table 3.
Some results and average values from the performed concrete strength tests.
Table 3.
Some results and average values from the performed concrete strength tests.
| Test No./Day | fc,cube [MPa] | fc,cube,aver. [MPa] | fc,cyl. [MPa] | fc,cyl.,aver. [MPa] |
|---|
| T1/28 | 27.92 | 27.94 | 22.00 | 21.42 |
| T2/28 | 29.95 | 21.28 |
| T3/28 | 25.86 | 21.00 |
| T1/150 | 33.09 | 33.53 | 25.45 | 25.83 |
| T2/150 | 36.09 | 25.65 |
| T3/150 | 31.40 | 26.38 |
Table 4.
Limit loads—groups A and B.
Table 4.
Limit loads—groups A and B.
| Test Members | Limit Load [kN] | Experiment/
ABAQUS |
|---|
| Group | Marking | Experiment | ABAQUS |
|---|
| | A1 | 375 | 360 | 1.042 |
| A | A2 | 360 | 355 | 1.014 |
| | A3 | 350 | 345 | 1.014 |
| | B1 | 370 | 380 | 0.974 |
| B | B2 | 360 | 351 | 1.026 |
| | B3 | 350 | 345 | 1.014 |
Table 5.
Limit loads—groups A and B, average values.
Table 5.
Limit loads—groups A and B, average values.
| Test Members | Limit Load [kN] | Experiment/
ABAQUS |
|---|
| Experiment | ABAQUS |
|---|
| group A (A1, A2, A3) | 361.67 | 353.33 | 1.024 |
| group B (B1, B2, B3) | 360.00 | 358.67 | 1.004 |
Table 6.
Limit loads—groups C and D.
Table 6.
Limit loads—groups C and D.
| Test Members | Limit load [kN] | Experiment/
ABAQUS |
|---|
| Group | Marking | Experiment | ABAQUS |
|---|
| | C1 | 805 | 803 | 1.002 |
| C | C2 | 815 | 795 | 1.025 |
| | C3 | 810 | 780 | 1.038 |
| | D1 | 835 | 810 | 1.031 |
| D | D2 | 850 | 801 | 1.061 |
| | D3 | 830 | 809 | 1.026 |
Table 7.
Limit loads—groups C and D, average values.
Table 7.
Limit loads—groups C and D, average values.
| Test Members | Limit Load [kN] | Experiment/
ABAQUS |
|---|
| Experiment | ABAQUS |
|---|
| Group C (C1, C2, C3) | 810.00 | 792.67 | 1.022 |
| Group D (D1, D2, D3) | 838.33 | 806.67 | 1.039 |
Table 8.
Limit loads—groups E and F.
Table 8.
Limit loads—groups E and F.
| Test Members | Limit Load [kN] | Experiment/
ABAQUS |
|---|
| Group | Marking | Experiment | ABAQUS |
|---|
| | E1 | 800 | 780 | 1.026 |
| E | E2 | 745 | 730 | 1.021 |
| | E3 | 750 | 729 | 1.029 |
| | F1 | 820 | 800 | 1.025 |
| F | F2 | 775 | 750 | 1.033 |
| | F3 | 775 | 754 | 1.028 |
Table 9.
Limit loads—groups E and F, average values.
Table 9.
Limit loads—groups E and F, average values.
| Test Members | Limit Load [kN] | Experiment/
ABAQUS |
|---|
| Experiment | ABAQUS |
|---|
| Group E (E1, E2, E3) | 765.00 | 746.33 | 1.025 |
| Group F (F1, F2, F3) | 790.00 | 768.00 | 1.029 |
| Disclaimer/Publisher’s Note: The statements, opinions and data contained in all publications are solely those of the individual author(s) and contributor(s) and not of MDPI and/or the editor(s). MDPI and/or the editor(s) disclaim responsibility for any injury to people or property resulting from any ideas, methods, instructions or products referred to in the content. |
© 2023 by the authors. Licensee MDPI, Basel, Switzerland. This article is an open access article distributed under the terms and conditions of the Creative Commons Attribution (CC BY) license (https://creativecommons.org/licenses/by/4.0/).


 ,
, 


