1. Introduction
Under the shock of the coronavirus and other public health emergencies, China’s economy has been severely affected, making it imperative to strengthen economic resilience [
1]. Corporate resilience serves as a critical part of economic resilience [
2]. Meanwhile, corporate capital allocation, as a micro-determining factor influencing the efficiency of social resource allocation, plays a pivotal role in enhancing corporate competitiveness and corporate resilience [
3]. Capital allocation efficiency reflects a company’s ability to identify and evaluate investment opportunities in an ever-changing external environment [
4]. Companies with superior capital allocation efficiency can generate sustainable cash flows, increase shareholder value, and drive corporate growth. In the face of external uncertainty, effective capital allocation can provide ample buffers that accelerate a company’s post-shock recovery. Therefore, capital allocation efficiency serves as a strong representative for corporate resilience and an important metric for assessing and improving a company’s risk mitigation capabilities.
At the same time, with China’s economic transformation, the theory of sustainable development has been fully integrated into the current development pattern [
5]. Since 2012, “green development” has been adopted as the guiding principle of China’s economic development. The concept of environmental, social, and governance (ESG) is highly compatible with China’s development strategy and provides a systematic and quantifiable operational framework for China’s sustainable development [
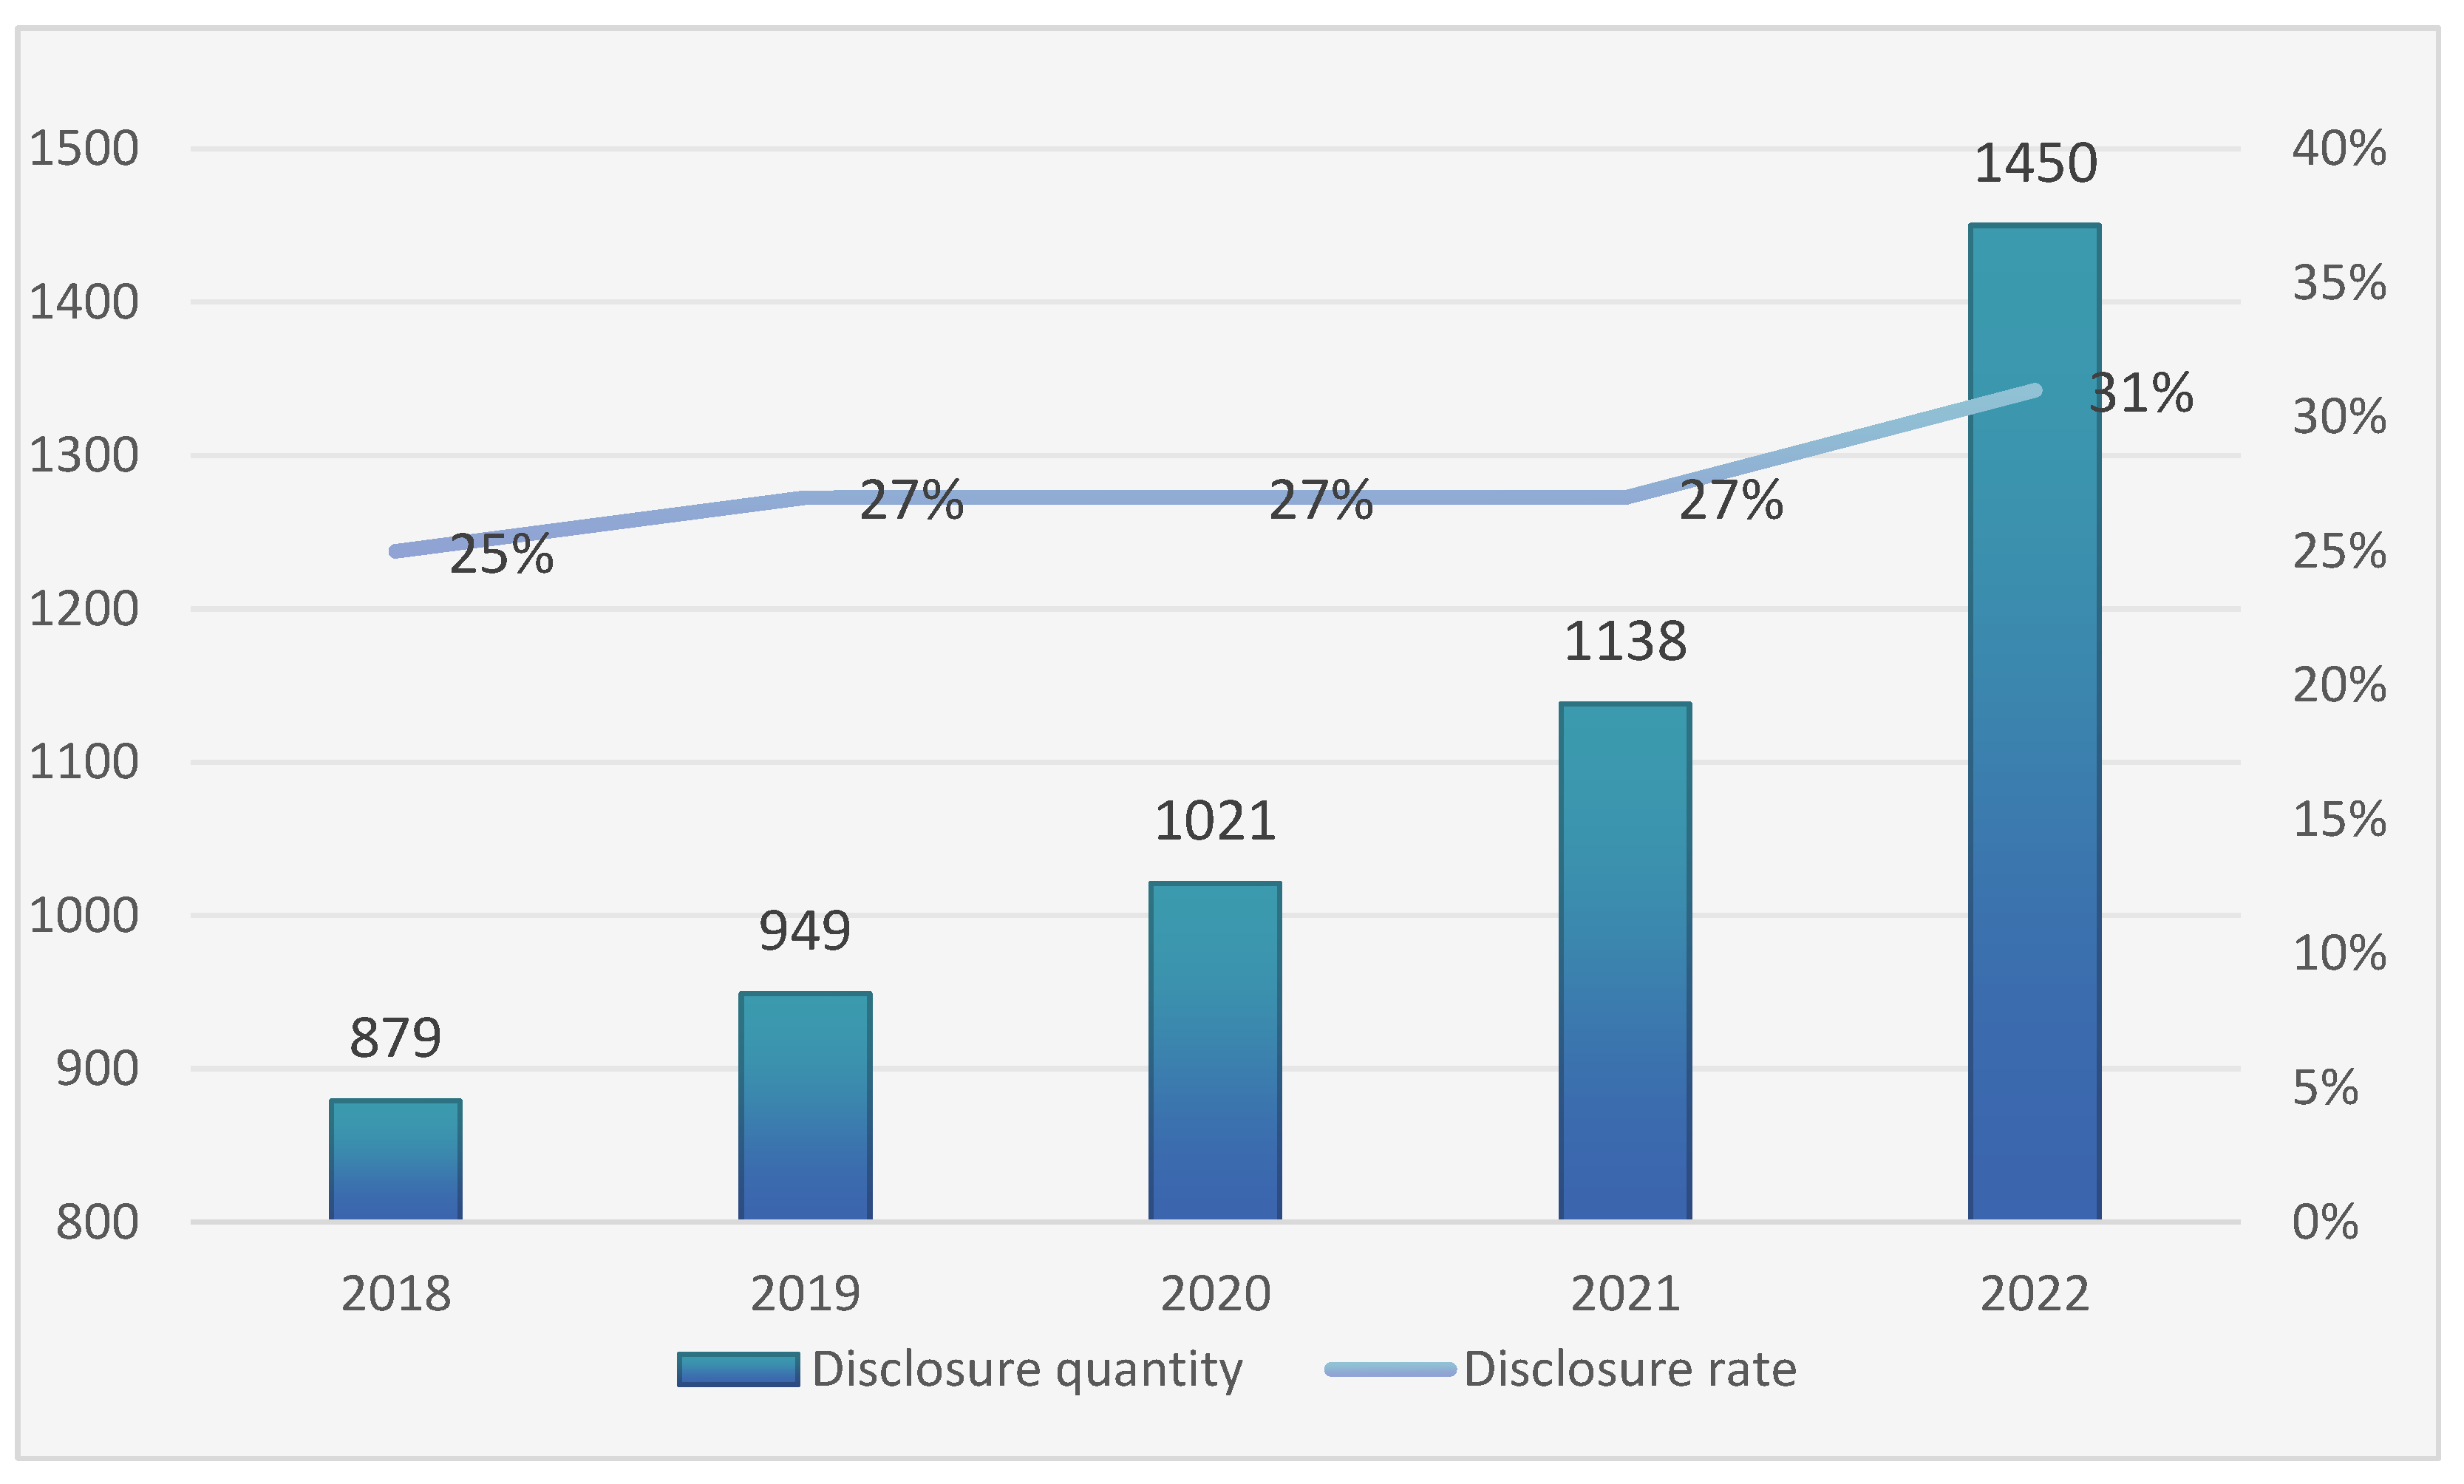
6]. As shown in
Figure 1, as of 24 August 2022, a total of 1450 companies had disclosed independent ESG reports. This indicates that Chinese companies are gradually prioritizing sustainable development and ESG practices. ESG emphasizes that companies create value in a responsible way, which is not only about carbon reduction and climate change but also about building resilience and sustainability [
6]. It will help Chinese companies compete in the international marketplace and significantly contribute to the sustainable development of the Chinese economy.
The existing literature has primarily concentrated on the influence of ESG as a whole, or of its individual components, on firm value, as well as the impact of ESG on corporate financing costs, financing efficiency, and investment efficiency [
7,
8,
9,
10]. However, there is a paucity of studies that examine the influence of ESG performance on corporate resilience. Previous studies have discussed the positive influence from the perspective of information asymmetry theory [
11,
12]. They suggest that ESG performance can enhance corporate resilience by mitigating underinvestment and reducing agency costs [
13]. Conversely, some scholars propose that managers may artificially enhance corporate social responsibility, and thereby reduce resilience, according to stakeholder theory [
14]. For instance, overinvestment reduces the efficiency of investment [
15]. This polarized view creates an underexplored research gap. In addition, due to the relatively recent emergence of ESG theory, most previous studies have used corporate social responsibility (CSR) as the core variable, leading to research inconsistencies. The impact of ESG performance on corporate resilience has left several unanswered questions, thus giving rise to the research question addressed in this paper.
China’s ESG practices have developed rapidly in recent years. However, compared with developed countries, there is still a certain gap in China’s ESG system construction. For example, China’s ESG disclosure framework has not yet formed a unified and clear standard, and the market influence of the localized ESG evaluation system is relatively weak. Therefore, China’s ESG practice also needs to be further strengthened and improved to better adapt to international development trends and market demand. While corporate resilience is recognized as a crucial asset in the face of external shocks, there is limited research on its enhancement, particularly in China. Our research objective is to conduct a deeper exploration of the construction and promotion of corporate resilience in the Chinese context, with the aim of filling the knowledge gap in this area. This, in turn, can facilitate sustainable development and the growth of green finance in China. This paper aims to explore the impact of ESG performance on corporate resilience in China based on stakeholder theory, resource dependence theory, and signal transmission theory.
First, we theoretically explain the influence of ESG performance on corporate resilience. Second, this study conducts an empirical analysis of the hypotheses proposed in the theoretical analysis. Specifically, 4436 Chinese A-share listed companies that received ESG ratings from China Securities from 2011 to 2021 are selected as research objects. We construct an investment-level index to measure corporate resilience from the perspective of capital allocation efficiency. Then, the relationship between ESG performance and corporate resilience is analyzed using a fixed-effects model, heterogeneity analysis, and mediation effect model. Finally, the robustness of the model is tested by substituting variables and conducting an endogeneity test.
This paper finds that: (1) Good ESG performance can enhance corporate resilience. This is because ESG performance aligns with the societal value of sustainable development, which helps build stakeholder support and attract capital. (2) The enhancing effect of ESG performance on corporate resilience varies depending on the nature of the corporation’s property rights and the industry in which it operates. In particular, ESG performance has a greater impact on non-state-owned and manufacturing enterprises, because these enterprises are more urgently improving their ESG performance in the current environment, and the marginal effect of improving ESG performance is higher for them. (3) Enterprises can improve their ESG performance by reducing financing costs, improving investment efficiency, and improving operational efficiency.
The result of this paper links ESG theory and practice together and provides suggestions for ESG theory to guide the operations of companies in China. By understanding the relationship between ESG performance and corporate resilience, companies can make more informed decisions on how to allocate their resources to improve their overall performance and sustainability. In addition, investors can use this information to make more informed investment decisions, leading to a more efficient allocation of capital in the market.
The remainder of this paper is organized as follows:
Section 2 reviews related work and presents theoretical hypotheses,
Section 3 describes the data and methodology of this study, and
Section 4 presents the empirical findings. Finally,
Section 5 discusses the theoretical and practical implications of our research, and
Section 6 summarizes this study.
2. Related Literature and Hypotheses
2.1. Literature Review
2.1.1. Economic Effects of ESG
With the increasing global and domestic focus on ESG investment, scholars have approached the measurement of ESG performance from different perspectives. They have found that the relationship between ESG performance and related economic effects can be classified into three types: positive, negative, and non-linear relationships.
Many scholars have concluded that ESG disclosure has a positive impact on firm value [
7]. Wang [
8] argued that ESG disclosure provides additional market information, thereby increasing firm value. Similarly, Ali [
9] reached a comparable conclusion: that ESG-performing companies increase firm value. Serafeim [
10] claimed that ESG-performing companies increase investor confidence, which motivates them to invest more capital and drive-up stock prices, resulting in excess returns. Najah [
16], using MSCI ESG ratings, found that companies with superior social performance have lower default rates and higher credit ratings. Jang [
17], using KCGS ESG data in the South Korean context, found that non-financial information included in ESG ratings can complement credit ratings. In addition, a company’s ESG score reduces its cost of debt financing, with this effect being more pronounced for smaller companies. Al Amosh [
18] found that the pandemic had a significant negative impact on financial performance, which was limited by ESG performance. During the pandemic, companies committed to ESG practices experienced minimal impact.
However, despite numerous studies indicating a positive relationship between corporate ESG and financial performance, some scholars have found a negative relationship between corporate ESG performance and firm value. Meng [
19] argued that firms’ ESG disclosure behavior increases costs and consumes resources, leading to a decrease in firm value. Chen [
20] also argued that mandatory disclosure of corporate social responsibility (CSR) not only reduces performance, but also increases the cost of social responsibility. Manchiraju [
21] showed a significant negative relationship between CSR and shareholder value. Tian [
22] found that sacrificing corporate interest is the cost of meeting environmental performance, hence the negative correlation between the two. Qin [
23] and Zhan [
24] concluded that improving a company’s environmental performance increases the associated costs and shows a negative correlation with financial performance.
Some studies have shown that there is not a simple linear relationship between corporate ESG performance and financial performance. Regarding corporate ESG disclosure, Atan [
25] argued that it has no impact on firm value. Wang [
9] suggested that there is a “threshold effect” of ESG performance on firm value, meaning that ESG performance must reach a certain threshold to have a positive impact on firm value. Barnett [
26] analyzed that there is a certain curvilinear relationship between ESG performance and return on assets. Ananzeh [
27] found that the quality of corporate social responsibility disclosure (CSRD) can be negatively affected by ownership concentration.
In addition, some scholars have separately discussed the economic consequences of the three dimensions of ESG performance. Kong [
28] believed that environmental and social performance affect firm value, but governance performance does not. Li [
29] found that environmental factors are the most important factor in China’s green finance investment decisions, followed by governance and social factors.
2.1.2. The Definition and Measurement of Corporate Resilience
The original concept of “resilience” originated in the field of ecology, describing the ability of ecosystems to maintain balance and stability in the face of external stresses [
30]. Today, “resilience” has been widely applied and has attracted considerable interest in various disciplines, such as psychology, sociology, and management. Tsiapa [
31] defined resilience as the ability of complex systems to survive, adapt, evolve, and thrive in the face of uncertainty and change. Wildavsky [
32] was the first to apply the concept of resilience at the corporate level, arguing that corporate resilience can help a company address the opportunities and challenges presented by environmental uncertainty, thereby enabling it to transform crisis into security and capitalize on opportunities. Roundy [
33] found that corporate resilience refers to a company’s ability to recover from shocks and adapt to disruptions.
Considering the complex, path-dependent, and multifaceted nature of corporate resilience, direct observation and measurement can often be challenging. As a result, existing research has mainly relied on indirect methods to approximate corporate resilience, which can be broadly categorized into two approaches. The first approach utilizes readily available indicators as proxies for corporate resilience, such as financial performance, financial volatility, growth, and employment [
34,
35]. Markman [
36] employed the standard deviation of industry-specific corporate stock returns as a proxy for resilience. Similarly, Yang [
37] and Hu [
38] used average stock returns and stock price volatility as measures of corporate resilience. The second approach is to develop a comprehensive framework. For example, Wang [
39] developed a context-specific assessment tool for Chinese firms that included factors such as resilience commitment, situational awareness, and planning proficiency. Zhu [
40] evaluated corporate resilience across five dimensions: anticipation, learning, adaptation, recovery, and response.
Current research on corporate resilience has mainly focused on the relationship between corporate attributes and their ability to recover from adverse situations. Joana proposed that the resilience of small- and medium-sized enterprises (SMEs) can be measured by their level of internal control [
41]. Similarly, Carmeli [
42] also emphasized that a robust management framework and strategic expertise can enhance corporate resilience. Ding [
43] further explored various aspects of corporate resilience, including financial strength, ownership structure, and corporate governance. This study found that companies with sound financial positions (i.e., higher cash flow, lower debt, and higher profits) have greater resilience compared to others. Hu [
38] employed stock price volatility as a resilience indicator to examine the relationship between investor protection systems and corporate resilience.
2.1.3. ESG Performance and Corporate Resilience
Currently, there is a lack of comprehensive studies that examine the impact of ESG performance on corporate resilience. While scholars have primarily approached this issue by treating CSR as a research variable, it is important to note that ESG is a more comprehensive concept [
44]. The ESG concept considers the three critical aspects of environmental, social, and governance issues that arise during the company’s operations and development process. Conversely, the CSR concept focuses on issues that demonstrate a company’s social responsibility. Therefore, this paper focuses on the influence of ESG performance on corporate resilience to fill the research gap in this area.
Some scholars have argued that ESG/CSR performance can indeed enhance corporate resilience. First, it has the potential to improve corporate resilience by reducing information asymmetry, alleviating underinvestment, and improving financing efficiency [
11,
12,
13]. Second, robust ESG/CSR performance can reduce agency costs, reduce agency conflicts between shareholders and managers, reduce overinvestment, and ultimately, enhance corporate resilience [
45,
46].
However, other studies have suggested that ESG/CSR performance may actually reduce corporate resilience. If corporate social responsibility is externally focused, managers may use resources to artificially enhance it, which could undermine corporate value and resilience [
14]. In addition, in an effort to improve ESG/CSR performance, companies may overinvest in corporate resources and social responsibility, reducing investment efficiency and, thus, reducing corporate resilience [
15].
2.2. Research Hypotheses
2.2.1. The Enhancing Effect of ESG on Corporate Resilience
Stakeholder theory and resource dependence theory suggest that a firm’s environmental and social responsibility sends a signal to the external environment that the firm is trustworthy [
11,
12]. This, in turn, reduces information asymmetry and transaction costs with stakeholders, ultimately increasing the firm’s value-creation efficiency [
47]. In addition, taking a proactive approach to environmental and social responsibility can help firms gain access to critical strategic resources owned by stakeholders [
48]. This can strengthen their competitive advantage and promote sustainable development [
49]. Corporate resilience, a unique organizational capability, emphasizes a firm’s ability to anticipate, mitigate, and respond to disruptions from both internal and external environments [
50]. Specifically, it involves bouncing back and thriving in the face of adversity [
51]. Existing research suggests that active social responsibility has a significant impact on enhancing corporate resilience [
13,
45,
46].
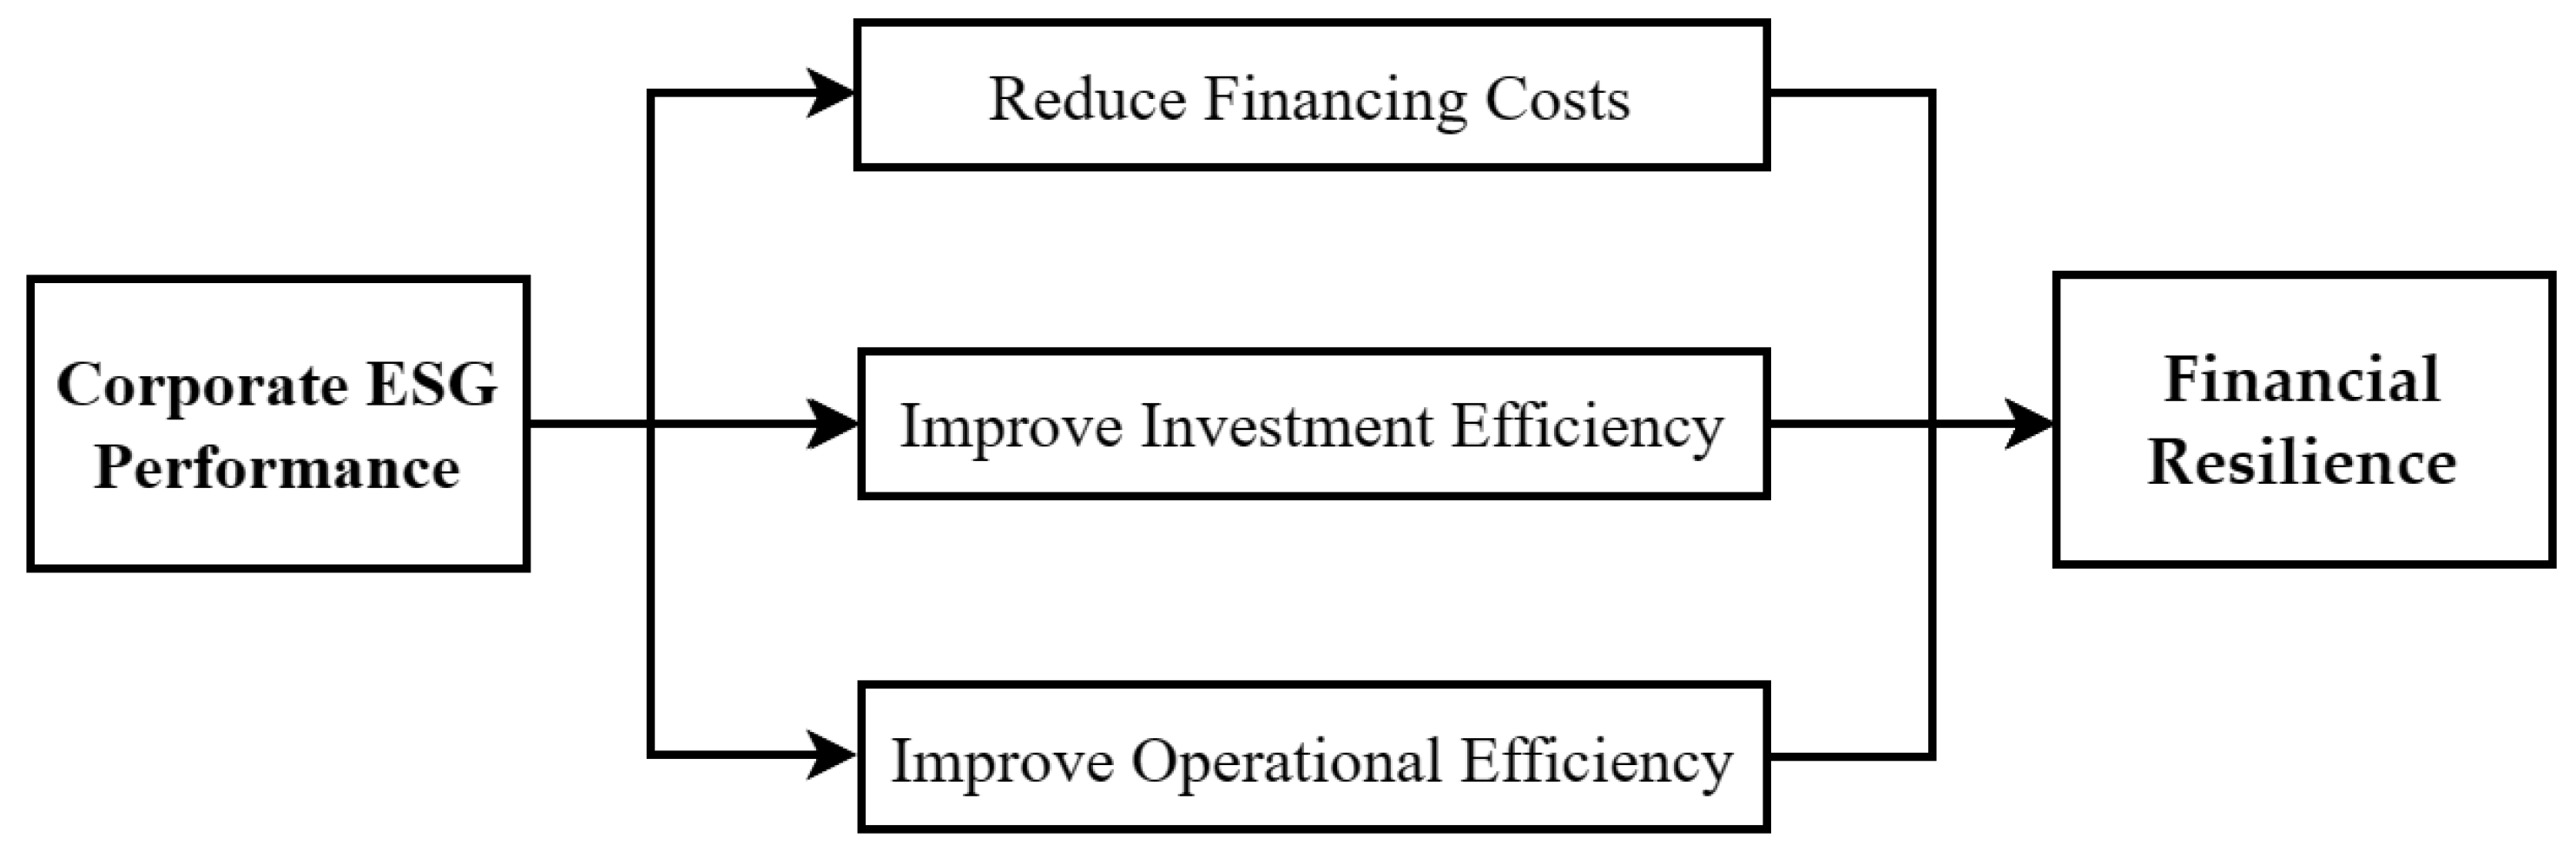
From a capital allocation efficiency perspective, investment efficiency [
52], financing costs [
53], and operational efficiency [
54] are critical determinants. They can help firms to better exploit external investment opportunities, respond effectively to uncertainty shocks, and recover quickly. Drawing on resource dependence theory and stakeholder theory, this paper examines the influence of environmental, social, and governance (ESG) performance on corporate resilience from the perspective of capital allocation efficiency. Specifically, it examines three mechanisms: reducing financing costs, improving investment efficiency, and improving operational efficiency, which can be seen in
Figure 2.
Therefore, we formulated Hypothesis 1 regarding the relationship between ESG performance and corporate resilience:
H1. A corporation’s positive ESG performance enhances its resilience.
2.2.2. The Financing Cost Reduction Effect of ESG
According to stakeholder theory, companies are founded on the pursuit of specific goals, which serve as the basis for stakeholder cooperation [
47]. The existence of shared goals motivates stakeholders to participate in the firm’s value-creation process [
55,
56]. Companies are accountable not only to investors and creditors, but also to other, non-financial stakeholders. If the outcomes of value creation do not align with the interests of all stakeholders, companies risk losing business partners, resources, and customers [
57]. Therefore, to achieve the common goal of sustainable development, companies should adopt ESG strategies to create value for multiple stakeholders, foster stakeholder cooperation, and secure financing and other support.
Signaling theory posits that companies can assert their legitimacy by disclosing information in a way that sends a message to society about their competence and responsibility as citizens [
58]. In addition, companies can foster a competitive advantage by accumulating unique resources through stakeholder support [
59]. Corporate ESG performance reflects the company’s contribution to the well-being of humanity, meets the demands of various stakeholders, encourages stakeholder participation in value creation, and facilitates corporate financing [
60]. In addition, disclosure of superior ESG performance information facilitates the establishment of favorable contractual relationships between the company and its stakeholders, mitigates investors’ information identification risks, and expands the company’s financing opportunities [
61].
Based on the aforementioned theoretical analysis, we formulated Hypothesis 2:
H2. A corporation’s positive ESG performance enhances its resilience by reducing financing costs.
2.2.3. The Investment Efficiency Enhancement Effect of ESG
Resource dependence theory and stakeholder theory suggest that companies’ ESG practices have a positive impact on their future development. Specifically, such practices help companies gain the support of diverse stakeholders and access external resources to improve corporate efficiency [
62]. In addition, ESG performance can influence firms’ investment efficiency in two ways, as outlined below.
First, improving a firm’s ESG performance can reduce agency costs, thereby increasing investment efficiency [
63]. On the one hand, companies with excellent ESG performance tend to have more robust governance mechanisms that effectively monitor and constrain management behavior, thereby mitigating agency problems [
64,
65]. Second, superior ESG performance exposes companies to greater external scrutiny. It can align their investment decisions more closely with their long-term strategic objectives, complies with relevant policies and regulations, minimizes investment risks, and promotes scientific and efficient investment decisions [
66]. As a result, even if a company has ample free cash flow, management will not allocate funds to projects with negative net present value for personal gain, thereby reducing inefficient investments.
Second, improving ESG performance can ease financing constraints and thereby improve the investment efficiency of companies [
63]. Specifically, on the one hand, a company’s ESG performance can provide creditors with more information about the company’s characteristics. As a form of non-financial information disclosure, ESG can help reduce information asymmetry, thereby facilitating the firm’s access to support from banks and other financial institutions [
67]. On the other hand, in order to secure external financial support, such as government grants, and to alleviate financing constraints, companies will improve their ESG performance to meet the expectations of stakeholders, such as governments and regulators. Particularly for industries with high environmental impacts, regulatory approval of refinancing applications emphasizes corporate social responsibility disclosure [
68].
Based on the aforementioned theoretical analysis, we formulated Hypothesis 3:
H3. A corporation’s positive ESG performance enhances its resilience by improving investment efficiency.
2.2.4. The Operational Efficiency Enhancement Effect of ESG
Companies with excellent ESG performance benefit from superior human capital, management skills, and technology levels that enhance operational efficiency. First, a company’s ESG level has a significant impact on their operational efficiency [
69]. Improving ESG performance enables companies to attract better human capital [
70]. Better treatment of employees and a conducive work environment will motivate employees and increase their identification with the company. Second, companies with high ESG standards have stronger management capabilities. Better corporate governance mitigates agency problems by encouraging managers to be more diligent and responsible [
71,
72]. Finally, ESG itself requires companies to adopt greener, safer, and more advanced processes and procedures. Thus, improving ESG performance prompts companies to upgrade their technology. In addition, superior ESG performance provides market, capital, and talent support for companies’ technological innovation, increases demand for high-end products, alleviates financing constraints, and raises the level of human capital [
73].
Based on the aforementioned theoretical analysis, we formulated Hypothesis 4:
H4. A corporation’s positive ESG performance enhances its resilience by improving operational efficiency.
3. Data and Methodology
3.1. Model Setting and Variable Selection
As mentioned above, efficient capital allocation enables companies to consistently generate cash inflows, increase their value, and establish a safety net to swiftly recover amid external uncertainties. In this way, capital allocation efficiency serves as an indicator of corporate resilience, whereby higher efficiency results in stronger corporate resilience. One key measure of a corporation’s capital allocation efficiency is its ability to adjust investment levels in response to changes in investment opportunities. This flexibility enables a company to meet diverse investment opportunities. The corporation’s investment level for a given period can, therefore, intuitively indicate its level of corporate resilience [
34,
38,
74].
To test the impact of ESG performance on corporate resilience, the following regression model (1) was set up based on past literature [
20,
75]:
where
Inv is the level of corporate investment,
Esg is the ESG performance of the corporation, and
X is a set of control variables. The specific variables are defined below.
3.2. Explained Variables
According to relevant research [
74,
76], the investment level of the enterprise in the current period was selected to measure the capital allocation efficiency of the enterprise. The indexes of the enterprise investment level were constructed as follows:
Inv = (Net cash paid for construction of fixed assets, intangible assets, and other long-lived assets + net cash paid for acquisition of subsidiaries and other business units − net cash recovered from disposal of fixed assets, intangible assets, and other long-lived assets − net cash received from disposal of subsidiaries and other business units + research and development expenses − depreciation of fixed assets, depletion of oil and gas assets, and depreciation of productive biological assets − amortization of intangible assets − amortization of long-term amortized expenses)/average total assets at the beginning and end of the year
Several investment variables were constructed for multiple testing in the robustness analysis section.
3.3. Core Explanatory Variables
The emergence of ESG investment concepts has led to the development of various ESG rating systems by companies such as MSCI, Dow Jones, FTSE Russell, and other professional data firms. These ESG rating systems differ in terms of coverage, reference indexes, and evaluation criteria. Domestically, ESG development started late, so there are relatively few third-party organizations that have established a more comprehensive ESG rating system. The mainstream ones include the ESG rating system of Zhongcheng Green Gold, the ESG rating of Huazhuang, and the ESG rating of the Business Road Ronggreen.
To ensure data availability, this study used the CSI ESG rating score to measure the ESG performance of companies. For robustness testing, the Business Way Rong Green ESG ratings were employed. The CSI ESG rating indicators range from AAA to C, with corresponding values assigned from 9 to 1. The CSI ESG ratings are assigned to listed companies on a quarterly basis, and this study took the average of the four quarterly ratings throughout the year as the ESG performance score. Higher scores indicate better corporate ESG performance. Specifically, in the index system of the CSI ESG Rating, the three primary indicators of environment, society, and corporate governance are considered first. These indicators are then subdivided into secondary indicators and more specific tertiary indicators to comprehensively and accurately evaluate the ESG performance of enterprises.
3.4. Control Variables
In order to minimize the interference of omitted variables and other issues, this paper introduces a series of control variables that may affect corporate resilience, i.e., the efficiency of capital allocation. These control variables are mainly categorized into financial factors and corporate governance factors. Referring to the studies of Gao [
71], Hao [
77], and Wang Linlin [
78], this paper selected the following control variables: corporate size (
Size), asset–liability ratio (
Lev), enterprise growth (
Gr), operating cash flow (
Cf), asset tangibility (
Tang), profitability (
ROE), board independence (
Indep), board size (
Board), equity nature (
Soe), industry in which the enterprise is located (
Ind), human resources level (
Md), enterprise management ability (
Sgf), technical level (
Rd), price-to-book ratio (
PB), labor factor quality (
Labor), human capital input (
Cap), ownership concentration (
Top10), separation of two positions (
Dep), and party organization governance (
Party).
3.5. Mediating Variables
In order to explore the specific influence mechanism of ESG on corporate resilience, this paper replaced the explanatory variables in the model (1) with the corresponding mediating variables and directly tested whether ESG can have an impact on these mediating variables, which can more accurately test the influence mechanism of ESG on corporate resilience.
3.5.1. Financing Costs (Finance)
In order to test Hypothesis 2, this paper replaced the explanatory variable in model (1) with corporate financing cost and referred to the study of Chen [
79] to categorize the financing costs into equity financing costs and debt financing costs in order to examine the relationship between corporate financing costs and ESG more comprehensively. The model was set up as follows:
where
Finance is the financing variable, which is examined in terms of equity and debt financing, respectively.
Cost of equity financing (
COE) is the rate of return paid by a corporation to equity investors. Currently, the measurement of cost of equity financing is categorized into ex-ante and ex-post. We adopted the PEG model of the ex-ante cost of equity capital to calculate
COE as the explanatory variable of this paper, because the ex-ante cost of capital is based on the expected financial data and the current stock price to calculate the expected rate of return, which is more in line with the definition of the cost of equity capital [
80]. The specific calculation model is:
where
COE is the cost of equity financing,
EPS1 is the expected earnings per share at the end of the next period,
EPS0 is the current period-end earnings per share, and
P0 is the closing price of the stock at the end of the current period.
As a method of calculating the cost of corporate debt financing, the cost of debt financing (
COD) is very complicated, and indicators such as the ratio of finance costs and average interest-bearing liabilities, the ratio of finance costs and long- and short-term debt, and the total loan ratio are usually used as proxy variables. In order to accurately calculate the cost of corporate debt financing, this paper referred to the research results of previous scholars [
81] and chose the ratio of financial expenses and average interest-bearing liabilities (
COD) as a proxy variable.
3.5.2. Level of Inefficient Investment (Misinv)
To test Hypothesis 3, the explanatory variable in model (1) was replaced with the level of corporate inefficient investment, which can more accurately assess the impact of corporate ESG performance on corporate investment efficiency. The model was set up as follows:
where
Misinv denotes the corporation’s level of inefficient investment, which is negatively related to its investment efficiency, i.e., the higher the level of inefficient investment, the lower the investment efficiency.
In this paper, we referred to the studies of Dai [
82] to measure the level of corporate inefficient investment through the absolute value of the regression residuals of model (5):
Among them, Inv is the investment level of enterprises, i.e., the explanatory variables of this paper, Gr is the growth rate of operating income, and the absolute value of the residual value, vi,t, of model (5) is used to measure the inefficient investment level of enterprises, Misinv. The level of inefficient investment is further divided into overinvestment (Overinv) and underinvestment (Uninv). When the residual value of model (5) is greater than zero, the residual value indicates Overinv; that is, there is overinvestment in the enterprise. When the residual value of model (5) is less than zero, the residual value indicates Uninv; that is, there is underinvestment in the enterprise.
3.5.3. Operational Efficiency (Tfp)
To test Hypothesis 4, the explanatory variable in model (1) was replaced with the total factor productivity of the corporation, which can more accurately assess the impact of the corporation’s ESG performance on its operating efficiency. The model was set up as follows:
where
Tfp is the total factor productivity of the corporation; the higher the value, the more efficiently the corporation is operating.
The productivity of an enterprise can be measured by total factor productivity, which is an indicator of the efficiency of resource allocation. Enterprises can improve total factor productivity by increasing human capital, improving the management level, and realizing the progress of production technology. This paper referred to the Levinsohn–Petrin (LP) method proposed by Lu [
83] to calculate the total factor productivity of enterprises. The specific process is outlined below.
First, we set the production function as the C-D production function. Compared with the transcendental logarithmic function, the C-D production function is more intuitive to reflect the relationship between inputs and outputs and is widely used in the process of calculating productivity due to its simple structure and ease of use. Therefore, the C-D production function was set in the form of:
where
Yit is total output,
Lit is labor input,
Kit is capital input,
Ait is total factor productivity,
i denotes the ith sample corporation, and
t denotes time. Taking the logarithmic transformation of Equation (7) in a linear form yields:
Considering that the effect of the unobserved portion of the residual term on factor input choices may lead to biased regression results, we needed to split
. In addition, with the idea of the LP semiparametric approach, we introduced the intermediate input variable,
M, as a proxy variable and deformed to obtain:
where
is the part of residual
that can be observed and has an impact on the factor selection of the enterprise in the current period, and
is the unobservable part, the true residual term.
According to the definition of total factor productivity (
Tfp):
The absolute level value of
Tfp can be obtained as:
3.6. Data Sources and Sample Selection
In this study, China’s A-share listed companies from 2011 to 2021 were selected as the research object, and the financial data of these companies were obtained from the Wind and CSMAR databases. To ensure the accuracy of the study, the initial samples were processed as follows before the study was conducted:
Excluding samples from the financial and real estate industries.
Eliminating samples in special treatment status.
Removing samples that have been delisted.
Excluding samples with abnormal data, specifically those with gearing ratios greater than 1.
Deleting samples with missing key variables.
In addition, to avoid the influence of extreme values, all continuous variables in this study were winsorized at the 1% level before and after the analysis. After processing the initial sample, a total of 31,648 data points from 4436 listed companies were obtained.
3.7. Descriptive Statistical Results
The variables in the model were first analyzed with descriptive statistics, and the results are shown in
Table 1.
Regarding the dependent variable, the average value of the enterprise investment level (Inv) is 0.044, with a standard deviation of 0.067. The maximum value is 0.296, and the minimum value is −0.105, indicating significant variation in investment levels among different enterprises.
Regarding the independent variable, the mean ESG score of enterprises is 3.975, with a standard deviation of 1.26. The maximum value is 6, and the minimum value is 0, demonstrating significant differences in ESG scores among companies; that is, there are substantial disparities in the level of ESG governance among various firms.
Regarding the control variables, the average value of company size (Size) is 12.89, with a standard deviation of 1.313. The maximum value is 19.43, and the minimum value is 5.731, indicating a broad range of company sizes in the sample. The average asset–liability ratio (Lev) is 0.348, with a standard deviation of 0.242. The maximum value is 0.999, and the minimum value is −0.195, demonstrating significant differences in leverage levels among companies. The average growth rate (Gr) is 4.694, with a standard deviation of 757. The maximum value is 134,607, and the minimum value is −2.733, indicating substantial variations in growth among enterprises. The average operating cash flow (Cf) is 0.072, with a standard deviation of 3.002. The maximum value is 516.9, and the minimum value is −98.86, suggesting significant differences in the proportion of net cash flow generated by operating activities among companies relative to total assets at the beginning of the period.
The average board size (Board) is 8.523, with a standard deviation of 1.682. The maximum value is 18, and the minimum value is 0, indicating significant variations in the number of board members among companies. The average price-to-book ratio (PB) is 5.132, with a standard deviation of 42.60. The maximum value is 4113, and the minimum value is −18.54, demonstrating substantial differences in the ratio of total market value to owners’ equity among enterprises. The average human capital investment (Cap) is 92.78, with a standard deviation of 2962. The maximum value is 404,408, and the minimum value is 0, indicating significant disparities in investments in human capital among companies.
The selected sample also exhibits substantial variations in management ability (Sgf) and technological level (Rd). Additionally, there are certain disparities among companies in terms of asset tangibility (Tang), profitability (ROE), board independence (Indep), human resource level (Md), labor factor quality (Labor), ownership concentration (Top10), and party organization governance (Party), but these differences are relatively small.
4. Empirical Results
4.1. Basic Regression Results
After the Hausman test, it was found that the fixed-effects model should be used for regression analysis in this paper. The baseline regression results are shown in
Table 2.
In column (1), the analysis was conducted without considering other control variables, revealing a positive and statistically significant correlation between corporate ESG performance and investment level at the 1% significance level. Nonetheless, considering that there is only one explanatory variable, namely corporate ESG performance, the model fit was relatively weak, with an adjusted R-squared value of 0.018. To enhance the model’s fit and improve the R-squared value, it is essential to incorporate additional control variables.
In column (2), a series of control variables were introduced, resulting in an improved model fit. The adjusted R-squared value increased to 0.085, indicating a better fit. The benchmark regression results show that, when controlling for other variables, corporate ESG performance remains positively and significantly related to the level of corporate investment at the 1% significance level. The coefficient of corporate ESG performance is 0.008, suggesting that, as the level of corporate ESG performance improves, so does the sensitivity of corporations to investment opportunities. In other words, enterprises with better ESG performance tend to increase investment and promptly expand the investment scale when presented with favorable investment opportunities. Conversely, they can adjust their production and operation arrangements flexibly and reduce investment expenditures to prevent overcapacity or inefficient investment behaviors when faced with unfavorable investment opportunities. This is consistent with the conclusion of Wang [
8] and Serafeim [
10] that good ESG performance can effectively reduce information asymmetry. Consequently, this enhances the efficiency of capital allocation. These findings support Hypothesis 1 proposed in
Section 2, which posits that positive ESG performance can enhance corporate resilience.
4.2. Heterogeneity Analysis
Considering the potential variations in the influence of ESG performance on investment levels across enterprises of distinct natures and industries, this study categorized the chosen sample enterprises based on their property rights and SEC industry classifications. Specifically, the enterprises were divided into state-owned and non-state-owned enterprises based on the nature of their property rights, and into manufacturing and non-manufacturing enterprises based on their SEC industry classifications. The specific grouping regression results are shown in
Table 3.
4.2.1. Impact of the Nature of Corporate Property Rights
From the subgroups’ regression results, the ESG performance of sample enterprises in both state-owned and non-state-owned groups is positively correlated with the level of corporate investment, and both are significant at the 1% significance level, but the correlation coefficient of the state-owned group is 0.004, while the correlation coefficient of the non-state-owned group is 0.009. After the comparison of the two groups, it was found that, compared to the state-owned enterprises, the improvement of the ESG performance of non-state-owned enterprises has a greater effect on the capital allocation efficiency, i.e., corporate resilience.
First, the nature of a corporation’s property rights has a significant impact on its motivation for ESG performance. As market participants and state interveners, state-owned enterprises (SOEs) have a dual identity, and their business process is not only influenced by the market, but also bears the responsibility brought by administrative tasks. Therefore, when practicing ESG, the primary consideration of SOEs is not economic returns, but policy factors and social impact. Comparatively speaking, non-state-owned enterprises are more market-oriented in their business behaviors and will seek to improve their ESG performance in order to obtain higher economic returns. Therefore, there are differences in the focus of ESG practices between SOEs and non-SOEs. SOEs engage in ESG practices more to respond to the call of relevant national policies and to set an example for other non-SOEs. In contrast, according to the stakeholder theory, non-SOEs are more focused on meeting the needs of stakeholders who can bring them higher economic returns. This motivation and focus on ESG practices leads to a better effect on corporate resilience when non-SOEs increase their investment in ESG.
Second, the nature of an enterprise’s ownership will have an impact on its effectiveness in obtaining support from stakeholders, such as governments and financial institutions, through ESG practices. State-owned enterprises have stronger political attributes, and it is relatively easy for them to obtain support from institutions such as the governments and state-owned banks. Non-state-owned enterprises, on the other hand, need to strengthen their ESG practices in exchange for support from institutions, such as governments and banks. In addition, many small- and medium-sized NSOEs typically face a higher degree of financing constraints. Therefore, if NSOEs focus on improving their ESG performance, they will be more likely to attract the attention of investors and improve their reputation, thus facilitating access to external resources. Compared to accessing relevant resources, such as the government and state-owned banks, SOEs have a lower marginal effect in enhancing ESG, whereas non-SOEs can obtain support from relevant resources, such as the government and financial institutions, by enhancing their ESG performance, and the marginal effect of such support is relatively higher.
Finally, enterprises with different property rights face different levels of stakeholder expectations for their ESG performance. SOEs face higher social expectations and public pressure in this regard, as the Third Plenary Session of the 18th CPC Central Committee explicitly stated that assuming social responsibility is one of the important elements in promoting the deepening reform of SOEs. In contrast, expectations regarding non-SOEs’ ESG performance are relatively low. Stakeholder theory suggests that SOEs should fulfill their social responsibilities, which has become a mandatory task, leading to a lower degree of market reaction to improved ESG performance of SOEs.
4.2.2. Impact of Industry on ESG Resilience Effects
From the group regression results, there is a positive correlation between the ESG performance of the sample enterprises in both the manufacturing and non-manufacturing groups and the level of corporate investment, and it is significant at the 1% significance level, but the correlation coefficient of the manufacturing group is 0.008, while the correlation coefficient of the non-manufacturing group is 0.006. After the comparison between the sample enterprises in the manufacturing group and non-manufacturing group, it was found that, compared to the non-manufacturing enterprises, the manufacturing corporations’ improved ESG performance has a greater effect on the enhancement of corporate capital allocation efficiency, i.e., corporate resilience.
For manufacturing industries, actively promoting green technology innovation and reducing carbon emissions are inevitable trends. This helps to enhance corporate resilience. Conversely, companies that neglect environmental protection, even with good financial performance, may face shutdowns due to government environmental regulations. This has a negative impact on corporate and investor interests. As a result, investors tend to prefer green companies. Green companies actively engage in ESG management and improve their ESG performance. This action demonstrates their commitment to green transformation, attracts investment, and improves their resilience. For non-manufacturing companies, the pressure for green transition is relatively low, resulting in less enthusiasm for improving ESG performance and less sensitivity of resilience to ESG performance.
4.3. Robustness Test
4.3.1. Substitution of Explained Variables
Referring to the existing literature on corporate investment [
76], this paper constructed the following five investment variables to replace the explained variables in the benchmark regression, specifically:
Inv1 = (Cash paid for acquisition and construction of fixed assets, intangible assets, and other long-term assets)/average total assets at the beginning and end of the year.
Inv2 = (Cash paid for acquisition of property, plant, and equipment, intangible assets, and other long-term assets + net cash paid for acquisition of subsidiaries and other business units)/average total assets at the beginning and end of the year.
Inv3 = (Cash paid for acquisition of fixed assets, intangible assets, and other long-term assets − net cash recovered from disposal of fixed assets, intangible assets, and other long-term assets)/average total assets at the beginning and end of the year.
Inv4 = (Cash paid for acquisition and construction of fixed assets, intangible assets, and other long-term assets + net cash paid for acquisition of subsidiaries and other business units – net cash recovered from disposal of fixed assets, intangible assets, and other long-term assets – net cash received from disposal of subsidiaries and other business units)/average total assets at the beginning and end of the year.
Inv5 = R&D expenditures/average total assets at the beginning and end of the year.
The results of the robustness test after replacing the explained variables are shown in
Table 4, which shows that the corporation’s ESG level is still positively correlated with the level of investment after replacement, and all of them are significant at the 1% level of significance, so the results of this paper can be verified to be robust.
4.3.2. Endogeneity Test
Lag Variable Test
According to the results of the current study, the increase in the level of corporate ESG will significantly promote the increase in the level of corporate investment, but, in turn, the increase in the level of corporate investment will also promote the increase in the level of corporate ESG, and there is a mutual causality problem between the two. Therefore, this paper lagged the explanatory variable
HZESG by one period to examine the relationship between the level of ESG (
HZESG1) and the level of corporate investment, to mitigate the mutual causality brought about by the endogeneity problem. The regression results are shown in
Table 5.
In this paper, correlation regression analyses were conducted for both not controlling for other variables and controlling for other variables. The results are presented in columns (1) and (2) of
Table 5. It is worth noting that
HZESG1 is positively correlated with the investment level and is significant at the 1% significance level, which is consistent with the underlying regression results. This indicates that corporate ESG performance has a significant impact on the corporate investment level. At the same time, in order to reduce the impact of external disturbances, this paper lagged all control variables by one period and conducted the relevant regression analysis. The results are shown in column (3) of
Table 5. It is worth noting that
HZESG1 is still positively related to the level of investment and is significant at the 1% significance level, indicating that the findings of this paper are robust.
Different Measures of Firm Size
The perceived importance of firm size as a fundamental characteristic has been well documented [
84]. In this section, we aim to investigate the robustness of our empirical findings with respect to different measures of firm size. Building on the research of Seth [
85], Dang [
84], and Lindemanis [
86], we adopted the natural logarithm of a firm’s operating revenue (
lnSize2) and the natural logarithm of its market value (
lnSize3) as our method of assessing firm size. This replaces the previous use of the natural logarithm of total assets to calculate firm size. As shown in
Table 6, the coefficient of ESG performance remains significantly positive, indicating the robustness of our findings and their insensitivity to different methods of measuring firm size.
Sample Selection Bias Test
Since the sample selected in this paper is only China’s A-share listed companies, and the ESG level of listed companies may be higher than that of unlisted companies, this paper used the Heckman two-stage model to correct for sample selection bias. To address potential sample selection bias, we introduced a new dummy variable, HZESG_dum. This variable was assigned a value of 1 for the top 25% of enterprises sorted by their HZESG score, and 0 for the remainder.
To calculate the inverse Mills ratio (IMR) of sample selection bias, we selected a set of explanatory variables from the existing literature: firm size (Size), asset–liability ratio (Lev), firm growth (Gr), operating cash flow (Cf), asset tangibility (Tang), and human capital input (Cap). We then conducted regression analysis to estimate the IMR.
The second stage of regression involves the estimation of the inverse Mills ratio (
IMR), which is calculated as follows:
Table 7 presents the regression results of the initial stage, revealing a significant positive correlation between firm size (
Size) and firm ESG performance. Conversely, there is a significant negative correlation between the asset–liability ratio (
Lev), firm growth (
Gr), operating cash flow (
Cf), and asset tangibility (
Tang) and firm ESG performance.
Moving forward, the inverse Mills ratio (
IMR), computed during the first stage, was integrated into the regression model along with other control variables. The regression analysis of the investment level (
Inv) was then executed. The regression results are summarized in
Table 8.
The preceding regression results indicated that the coefficient of the inverse Mills ratio (IMR) is not zero, suggesting the presence of sample selection bias in the data selection process. Therefore, it was appropriate to employ the Heckman two-stage regression model to rectify this issue. The revised results revealed a significant positive correlation between enterprise ESG performance and the investment level (i.e., corporate resilience), aligning with the benchmark regression outcomes. This consistency implies that the regression analysis results in this paper are robust.
4.4. Mediation Effect Test
To examine the impact of corporate ESG on the total factor productivity level, this study employed stepwise regression to assess the mediating role of each mediating variable. As per the analysis conducted in
Section 3, a corporation’s ESG performance may influence corporate resilience through three primary channels: reducing finance costs, enhancing investment efficiency, and improving operational efficiency. This section delves into the mediation effects of these three channels to determine whether each influence path exhibits a significant mediating effect.
4.4.1. ESG Financing Cost-Reduction Effect
Table 9 shows the results of the impact mechanism test, with the cost of equity financing (
COE) and cost of debt financing (
COD) as mediating variables. Columns (2) and (4) show that corporate ESG performance is negatively correlated with both the cost of equity financing (
COE) and the cost of debt financing (
COD), and the correlation coefficients are significant at the 1% significance level, which are −0.005 and −0.028, respectively, suggesting that the improvement of corporate performance in terms of ESG can significantly reduce a corporation’s cost of equity financing and cost of debt financing.
Columns (3) and (5) are the regression results of adding both the cost of corporate financing and the level of corporate investment, i.e., corporate resilience, into the model. From column (3), it can be seen that, after adding the mediator variable, corporate cost of equity financing (COE), the explanatory variable, corporate ESG performance, is positively correlated with the investment level of the enterprise at the 1% significance level, and the mediator variable, corporate cost of equity financing (COE), is negatively correlated with the investment level of the enterprise at the 1% significance level, indicating that the mediating effect of corporate cost of equity financing on the investment level of enterprises, i.e., the corporation’s resilience, is significant. That is, corporate cost of equity financing has a significant impact on the corporate investment level, i.e., corporate resilience. The mediating effect of the cost of equity financing on the investment level of the enterprise, i.e., corporate resilience, is significant, meaning that enterprises can significantly reduce their cost of equity financing through their own ESG governance and improve their ESG level, which in turn improves their investment level—corporate resilience. From column (5), after adding the intermediary variable, cost of debt financing (COD), the explanatory variable, ESG performance of enterprises, is positively correlated with the investment level of enterprises at the 1% significance level, and it is not significant, which indicates that the intermediary effect of the cost of debt financing of enterprises on the level of enterprise investment, i.e., corporate resilience, is not significant.
The above regression results can validate part of Hypothesis 2 (H2) proposed in
Section 2. Positive corporate ESG performance enhances corporate capital allocation efficiency, that is, corporate resilience, by effectively reducing the cost of equity financing (
COE) for corporations.
4.4.2. ESG’s Investment Efficiency-Enhancing Effect
The level of inefficient investment was categorized into overinvestment (
Overinv) and underinvestment (
Uninv), and
Table 10 shows the results of the test of the impact mechanism with overinvestment (
Overinv) and underinvestment (
Uninv) as the mediating variables.
From column (2), corporate ESG performance is positively correlated with overinvestment (
Overinv) and is significant at the 1% level of significance, with a correlation coefficient of 0.004. This indicates that corporate improvement in ESG performance does not reduce the level of corporate overinvestment but, rather, promotes companies to engage in overinvestment, which is contrary to Hypothesis 3 (H3), proposed in
Section 2 of this paper. This may be because CSR investment helps to enhance corporate reputation, which in turn makes it possible for corporate management to give up investment projects with positive NPV and increase responsible investment in pursuit of higher ESG ratings. Furthermore, in order to satisfy non-shareholder stakeholders, corporate management tends to excessively focus on activities such as environmental protection and social responsibility in order to improve the overall ESG performance. However, in this process, it is possible for management to ignore some profitable investment prospects and invest in projects that are not conducive to the sustainable development of the enterprise, leading to an increase in inefficient investment, which is not conducive to the improvement of the enterprise’s overall investment level and resilience.
From column (4), corporate ESG performance is negatively correlated with underinvestment (Uninv) and is significant at the 1% significance level, with a correlation coefficient of −0.003, which indicates that corporate improved performance in terms of ESG significantly reduces the level of underinvestment in the companies and reduces their inefficient investments.
Column (5) shows the regression results of adding both the level of corporate underinvestment (Uninv) and the level of corporate investment to the model. From column (5), after adding the mediating variable of the corporate underinvestment level (Uninv), the explanatory variable, corporate ESG performance, is positively correlated with the corporation’s investment at the 1% significance level. The mediating variable of the corporate underinvestment level (Uninv) is negatively correlated with the corporation’s investment at the 1% significance level, which shows that the level of underinvestment (Uninv) has a significant mediating effect on the corporate resilience. That is, the enterprise can significantly reduce the level of underinvestment in its inefficient investment through its own ESG governance and improve its own investment level, i.e., corporate resilience.
The above regression results can validate part of Hypothesis 3 (H3), proposed in
Section 2. Positive corporate ESG performance enhances corporate capital allocation efficiency, that is, corporate resilience, by effectively mitigating the level of underinvestment (
Uninv) within the enterprise.
4.4.3. ESG’s Operational Efficiency Enhancement Effect
Table 11 presents the findings of the impact mechanism test, with total factor productivity (
Tfp), i.e., operational efficiency of enterprises, serving as the mediating variable. As indicated in column (2), there is a positive and significant correlation between corporate ESG performance and total factor productivity (
Tfp) at the 1% significance level, with a correlation coefficient of 0.012. This suggests that improved ESG performance can enhance a corporation’s total factor productivity, thereby improving its operational efficiency.
Column (3) displays the regression results obtained by incorporating both the corporation’s total factor productivity (
Tfp) and the investment level, i.e., corporate resilience, into the model. Notably, after adding the mediating variable of total factor productivity (
Tfp), both the explanatory variable of corporate ESG performance and the mediating variable of total factor productivity (
Tfp) maintain a positive and significant correlation with the corporation’s investment level at the 1% significance level. This indicates that the mediating effect of total factor productivity (
Tfp) on the corporation’s investment level, i.e., corporate resilience, is significant. In other words, companies can enhance their ESG level through effective ESG governance, which can foster stronger connections with stakeholders. This not only encourages stakeholders to actively monitor the enterprise and provide valuable feedback on operational issues, but also helps to improve total factor productivity (
Tfp), i.e., operational efficiency. Consequently, this leads to an increase in the corporation’s investment level, i.e., resilience. The aforementioned regression results support Hypothesis 4 (H4), proposed in
Section 2.
5. Discussion
This study provided a novel perspective on the impact of ESG performance on corporate resilience and represents a significant innovation in terms of research methodology and content. Focusing on capital allocation efficiency, we examined the mechanisms through which corporate ESG performance affects resilience. In doing so, we considered the influencing factors of industry heterogeneity and corporate ownership heterogeneity, providing in-depth discussions on the mediating effects of financing costs, investment efficiency, and operational efficiency. This research fills the academic gap in studying the impact of ESG performance on corporate resilience and its mechanisms.
In practical terms, this study provides empirical support for companies to enhance their resilience by improving their ESG performance. It helps companies integrate ESG principles into their strategic decision-making, increase their awareness of social responsibility, and actively promote ESG investment philosophies. This not only provides new ideas for the sustainable development of companies in the future, but also encourages companies to embrace ESG concepts, adapt to the trend of sustainable development, and thus achieve double improvements in economic and social benefits. The analytical results of this study provide an important reference point for corporate management and investment decisions. The study also guides investors to pay more attention to ESG performance, which can reduce investment risks, create long-term value, and make a positive contribution to the sustainable development of society.
However, this study has some shortcomings due to objective limitations.
First, the impact of ESG is long term in nature. This study selected an 11-year research period due to data availability constraints. Many companies with relatively short listing periods have shorter research periods, which cannot fully reflect the long-term impact of ESG. Regarding the lagged treatment of variables, only four periods were lagged in our study. In the future, the research period can be appropriately extended to study the medium- and long-term effects of ESG performance.
Referring to the studies of Borghesi [
87] and Dunbar [
88], it has been observed that corporate managers often engage in socially responsible investment activities. Consequently, the CEO’s characteristics influence corporate decision-making, which in turn affects the corporation’s risk-taking capabilities. Thus, CEO characteristics emerge as crucial variables influencing corporate resilience, an aspect that has not received sufficient attention in our current research. Future studies will explore the impact and underlying mechanisms of CEO characteristics on firm resilience.
In addition, this study examined the impact of corporate ESG performance on corporate resilience from the perspective of capital allocation efficiency and selected the investment level as an indicator to measure corporate resilience. However, corporate resilience is multidimensional and not limited to the perspective of capital allocation efficiency. In the future, we can select more indicators to measure corporate resilience based on their potential, path dependence, and multidimensionality, which will enrich the research on the relationship between ESG performance and corporate resilience.
6. Conclusions
After several years of development, ESG has been increasingly recognized and adopted by investors and used by companies to guide their own social responsibility efforts. In China, as the economy shifts from high-speed development to high-quality development, the concepts of green finance and sustainable development have been fully integrated into the new development paradigm. At present, investigating the relationship between corporate ESG performance and corporate resilience is of great significance in promoting corporate social responsibility in China.
Existing studies mainly focus on examining the influence of individual ESG dimensions on corporate value, while few studies examine the impact of ESG as a comprehensive measure of corporate financial performance. Further, there is a notable lack of research investigating the relationship between corporate ESG performance and corporate resilience. To address this research gap, we adopted an asset allocation perspective and tailored our study to the specific context of China. Using the CSI ESG rating as the primary explanatory variable, we drew on the work of Pan [
76] to construct the level of corporate investment to represent corporate resilience as the dependent variable. Our study focused on 4436 A-share listed companies that received the CSI ESG rating between 2011 and 2021. We used regression analysis to examine the impact of corporate ESG performance on corporate resilience and its underlying mechanisms, with the aim of providing insights to support the sustainable development of companies in China. The main findings of this paper are presented below.
First, a positive ESG performance strengthens corporate resilience. Improving a company’s ESG level increases its sensitivity to investment opportunities. If a company’s ESG performance is commendable, it can make additional investments and expand its investment scope in a more timely manner. On the other hand, when faced with unfavorable investment opportunities, the company can also flexibly adjust its production and operation plans in a timely manner and reduce investment. It can prevent overcapacity or inefficient investment behavior and reduce information asymmetry, thereby improving capital allocation efficiency.
Second, there is heterogeneity in the positive correlation between corporate ESG performance and corporate resilience. The type of corporate ownership and the industry in which it operates exert some influence on this correlation. Due to the stakeholder theory, ESG performance has a more pronounced enhancing effect on the corporate resilience of non-state-owned enterprises (NSOEs), as they prioritize market efficiency and economic gains.
Finally, based on Chen’s research [
79], we divided financing costs into equity financing costs and debt financing costs. Based on the research of Biddle [
52] and Dai [
82], we constructed the level of inefficient investment of enterprises and divided it into two situations: overinvestment and underinvestment. We discussed the path of ESG performance to enhance corporate resilience. Companies can increase their resilience by improving their ESG performance in three ways: reducing financing costs, improving investment efficiency, and improving operational efficiency.
This research suggests that good ESG performance can help enhance corporate resilience and promote sustainable social development. For companies, managers need to pay attention to the role of ESG and improve ESG performance to enhance corporate resilience and competitiveness. For the government and other regulators, ESG-related laws and regulations need to be improved and information disclosure requirements strengthened. In order to ensure the truthfulness and effectiveness of corporate public disclosures and prevent potential risks, relevant laws and regulations need to establish information disclosure standards in a targeted manner. For investors, it is important to pay attention to a company’s financial performance and its ESG performance. The better a company’s ESG performance, the more appropriate its disclosure and the lower its risk. In the long run, these companies have higher investment returns and greater investment value.
In summary, we examined the impact of ESG performance on corporate resilience and its mechanisms, filling the academic gap in related research in this study. We also considered the influencing factors of industry and ownership heterogeneity. The results provide empirical support for companies to enhance their resilience by improving ESG performance. However, due to data and time constraints, the article cannot fully reflect the long-term impact of ESG. At the same time, the influence of CEO characteristics was not fully considered in the construction of the theoretical models, and the measurement of corporate resilience can also be more diversified. These are our future research directions.


