Article

Agriculture and the Bioeconomy: A Socioeconomic Analysis of Central and Eastern European Countries

by
Laura Mariana Cismaș
1,2,
Emilia Mary Bălan
3,4,
Cristina Georgiana Zeldea
5,*,
Marioara Iordan
5 and
Cristian Mihai Cismaș
1,6
1
Faculty of Economics and Business Administration, West University of Timisoara, 300223 Timisoara, Romania
2
East-European Center for Research in Economics and Business, Faculty of Economics and Business Administration, West University of Timisoara, 300223 Timisoara, Romania
3
Institute for World Economy, Romanian Academy, 050711 Bucharest, Romania
4
Institute for Advanced Environmental Research, West University of Timisoara, 300223 Timisoara, Romania
5
Institute for Economic Forecasting, Romanian Academy, 050711 Bucharest, Romania
6
Doctoral School of Economics and Business Administration, West University of Timisoara, 300223 Timisoara, Romania
*
Author to whom correspondence should be addressed.
Sustainability 2023, 15(22), 16082; https://doi.org/10.3390/su152216082
Submission received: 29 October 2023 / Revised: 15 November 2023 / Accepted: 16 November 2023 / Published: 18 November 2023
(This article belongs to the Special Issue Economic Inequality, Regional Disparities and Sustainable Development)

Abstract

:
The bioeconomy is a complex and increasingly relevant field, and agriculture represents an essential sector for its development. The bioeconomy presents an opportunity for sustainable agriculture that is beneficial for the environment and public health, both globally and particularly for nations with centralized agricultural systems, such as the former socialist Central and Eastern European Countries (CEECs). This article takes a novel approach to investigate the bioeconomic indicators in CEECs’ agriculture. It combines the hierarchical grouping method with an index based on socioeconomic indicators specific to the bioeconomy. It aims to find how the selected countries performed in terms of agriculture indicators. The socioeconomic indicator analysis showed that some countries had more linear evolutions than others, while some of them clearly outperformed the average of the region. The cluster analysis divided the countries into three relevant groups. The findings revealed patterns of convergence, but also important differences in the region. These results strengthen the scientific basis for the creation of agricultural bioeconomy strategies and argue for the need of the active engagement of all BIOEAST members in the initiative. We argue that agricultural architectures in Central and Eastern European countries are not just determined by employment circumstances or the extent of agricultural areas, but also by the dynamics of the value of the indicators.

1. Introduction

Research on the bioeconomy is a relatively recent topic in European economics [1]. With the expansion of the European Union (EU)’s policies on environmental protection, the consequences of climate change, the effectiveness of resource reuse, and lowering energy consumption from conventional polluting sources, analyses in this field have intensified recently [2].
Agriculture is one of four economic sectors, together with forestry, fisheries, and aquaculture, that make up the bioeconomy, which scientists believe is entirely organic throughout the production chain, from raw materials to complete goods [3,4,5]. Additionally, according to Capasso and Klitkou [6], forestry, fisheries, aquaculture, and the food, beverage, and tobacco industries are also industries with natural inputs and outputs.
In our study, the expression “bioeconomic agriculture” refers to the agricultural strategy of agricultural units that incorporates the concepts of bioeconomy. The bioeconomy entails the sustainable use of biological resources that are renewable in addition to the transformation of waste streams and these resources into high-value goods, including feed, food, feedstock, and bioenergy. Bioeconomic agriculture refers to methods that maximize the utilization of biological resources in farming, while reducing the negative effects on the environment and fostering sustainable growth. In this context, the expression “bioeconomic agriculture” relates to the use of bioeconomic concepts in Central and Eastern European agriculture. Although scientific literature still lacks a commonly accepted definition of bioeconomic agriculture, this formulation has been used before in several studies on the subject [7,8,9].
Central and Eastern European Countries (CEECs) have a significant amount of potential in the agricultural and forestry land areas required to produce biomass and bioenergy [10]. We selected this particular group of countries because they have several common characteristics. They became EU members in the later waves of expansion, and they have less developed agricultural sectors compared to the older member states. The development of the bioeconomy is correlated with the size of agriculture, which is the primary source of biomass for food and feed, as well as for other bio-based industries [11,12,13]. The EU’s CEEC members are Poland, the Czech Republic, Bulgaria, Latvia, Croatia, Romania, Lithuania, Estonia, Slovakia, Hungary, and Slovenia (Figure 1).
In November 2016, the 11 CEECs launched a common initiative regarding the development of knowledge-based agriculture, aquaculture, and forestry in the bioeconomy (BIOEAST). The initiative aims at developing a road map and a common vision to support the development of national strategies in the field of the bioeconomy, to facilitate relations between national decision makers, in order to achieve a sustainable bioeconomy in the partner states and at the regional level [14]. The CEECs’ governmental initiative facilitates connections with member states to foster joint research and innovation projects [15].
These nations are peculiar in the EU because they are formerly communist states where agriculture was a centralized system based on an intensive workforce and did not benefit from contemporary technological advancements [16]. This research will determine the place of each country among the CEECs from a bioeconomic agriculture standpoint. Additionally, the findings might be used by regional organizations and are useful for decision makers when establishing good practice models to follow when shaping national policies.
To highlight the CEECs’ contribution at the regional level, the research takes a novel approach that simultaneously analyzes bioeconomic indicators in agriculture from two points of view: a cluster analysis and a socioeconomic indicator for bioeconomy (SEIB). Our first aim is to carry out a hierarchical cluster analysis of the socioeconomic indicators in the CEECs’ agriculture. We proceed by calculating the SEIB index for each country, to obtain a more in-depth perspective on the social and economic characteristics of their agriculture.
We set out to answer the following research queries:
(1)
What CEEC has the best socioeconomic performance in terms of agriculture?
(2)
Where does Romania stand among the CEECs?
(3)
What countries present bioeconomic similarities?

2. Materials and Methods

Our sample covers 11 CEECs for the 2008–2020 time frame. We used annual data on turnover, value added at factor cost, and workers in agriculture in each individual country. The choice of variables is based on the work developed by Lasarte-Lopez et al. [17] as well as Ronzon and M’Barek [18]. Additional data regarding the annual evolution of the population were needed for computation. All data were sourced from the Eurostat public database. For bioeconomy-specific indices, all data were taken from the public Eurostat database and the Database of the Joint Research Center of the European Commission (DataM) [19].
The bioeconomy socioeconomics considered by the researchers [6,18] [20,21,22,23] and used in our analysis are the number of workers (V_1: WRKS), turnover (V_2: TO), and value added at factor cost (V_3: VA). The number of workers is a proxy for the effect of job creation on a state’s economic growth [6], and it determines the contribution of labor to the financial dynamics of a sector [24]. The number of workers is also significant because it examines the progression of economic performance by considering worker contributions to turnover and the output of value added at factor cost [25]. One of the relevant indicators used to quantify the bioeconomy and its numerous sectors is turnover [18,25]. Turnover is the entire amount of goods and services supplied by an economic unit, including input costs [26]. In Ronzon and M’Barek’s opinion [18], the value added at factor cost is the total revenue generated by operations after deducting indirect taxes and operating subsidies.
Romania and Poland are the CEE countries that do the best in terms of V_1, with an average of more than 1.5 million agricultural workers. The two nations account for the largest portions of both the EU’s agricultural sector and the overall bioeconomy. The average number of agricultural workers in the other CEECs was less than one million (Table 1).
Additionally, the average percentage of agricultural workers in Poland’s total workers in bioeconomy sectors was 66.3% from 2008 to 2020; it is 83.4% in Romania. As stated by Nowak et al. [26], the low level of bioeconomic development in these countries is caused by the large labor force and the low prevalence of agricultural activities, which are attributed to technologization. Poland and Romania also had the best agricultural bioeconomies in the CEECs in terms of V_2, which shows the predominantly agricultural character of the two countries. The next best performing countries are Hungary and the Czech Republic. Romania and Poland both have the highest percentage of organic farms among the CEECs, with around 4 million in Romania and 2 million in Poland. The two states hold the largest organic farms, and they are the last CEECs with agricultural units that exceed 100 hectares. Organic farms are those agricultural units that use a technique based on utilizing and increasing internal natural resources and processes to secure and improve agricultural productivity, while minimizing negative environmental impacts, with a potential choice of ecofunctional intensification [27].

2.1. Cluster Analysis

To underline the significance of agriculture in the development of the bioeconomy in CEECs, considering suitable indicators, we employed the cluster method and computed it using SPSS software (IMB SPSS Statistics 20). In addition, by employing the cluster technique, we can compare CEECs in terms of the component subsectors of chosen agriculture indicators (crop and animal production, hunting, and related service activities).
Information is frequently grouped by region using the tool of cluster analysis to build composite indicators that establish a hierarchy of groups (clusters) depending on their proximity or dissimilarity to the primary components [28]. Cluster analysis is important for determining regional differences and commonalities, in addition to allowing the dissemination of expertise as well as local resources for sustainable regional growth [29]. Creating a class partition that either maximizes or minimizes inertia between or within cluster ranks is the aim [30,31].
Testing a null hypothesis is the most common method of evaluating quantitative findings in economic research, and is used to figure out the effect of an indicator on each subgroup, according to analysts [28,32]. A value of p > 0.05 (95% confidence level) was chosen as the threshold with which to accept the null hypothesis.
We formulate the null hypothesis (Hypothesis 0), for our cluster analysis, as the absence of any appreciable differences in the growth rates of each variable in the groups of countries. A substantial variation in at least one of the growth rates of the selected parameter for each country was the alternative hypothesis’s (Hypothesis 1). Three clusters have been set for the analysis and investigation of the SEIB effect and group comparability. We standardized the values at the Z-score by variable, employed an interval measure, Euclidean distance, and used Ward’s method. A dendrogram based on indicators related to the specified bioeconomy has been generated as a result of the classification algorithm.
The research was carried out utilizing Ward’s approach, which employed cluster analysis to figure out the regional prevalence of agriculture in the bioeconomy of CEECs. In accordance with Murtagh and Legendre [33] as well as Bu et al. [34], we chose to use the technique developed by Ward because it constitutes one of the few agglomerative clustering methods that depend on the value of each variable to reduce the dispersion within the cluster.
After calculating the growth rates of the indicators for each variable by taking the first difference of the natural logarithm, we tested the robustness of our parameters by employing a one-way analysis of variance (ANOVA) [35,36]. Descriptive statistics of the data are provided in Appendix A. The third- and fourth-order moments hint at a probability distribution that is very close to the Gaussian bell.

2.2. The Socioeconomic Indicator of the Bioeconomy

As of now, the existing literature still lacks in what concerns bioeconomic agriculture analyses from multidimensional socioeconomic points of view [37]. This is the particular gap that the socioeconomic indicator for bioeconomy (SEIB) fills, by assessing the performance of CEECs based on the parameters put forward by Ronzon and M’Barek [18].
We followed the methodology put forward by D’Adamo et al. [25] in calculating the socioeconomic indicator for bioeconomy (SEIB). Our study differs from D’Adamo et al. [25] with regard to the focus on the socioeconomic performance of bioeconomic agriculture in CEECs.
The socioeconomic performance of the bio-based sector is calculated as follows:
S E I B A g r i = P V k 1 ,   c 1 ,   p 1   W P k 1 , p 1     W S k 1 , p 1 +   P V k 1 ,   c 1 ,   p 2   W P k 1 , p 2     W S k 1 , p 2 +   P V k 1 ,   c 1 ,   p 3   W P k 1 , p 3     W S k 1 , p 3
where PV is the agriculture parameter value for year k = 1, …, n, country c = 1, …, n, and parameter p = 1, …, 3; WP is the weight of the p = 1, …, 3 socioeconomic indicator for agriculture, and WS is the weight of the bio-based sector [17]. D’Adamo et al. [25] compute the socioeconomic indicator weight (WP) via the use of the AHP method of Saaty [38], based on the opinions of a panel of experts. Similar to their study, we use the following weights corresponding to the indicators for agriculture: 36.8% turnover, 34.3% value added at factor cost, and 28.9% employees. We kept the weights constant through the sample.
Considering that WS is 100% in the case of agriculture [17,25], the equation becomes as follows:
S E I B A g r i = k = 1 n P V k = 1 , n ; c = 1 , n   p = 1,3 W P p = 1,3  
In order to obtain comparable data, we adjusted the parameter values and divided them by the population. The SEIB was computed yearly to obtain a time series.
The two steps of the analysis presented in the methodology were chosen to study the dynamics of a bioeconomy-specific index (SEIB), depending on the cluster ranking. It is a combination of two methods that have been used individually in the specialized literature, but which, to our knowledge, have never been brought together in previous published works.
Through these combined methods, we wanted to bring an element of novelty to the economic literature for a relatively new field: that of the bioeconomy.

3. Results and Discussions

A hierarchical cluster analysis helps us to highlight the links between the component elements of the groups based on the three variables and to analyze the SEIB coefficient subsequently.

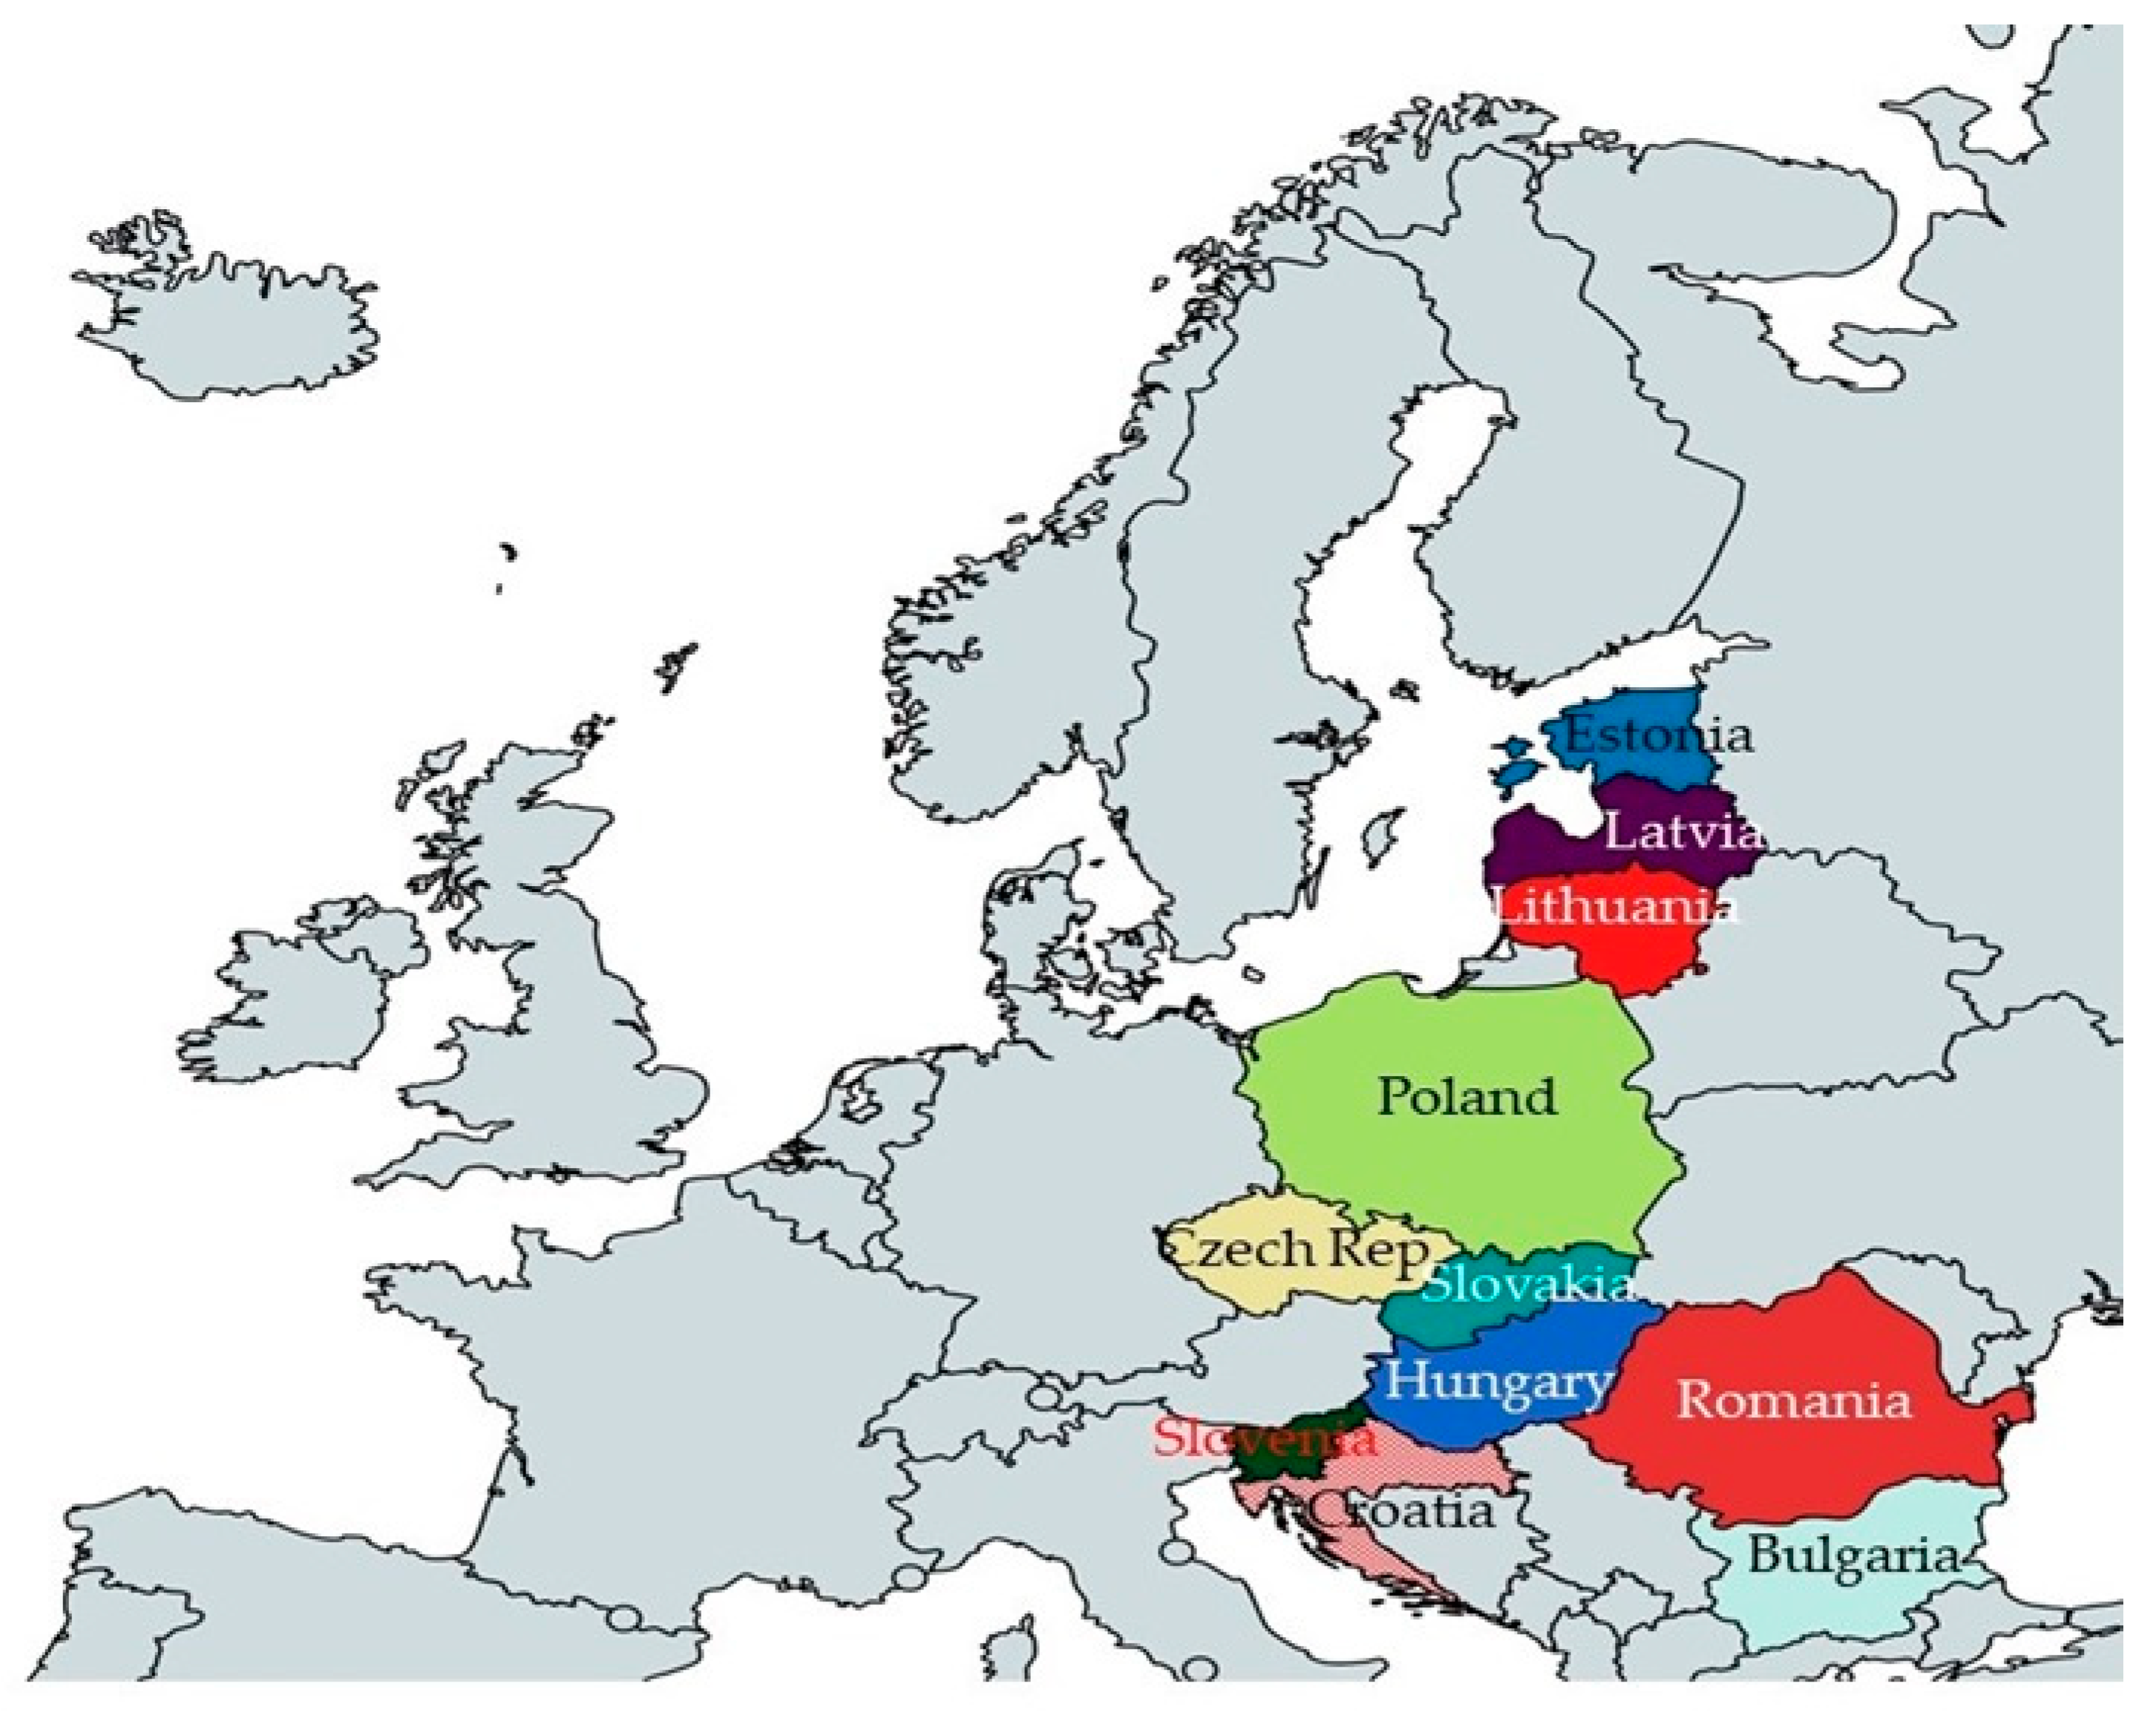
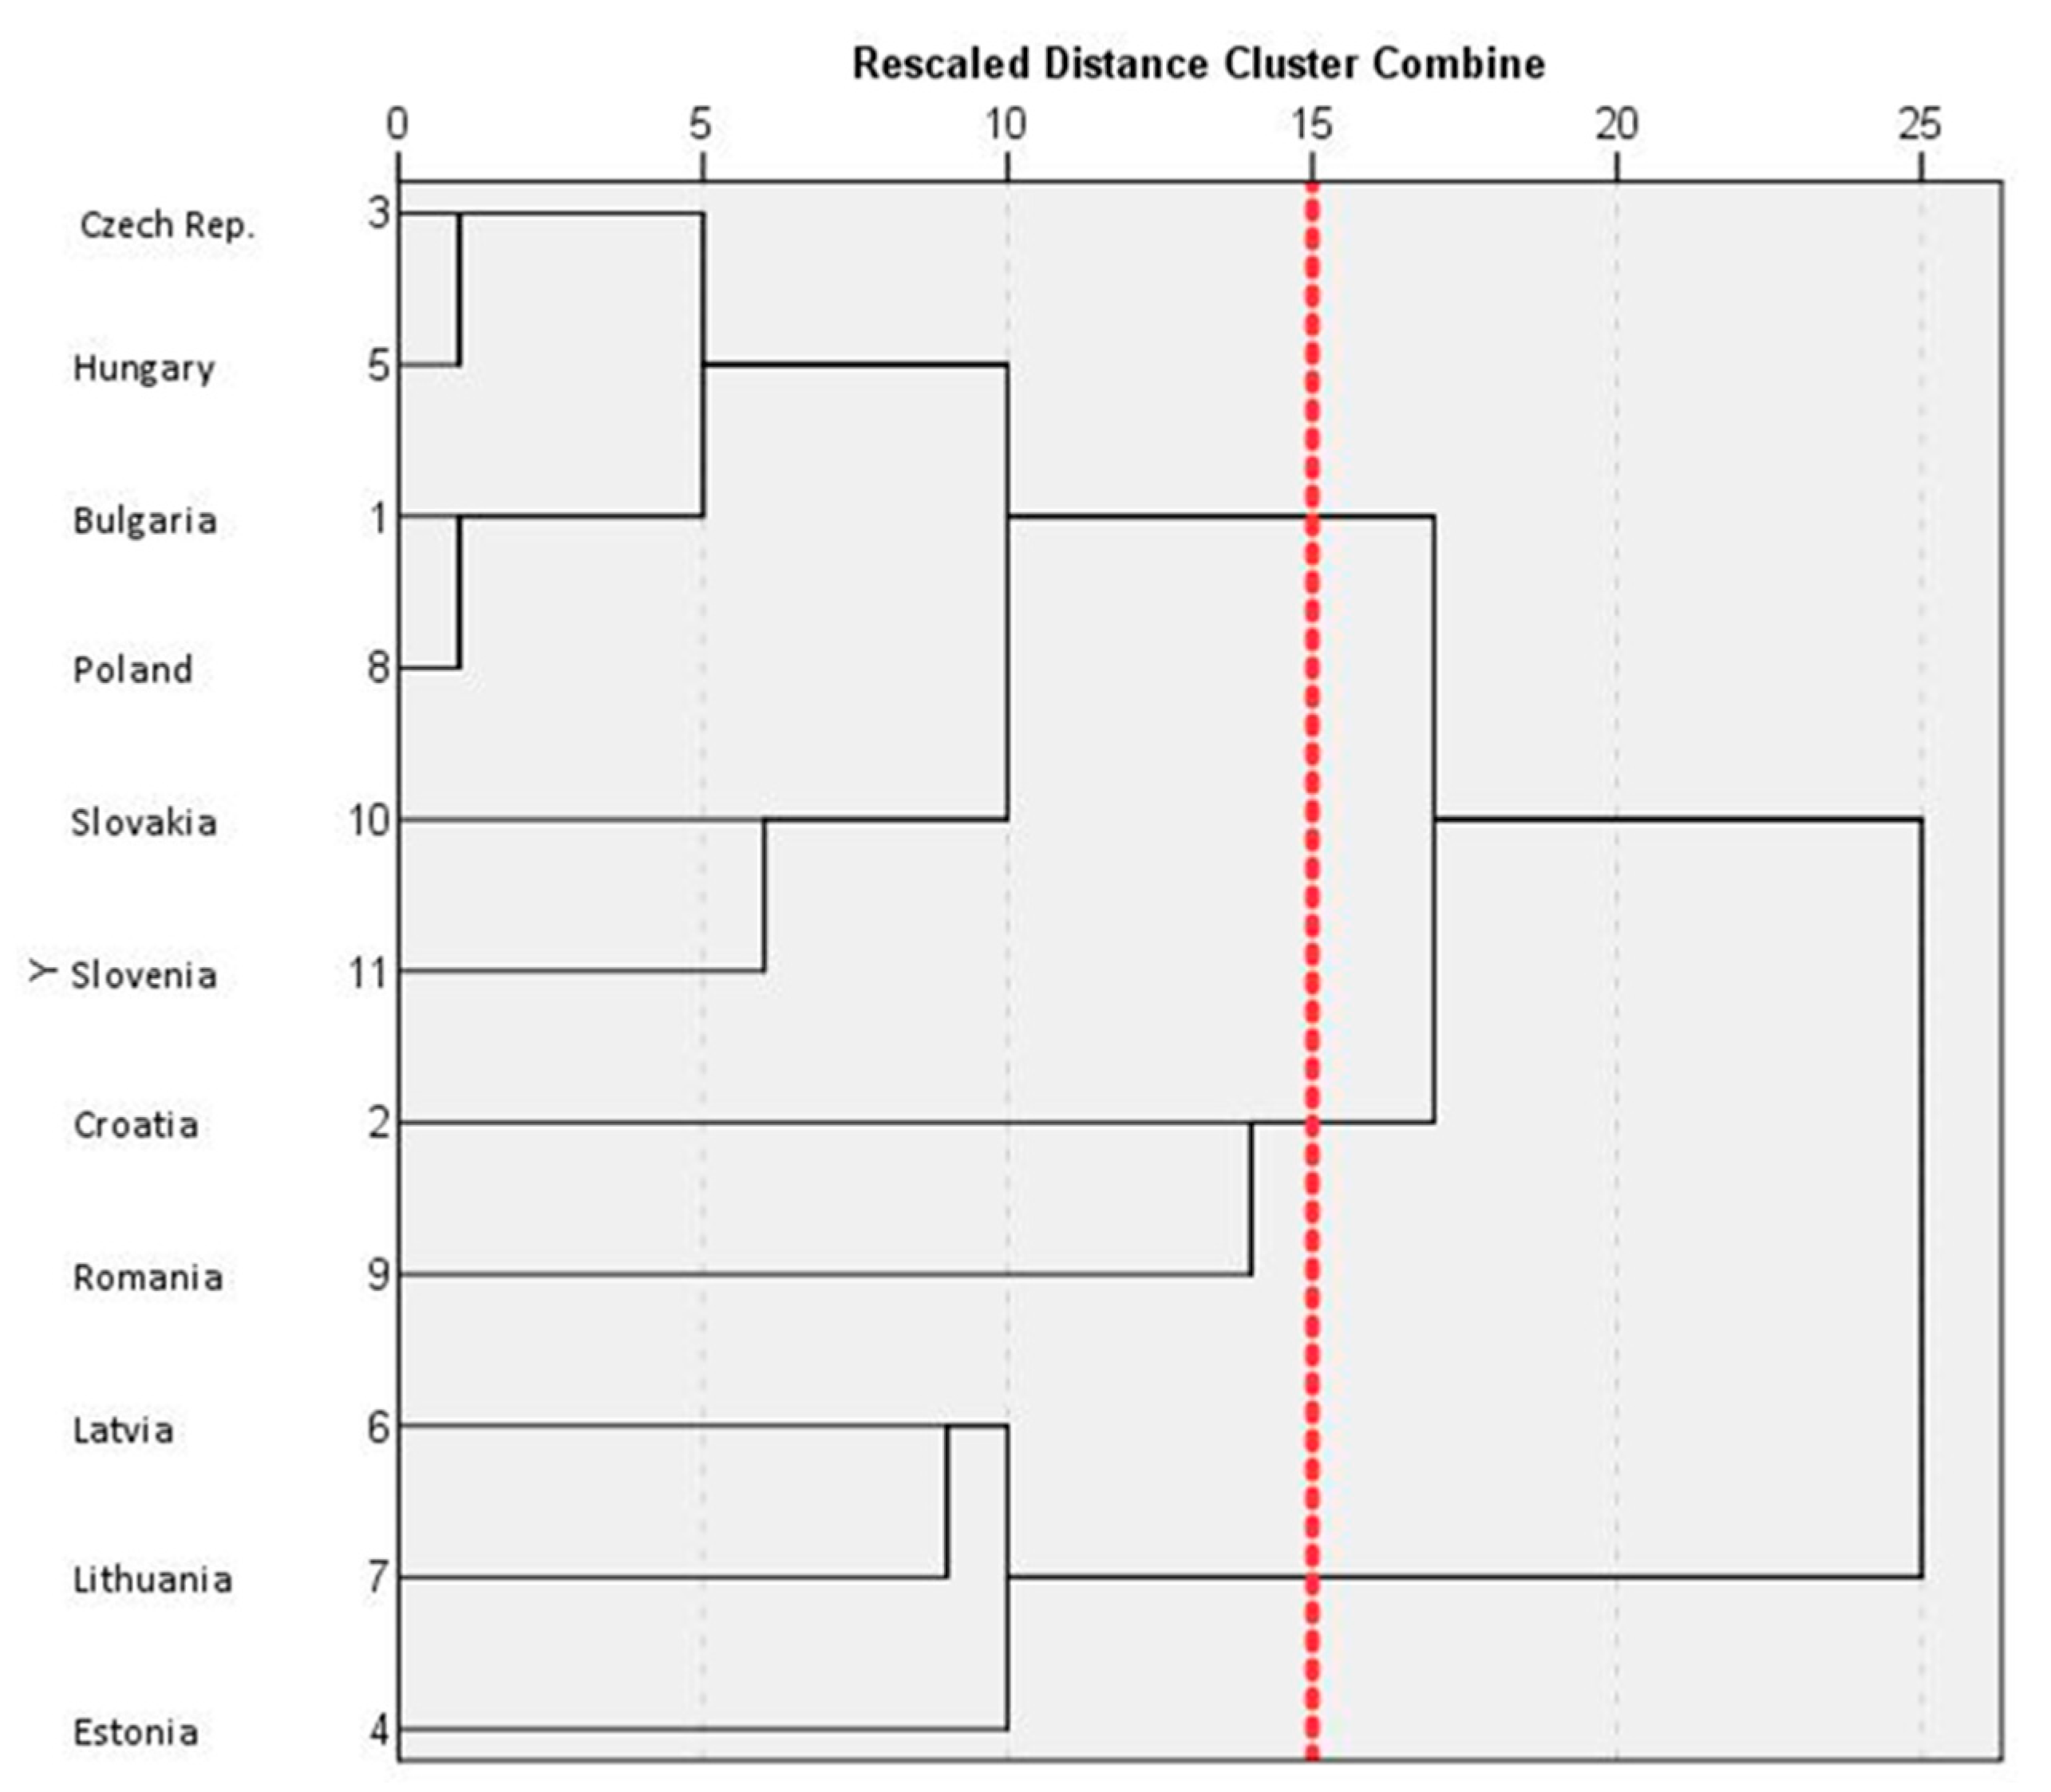
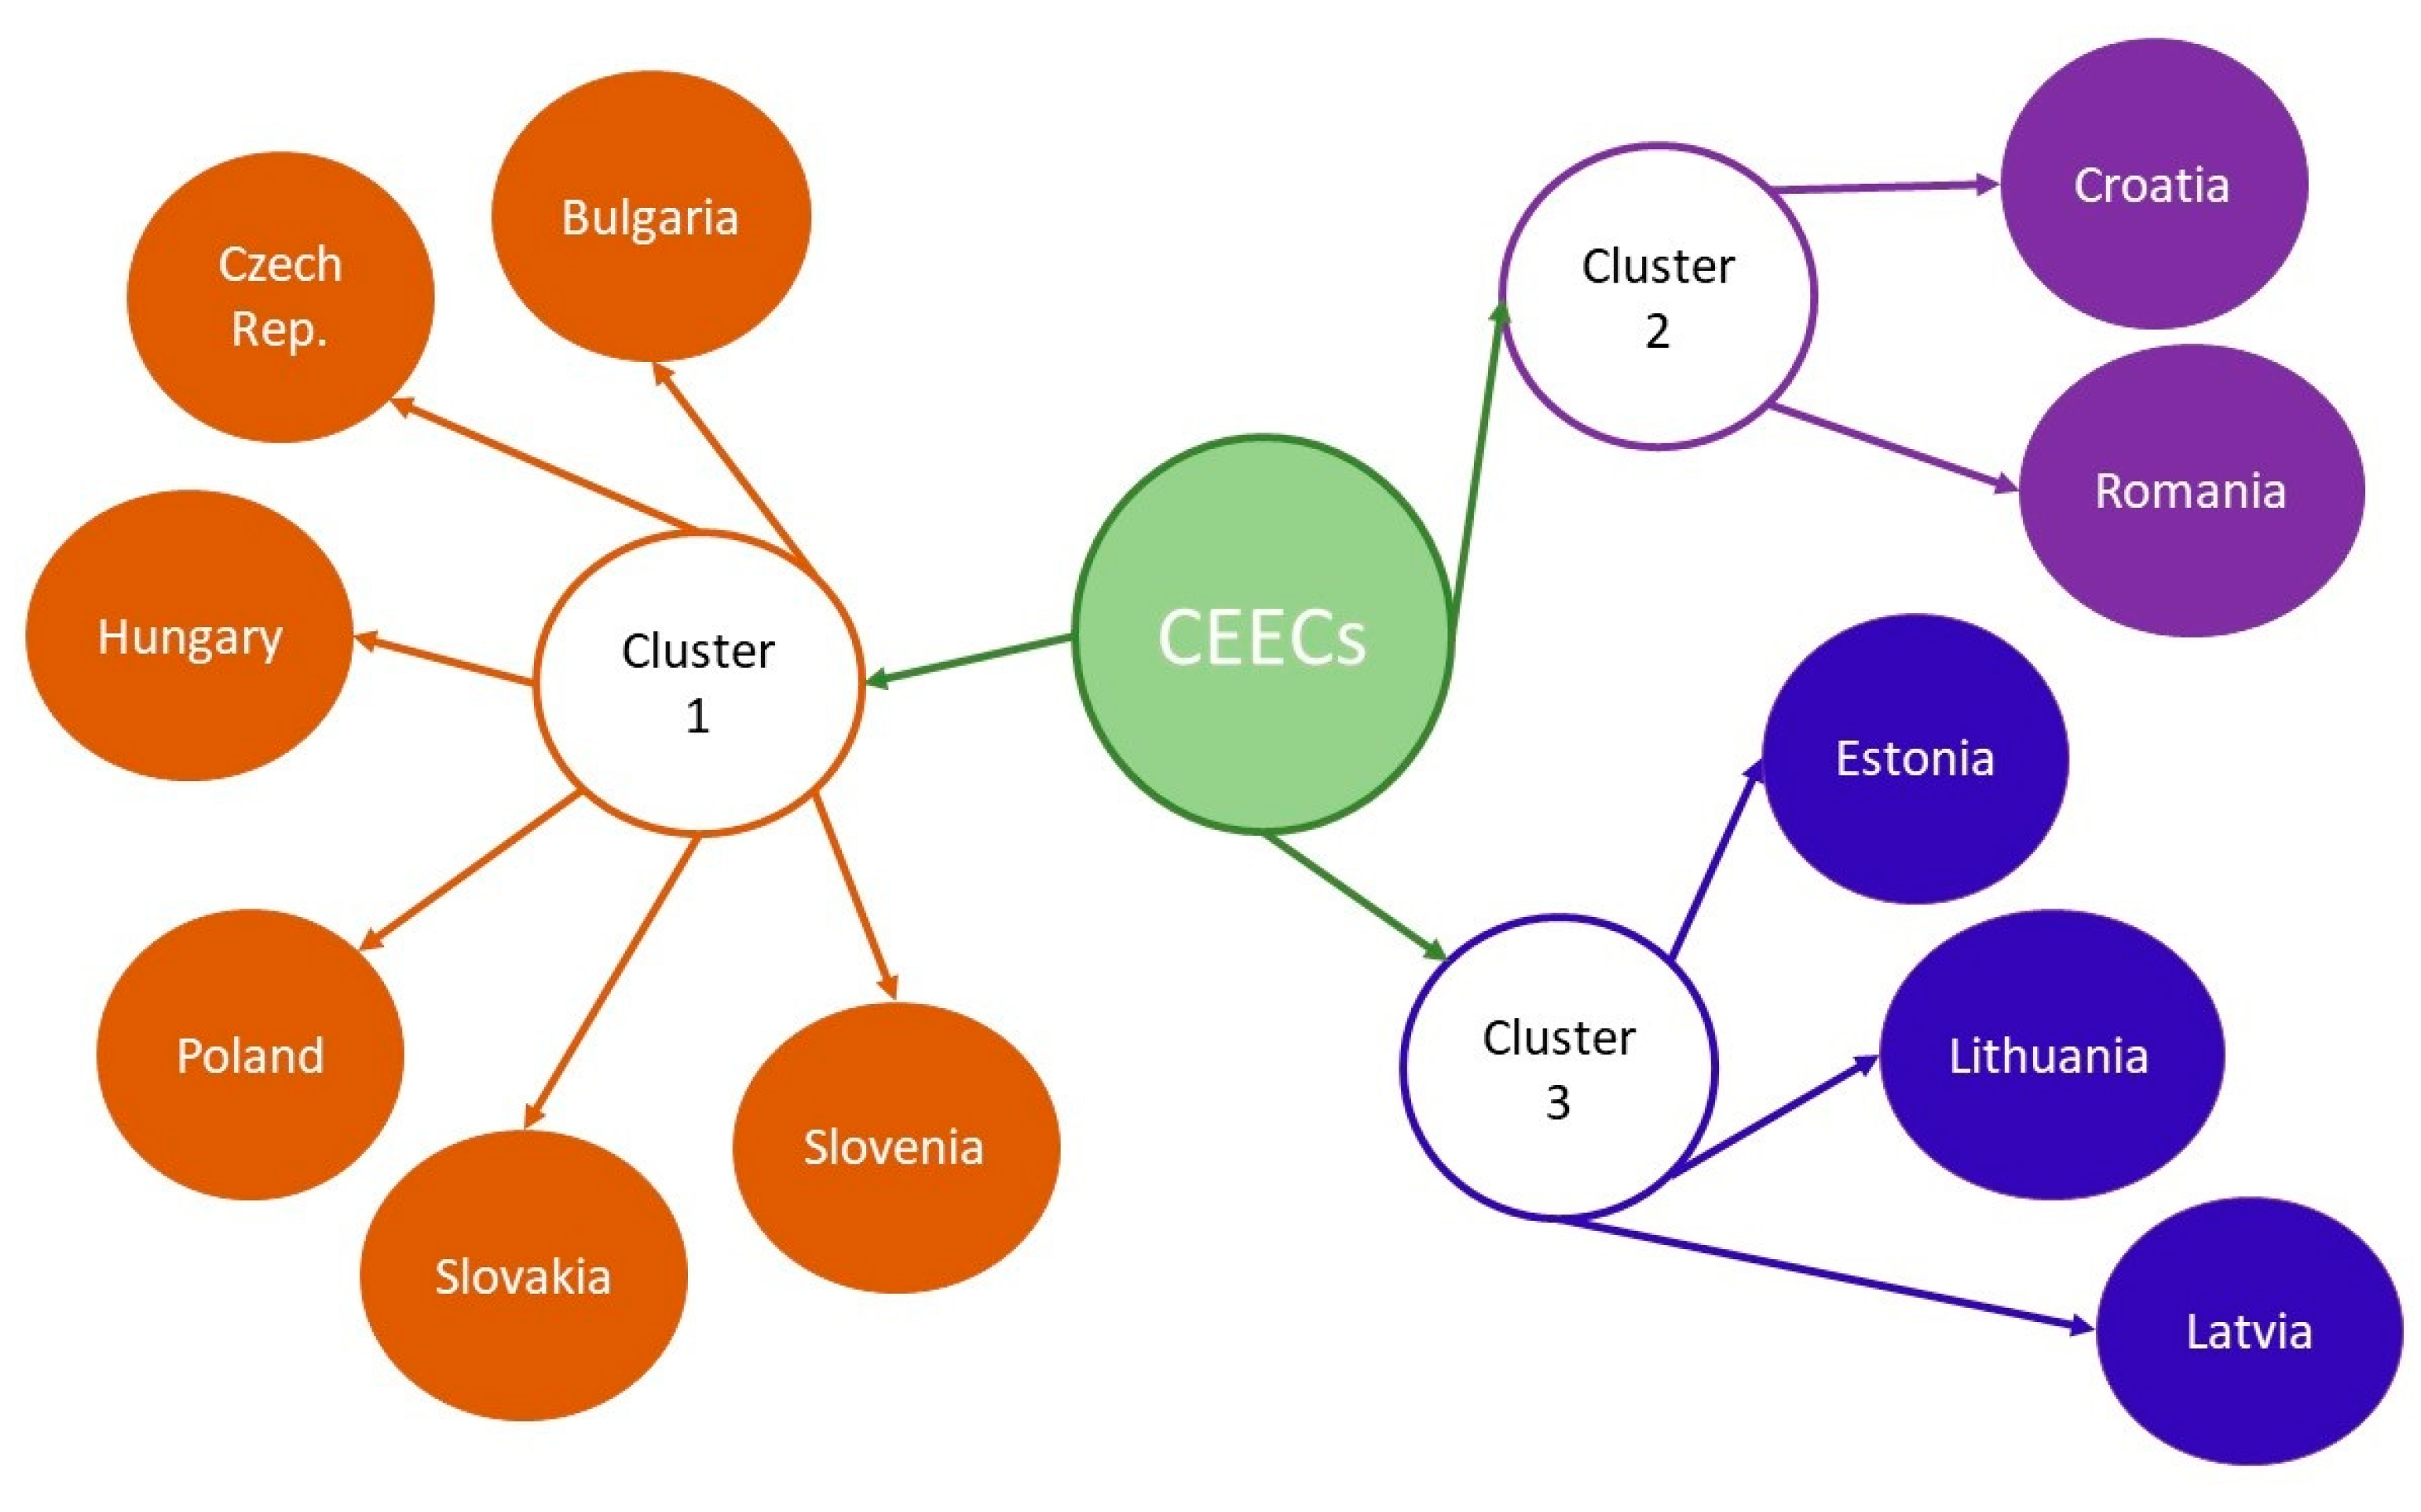
3.1. The Hierarchical Cluster Analysis of CEECs

According to the resulting dendrogram, we observed that three clusters are obtained at an iteration positioned at point 15, because at point 14 there were four groups and at 17 there were two groups. Due to the minimum requirement of two countries in a class, we selected for the iteration with three clusters at point 15. The dendrogram illustrates the processes in the hierarchical grouping solution. We displayed a red vertical line to highlight the Ward method’s determination of the ranking process (Figure 2).
The following classes emerged from the analysis of the group using the selected variables and the requirement of having at least two components per cluster (Figure 3):
-
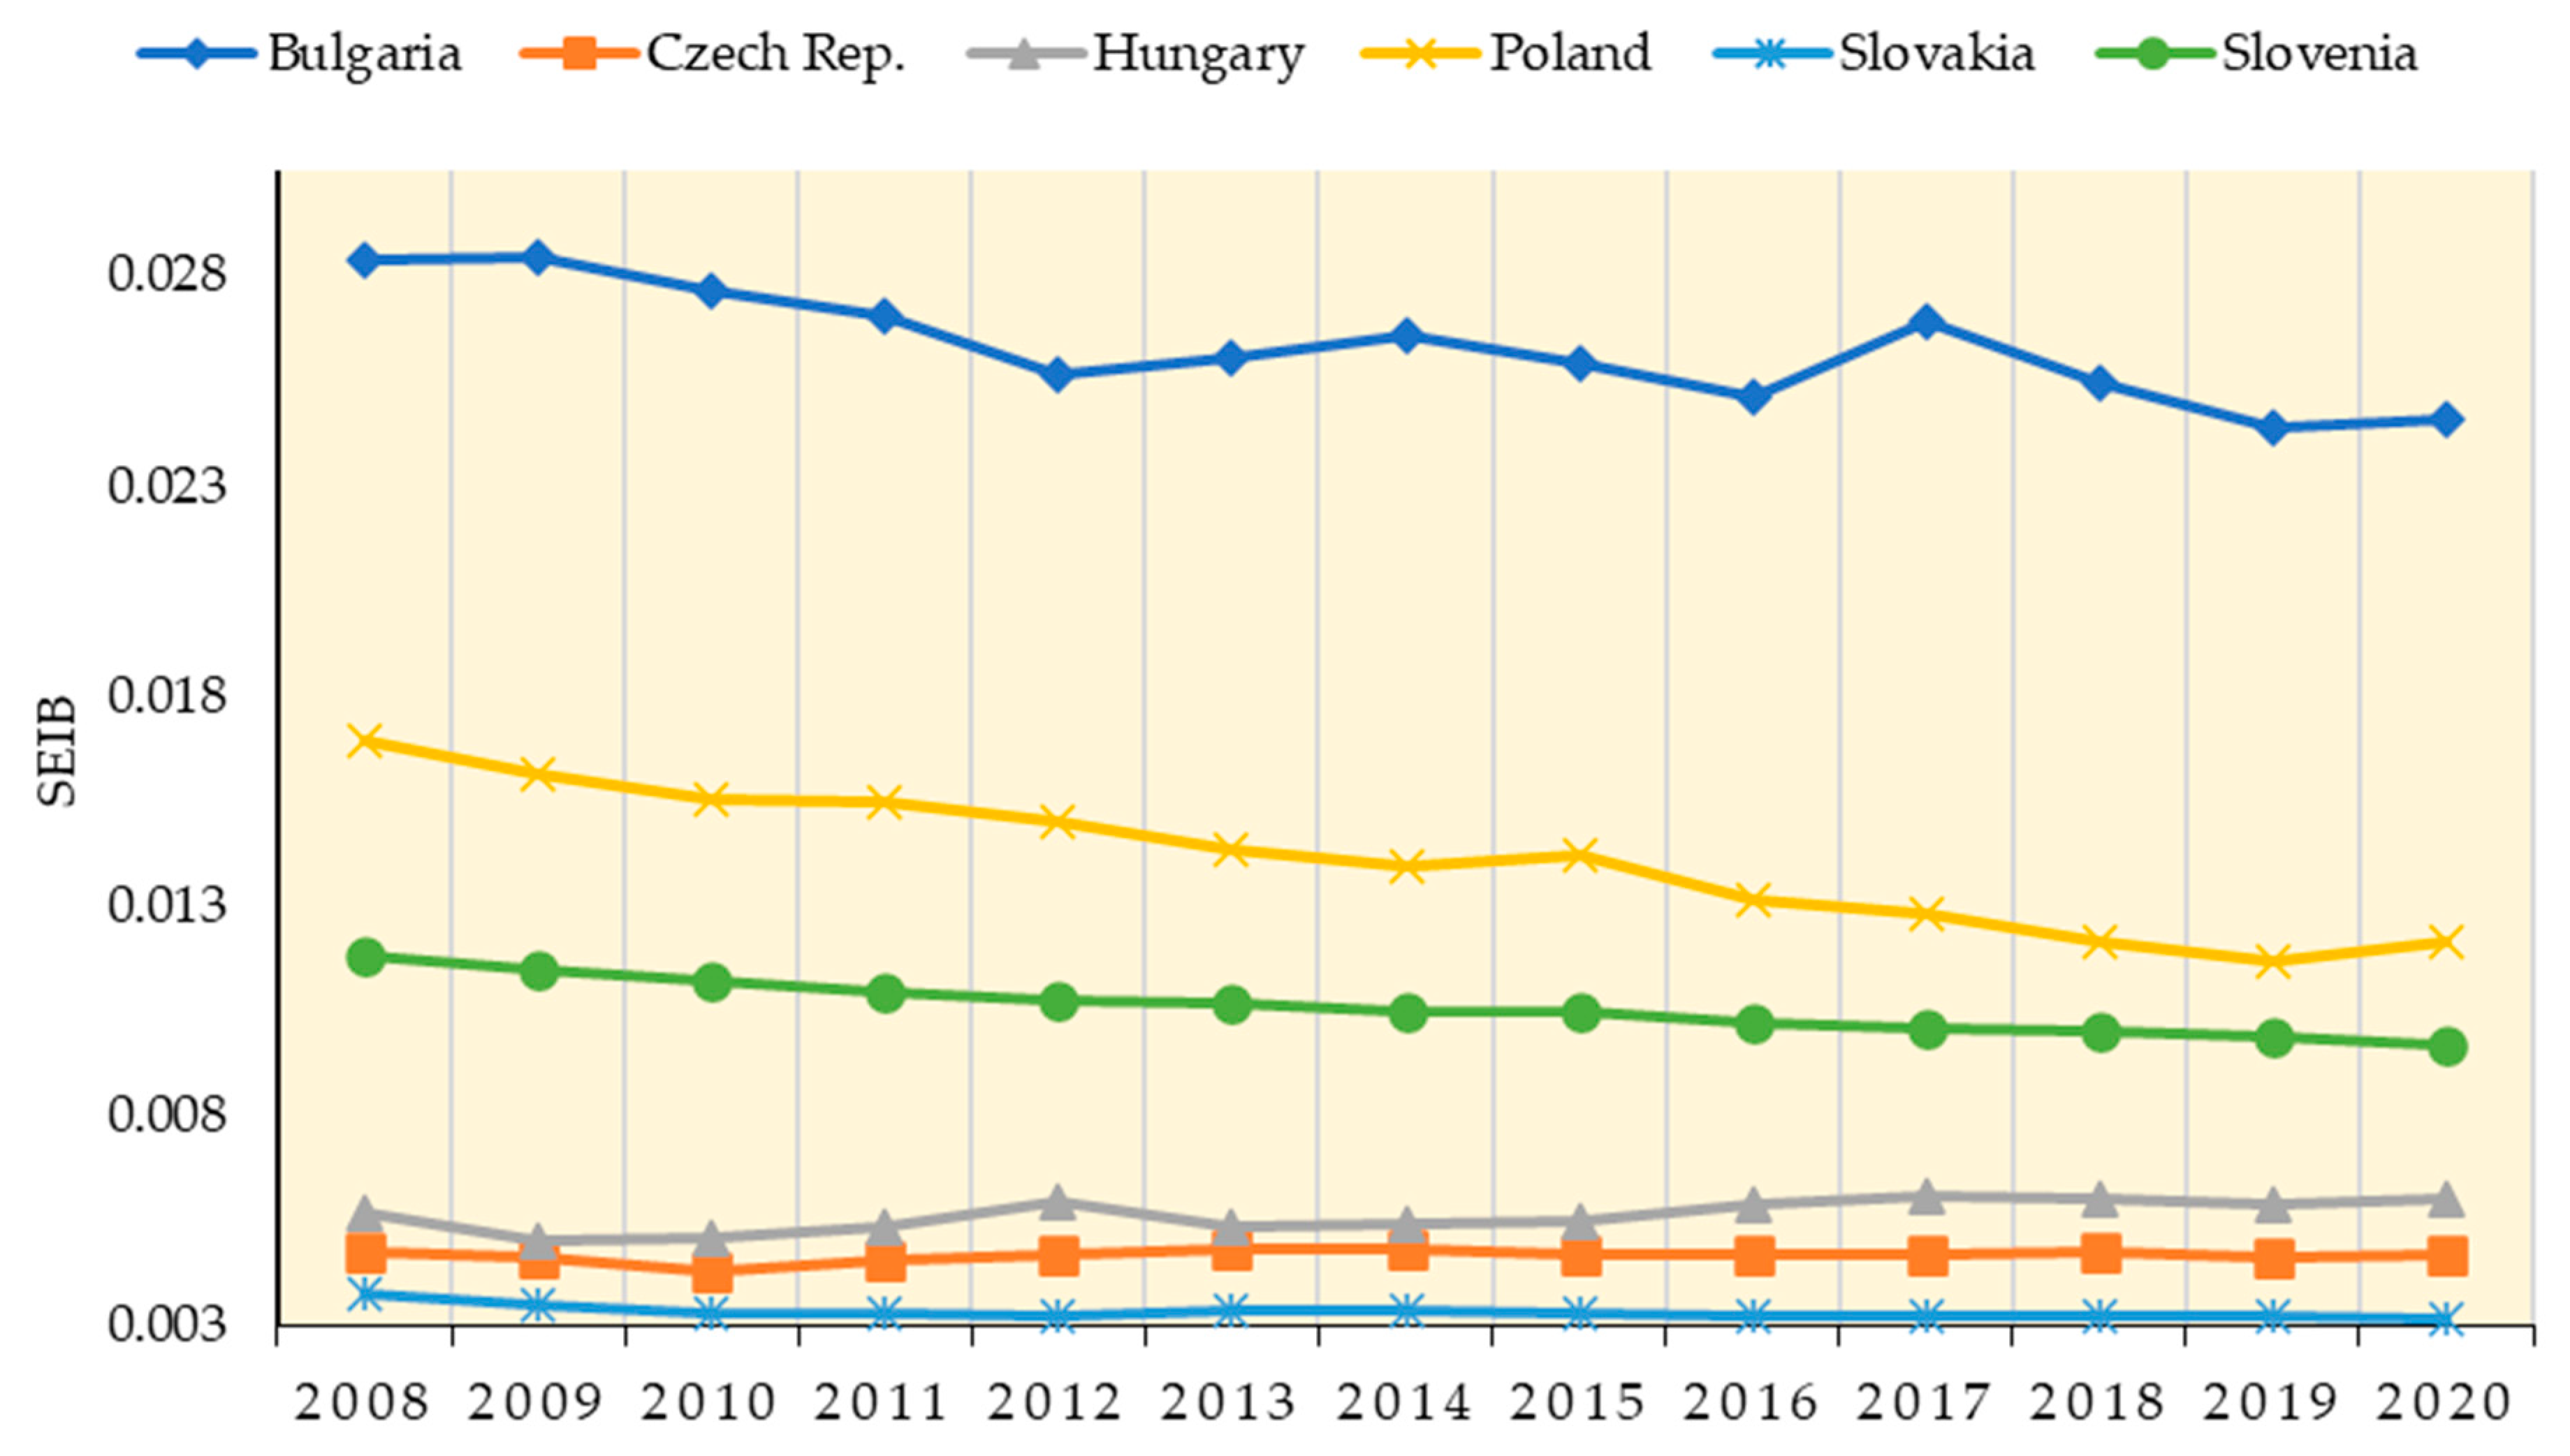
First group of countries: Bulgaria, Czech Rep., Hungary, Poland, Slovakia, and Slovenia.
-
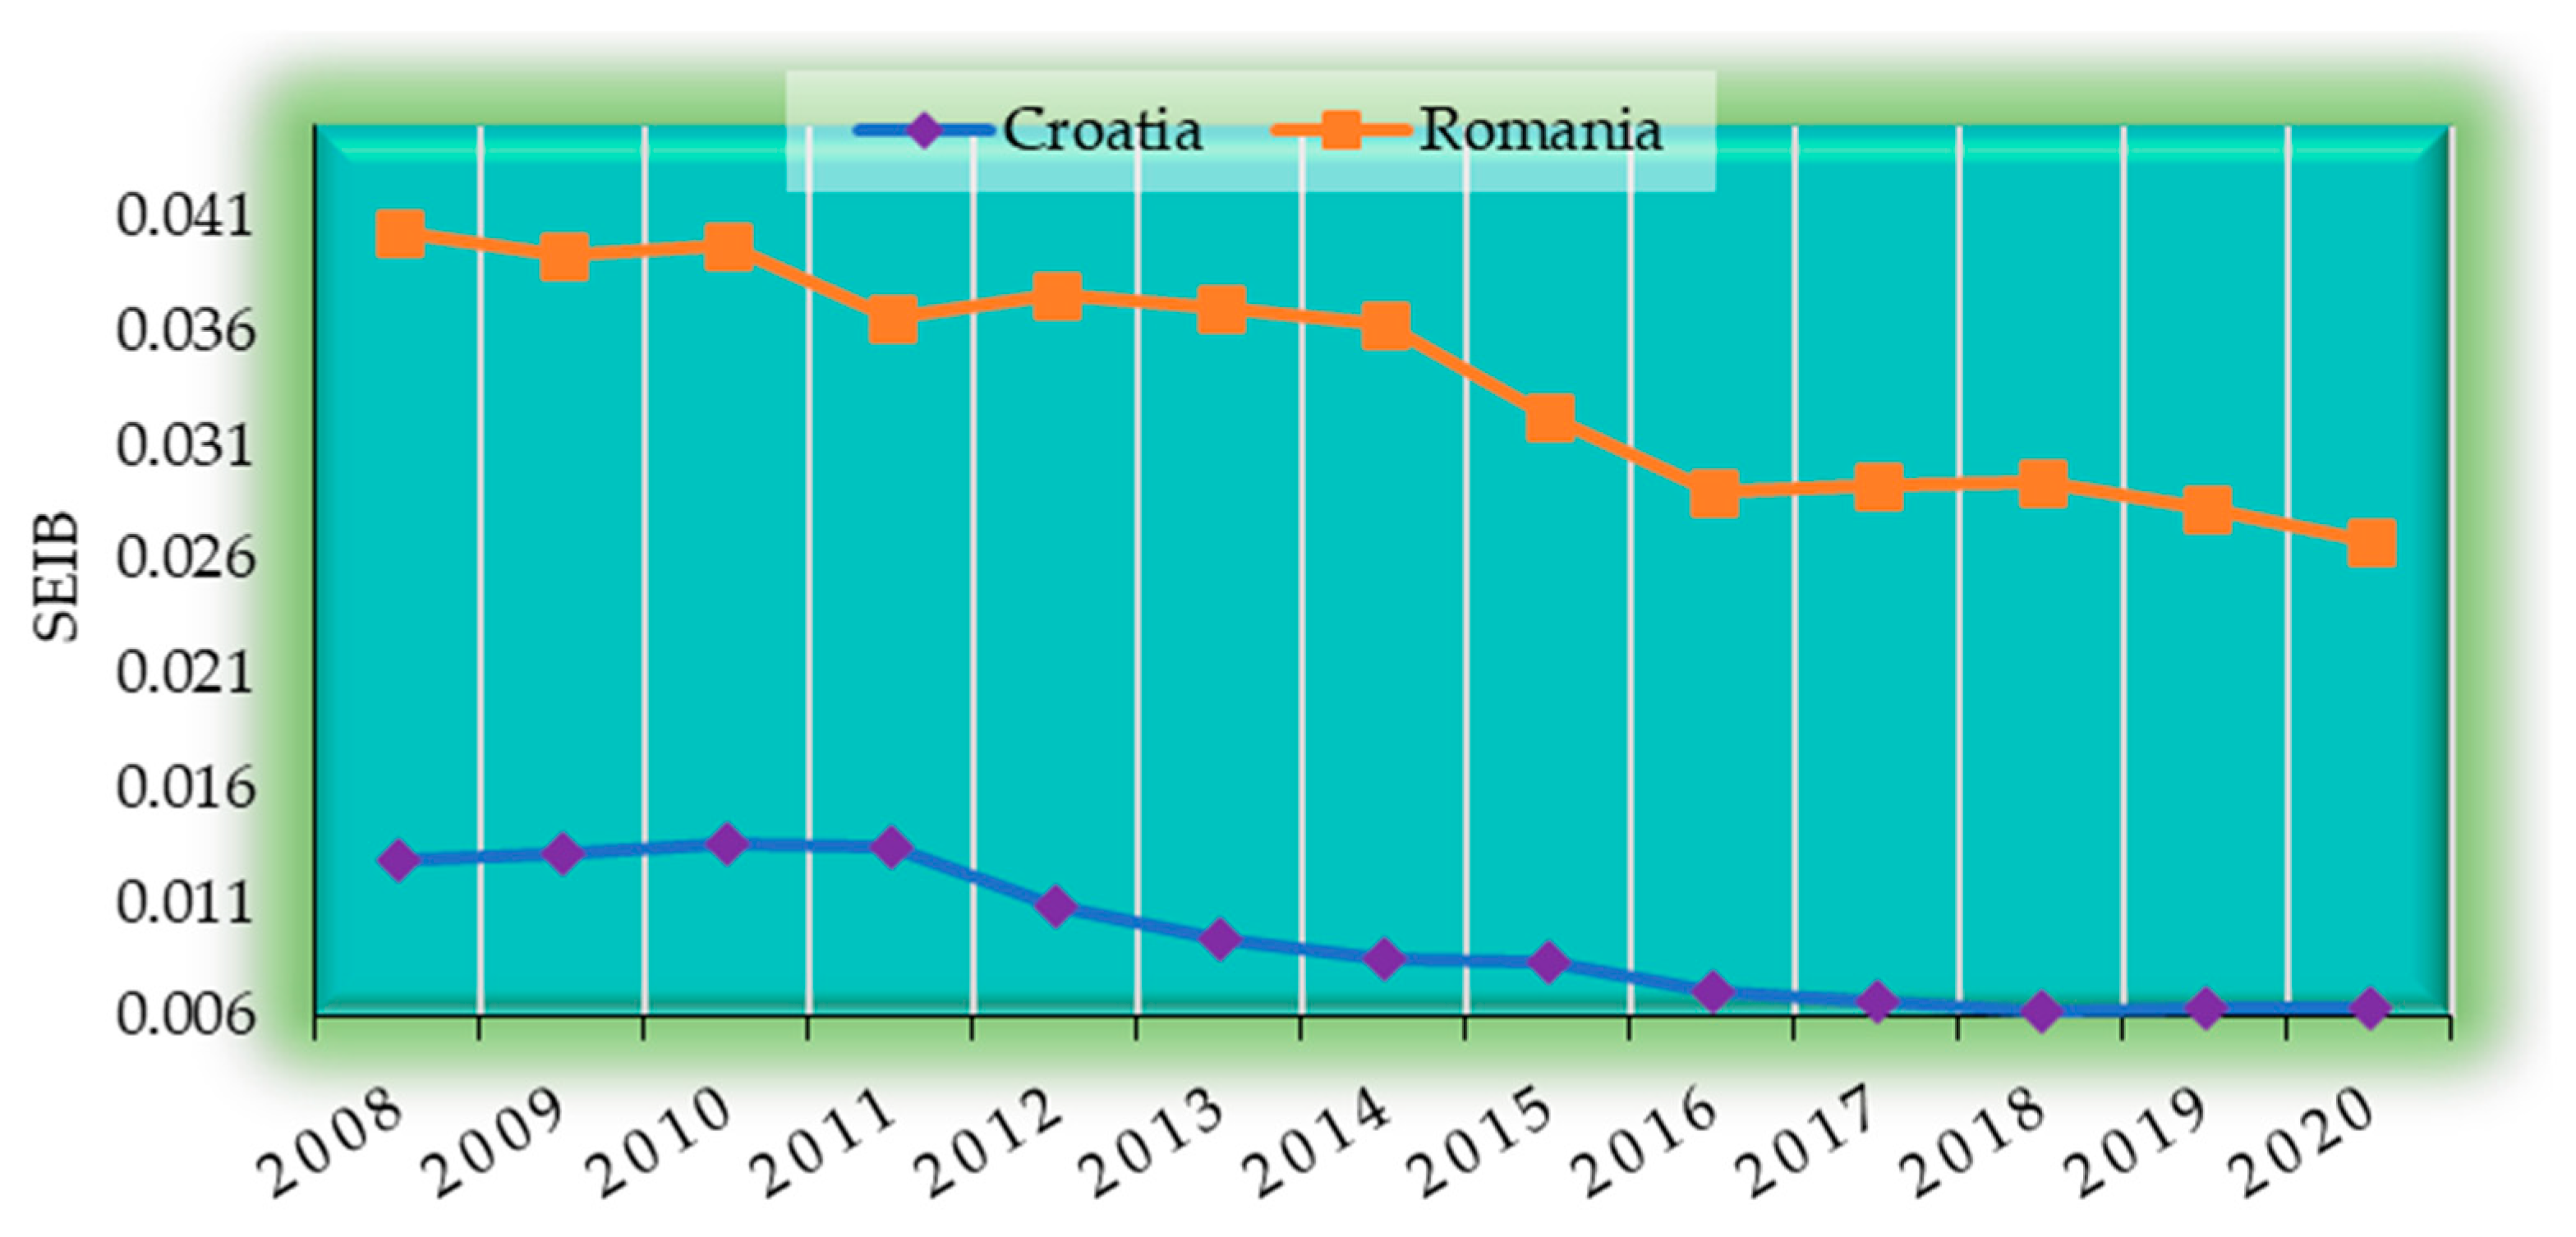
Second group of countries: Croatia and Romania.
-
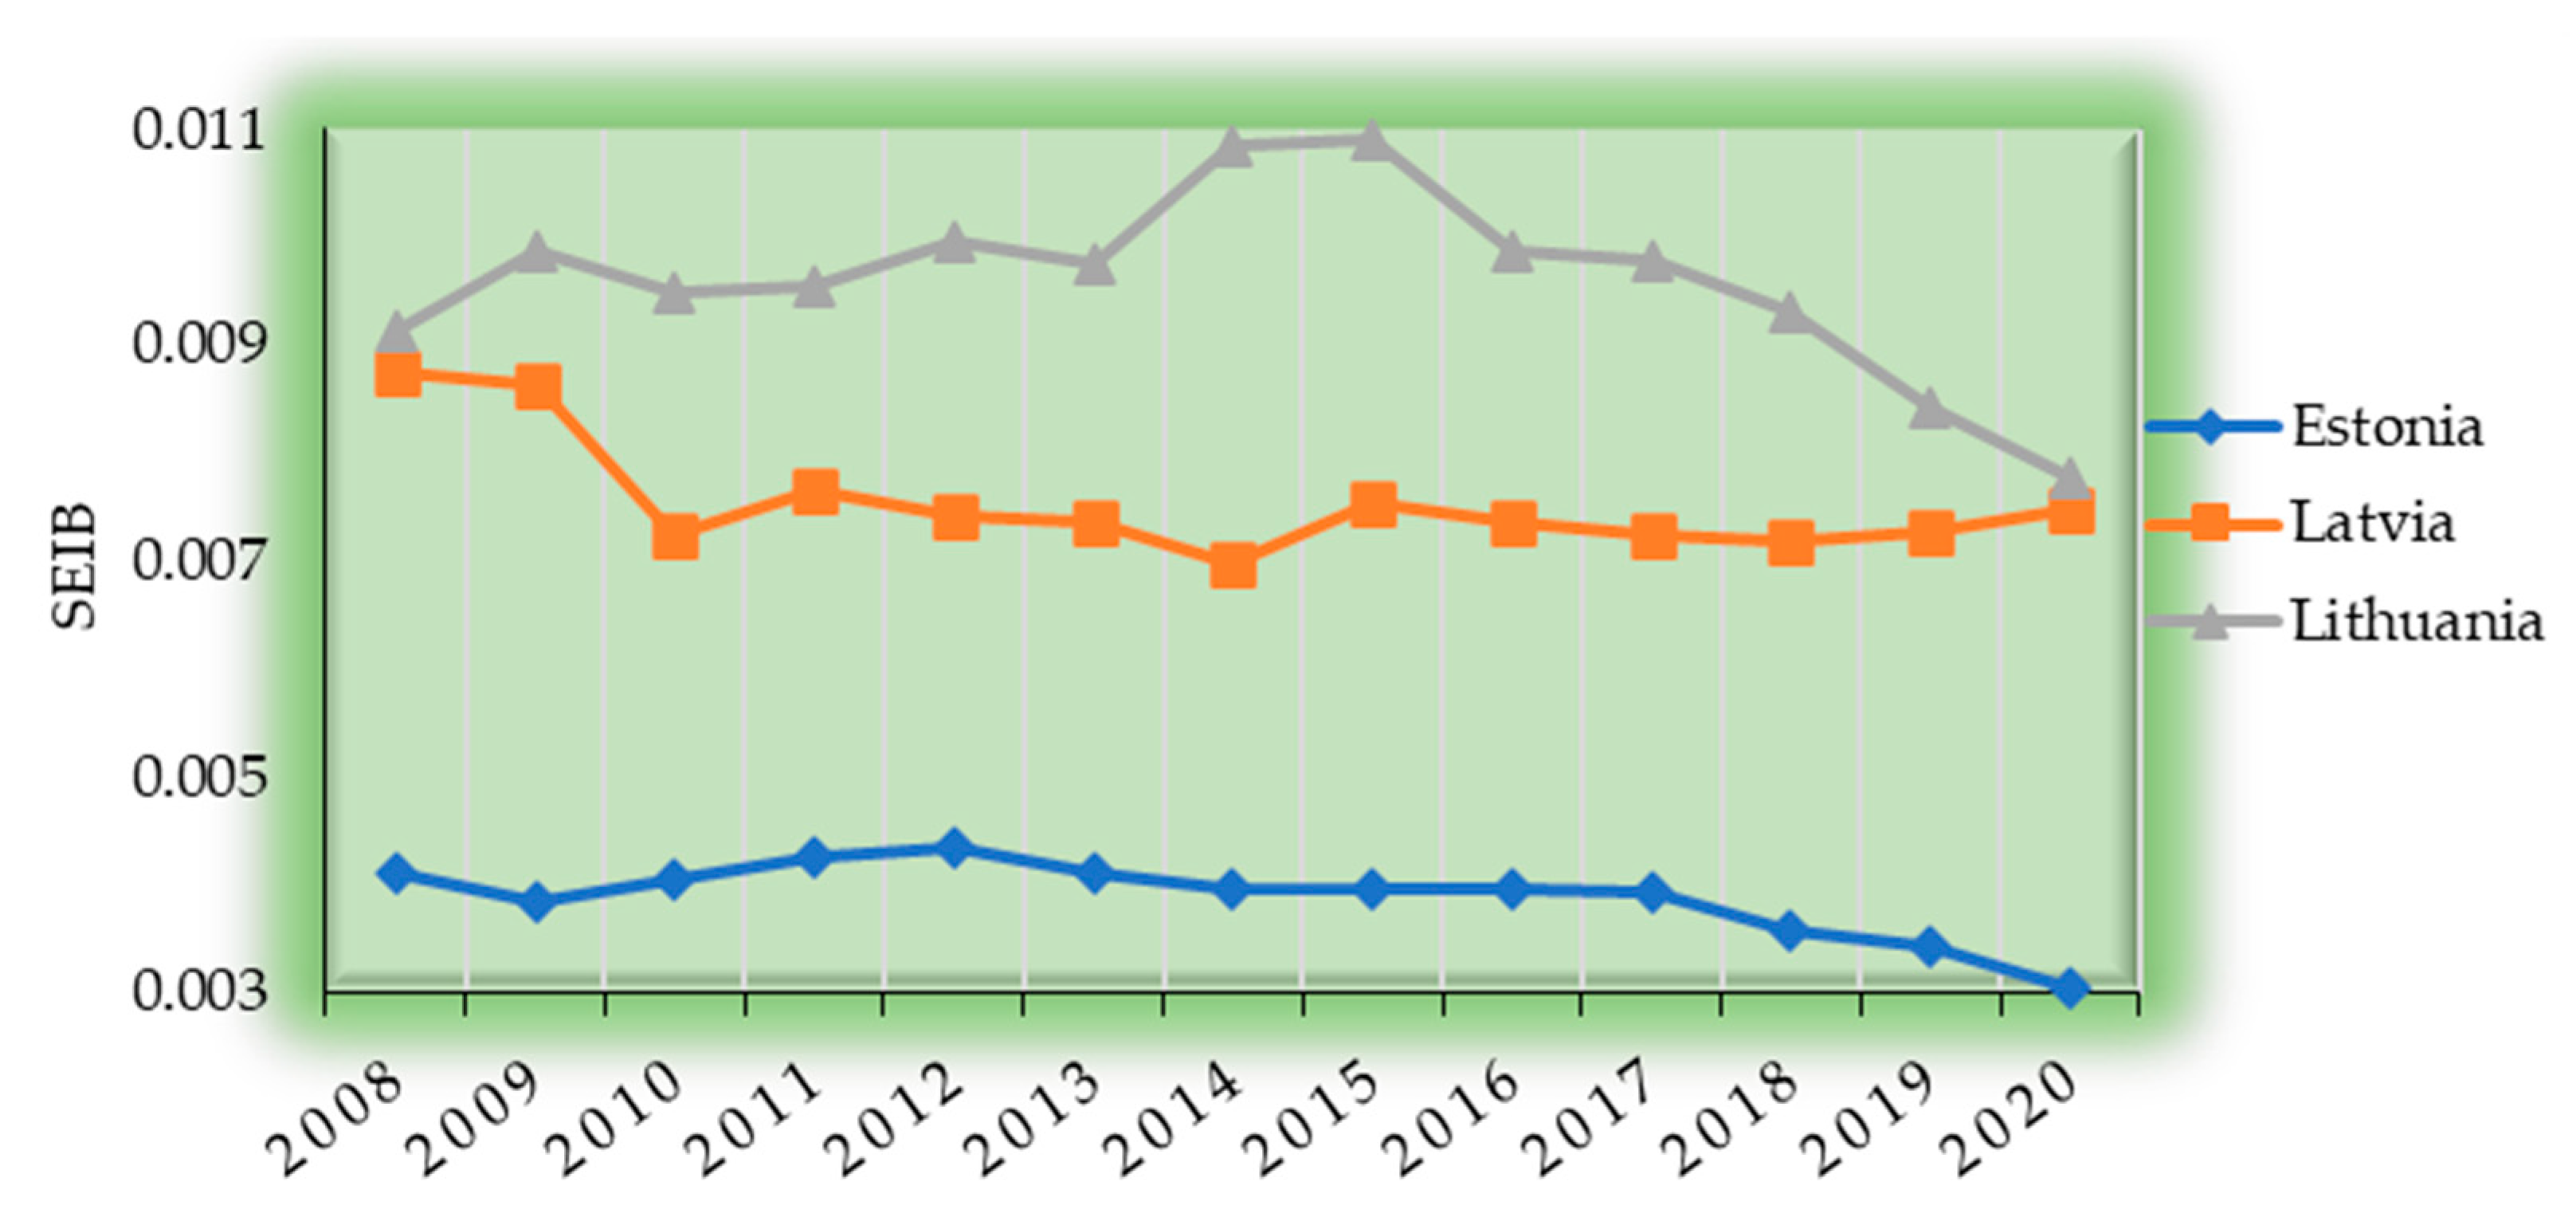
Third group of countries: Estonia, Lithuania, and Latvia.
As the descriptive statistical analysis reveals, the countries from cluster 1 have the most compact values around the average for V_1 and V_2. V_3 states from cluster 2 have the most compact values around the average. For V_2 and V_3, the countries in cluster 3 have values that are the most dispersed (Table 2).
The p-values derived from the ANOVA (Table 3) show that the data series of each cluster validates the null hypothesis at a confidence level of 95%. As p > 0.05 for each of the variables entered in the model, for each of the clusters obtained we can state that the null hypothesis (H0) is accepted—e.g., there are similarities between the series—and the alternative one is rejected (H1).
The ranking variable that most effectively describes how the clusters formed is indicated by the level of the F values < F crit in the ANOVA table [36]. Following WRKS (F = 1.0032 in cluster 1), TO (F = 0.2578 in cluster 1) and VA (F = 0.2578 in cluster 1) had the highest values. At a 95% confidence level, all variables in each group have p-values ≥ 0.05, indicating statistical significance. As a result, H0 is accepted, and the included countries satisfy the requirements for becoming a part of the cluster.
According to the examination of unprocessed data, the values of the variables associated with Romania are similar to those of Poland [39] (Table 1), but the findings of the cluster hierarchical analysis position Romania in the same category as Croatia (Figure 3). This feature is explained by the differences in dynamics between Romania and Poland, while Croatia’s dynamic was close to that of Romania’s for the three variables included in the model.

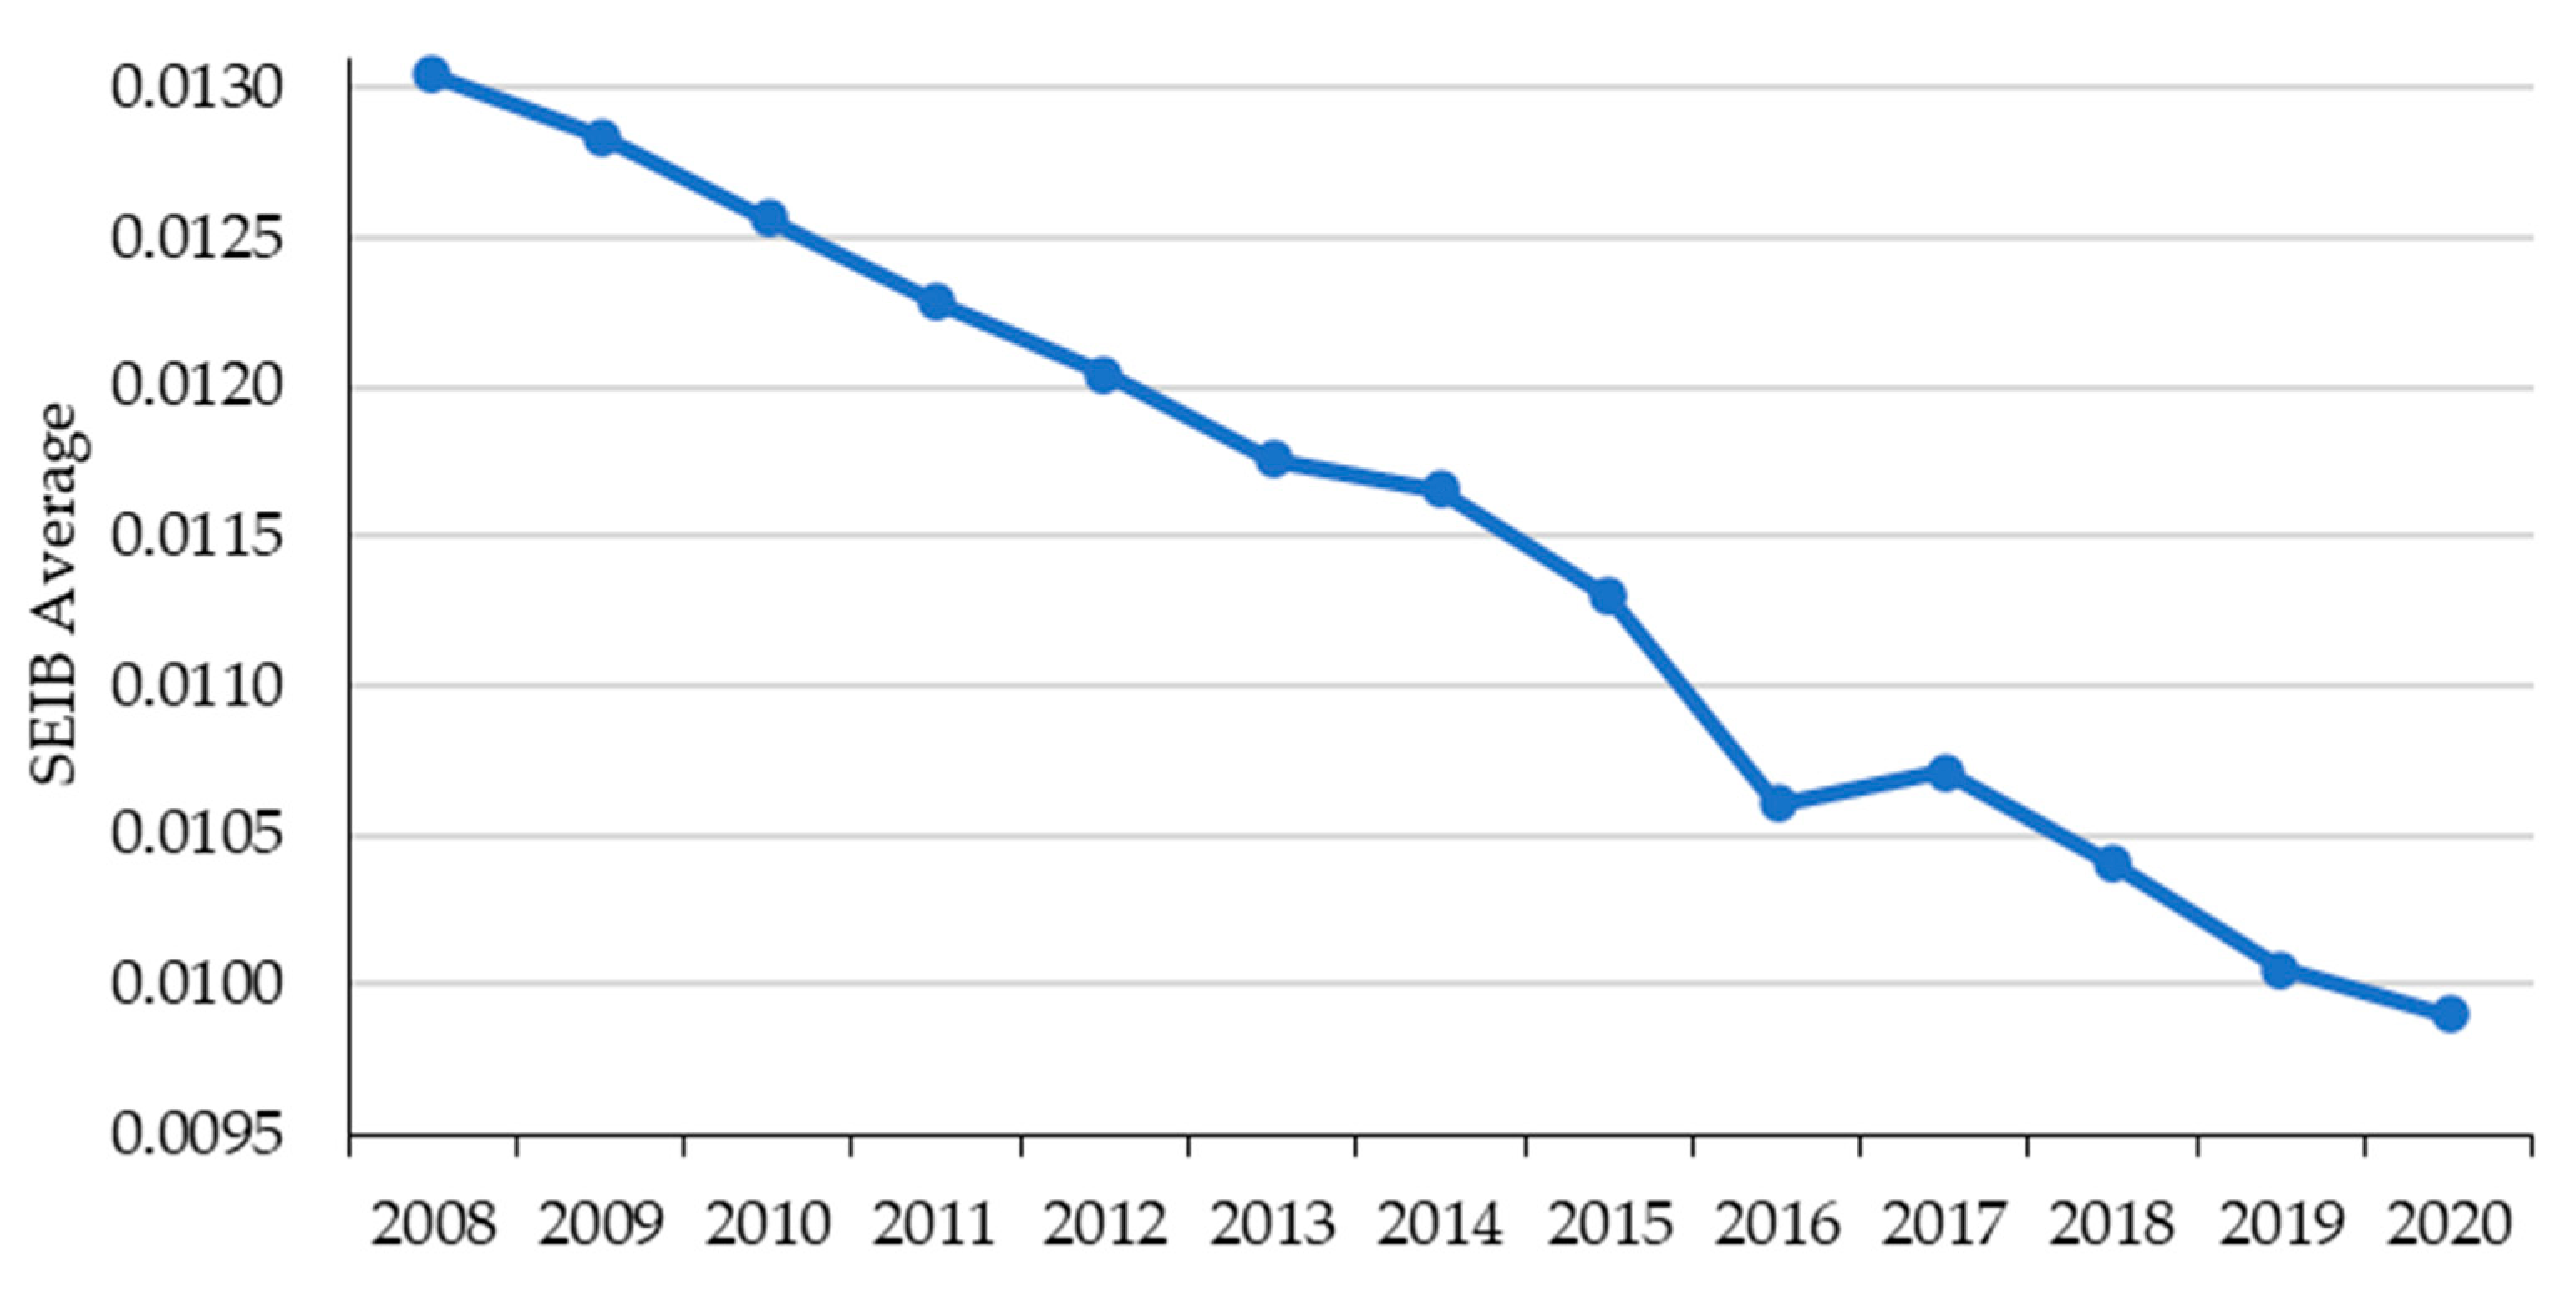
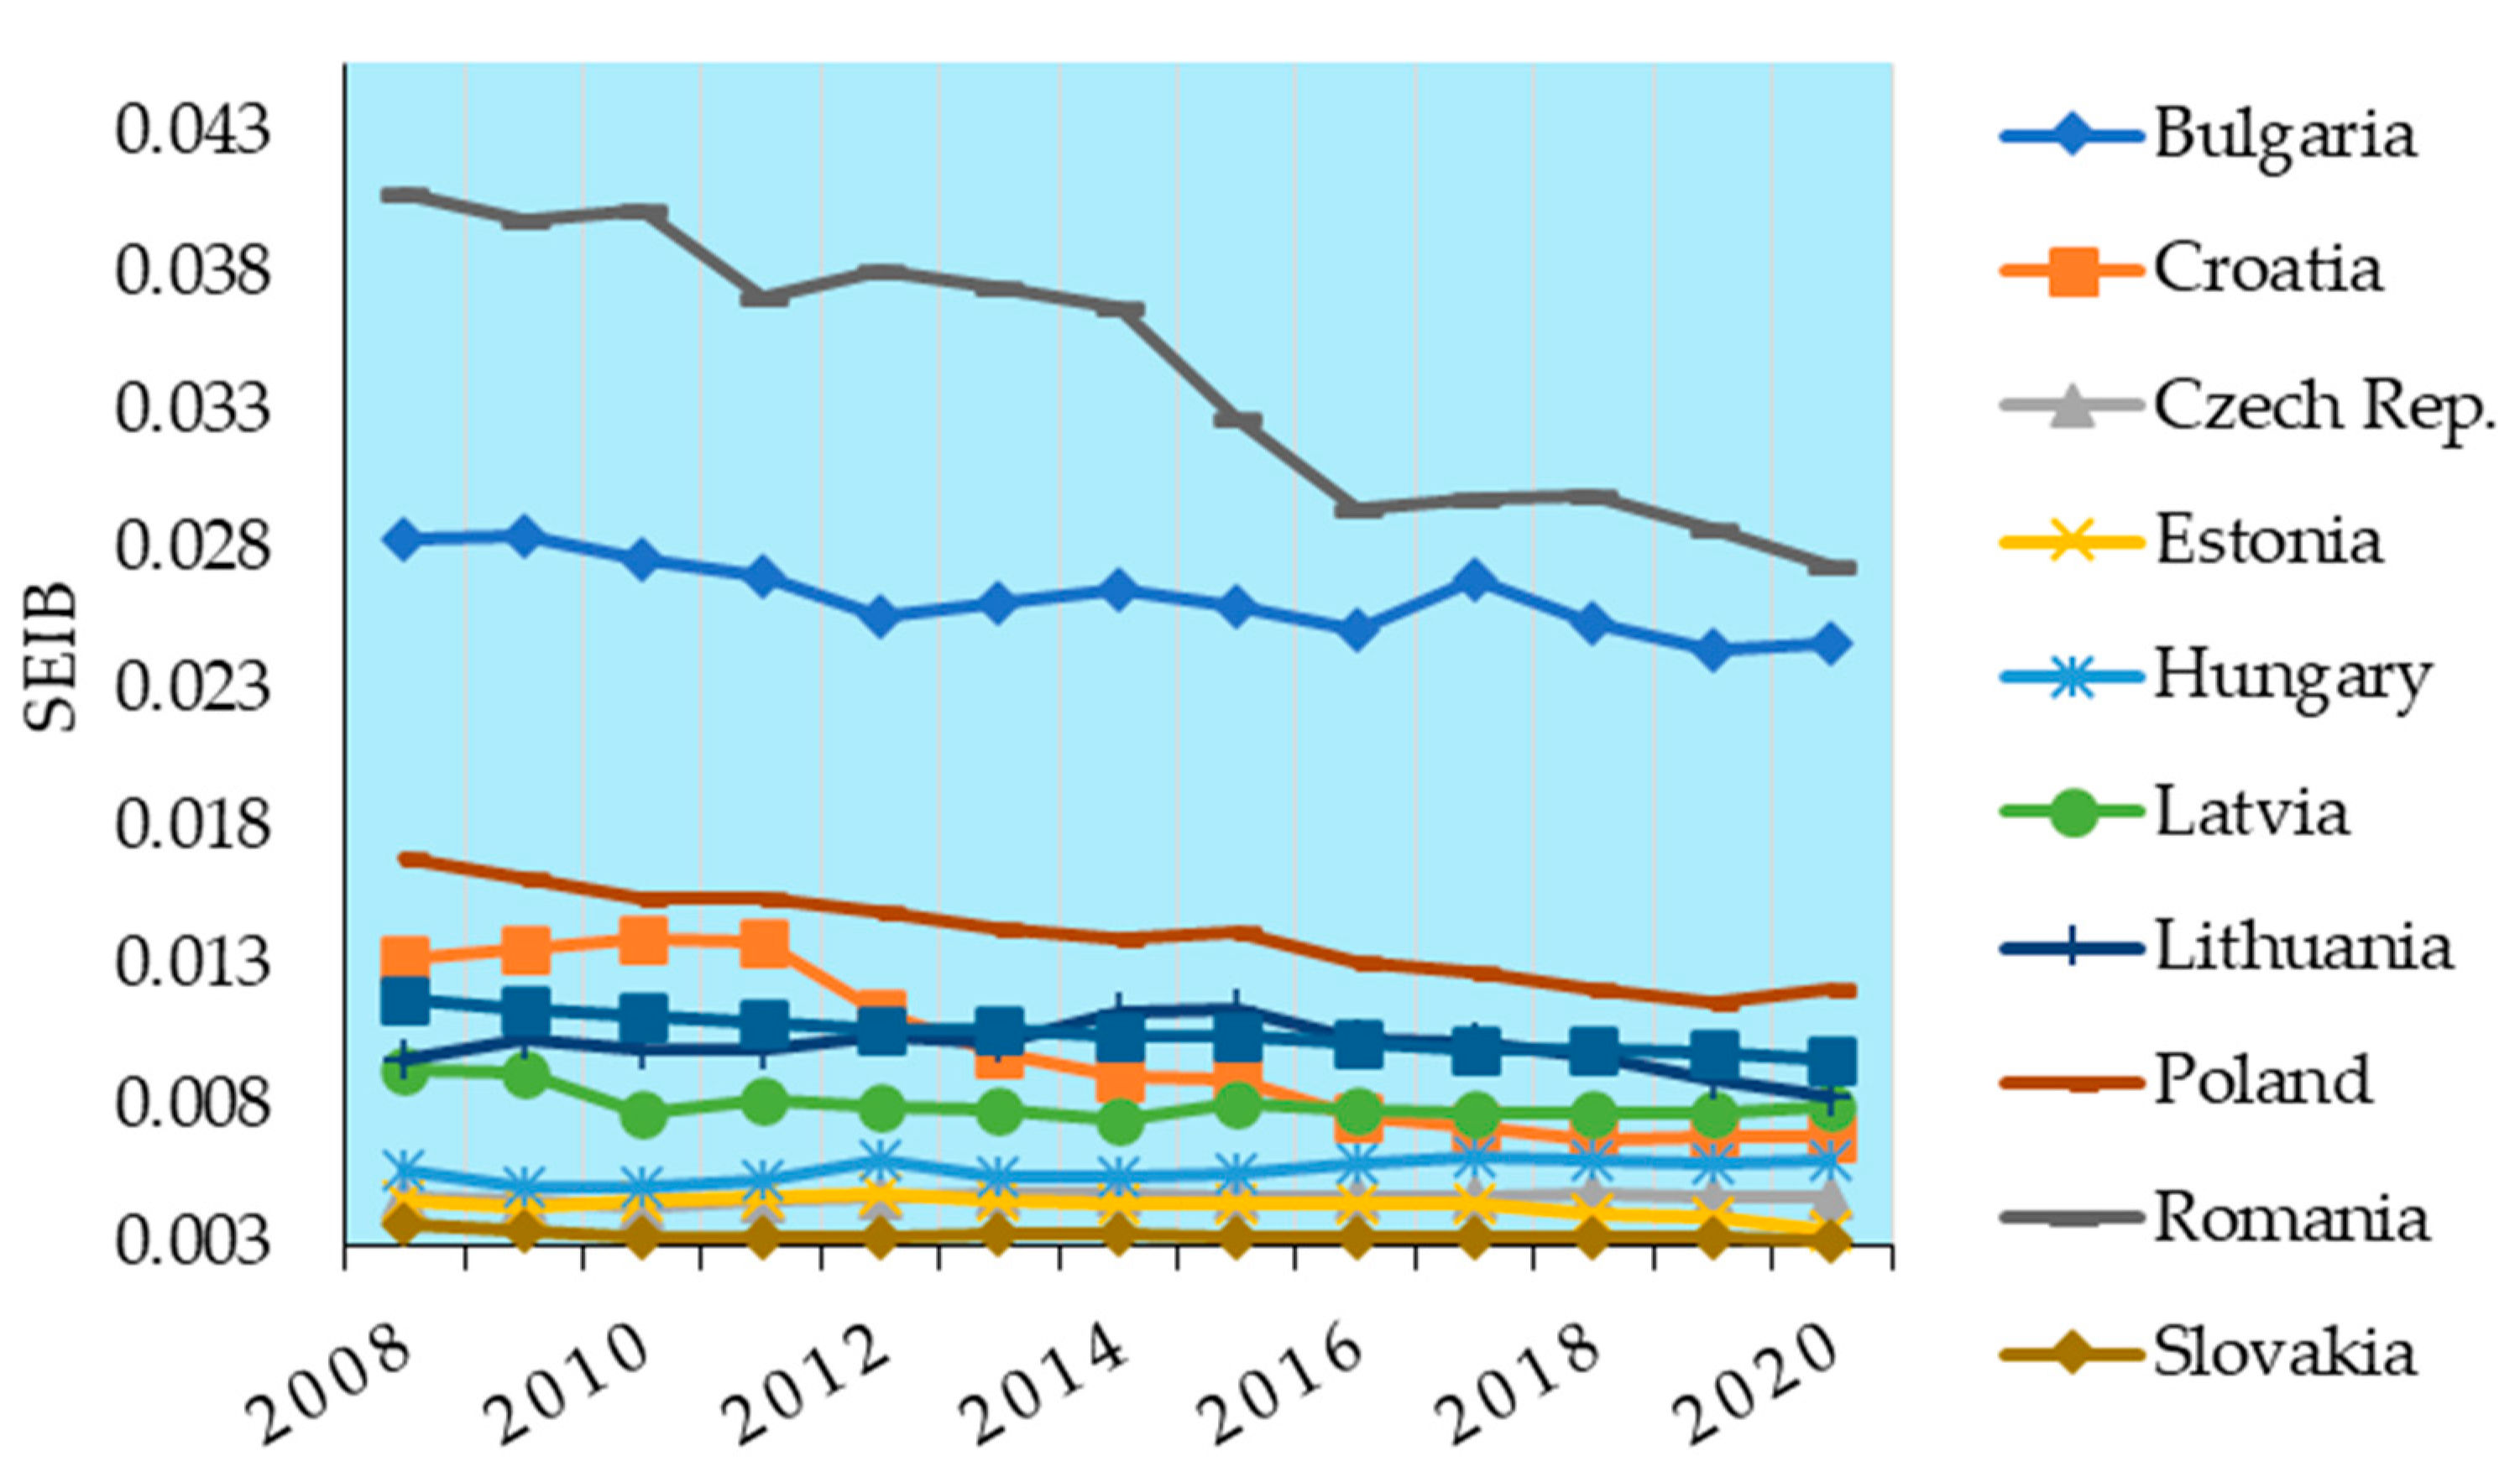
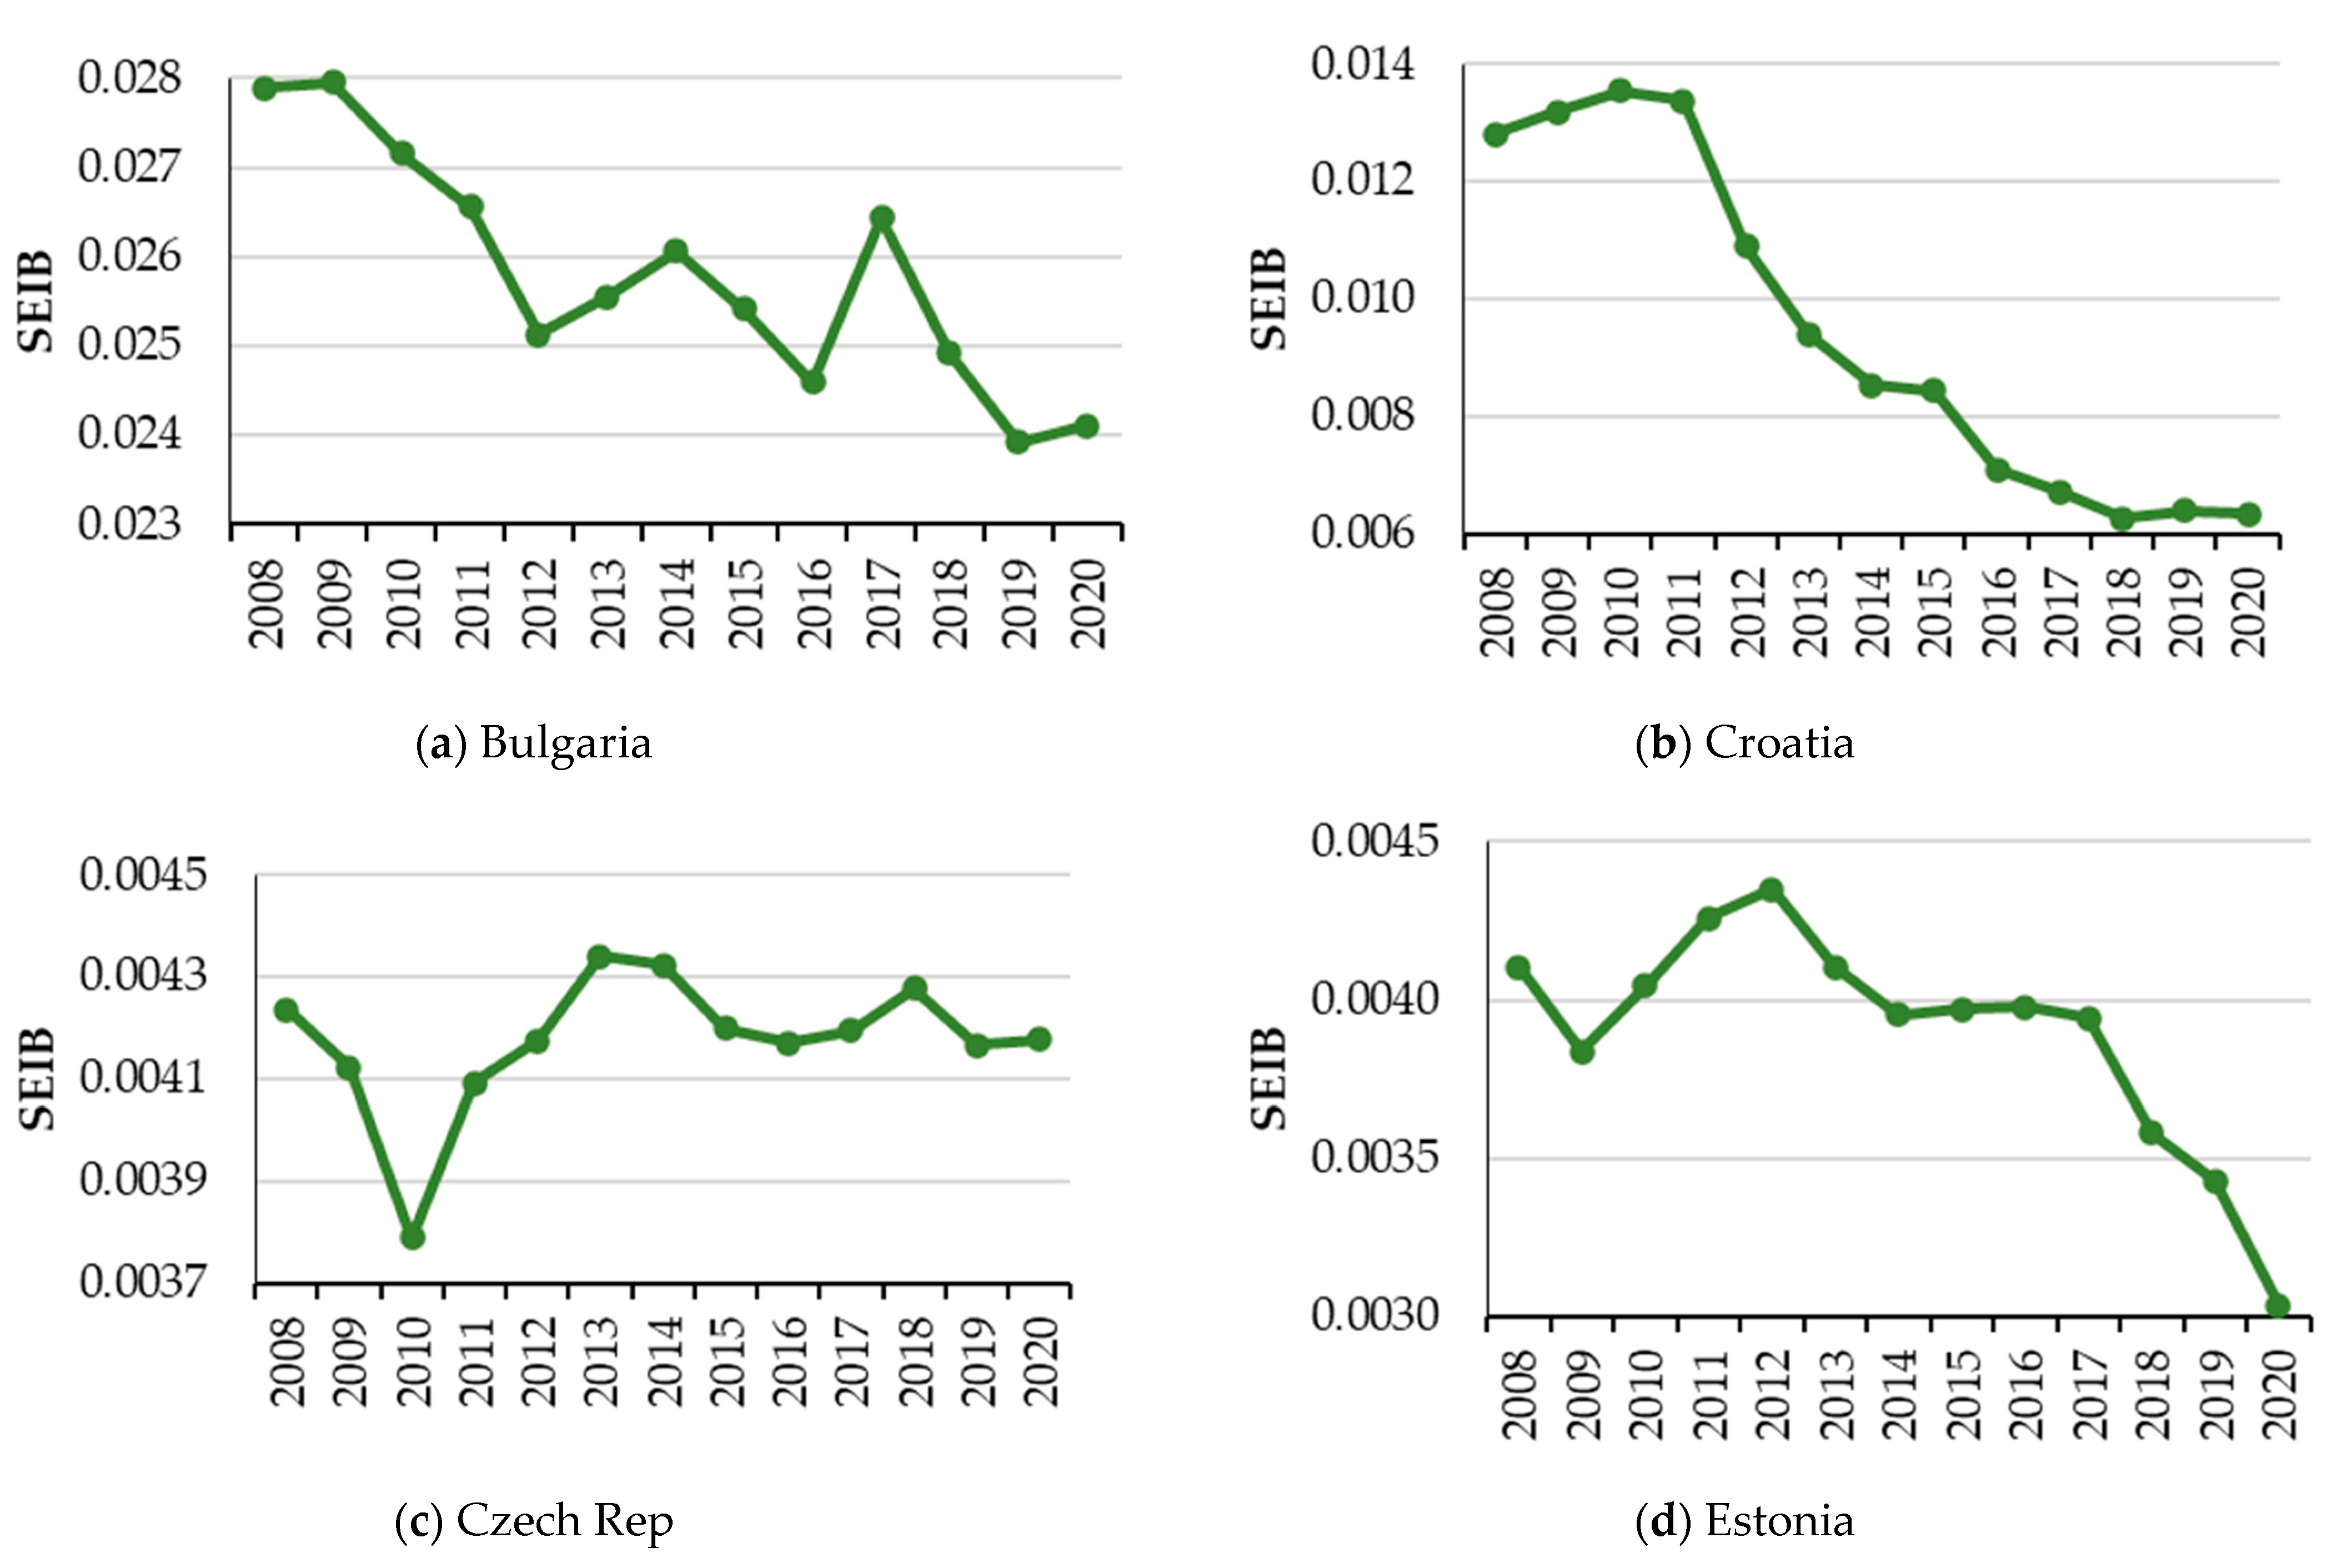
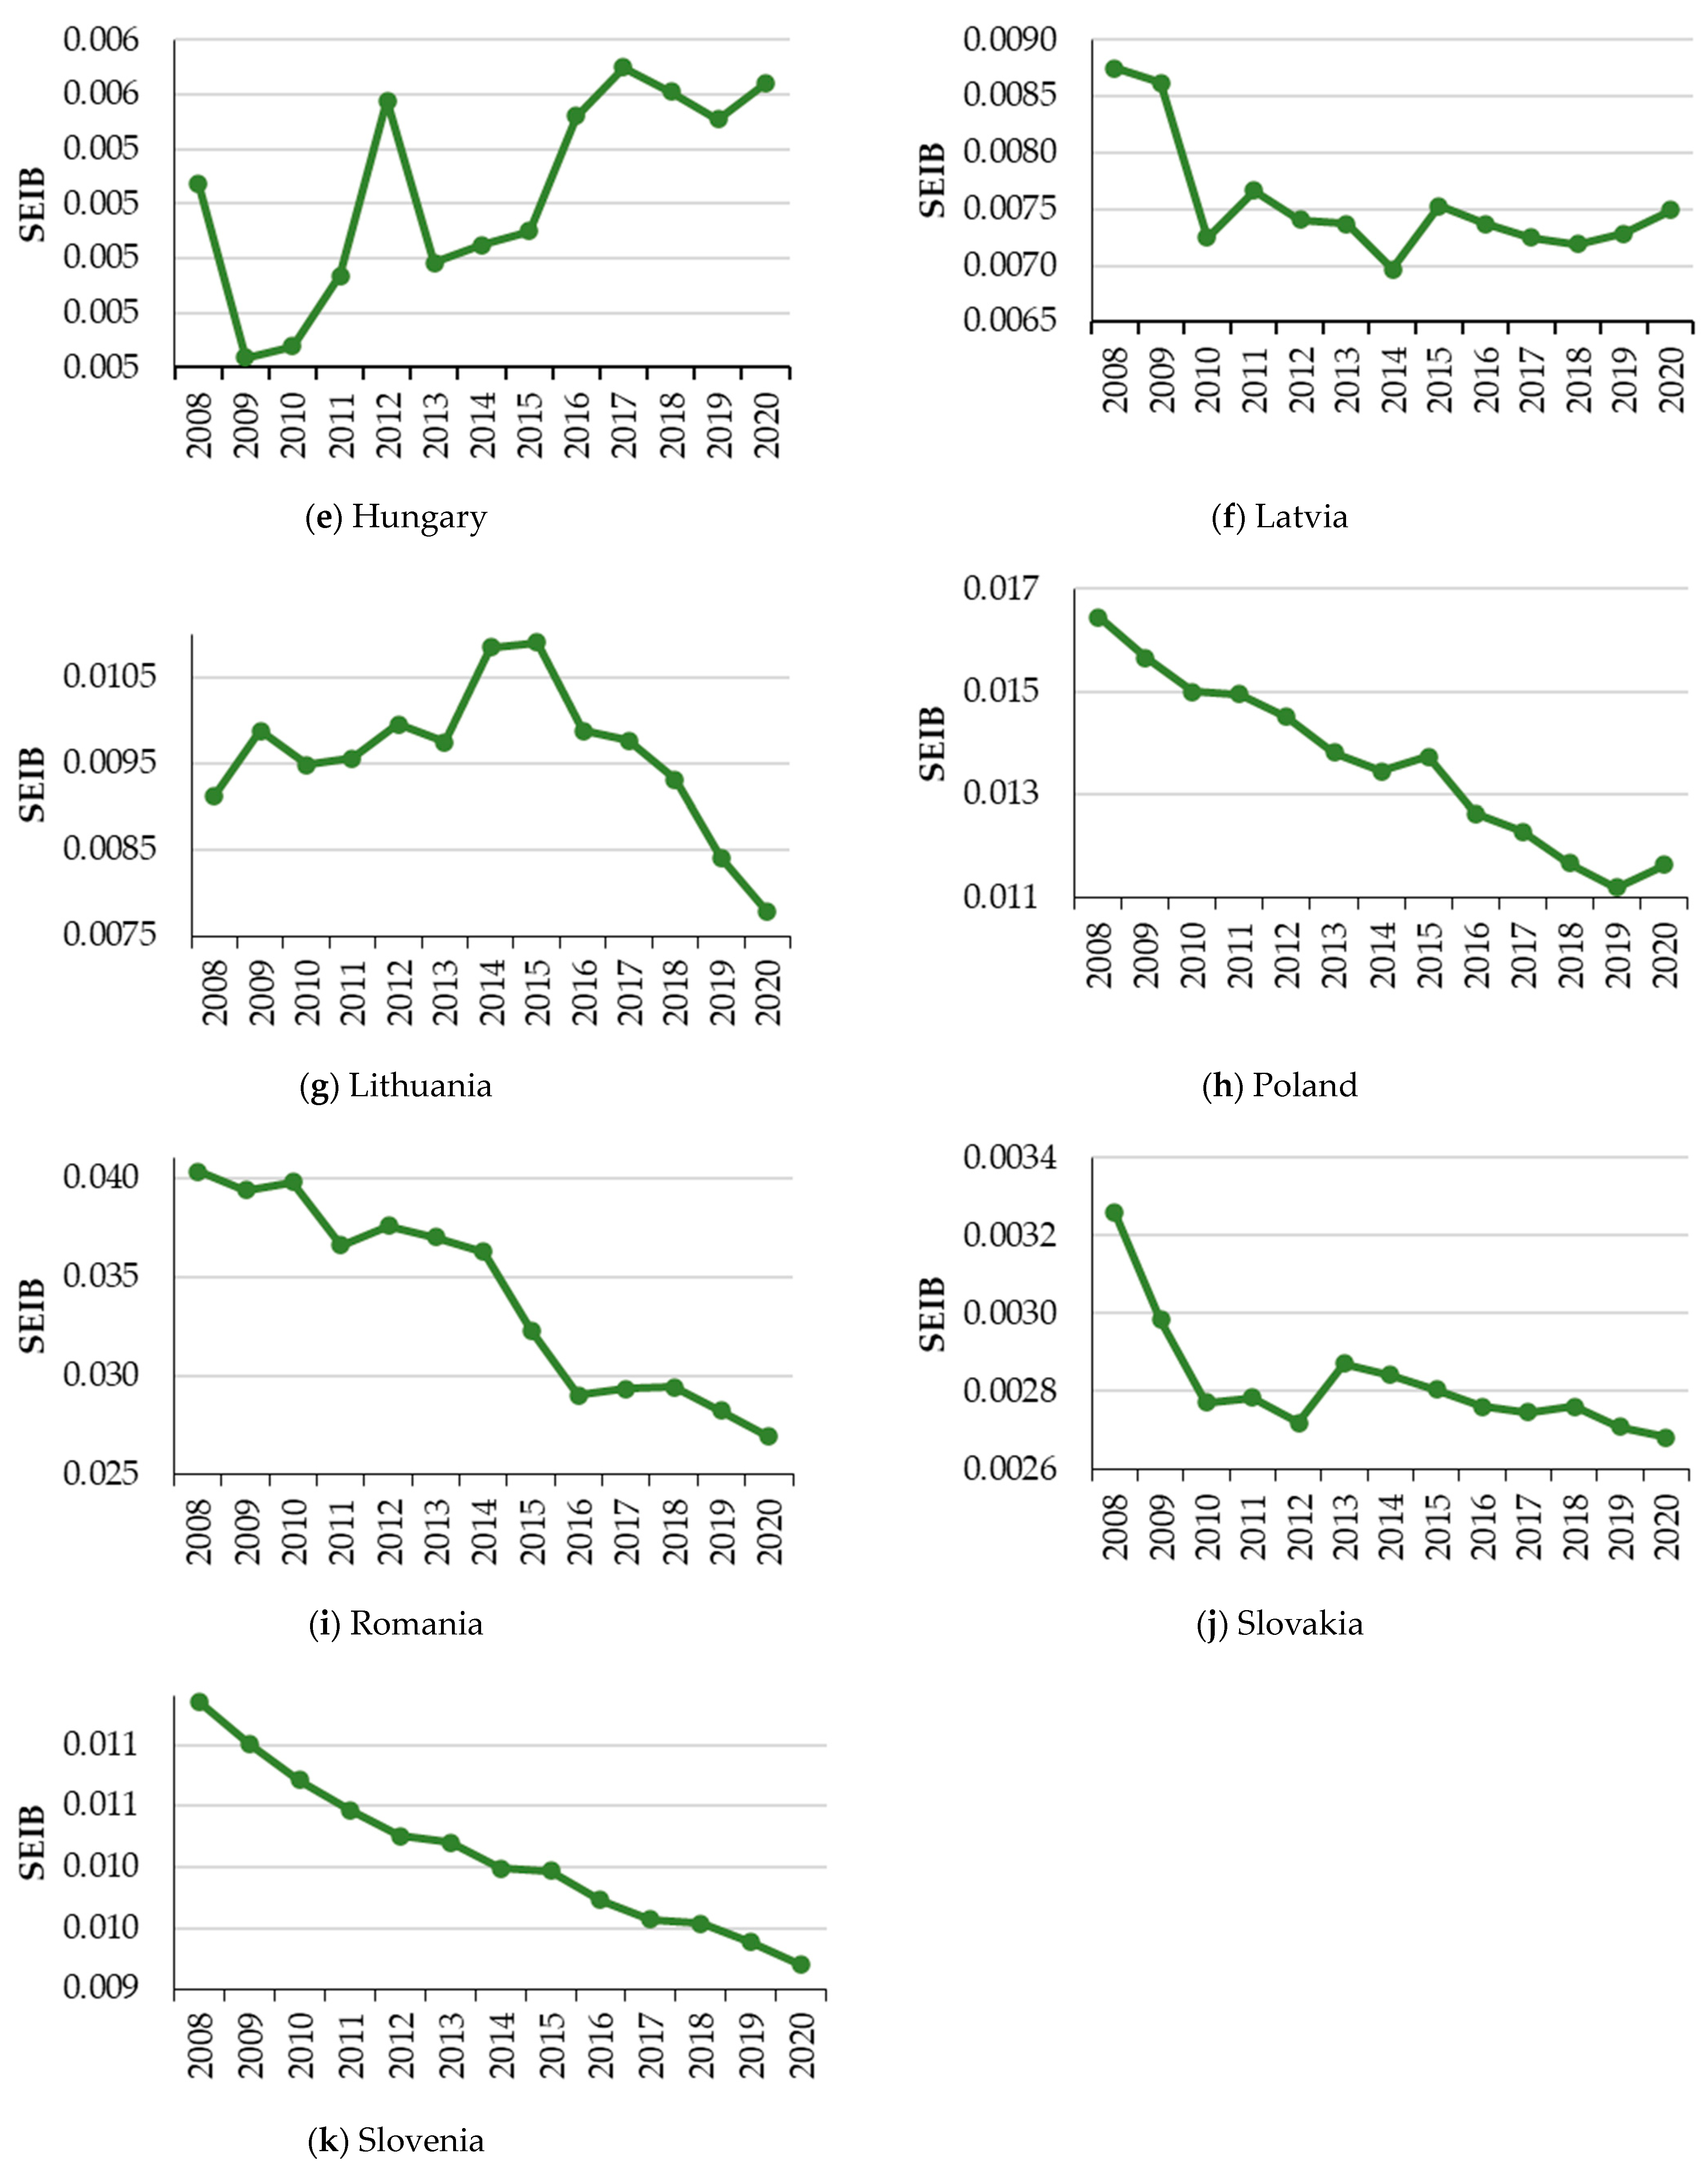
3.2. The Socioeconomic Indicator of Bioeconomy

The SEIB results make us understand even better the clusters that these countries in the region form. We first look at the results from the perspective of the regional average (Figure 4). What we notice first of all is that the average SEIB has an obvious downward trend during recent years. This trend can be based on several reasons, such as the persistent effects of the 2008 crisis, but also the transition to a bio-based economy. We note that, despite the scale that the bioeconomy has reached in recent years, the SEIB has lost a little over a percentage point in a 12-year interval, decreasing to below 0.01 in 2020.
If we take a more in-depth look and analyze the dynamics individually by country, we see that some of them had more linear evolutions than others, and some of them clearly outperformed the average of the region (Appendix B). Romania stands out, with a higher socioeconomic performance of agriculture, but at the same time it exhibits the most accentuated downward trend out of the batch (Figure 5). On the other hand, Bulgaria had a constant dynamic throughout the period. Poland and Croatia also show slightly decreasing dynamics. Interestingly, we find Poland to have lower SEIB values, although it is the largest in terms of arable surface out of the CEECs. These results are in consonance with Spirkova et al.’s [40] findings concerning a comparable index. Based on SEIB values, Hungary is the only CEEC to have improved its socioeconomic performance in the bioeconomy over the study period.
The SEIB index for cluster 1 is depicted in Figure 6. The first cluster is the most numerous one among the three. In this group, the one that stands out is Bulgaria, with a higher value of the index. We emphasize again the evolution from the economic–social point of view of the agriculture of Poland, which is located below Bulgaria, and which follows a downward trend because they had not fully utilized their potential [18]. We note a less pronounced, but nonetheless downward trend in the case of Slovenia. The other members of the cluster had lower values of the index from the beginning. Their clustering suggests the existence of common patterns in the agricultural sector, either from the point of view of similar dynamics or from the point of view of similar social and economic preconditions.
The second cluster surprises with its composition (Figure 7). We find here Romania and Croatia, with a strikingly similar pattern of dynamics, albeit on extremely different levels. Romania leads the SEIB hierarchy in the region, but the index drops precipitously towards the end of the period. This is in line with the findings of Popescu et al. [41], who show that, despite the decline in the population occupied with agriculture, Romania’s performance in agricultural production increased due to technological progress. Several researchers [42,43] also state that Romania is one of the best-performing CEECs in terms of agricultural value added and labor productivity. Croatia shows the same sharp downward trend after the end of the 2008 crisis. It is interesting to see how these two countries experienced a decline in economic–social benefits in agriculture after this turbulent period. It remains unknown for the moment whether this decline was triggered by the crisis or had different structural underpinnings. The two states that make up the second cluster are notable for having the most pronounced decline in the SEIB of any CEECs.
Cluster 3 includes the three Baltic countries. These three countries have similar structures and sizes from an economic point of view. What is more interesting in their case is that their SEIB indices have divergent dynamics. Lithuania had an index with variations, which reached a peak in the period 2013–2015. Latvia exhibits an almost mirrored evolution of the SEIB in agriculture. Estonia seems to have a weaker performance in terms of the economic and social impact of agriculture. In this group, the downward trend of the index is only apparent for Lithuania and Estonia (Figure 8).
As with the other CEECs, the Baltic states require rapid innovation and environmental conservation efforts to improve sustainable land use, water use, and biodiversity [44].
The cluster and SEIB analyses provided answers to our article’s research questions (Table 4), and the main takeaways of the study are summarized in the table below.
Our study addresses the socioeconomic aspects of bioeconomy in agriculture and fills a relevant gap in the literature regarding the CEECs; however, the absence of consistent and reliable data series regarding environmental criteria is a drawback of our investigation. Controlling for this type of factor would allow for comparisons between bio-based products’ and fossil fuels’ impacts on the environment. In line with the conclusions of previous studies [37,45], we support the belief that sustainable washing is not a method for solving problems; instead, comprehensive solutions that take into account all of the components of sustainability must be considered. In this context, agriculture in the CEECs requires a complex approach, incorporating a social, economic, and environmental point of view towards the bioeconomy.

4. Conclusions

This paper took a novel approach to analyzing bioeconomic indicators in the CEECs’ agriculture. The novelty element of our study was the combination of the hierarchical grouping method with that of the SEIB coefficient based on socioeconomic indicators specific to the bioeconomy.
We aimed to find out how the CEECs performed in terms of agriculture indicators. We found that some of them had more linear evolutions than others, and some of them clearly outperformed the average of the region. The cluster analysis divided the countries into three relevant groups. The first group was the most numerous one among the three, including the Visegrad countries (Poland, Czech Republic, Hungary, and Slovakia), Slovenia, and Bulgaria. In the Visegrad countries, agriculture plays an important role in the formation of their economies and bioeconomies [46]. Perhaps the most surprising finding was the composition of the second group, consisting of Romania and Croatia. These countries have variously sized structures of agricultural farms and need major adjustments to their agricultural policies [40]. We found that they exhibited a strikingly similar pattern of dynamics, albeit on extremely different levels. The third group included the Baltic countries, which is intuitive if we think about their social and economic characteristics, as well as the fact that they are of a similar size.
The Romanian SEIB average was twice as high over the observed period as it was for the entire region, but it also showed the group’s most pronounced decreasing tendency. The primary thesis of our research is that the CEECs have great capacity as well as potential for agricultural growth and can contribute eloquently to the advancement of the EU’s bioeconomy [47]. As a result of the findings, Romania, Bulgaria, and Poland have the best agricultural performance among the CEECs overall in terms of the SEIB.
The results of our research show that the similarities between the CEECs are not only determined by the intrinsic characteristics of agriculture, such as labor levels or the sizes of agricultural areas, but also the dynamics of the value of the indicators included in the model (workers, turnover, and value-added). Hence, to successfully promote agriculture as a significant sector of the bioeconomy at a regional level, Romania therefore needs active engagement with all of the BIOEAST members. These results could prove useful for policymakers in establishing a scientific foundation for developing bioeconomy strategies in agriculture, and also in evaluating as well as fostering socioeconomic conditions in bioeconomic agriculture at the national level. Fostering socioeconomic conditions in this sector is beneficial for agriculture stakeholders and the broader agriculture community.
This research is limited by the reduced number of determining parameters of the bioeconomy. Another current limitation of our study is the lack of more granular data that would help us undertake more in-depth investigations at the regional level in the sample countries. Future research should focus on the structural underpinnings of national similarities and variations in order to strengthen the scientific basis for the creation of agricultural bioeconomy strategies. For future research, we intend to use other indicators, such as those of agricultural practices in an ecological system, along with the inclusion of other sectors that are considered among specialists to be 100% organic. This study is the first scientific endeavor to use such an approach and opens the possibility for other researchers to show interest in the field of the bioeconomy.

Author Contributions

Conceptualization, E.M.B. and C.G.Z.; methodology, E.M.B. and C.G.Z.; software, E.M.B., C.G.Z. and C.M.C.; validation, L.M.C., M.I., C.G.Z. and E.M.B.; formal analysis, C.G.Z., E.M.B. and C.M.C.; investigation, C.G.Z. and E.M.B.; resources, C.M.C., E.M.B., and C.G.Z.; data curation, L.M.C., M.I., E.M.B. and C.G.Z.; writing—original draft preparation, C.G.Z. and E.M.B.; writing—review and editing, C.G.Z. and M.I.; visualization, C.G.Z., E.M.B. and C.M.C.; supervision, L.M.C., M.I., C.G.Z. and E.M.B. All authors have read and agreed to the published version of the manuscript.

Funding

This research received no external funding.

Institutional Review Board Statement

Not applicable.

Informed Consent Statement

In developing the research, no personal data were collected, and the subjects were informed that the information provided was strictly for academic purposes.

Data Availability Statement

The datasets presented in this study are available upon reasonable request from the corresponding author.

Conflicts of Interest

The authors declare no conflict of interest.

Appendix A

Table A1. Descriptive statistics.
CountryVariablesRangeMeanStd. DeviationVariance
BulgariaV_1: WKRS0.1311−0.01850.03790.0014
V_2: TO0.3244−0.01300.07670.0059
V_3:VA0.6224−0.00510.15280.0233
CroatiaV_1: WKRS0.2423−0.06540.08460.0071
V_2: TO0.2166−0.02050.05950.0035
V_3:VA0.3217−0.02110.09840.0097
Czech Rep.V_1: WKRS0.1482−0.00110.03750.0014
V_2: TO0.43790.02870.09880.0098
V_3:VA0.50020.03380.13220.0175
EstoniaV_1: WKRS0.1748−0.03080.05560.0031
V_2: TO0.41210.03330.13040.0170
V_3:VA1.19350.01400.32620.1064
HungaryV_1: WKRS0.26520.00260.07470.0056
V_2: TO0.42650.00850.09290.0086
V_3:VA0.57330.01870.12710.0162
LatviaV_1: WKRS0.2715−0.02760.06700.0045
V_2: TO0.34490.03650.09500.0090
V_3:VA0.60040.06040.18550.0344
LithuaniaV_1: WKRS0.2245−0.02860.07060.0050
V_2: TO0.51740.02860.13110.0172
V_3:VA0.75230.04140.23020.0530
PolandV_1: WKRS0.1263−0.03060.03470.0012
V_2: TO0.41690.02120.11140.0124
V_3:VA0.42200.02740.13710.0188
RomaniaV_1: WKRS0.1450−0.03940.04750.0023
V_2: TO0.4919−0.02460.15110.0228
V_3:VA0.5515−0.01840.18010.0324
SlovakiaV_1: WKRS0.1273−0.01650.03170.0010
V_2: TO0.38350.00520.12360.0153
V_3:VA0.7414−0.01480.24320.0591
SloveniaV_1: WKRS0.0227−0.01510.00770.0001
V_2: TO0.26660.01170.07590.0058
V_3:VA0.50790.03250.14850.0220
Source: Own calculation in SPSS.

Appendix B

Figure A1. SEIB dynamics in the CEECs. Source: Created by the authors.
Sustainability 15 16082 g0a1aSustainability 15 16082 g0a1b

References

  1. Gould, H.; Kelleher, L.; O’Neill, E. Trends and policy in bioeconomy literature: A bibliometric review. EFB Bioeconomy J. 2023, 3, 100047. [Google Scholar] [CrossRef]
  2. Cifuentes-Faura, J. European Union policies and their role in combating climate change over the years. Air Qual. Atmos. Health 2022, 15, 1333–1340. [Google Scholar] [CrossRef] [PubMed]
  3. Ronzon, T.; Piotrowski, S.; Tamosiunas, S.; Dammer, L.; Carus, M.; M’barek, R. Developments of economic growth and employment in bioeconomy sectors across the EU. Sustainability 2020, 12, 4507. [Google Scholar] [CrossRef]
  4. Morone, P.; D’Adamo, I.; Cianfroni, M. Inter-connected challenges: An overview of bioeconomy in Europe. Environ. Res. Lett. 2022, 17, 114031. [Google Scholar] [CrossRef]
  5. Hanganu, I.; Fleseriu, C. Good practices for improving promotion and sales for Romanian ecological agricultural products. TJEB 2019, 12, 71–86. [Google Scholar] [CrossRef]
  6. Capasso, M.; Klitkou, A. Socioeconomic Indicators to Monitor Norway’s Bioeconomy in Transition; Nordic Institute for Studies in Innovation, Research and Education: Oslo, Norway, 2020; Available online: http://hdl.handle.net/11250/2640627 (accessed on 10 October 2023).
  7. Berca, M.; Robescu, V.O.; Horoiaş, R.; Păscuţ, G. Wheat nutrition bioeconomic approach, using substituting models of synthetic with natural nitrogen. Agric. Agric. Sci. Proc. 2016, 10, 519–524. [Google Scholar] [CrossRef]
  8. Dinulescu, G.L.; Robescu, V.O.; Radu, F.; Croitoru, G.; Radu, V. A Bioeconomic Solution for Replacing Chemical Fertilizers by Organic Processes for Atmospheric Nitrogen Fixation in Soil. Amfiteatru Econ. 2018, 20, 510–520. [Google Scholar] [CrossRef]
  9. Anca, D.; Strantan, A.; Lucasenco, E.; Gavrilescu, C.; Jonel, S.; Roljević Nikolić, S.; Simonovic, Z.; Harizanova-Metodieva, T.; Metodiev, N.; Tirigan, S.; et al. Agrarian Economy and Rural Development-Realities and Perspectives for Romania, 2019. In Proceedings of the 10th International Symposium Agricultural Economics and Rural Development—Realities and Perspectives for Romania, Bucharest, Romania, 14 November 2019. [Google Scholar]
  10. Vlad, I.M.; Toma, E. The assessment of the bioeconomy and biomass sectors in central and Eastern European Countries. Agronomy 2022, 12, 880. [Google Scholar] [CrossRef]
  11. Rodino, S.; Butu, A.; Dragomir, V.; Butu, M. An analysis regarding the biomass production sector in Romania—A bioeconomy point of view. Sci. Pap. Ser. Manag. Econ. Eng. Agric. Rural. Dev. 2019, 19, 497–502. [Google Scholar]
  12. Avrămescu, T.C. The Current State of Bioeconomy in Romania. Ovid. Univ. Ann. Econom. Sci. Ser. 2020, 20, 113–120. [Google Scholar]
  13. Czyżewski, A.; Grzyb, A.; Matuszczak, A.; Michałowska, M. Factors for Bioeconomy Development in EU Countries with Different Overall Levels of Economic Development. Energies 2021, 14, 3182. [Google Scholar] [CrossRef]
  14. Rozakis, S.; Juvančič, L.; Kovacs, B. Bioeconomy for Resilient Post-COVID Economies. Energies 2022, 15, 2958. [Google Scholar] [CrossRef]
  15. BIOEAST Vision Paper. Available online: https://bioeast.eu/download/bioeast_vision_paper_23022018/ (accessed on 15 May 2023).
  16. Vásáry, V. Knowledge-based agriculture in Central and Eastern European Countries’ bioeconomy. Econ. Environ. Stud. 2019, 19, 137–154. [Google Scholar]
  17. Lasarte-López, J.; M’barek, R.; Ronzon, T.; Tamosiunas, S.J. EU Bioeconomy Monitoring System Indicators Update: Jobs and Value Added in the EU Bioeconomy 2020; Publications Office of the European Union; European Commission, Ed.; European Commission: Brussels, Belgium, 2023. [Google Scholar] [CrossRef]
  18. Ronzon, T.; M’Barek, R. Socioeconomic Indicators to Monitor the EU’s Bioeconomy in Transition. Sustainability 2018, 10, 1745. [Google Scholar] [CrossRef]
  19. Lasarte López, J.; Ronzon, T.; Piotrowski, S.; M’barek, R.; Carus, M.; Tamošiūnas, S. Jobs and Wealth in the EU Bioeconomy/JRC—Bioeconomics; European Commission JRC, Ed.; European Commission JRC: Brussels, Belgium, 2022; Available online: http://rb.gy/ovdzm (accessed on 10 June 2023).
  20. O’Brien, M.; Wechsler, D.; Bringezu, S.; Schaldach, R. Toward a systemic monitoring of the European bioeconomy: Gaps, needs and the integration of sustainability indicators and targets for global land use. Land Use Policy 2017, 66, 162–171. [Google Scholar] [CrossRef]
  21. M’Barek, R.; Parisi, C.; Ronzon, T. Getting (some) numbers right: Derived economic indicators for the bioeconomy. In JRC Conference and Workshop Reports, Proceedings of the Side-Event at the EUBCE, Copenhagen, Denmark, 15 May 2018; European Commission—Joint Research Centre; Publications Office of the European Union: Luxembourg, 2018; Available online: https://core.ac.uk/download/pdf/162257032.pdf (accessed on 20 May 2023).
  22. Bracco, S.; Tani, A.; Çalıcıoğlu, Ö.; Gomez San Juan, M.; Bogdanski, A. Indicators to Monitor and Evaluate the Sustainability of Bioeconomy. Overview and A Proposed Way Forward; FAO Environment and Natural Resource Management Working Paper; FAO: Rome, Italy, 2019; Available online: https://www.fao.org/3/ca6048en/ca6048en.pdf; (accessed on 20 June 2023).
  23. Kardung, M.; Cingiz, K.; Costenoble, O.; Delahaye, R.; Heijman, W.; Lovrić, M.; van Leeuwen, M.; M’Barek, R.; van Meijl, H.; Piotrowski, S.; et al. Development of the Circular Bioeconomy: Drivers and Indicators. Sustainability 2021, 13, 413. [Google Scholar] [CrossRef]
  24. Muizniece, I.; Timma, L.; Blumberga, A.; Blumberga, D. The methodology for assessment of bioeconomy efficiency. Energy Procedia 2016, 95, 482–486. [Google Scholar] [CrossRef]
  25. D’Adamo, I.; Falcone, P.M.; Morone, P. A New Socio-economic Indicator to Measure the Performance of Bioeconomy Sectors in Europe. Ecol. Econ. 2020, 176, 106724. [Google Scholar] [CrossRef]
  26. Nowak, A.; Kobiałka, A.; Krukowski, A. Significance of Agriculture for Bioeconomy in the Member States of the European Union. Sustainability 2021, 13, 8709. [Google Scholar] [CrossRef]
  27. Lori, M.; Symnaczik, S.; Mäder, P.; De Deyn, G.; Gattinger, A. Organic farming enhances soil microbial abundance and activity—A meta-analysis and meta-regression. PLoS ONE 2017, 12, e0180442. [Google Scholar] [CrossRef]
  28. Balkin, R.S.; Lenz, A.S. Contemporary Issues in Reporting Statistical, Practical, and Clinical Significance in Counseling Research. J. Couns Dev. 2021, 99, 227–237. [Google Scholar] [CrossRef]
  29. Gajda, W.; Svazas, M.; Navickas, V. Bioeconomics development in the regions: Lithuanian clustering analysis. AD Alta: Interdiscip. J. Contemp. Res. 2019, 9, 346–353. [Google Scholar]
  30. Sharma, K.K.; Seal, A. Outlier-robust multi-view clustering for uncertain data. Knowl. Based Syst. 2021, 211, 106567. [Google Scholar] [CrossRef]
  31. Anusha, M.; Sathiaseelan, J. Feature selection using k-means genetic algorithm for multi-objective optimization. Procedia Comput. Sci. 2015, 57, 1074–1080. [Google Scholar] [CrossRef]
  32. List, J.A.; Shaikh, A.M.; Xu, Y. Multiple hypothesis testing in experimental economics. Exp. Econ. 2019, 22, 773–793. [Google Scholar] [CrossRef]
  33. Murtagh, F.; Legendre, P. Ward’s hierarchical agglomerative clustering method: Which algorithms implement Ward’s criterion? J. Classif. 2014, 31, 274–295. [Google Scholar] [CrossRef]
  34. Bu, J.; Liu, W.; Pan, Z.; Ling, K. Comparative Study of Hydrochemical Classification Based on Different Hierarchical Cluster Analysis Methods. Int. J. Environ. Res. Public Health 2020, 17, 9515. [Google Scholar] [CrossRef]
  35. M’barek, R.; Philippidis, G.; Suta, C.; Vinyes, C.; Caivano, A.; Ferrari, E.; Ronzon, T.; Sanjuan-Lopez, A.; Santini, F. Observing and analysing the Bioeconomy in the EU: Adapting data and tools to new questions and challenges. Bio-Based Appl. Econ. 2014, 3, 83–91. [Google Scholar]
  36. Babucea, A.G.; Răbonțu, C.I. The State of Adopting CRM Software-Solutions as Part of The Enterprises’ Internal Processes Integration—A Cluster Analysis at the Level of the EU-Member States just Prior to the COVID-19 Pandemic. Constantin Brancusi Univ. Ann. Econom. Ser. 2020, 5, 115–125. [Google Scholar]
  37. D’Adamo, I.; Falcone, P.M.; Imbert, E.; Morone, P. Exploring regional transitions to the bioeconomy using a socio-economic indicator: The case of Italy. Econ. Polit. 2022, 39, 989–1021. [Google Scholar] [CrossRef]
  38. Saaty, T.L. The Analytic Hierarchy Process: Planning, Priority Setting, Resource Allocation; McGraw-Hill International Book Co.: New York, NY, USA; London, UK, 1980; ISBN 978-0070543713. [Google Scholar]
  39. Bălan, E.M. Where is Romania in the European Union’s Bioeconomic Context? The Cluster Analyses Approach. Constantin Brancusi Univ. Ann. Econom. Ser. 2022, 1, 172–184. [Google Scholar]
  40. Spirkova, D.; Stehlikova, B.; Zubkova, M.; Sevela, M.; Stiglic, D. Evaluation of Agriculture’s Economic Role in EU Countries. Ekonomicky Casopis 2017, 65, 763–779. [Google Scholar]
  41. Popescu, A.; Dinu, T.A.; Stoian, E.; Şerban, V. Population occupied in agriculture and agricultural production value in Romania, 2008–2020. Sci. Pap. Ser. Manag. Econ. Eng. Agric. Rural Dev. 2022, 22, 503–514. [Google Scholar]
  42. Csaki, C.; Jambor, A. Convergence or divergence—Transition in agriculture of Central and Eastern Europe and Commonwealth of Independent States revisited. Agric. Econ. Czech 2019, 65, 160–174. [Google Scholar] [CrossRef]
  43. Cismaș, L.M.; Bălan, E.M. Agriculture’s Contribution to the Growth of Romanian Bioeconomy: A Regional Approach. East. Europ. Econ. 2022, 61, 403–419. [Google Scholar] [CrossRef]
  44. von Braun, J.; Mirzabaev, A. The Development of Bioeconomy of the Baltic Region in the Context of Regional and Global Climate Change. Balt. Reg. 2019, 11, 20–35. [Google Scholar] [CrossRef]
  45. Ali, S.M.; Appolloni, A.; Cavallaro, F.; D’Adamo, I.; Di Vaio, A.; Ferella, F.; Gastaldi, M.; Ikram, M.; Kumar, N.M.; Martin, M.A.; et al. Development Goals towards Sustainability. Sustainability 2023, 15, 9443. [Google Scholar] [CrossRef]
  46. Lazorcakova, E.; Dries, L.; Peerlings, J.; Pokrivcak, J. Potential of the Bioeconomy in Visegrad Countries: An Input-Output Approach. Biomass Bioenergy 2022, 158, 106366. [Google Scholar] [CrossRef]
  47. Cismaș, L.M.; Dumitru, C. Investigating Public-Private Partnership’s Potential for Innovation in the Romanian Agriculture. Fostering Recovery through Metaverse Business Modelling. In Proceedings of the 5th International Conference on Economics and Social Sciences, Bucharest University of Economic Studies, Bucharest, Romania, 16–17 June 2022; pp. 19–29. [Google Scholar]
Figure 1. Map of CEECs. Source: created by the authors with mapchart.net (accessed on 28 October 2023).
Sustainability 15 16082 g001
Figure 2. The dendrogram of hierarchical clustering using Ward linkage. Source: Own processing in SPSS.
Sustainability 15 16082 g002
Figure 3. Grouping of CEECs based on a cluster hierarchical analysis. Source: Own processing based on SPSS output.
Sustainability 15 16082 g003
Figure 4. SEIB average for the Central and Eastern region. Source: Own processing.
Sustainability 15 16082 g004
Figure 5. SEIB dynamics for all countries. Source: Own processing.
Sustainability 15 16082 g005
Figure 6. SEIB dynamics of the first cluster. Source: Own processing.
Sustainability 15 16082 g006
Figure 7. SEIB dynamics of the second cluster. Source: Own processing.
Sustainability 15 16082 g007
Figure 8. SEIB dynamics of the third cluster. Source: Own processing.
Sustainability 15 16082 g008
Table 1. The average bioeconomy main statistics from 2008 to 2020.
CountryV_1: WKRS 1V_2: TO 2V_3: VA 3
Bulgaria639,9564302.51706.8
Croatia134,0022679.71232.4
Czech Republic139,4987392.92693.5
Estonia16,448840.4265.9
Hungary159,9759054.63894.2
Latvia50,6781371.5438.9
Lithuania93,7652801.61029.7
Poland1,745,83127,187.09821.7
Romania2,325,07714,746.06976.4
Slovakia48,2212671.91076.0
Slovenia69,6581293.3510.9
1 WKRS—persons employed (thousand persons). 2 TO—turnover (billion EUR). 3 VA—value added at factor cost (billion EUR). Source: Own calculations based on Lasarte López et al. [16].
Table 2. Descriptive statistics by cluster.
Cluster NumberVariableV_1: WKRSV_2: TOV_3:VA
1N *727272
Mean−0.01320.01040.0154
Std. deviation0.04220.09550.1571
Variance0.00180.00910.0247
2N242424
Mean−0.0524−0.1226−0.0198
Std. deviation0.06840.11230.1420
Variance0.00470.01260.0202
3N363636
Mean−0.02900.03280.0386
Std. deviation0.06290.11660.2764
Variance0.00400.01360.0613
* Number of observations. Source: Own calculation in SPSS output.
Table 3. ANOVA.
Table 3. ANOVA.
Cluster NumberVariableSSdfMSFp-ValueF Crit
1V_1: WKRS0.008950.00181.00320.42292.3538
V_2: TO0.012450.00250.25780.93442.3538
V_3:VA0.025450.00510.19430.96372.3538
2V_1: WKRS0.004010.00400.85950.36394.3009
V_2: TO0.000110.00010.00760.93114.3009
V_3:VA0.000010.00000.00200.96454.3009
3V_1: WKRS0.000120.00000.00760.99243.2849
V_2: TO0.000420.00020.01300.98703.2849
V_3:VA0.013120.00650.10140.90393.2849
SS—sum of squares. df—degrees of freedom. MS—mean squares. F—ratio between MS value of subject and MS of residual. p-value—probability value. F Crit – value of F at the threshold of rejecting the null hypothesis. Source: Own calculation in SPSS.
Table 4. The correlation between the research questions and study findings.
No.Research QuestionAnswer
1Which CEEC has the best socioeconomic performance in terms of agriculture?Romania is the best-performing country in CEE, with the highest SEIB values for V_1, V_2, and V_3.
2Where does Romania stand among the CEECs?During the time frame under consideration, the Romanian SEIB average was double that of the region’s. This puts Romania in a distinct position compared to the rest of the countries in the region. This position may be based on economic and social underpinnings that deserve to be studied in detail.
3What countries present similarities regarding specific selected indicators?The Romanian unprocessed variables (V_1, V_2, and V_3) are quite comparable with those of Poland. Due to the relatively high volatility of the variables during the investigated period (2008–2012), Romania’s socioeconomic performance generated by the SEIB coefficient is closer to that of Croatia’s.
Source: Own processing.
Disclaimer/Publisher’s Note: The statements, opinions and data contained in all publications are solely those of the individual author(s) and contributor(s) and not of MDPI and/or the editor(s). MDPI and/or the editor(s) disclaim responsibility for any injury to people or property resulting from any ideas, methods, instructions or products referred to in the content.

