


Accessibility of Public Sector Institutions for People with Special Needs in Polish Regions
 , ,
, ,
Abstract
:1. Introduction
2. Materials and Methods
Group 4: <max-3k, min)
- max—the highest value of the synthetic measure;
- min—the lowest value of the synthetic measure;
- k = range/number of groups.
- ni—size of cluster I;
- nj—size of cluster j;
- nk—size of cluster k;
- dik—distance between original cluster i and cluster k;
- djk—distance between original cluster j and cluster k;
- dij—distance between original cluster i and original cluster j.
3. Results and Discussion
4. Summary and Conclusions
Author Contributions
Funding
Institutional Review Board Statement
Informed Consent Statement
Data Availability Statement
Conflicts of Interest
References
- Jenson, J. Defining and Measuring Social Cohesion. In Commonwealth Secretariat; UN Research Institute for Social Development: Washington, DC, USA, 2010. [Google Scholar]
- Silver, H. The Contexts of Social Inclusion; DESA Working Paper 144; UN/DESA: New York, NY, USA, 2015. [Google Scholar] [CrossRef]
- Ritzen, J.; Woolcock, M. Social Cohesion, Public Policy and Economic Growth: Implications for Countries (English); World Bank Group: Washington, DC, USA, 2000. [Google Scholar]
- Carlsson, G.; Slaug, B.; Schmidt, S.M.; Norin, L.; Ronchi, E.; Gefenaite, G. A scoping review of public building accessibility. Disabil. Health J. 2022, 15, 101227, ISSN 1936-6574. [Google Scholar] [CrossRef]
- Noh, K.R.; Jeong, E.S.; You, Y.B. A study on the current status and strategies for improvement of web accessibility compliance of public institutions. J. Open Innov. 2015, 1, 4. [Google Scholar] [CrossRef]
- Gupta, A.; Singla, M.; Bhatia, H. Lockdown—The only solution to defeat COVID-19. Int. J. Diabetes Dev. Ctries. 2020, 40, 310–311. [Google Scholar] [CrossRef] [PubMed]
- Green, J.K.; Burrow, M.S.; Carvalho, L. Designing for Transition: Supporting Teachers and Students Cope with Emergency Remote Education. Postdigit Sci. Educ. 2020, 2, 906–922. [Google Scholar] [CrossRef]
- Cuerdo-Vilches, T.; Navas-Martín, M.Á.; Oteiza, I. Working from Home: Is Our Housing Ready? Int. J. Environ. Res. Public Health 2021, 18, 7329. [Google Scholar] [CrossRef]
- Radovanović, D. The Internet and digital divide in South Eastern Europe: Connectivity does not end the digital divide, skills do. In The Digital Divide. The Internet and Social Inequality in International Perspective; Ragnedda, M., Muschert, G.W., Eds.; Routledge: London, UK; New York, NY, USA, 2013. [Google Scholar]
- Riggins, F.J.; Sanjeev, D. The Digital Divide: Current and Future Research Directions. J. Assoc. Inf. Syst. 2005, 6, 298–337. [Google Scholar] [CrossRef]
- The Net Result: Social Inclusion in the Information Society. In Report of the National Working Party on Social Inclusion in the Information Society; Community Development Foundation, IBM: London, UK, 1996.
- Grodzka, D. Społeczeństwo informacyjne—Idea, programy, badania. In Społeczeństwo Informacyjne; No 3; Grodzka, D., Ed.; Studia BAS: Warsaw, Poland, 2009. [Google Scholar]
- Kasprzyk, B. Social Exclusion and the Digital in Poland Compared to the European Union. Nierówności Społeczne Wzrost Gospod. 2015, 44, 152–164. [Google Scholar] [CrossRef]
- Stolarczyk, A. Digital Exclusion—Choice or Inevitability? Poland Against the European Union. Ekon. Probl. Usług 2018, 131, 301–310. [Google Scholar] [CrossRef]
- Ćwiek, M. Digital Divide in Poland and in the European Union. Ekon. Probl. Usług 2018, 131, 217–224. [Google Scholar] [CrossRef]
- Jedlińska, R. Digital Exclusion in Poland Compared to the European Union Countries. Ekon. Probl. Usług 2018, 131, 225–236. [Google Scholar] [CrossRef]
- Stanimir, A. Measurement of the digital divide—Risks for Generation Y. Res. Pap. Wrocław Univ. Econ. 2016, 426, 194–205. [Google Scholar] [CrossRef]
- van Dijk, J.A.G.M. A Theory of the digital divide. In The Digital Divide; Ragnedda, M., Muschert, G., Eds.; Routledge: London, UK; New York, NY, USA, 2013. [Google Scholar]
- Van Dijk, J.A.G.M. The Network Society, 2nd ed.; Sage Publications: London, UK, 2006. [Google Scholar]
- Van Dijk, J.A.G.M. The Deepening Divide, Inequality in the Information Society; Sage: London, UK, 2005. [Google Scholar]
- Batorski, D. Wykluczenie cyfrowe w Polsce. In Społeczeństwo Informacyjne; No 3; Grodzka, D., Ed.; Studia BAS: Warsaw, Poland, 2009. [Google Scholar]
- Fisk, R.P.; Gallan, A.S.; Joubert, A.M.; Beekhuyzen, J.; Cheung, L.; Russell-Bennett, R. Healing the Digital Divide with Digital Inclusion: Enabling Human Capabilities. J. Serv. Res. 2022, 26, 542–559. [Google Scholar] [CrossRef]
- Várallyai, L.; Herdon, M.; Botos, S. Statistical analyses of digital divide factors. Procedia Econ. Financ. 2015, 19, 364–372. [Google Scholar] [CrossRef]
- Holgersson, J.; Söderström, E. Bridging the Gap—Exploring Elderly Citizens’ Perceptions of Digital Exclusion. In Proceedings of the 27th European Conference on Information Systems (ECIS), Stockholm & Uppsala, Sweden, 8–14 June 2019; ISBN 978-1-7336325-0-8. Research Papers. Available online: https://aisel.aisnet.org/ecis2019_rp/28 (accessed on 1 June 2023).
- Antonio, A.; Tuffley, D. The Gender Digital Divide in Developing Countries. Future Internet 2014, 6, 673–687. [Google Scholar] [CrossRef]
- Cooper, J. The digital divide: The special case of gender. J. Comput. Assist. Learn. 2006, 22, 320–334. [Google Scholar] [CrossRef]
- Cruz-Jesus, F.; Vicente, M.R.; Bacao, F.; Oliveira, T. The education-related digital divide: An analysis for the EU-28. Comput. Human Behav. 2016, 56, 72–82. [Google Scholar] [CrossRef]
- Billon, M.; Crespo, J.; Lera-Lopez, F. Do educational inequalities affect Internet use? An analysis for developed and developing countries. Telemat. Inform. 2021, 58, 101521. [Google Scholar] [CrossRef]
- Choi, N.G.; DiNitto, D.M. The digital divide among low-income homebound older adults: Internet use patterns, eHealth literacy, and attitudes toward computer/Internet use. J. Med. Internet Res. 2013, 15, e93. [Google Scholar] [CrossRef]
- Stojanović, A.; Radić, A.; Arsic, S.; Milośević, I. Investigating digital divide in European rural areas as a barrier to knowledge sharing. In Proceedings of the 4th Virtual International Conference Path to a Knowledge Society-Managing Risks and Innovation PaKSoM 2022, Niš, Serbia, 8–9 December 2022. [Google Scholar] [CrossRef]
- Pick, J.B.; Sarkar, A. Geographies of global digital divides. In Geographies of the Internet, 1st ed.; Warf, B., Ed.; Routledge: London, UK, 2020. [Google Scholar] [CrossRef]
- Ministerstwo Funduszy i Polityki Regionalnej. Raport o Stanie Zapewniania Dostępności Osobom ze Szczególnymi Potrzebami Przez Podmioty Publiczne w Polsce; Ministerstwo Funduszy i Polityki Regionalnej: Warsaw, Poland, 2021. [Google Scholar]
- Caldwell, B.; Cooper, M.; Reid, L.G.; Vanderheiden, G.; Chisholm, W.; Slatin, J.; White, J. Web content accessibility guidelines (WCAG) 2.0. WWW Consort. (W3C) 2008, 290, 1–34. [Google Scholar]
- Kulkarni, M. Digital accessibility: Challenges and opportunities. IIMB Manag. Rev. 2019, 31, 91–98. [Google Scholar] [CrossRef]
- Inal, Y.; Guribye, F.; Rajanen, D.; Rajanen, M.; Rost, M. Perspectives and practices of digital accessibility: A survey of user experience professionals in Nordic countries. In Proceedings of the 11th Nordic Conference on Human-Computer Interaction: Shaping Experiences, Shaping Society, Tallinn, Estonia, 1 October 2020. [Google Scholar]
- López Baldominos, I.; Pospelova, V.; Fernández Sanz, L.; Castillo-Martínez, A. Accessibility of Digital Content in Europe: Users’ Perspective. In Advances in Information Systems Development: Crossing Boundaries between Development and Operations in Information Systems; Springer International Publishing: Cham, Switzerland, 2022; pp. 37–52. [Google Scholar]
- Botelho, F.H. Accessibility to digital technology: Virtual barriers, real opportunities. Assist. Technol. 2021, 33 (Suppl. S1), 27–34. [Google Scholar] [CrossRef]
- Roszewska, K. Geographic Information Systems and accessibility for persons with disabilities. GIS Odyssey J. 2021, 1, 21–29. [Google Scholar]
- Radaković, K.; Radaković, M.; Protić-Gava, B. Accessibility to public institution facilities for people with disabilities in Novi Sad-European capital of culture 2021. Facta Univ. Ser. Archit. Civ. Eng. 2019, 17, 45–55. [Google Scholar] [CrossRef]
- Tsatsou, P. Vulnerable people’s digital inclusion: Intersectionality patterns and associated lessons. Inf. Commun. Soc. 2022, 25, 1475–1494. [Google Scholar] [CrossRef]
- Mishna, F.; Milne, E.; Bogo, M. Responding to COVID-19: New Trends in Social Workers’ Use of Information and Communication Technology. Clin. Soc. Work. J. 2021, 49, 484–494. [Google Scholar] [CrossRef]
- Gibson, A.; Bardach, S.H.; Pope, N.D. COVID-19 and the Digital Divide: Will Social Workers Help Bridge the Gap? J. Gerontol. Social. Work. 2020, 63, 671–673. [Google Scholar] [CrossRef] [PubMed]
- Słobodzian, B. Zmiany w funkcjonowaniu administracji publicznej w Polsce w czasie epidemii COVID-19. Stud. Politol. 2022, 64, 66–75. [Google Scholar]
- Oliveira, A.D.A.; Freire, A.P.; Eler, M.M. Web accessibility evolution in the Brazilian government. In Proceedings of the XVI Brazilian Symposium on Information Systems, Rio de Janeiro, Brazil, 3 November 2020; pp. 1–8. [Google Scholar] [CrossRef]
- Oliveira, A.; Souza, E. Accessibility model in electronic government: Evaluation of Brazilian web portals. In Proceedings of the Anais do XIII Simpósio Brasileiro de Sistemas de Informação, Rio de Janeiro, Brazil, 5–8 June 2017; pp. 332–339. [Google Scholar]
- Malina, A. Analiza przestrzennego zróżnicowania poziomu rozwoju społeczno-gospodarczego województw Polski w latach 2005–2017. Soc. Inequal. Econ. Growth 2020, 61, 138–155. [Google Scholar] [CrossRef]
- ISAP. Ustawa z Dnia 4 Kwietnia 2019 r. o Dostępności Cyfrowej Stron Internetowych i Aplikacji Mobilnych Podmiotów Publicznych (Dz. U. 2019 Poz. 848); ISAP: Warsaw, Poland, 2019. [Google Scholar]
- ISAP. Ustawa z Dnia 19 Lipca 2019 r. o Zapewnianiu Dostępności Osobom ze Szczególnymi Potrzebami (Dz. U. 2020 poz. 1062); ISAP: Warsaw, Poland, 2019. [Google Scholar]
- Hwang, C.L.; Yoon, K. Multiple Attribute Decision Making: Methods and Applications. In Lecture Notes in Economics and Mathematical Systems, LNE 186; Springer: Berlin/Heidelberg, Germany, 1981. [Google Scholar]
- Łuczak, A.; Kalinowski, S. Assessing the level of the material deprivation of European Union countries. PLoS ONE 2020, 15, e0238376. [Google Scholar] [CrossRef]
- Bąk, I.; Wawrzyniak, K.; Oesterreich, M. Competitiveness of the Regions of the European Union in a Sustainable Knowledge-Based Economy. Sustainability 2022, 14, 3788. [Google Scholar] [CrossRef]
- Galik, A.; Bąk, M.; Bałandynowicz-Panfil, K.; Cirella, G.T. Evaluating Labour Market Flexibility Using the TOPSIS Method: Sustainable Industrial Relations. Sustainability 2022, 14, 526. [Google Scholar] [CrossRef]
- Młodak, A. Analiza Taksonomiczna w Statystyce Regionalnej; Difin: Warsaw, Poland, 2006. [Google Scholar]
- Stanisz, A. Przystępny Kurs Statystyki, 3rd ed.; Statsoft Polska: Kraków, Poland, 2007. [Google Scholar]
- Balicki, A. Statystyczna Analiza Wielowymiarowa i Jej Zastosowania Społeczno-Ekonomiczne; Uniwersytet Gdański: Gdańsk, Poland, 2013. [Google Scholar]
- Zeliaś, A. Taksonomiczna Analiza Przestrzennego Zróżnicowania Poziomu Życia w Polsce w Ujęciu Dynamicznym; Wyd. Akademii Ekonomicznej w Krakowie: Kraków, Poland, 2000. [Google Scholar]
- Wpływ Potencjału Demograficznego i Gospodarczego Miast Wojewódzkich na Kondycję Województw; Mazowiecki Ośrodek Badań Regionalnych, Urząd Statystyczny: Warsaw, Poland, 2013.


| Physical Standards of Accessibility (Expected) | |
|---|---|
| 1 | barrier-free horizontal and vertical navigation indoors |
| 2 | use of fixtures, fittings, aids, equipment and architectural measures that enable free access to all rooms in the building (with the exception of service rooms) |
| 3 | information on the room layout in the building—visual and tactile or audio- (voice-) based at minimum |
| 4 | allowing entry to persons with guide dogs |
| 5 | ensuring evacuation procedures or other means of rescue for persons with special needs |
| Digital Standards of Accessibility (Expected) | |
|---|---|
| 1 | a Public Information Bulletin website for the entity |
| 2 | incorporation of the following components and features on the website and/or mobile app:
|
| ICT Standards of Accessibility (Expected) | |
|---|---|
| 1 | service that includes communication aids (sign language and other means of communication) and/or remote (online) access to a translation service via websites and apps, i.e., the entity must support contact via phone, electronic mail, SMS/MSS text messages, online instant messaging software, etc., through audiovisual communication, including by means of online instant messaging software, fax communication, sign language translation–face-to-face, online, or a sign-language interpreter |
| 2 | use of equipment or other technological measures to accommodate the hard of hearing (induction loops, FM systems, IR systems, and/or other equipment/systems) |
| 3 | a “what we do” notice on the website in machine-readable text, in Polish Sign Language (video recording) and in easily readable text |
| 4 | if a person with special needs so requests—providing communication via the requested means |
| No. | Variable | Aspect |
|---|---|---|
| 1 | Percentage of public entities maintaining a website (by voivodeship) | (2) |
| 2 | Percentage of public entities providing a mobile app (by voivodeship) | (2) |
| 3 | Percentage of public entities providing an accessibility statement for all websites (by voivodeship) | (2) |
| 4 | Percentage of public entities providing an accessibility statement for all mobile apps provided (by voivodeship) | (2) |
| 5 | Percentage of websites and mobile apps fully compliant with the accessibility requirements set out in the Digital Accessibility Act (by voivodeship) | (3) |
| 6 | Percentage of public entities with barrier-free access on their premises (by voivodeship) | (1) |
| 7 | Percentage of public entities providing room layout information on their premises (by voivodeship) | (1) |
| 8 | Percentage of public entities allowing entry with guide dogs (by voivodeship) | (3) |
| 9 | Percentage of public entities providing a Polish Sign Language translator on their websites/mobile apps (by voivodeship) | (3) |
| 10 | Percentage of public entities providing a Polish Sign Language translator for face-to-face communication (by voivodeship) | (3) |
| 11 | Percentage of public entities providing a “what we do” notice in machine-readable text on their websites (by voivodeship) | (3) |
| 12 | Percentage of public entities providing a “what we do” notice in ETR (easy-to-read) text on their websites (by voivodeship) | (3) |
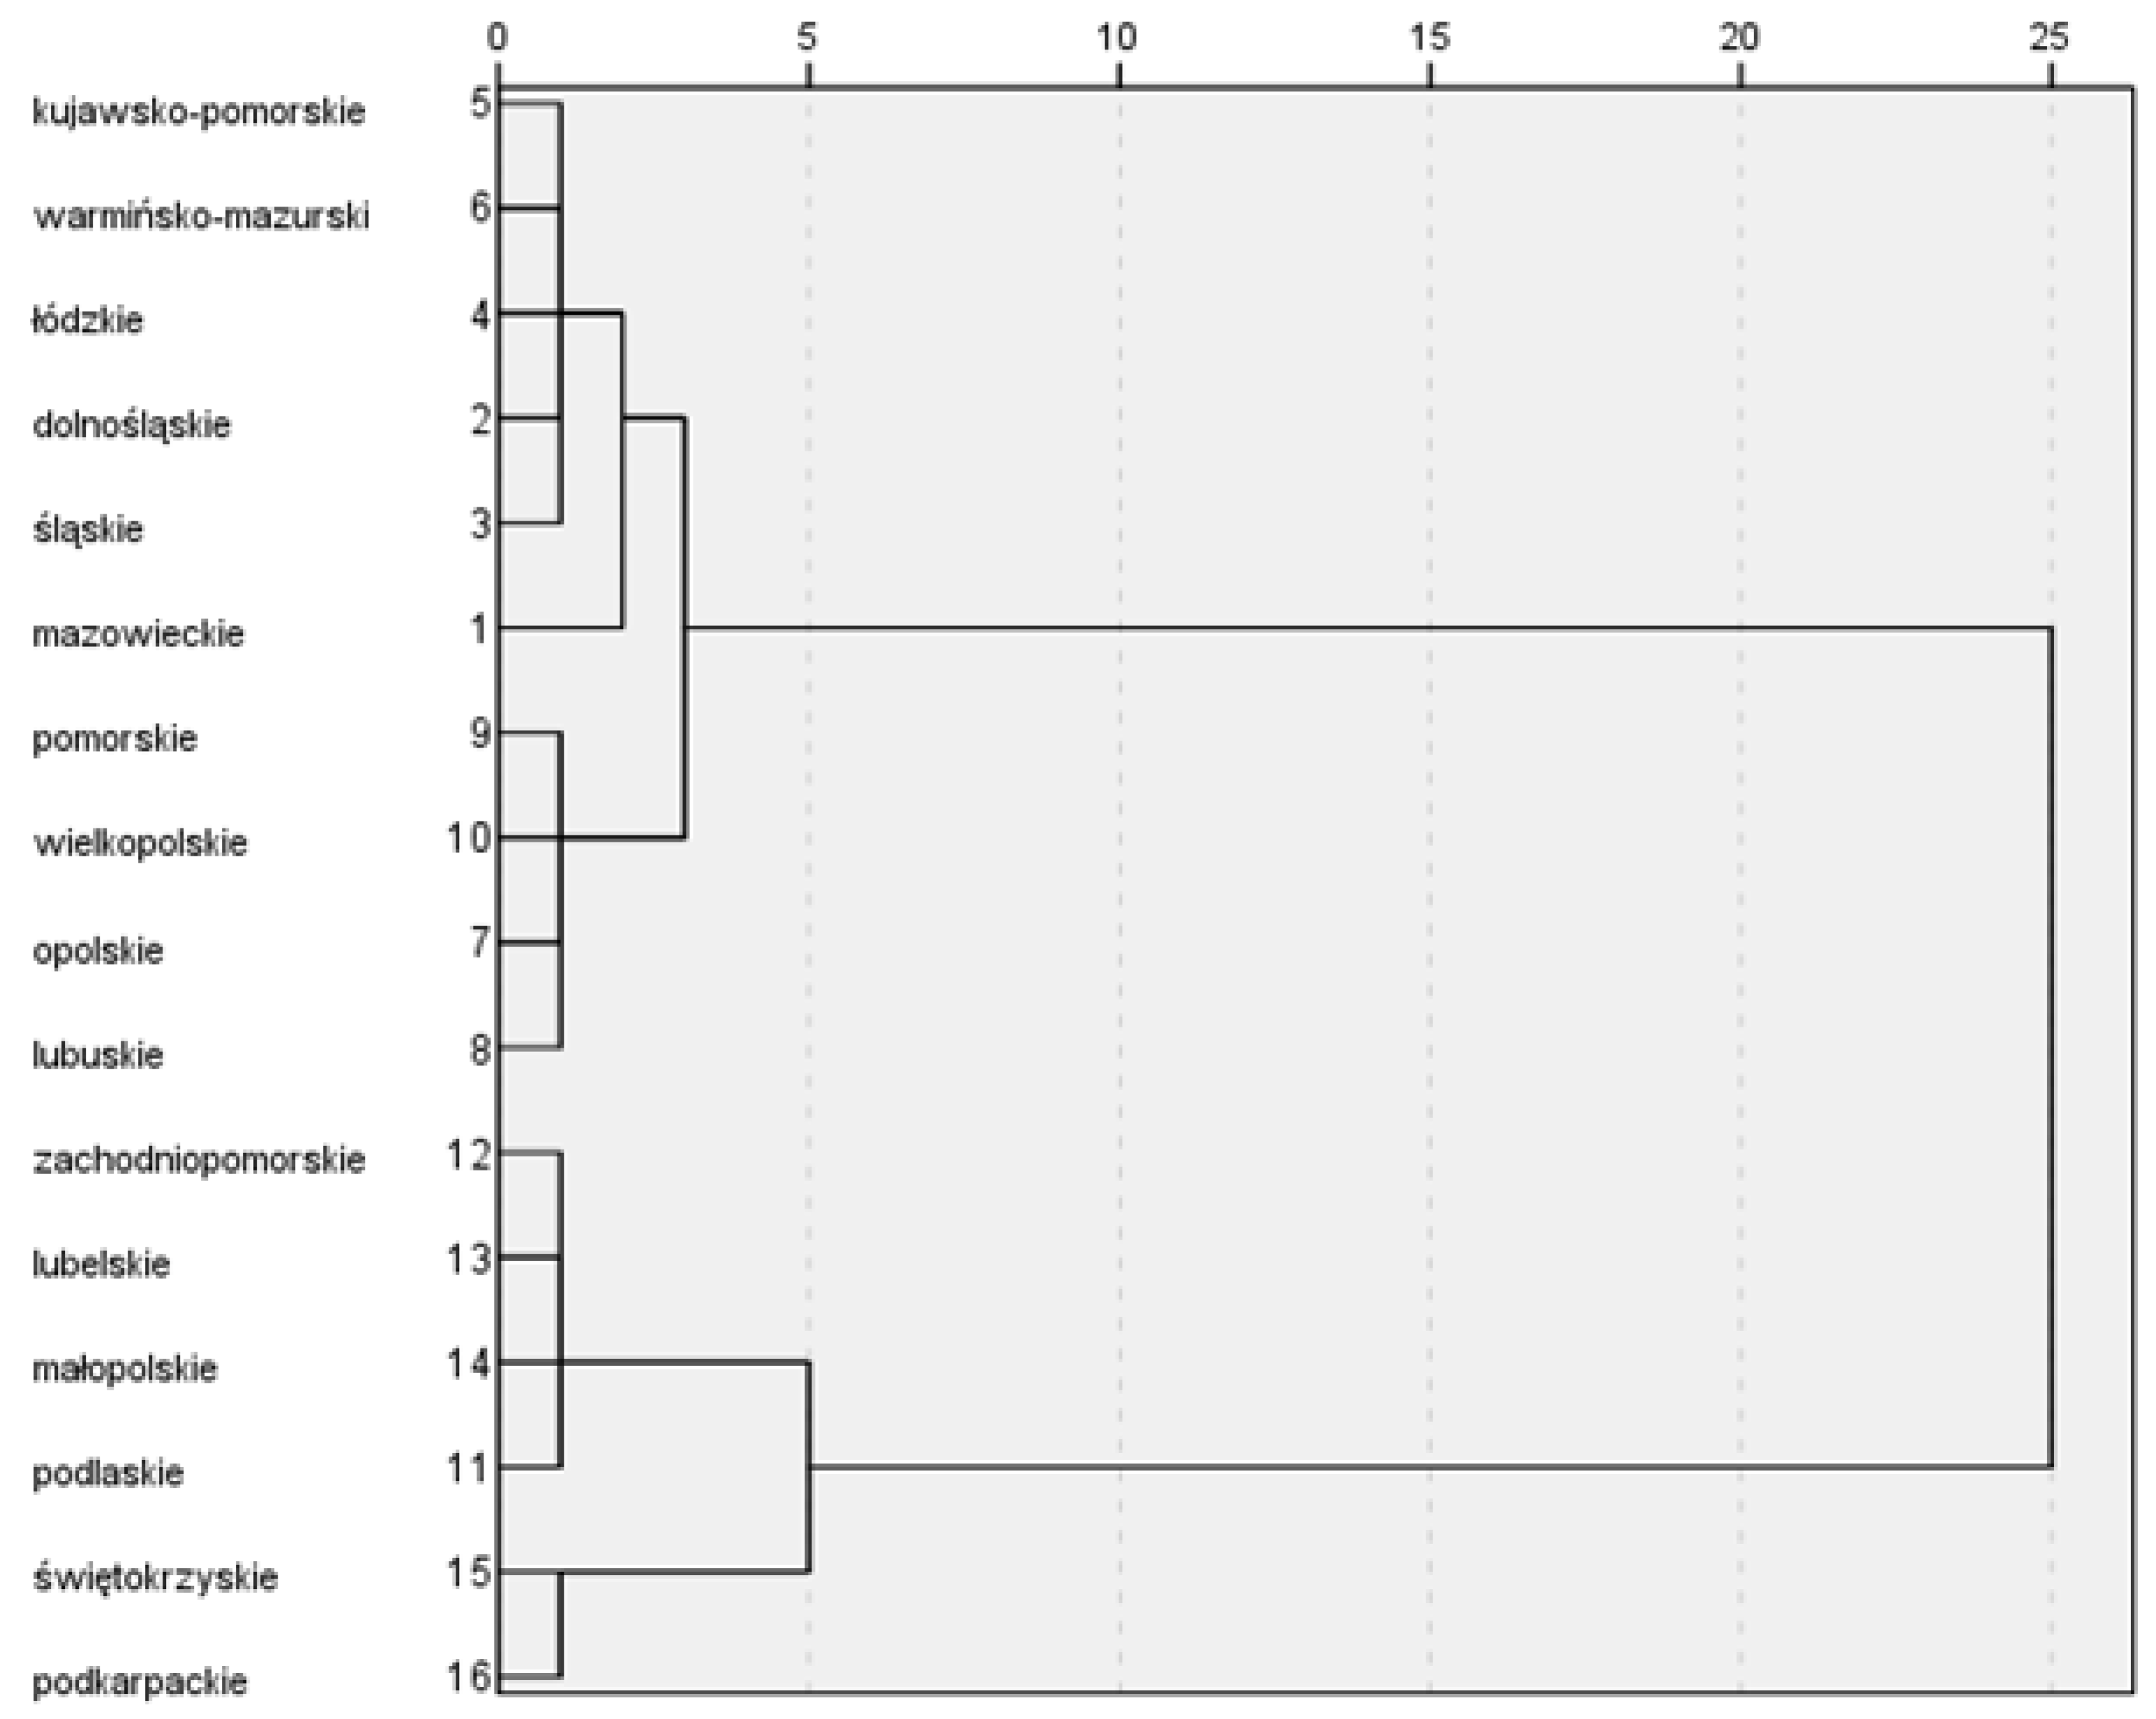
| No. | Voivodeship (NUTS 2) | Level of Synthetic Measure in 2021 |
|---|---|---|
| 1 | Mazowieckie | 0.643164 |
| 2 | Dolnośląskie | 0.577674 |
| 3 | Śląskie | 0.575463 |
| 4 | Łódzkie | 0.545997 |
| 5 | Kujawsko-Pomorskie | 0.543882 |
| 6 | Warmińsko-Mazurskie | 0.543677 |
| 7 | Opolskie | 0.522127 |
| 8 | Lubuskie | 0.511749 |
| 9 | Pomorskie | 0.493014 |
| 10 | Wielkopolskie | 0.484241 |
| 11 | Podlaskie | 0.44378 |
| 12 | Zachodniopomorskie | 0.400517 |
| 13 | Lubelskie | 0.387565 |
| 14 | Małopolskie | 0.368698 |
| 15 | Świętokrzyskie | 0.308514 |
| 16 | Podkarpackie | 0.207801 |
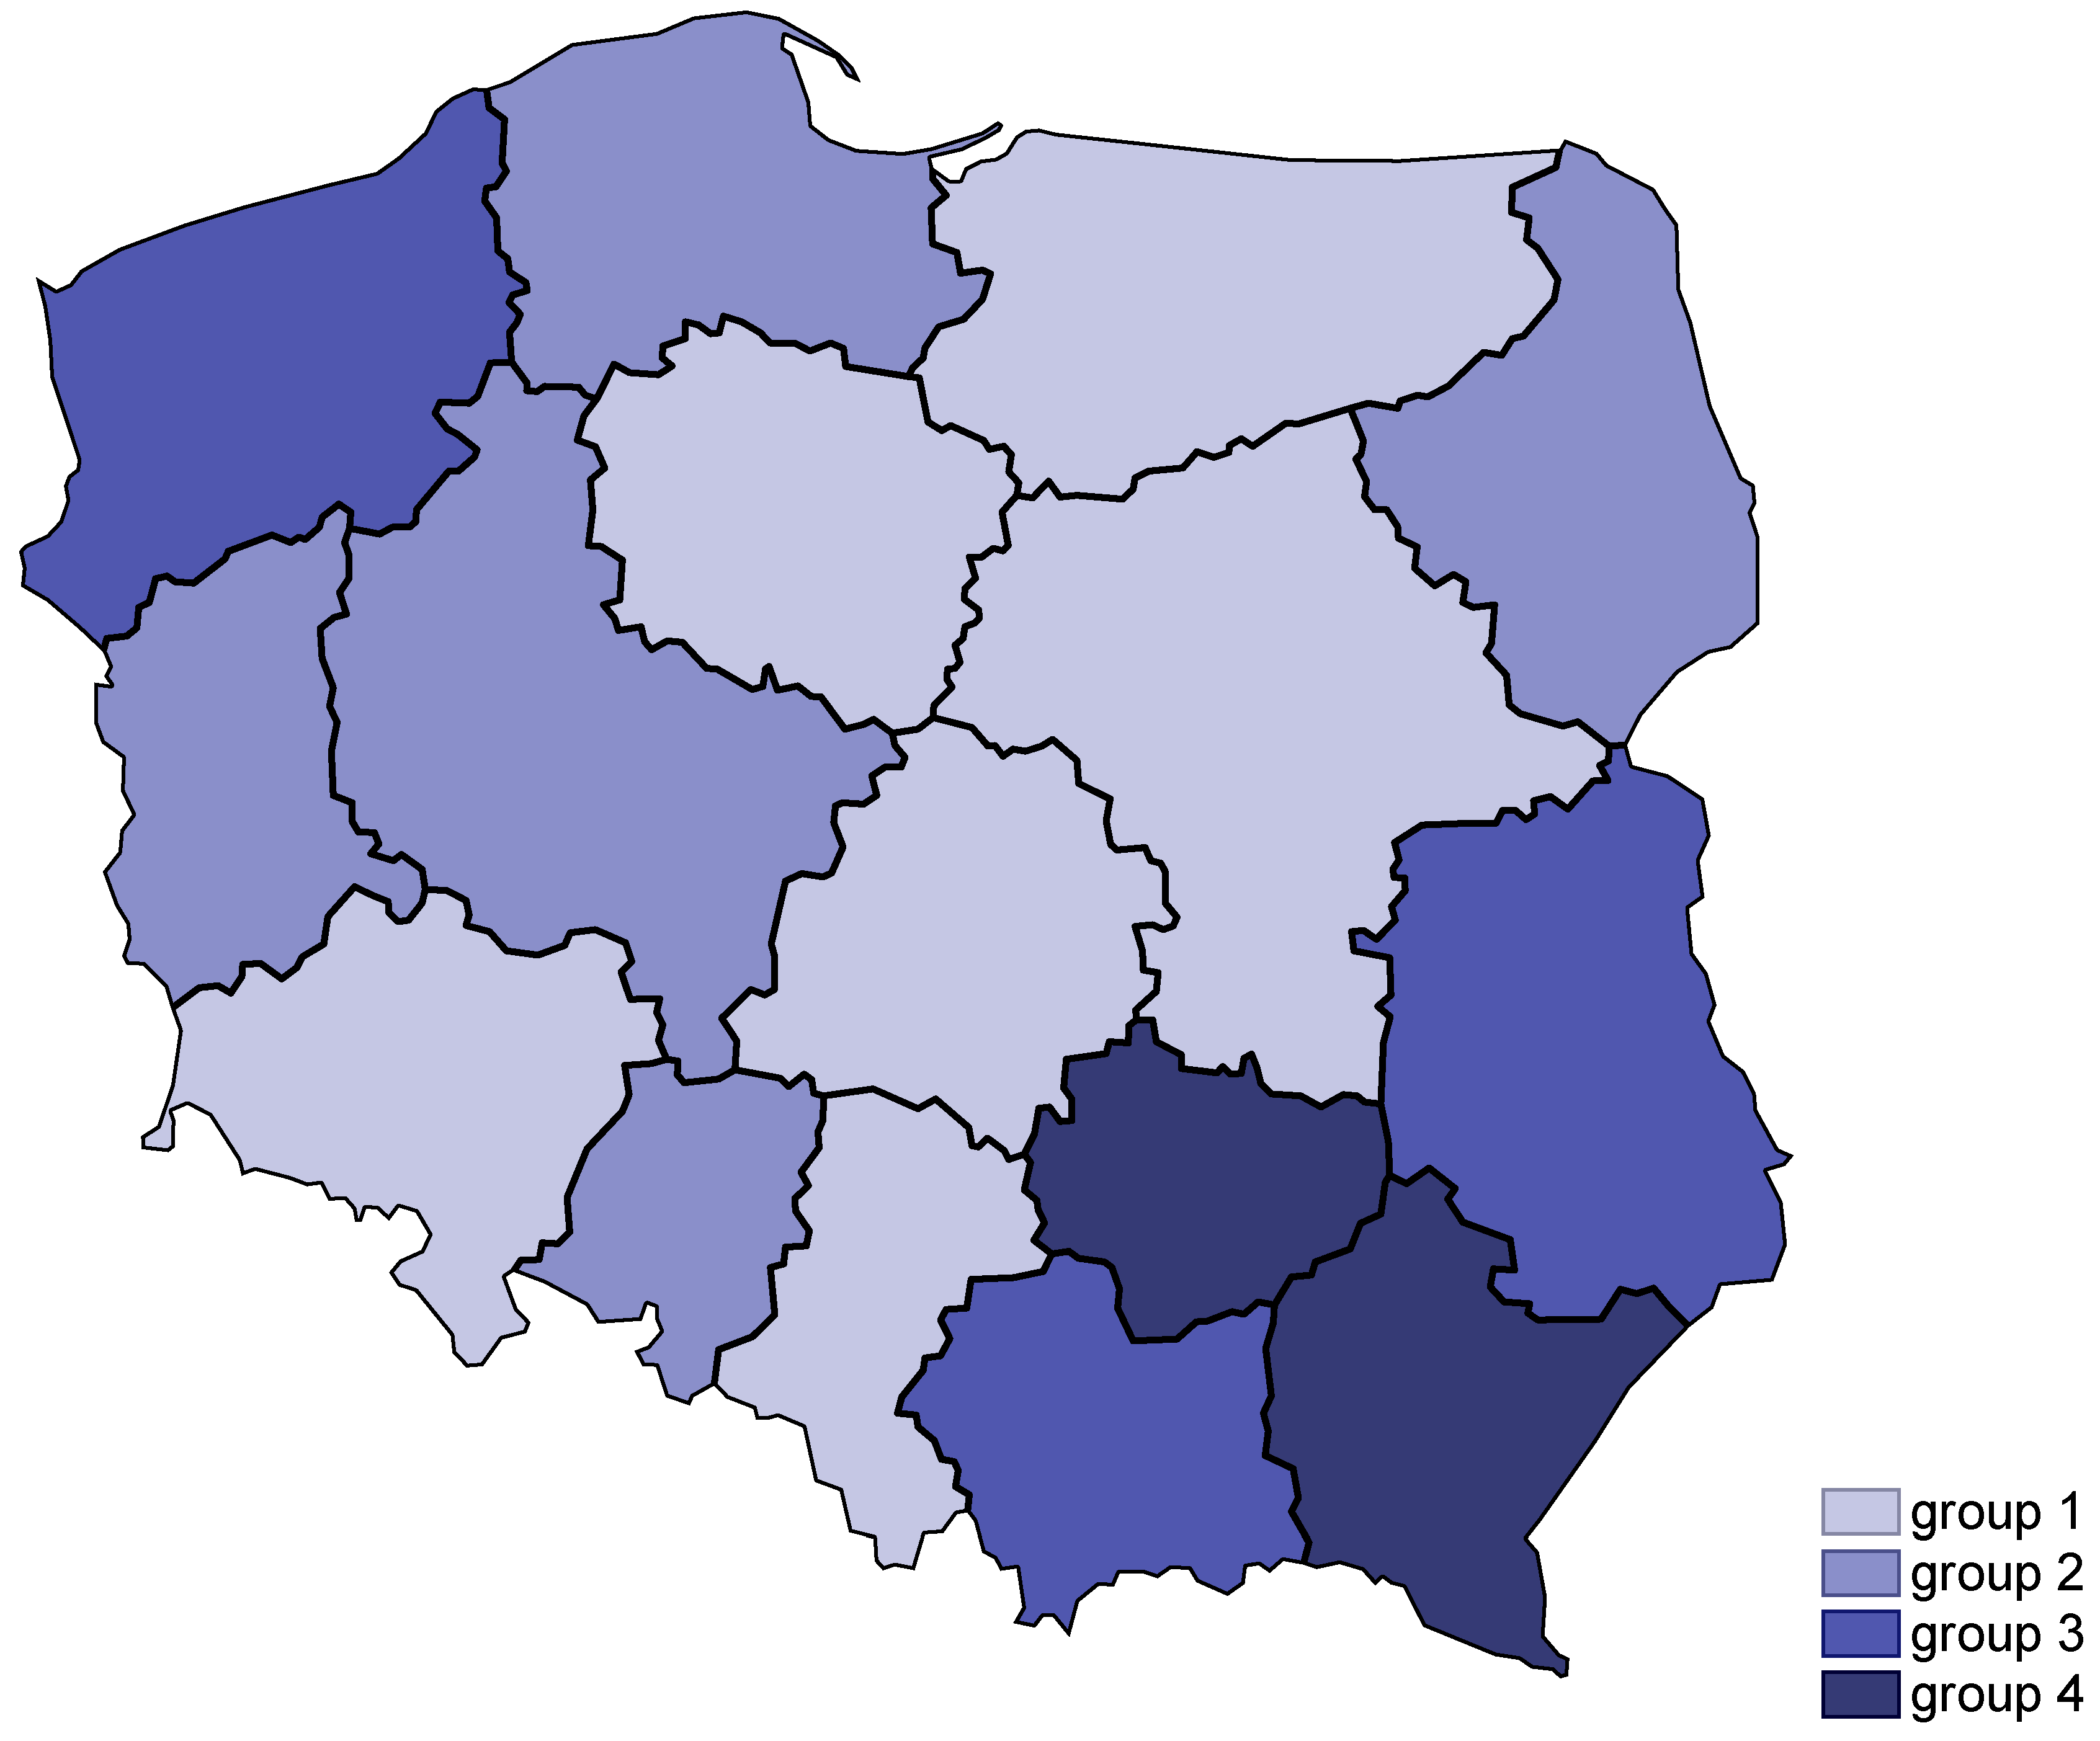
| Class | Voivodeship (NUTS 2) |
|---|---|
| Class 1 | Mazowieckie, Dolnośląskie, Śląskie, Łódzkie, Kujawsko-Pomorskie, Warmińsko-Mazurskie |
| Class 2 | Opolskie, Lubuskie, Pomorskie, Wielkopolskie, Podlaskie |
| Class 3 | Zachodniopomorskie, Lubelskie, Małopolskie |
| Class 4 | Świętokrzyskie, Podkarpackie |
Disclaimer/Publisher’s Note: The statements, opinions and data contained in all publications are solely those of the individual author(s) and contributor(s) and not of MDPI and/or the editor(s). MDPI and/or the editor(s) disclaim responsibility for any injury to people or property resulting from any ideas, methods, instructions or products referred to in the content. |
© 2023 by the authors. Licensee MDPI, Basel, Switzerland. This article is an open access article distributed under the terms and conditions of the Creative Commons Attribution (CC BY) license (https://creativecommons.org/licenses/by/4.0/).
Share and Cite
Janusz, M.; Piotrowski, M.; Kwiatkowska, E.; Grzybowska-Brzezińska, M.; Maciuk, K. Accessibility of Public Sector Institutions for People with Special Needs in Polish Regions. Sustainability 2023, 15, 15842. https://doi.org/10.3390/su152215842
Janusz M, Piotrowski M, Kwiatkowska E, Grzybowska-Brzezińska M, Maciuk K. Accessibility of Public Sector Institutions for People with Special Needs in Polish Regions. Sustainability. 2023; 15(22):15842. https://doi.org/10.3390/su152215842
Chicago/Turabian StyleJanusz, Marcin, Marek Piotrowski, Emilia Kwiatkowska, Mariola Grzybowska-Brzezińska, and Kamil Maciuk. 2023. "Accessibility of Public Sector Institutions for People with Special Needs in Polish Regions" Sustainability 15, no. 22: 15842. https://doi.org/10.3390/su152215842