
A Transaction Model and Profit Allocation Method of Multiple Energy Storage Oriented to Versatile Regulation Demand
Abstract
:1. Introduction
- (1)
- We have constructed a multitype ESS containing an HSS, BESS, and CAES to satisfy the demands of multiscenarios for standby, peak shaving, and FR. The multitype ESS, compared to a traditional single ESS, has different response characteristics, resolving the issue of poor flexibility in the power market.
- (2)
- We have proposed a two-layer game model of the N–S–C game, balancing the total cost of regulation and the profit of multitype, independent operating. The game pattern, in contrast to the Stackelberg game model, addresses a trading model where multiple ESS users participate independently with multiple ESSs, which conforms to the transaction mode of the multitype ESS operating as an independent entity.
- (3)
- We have designed a value allocation strategy based on the operating characteristics of multitype ESSs, utilizing the average regulation cost and FR mileage factor to determine the benefit allocation. The new strategy, which deviates from the Shapley value method, efficiently clarifies the actual contribution of multitype ESSs, acknowledging the balance between the overall rationality and individual rationality.
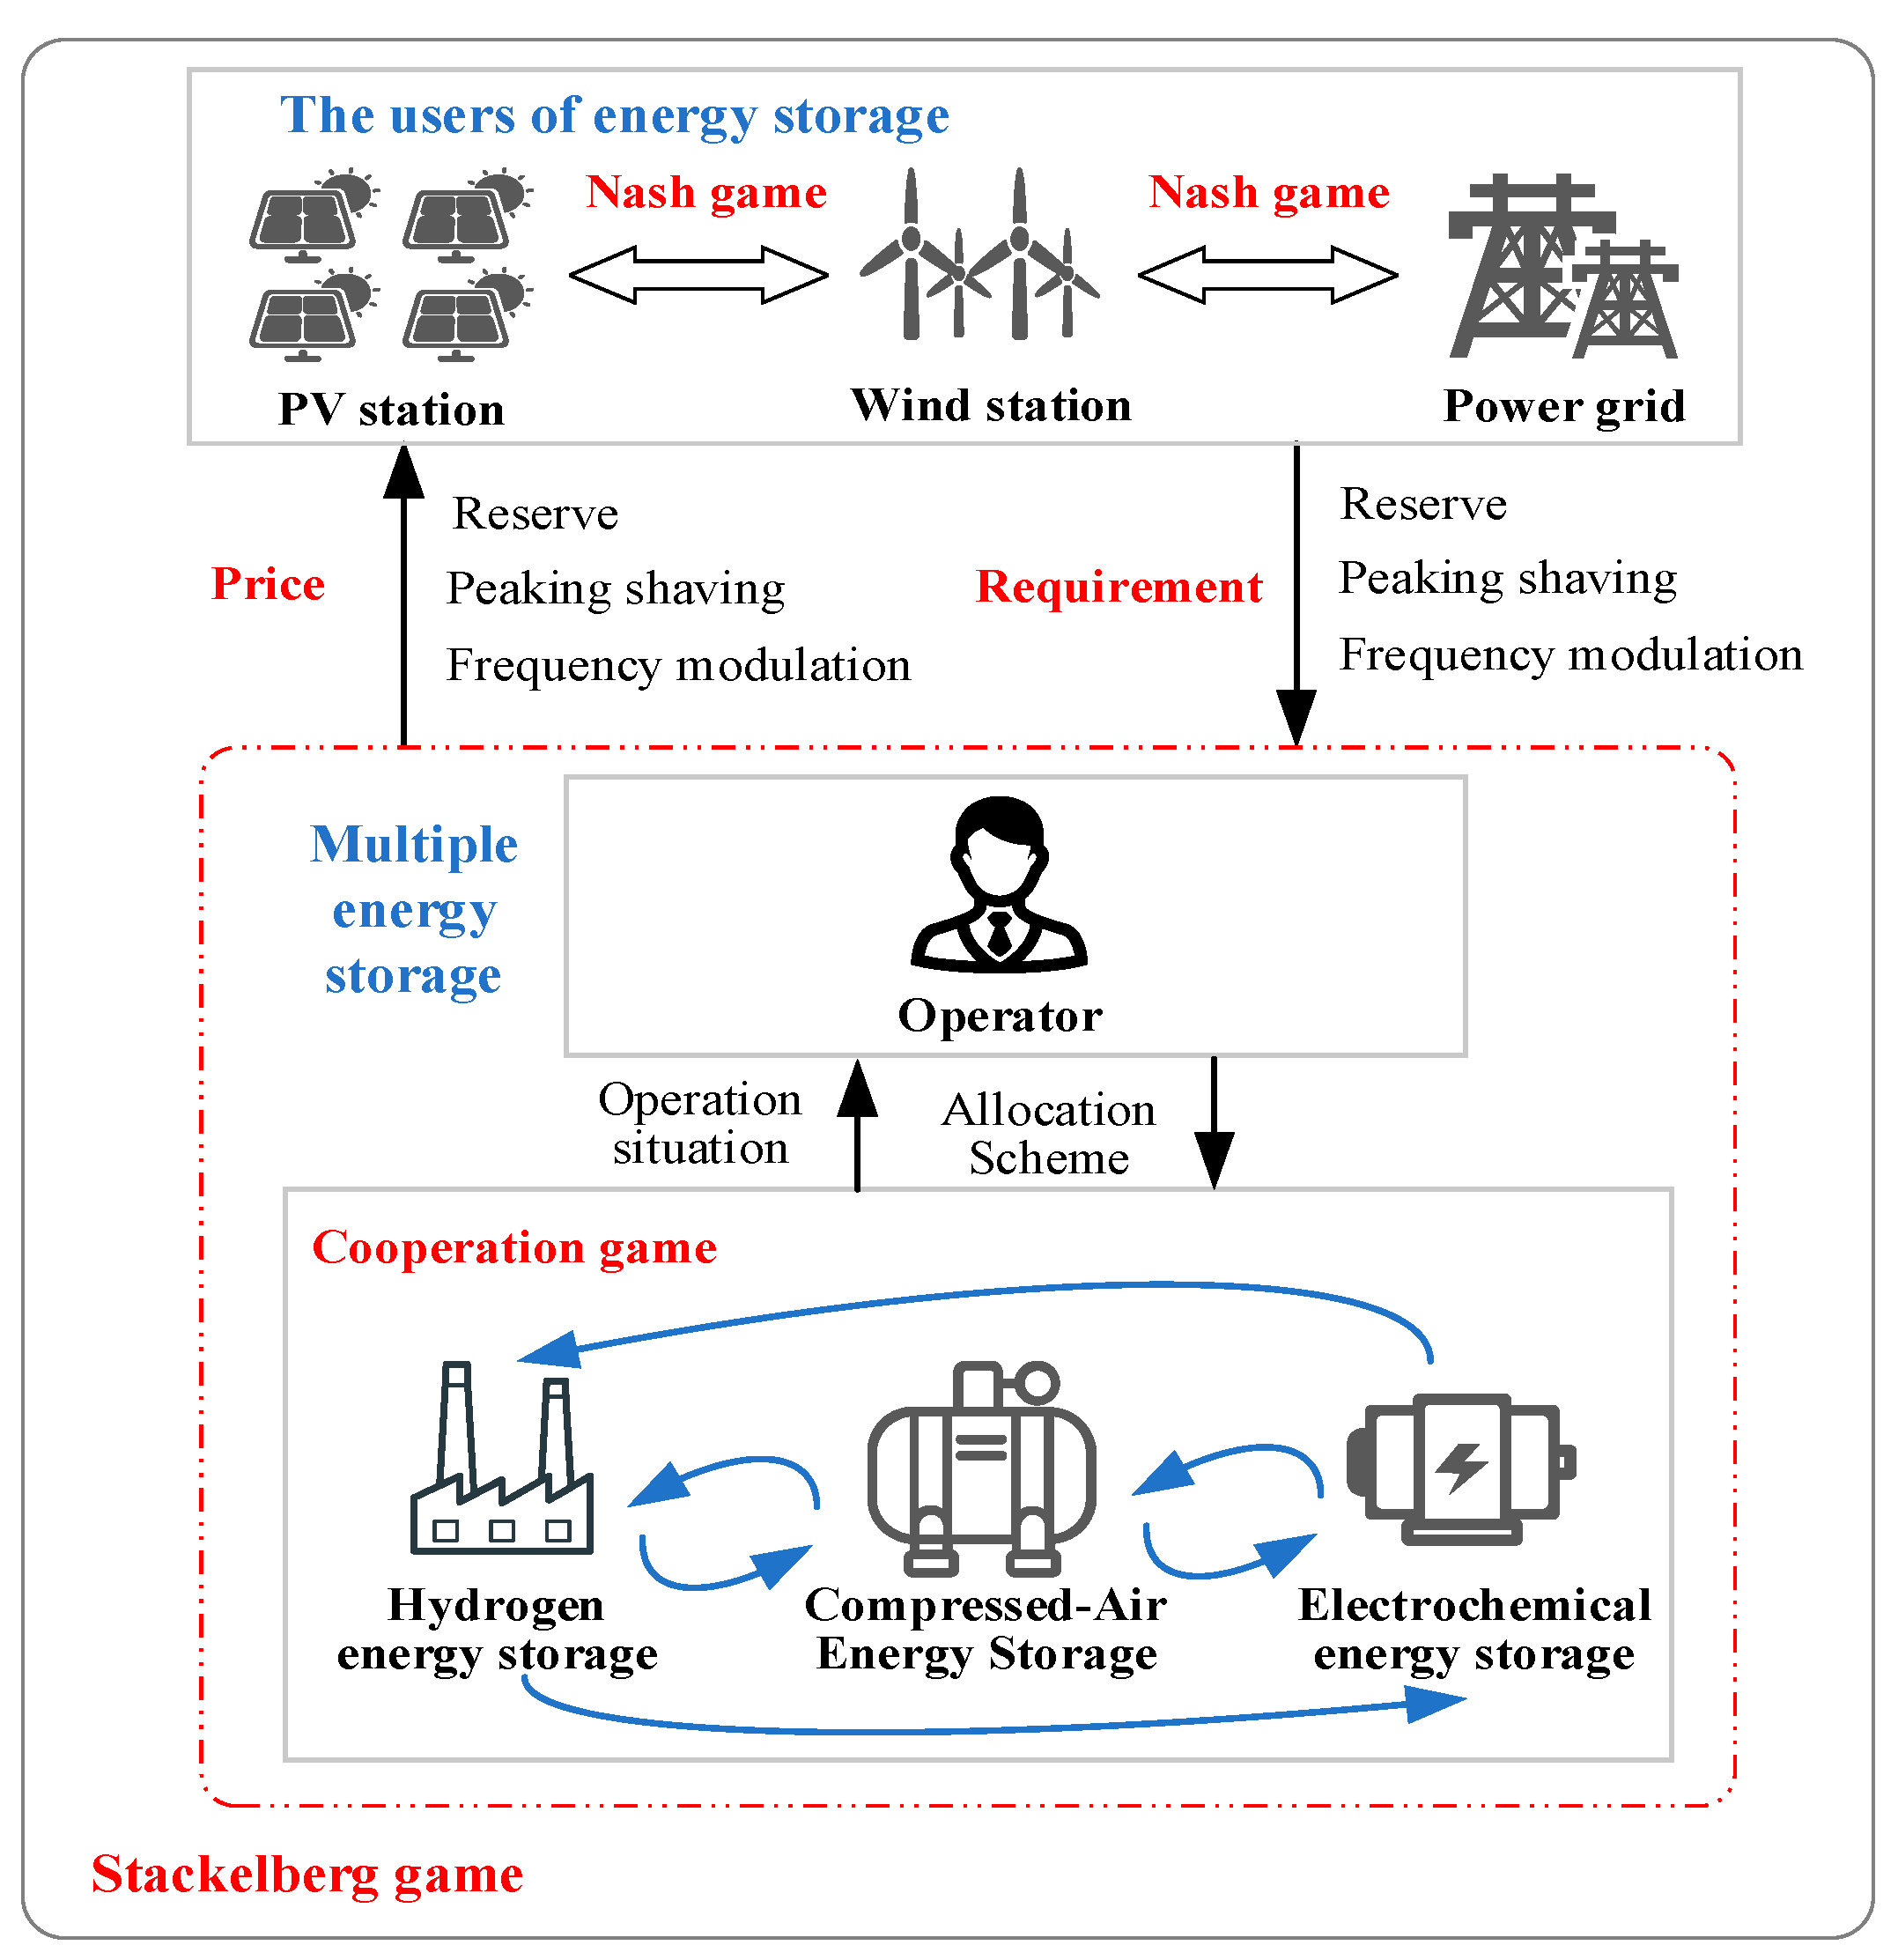
2. Day-Ahead Trading Framework of a Multitype ESS Collaboration
- (1)
- Multiple RGSs and power grids, as multiple ESS users, send adjustment requirements to multiple ESSs according to the power generation and net load curves.
- (2)
- The multiple ESSs include a HSS, ESS, and CAES with different response characteristics, which participate in electricity trading as independent operators. The energy storage operator (ESO) centralizes regulation and unifies the management of multiple operating entities. The multiple ESSs return the auxiliary service price to the ESS user according to the ESS operation and the adjustment cost in order to respond to the needs of users. The framework can also balance the interests of multiple ESS entities by considering the characteristics of multiple ESSs to develop a value allocation strategy.
- (1)
- Multiple ESS entities that meet the trading access conditions upload various types of regulatory demand response plans and service prices to the ESO according to the relevant operational constraints, maintenance, and life loss costs with the goal of maximizing the overall benefit of multiple ESSs.
- (2)
- ESOs release value distribution plans to ESS entities to balance the interests of each entity based on the difference in response characteristics of multiple ESSs.
- Step 1: ESS users, such as RGSs (wind power or photovoltaic) and power grids, can obtain the amount of wind/photovoltaic power curtailment (), the output plan of thermal power units (), and the demand for ESS utilization () through the Nash game.
- Step 2: Each ESS entity declares the cost of standby power, peak shaving, FR (), and electric energy () to the ESO, where Hy, El, and Aa are HSS, BESS, and CAES, respectively. B, PS, and PFR are defined as standby, peaking, and FR regulation requirements, respectively.
- Step 3: ESOs make decisions through cooperative gaming, while feeding back the response results () and transaction prices () of each type of regulated demand to multiple ESS users.
- Step 4: Return to Step 1. The energy storage user adjusts the demand for each type for more energy storage regulation, wind/photovoltaic power curtailment, and the thermal power unit output plan until the trading process reaches equilibrium. That means the declared amount, the trading price, and the thermal power unit output plan no longer change.
3. Results
3.1. Basic Assumptions of the Model
- (1)
- The load is an inflexible load.
- (2)
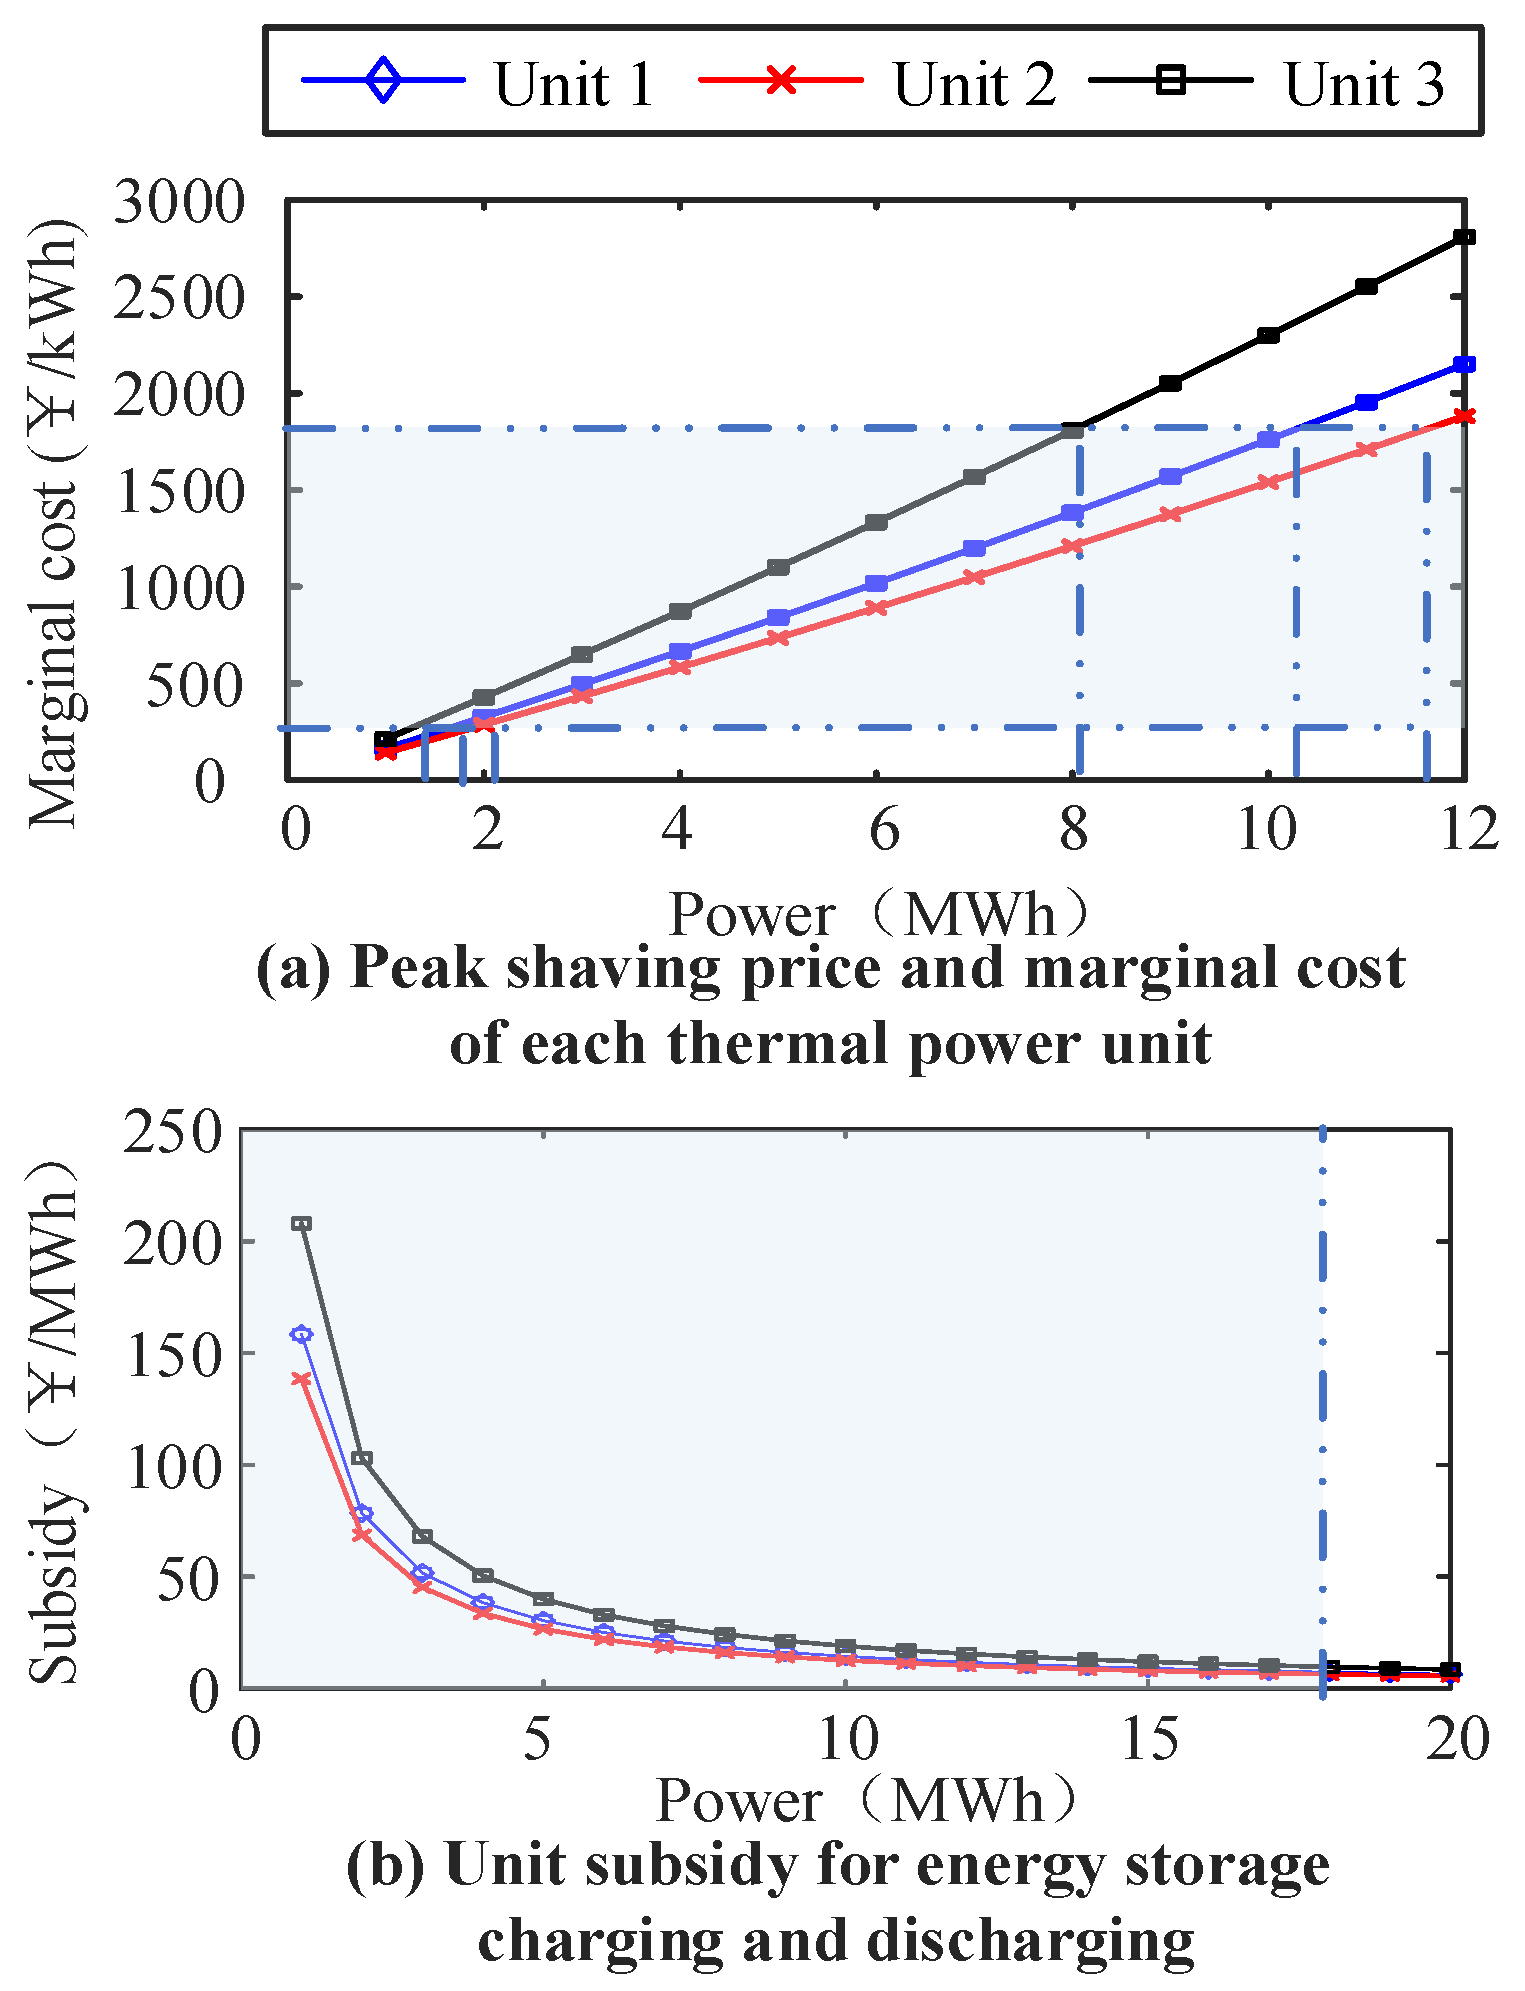
- The power generation cost of the thermal power unit is a quadratic function of output, FR, and standby capacity cost become linear functions of output [18].
- (3)
- The ESS capacity, FR, and reserve cost are all linear functions of the charge and discharge capacity.
- (4)
- The declared amount of FR mileage and standby capacity of each ESS owner or thermal unit takes into account both upward/downward FR and standby situations.
3.2. Multitype User Demand Decision-Making Based on the Nash Game
- (1)
- Benefit of the new energy station ()
- (2)
- Power grid benefit ()
- (3)
- Feedback deflection ()
3.3. Price Decision of Multitype Energy Storage Service Based on a Cooperative Game
- (1)
- BESS constraint
- (2)
- HSS constraint
- (3)
- CAES constraint
- (4)
- Multitype energy storage adjustment demand response constraints
3.4. Benefit Distribution Mechanism of Multitype Energy Storage Subjects
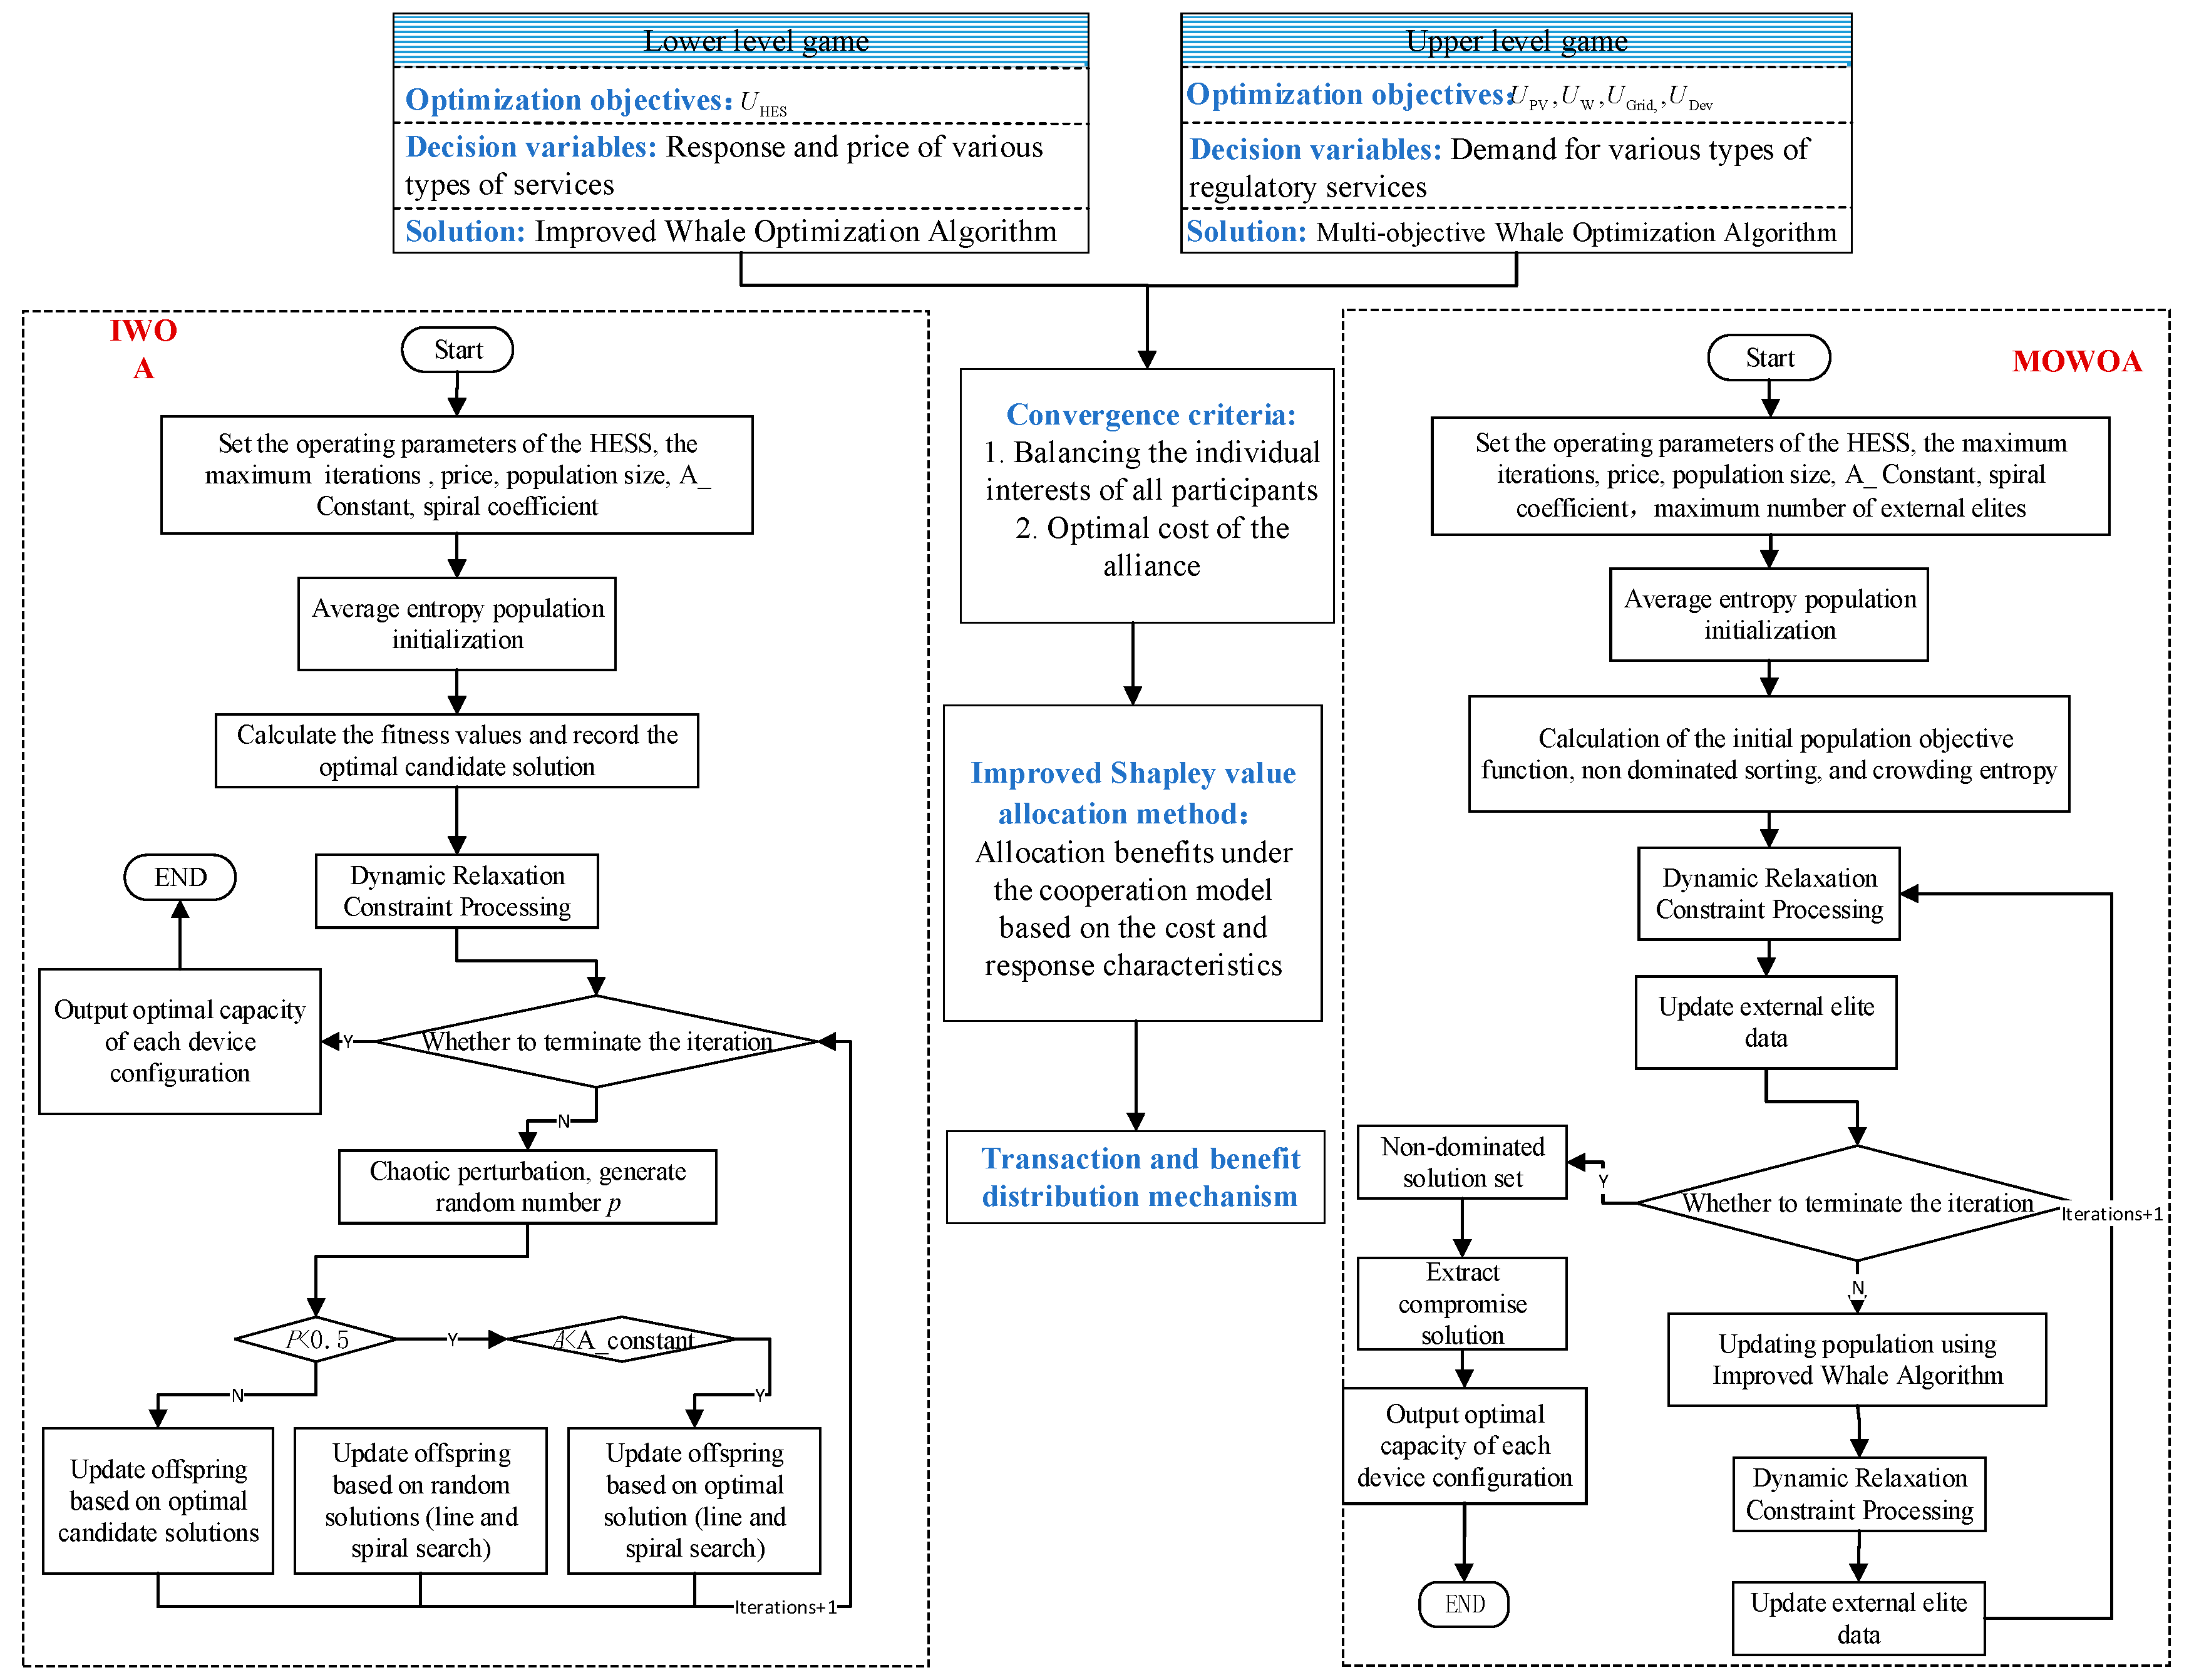
4. Solution of a Two-Level Game Model
5. Case Study
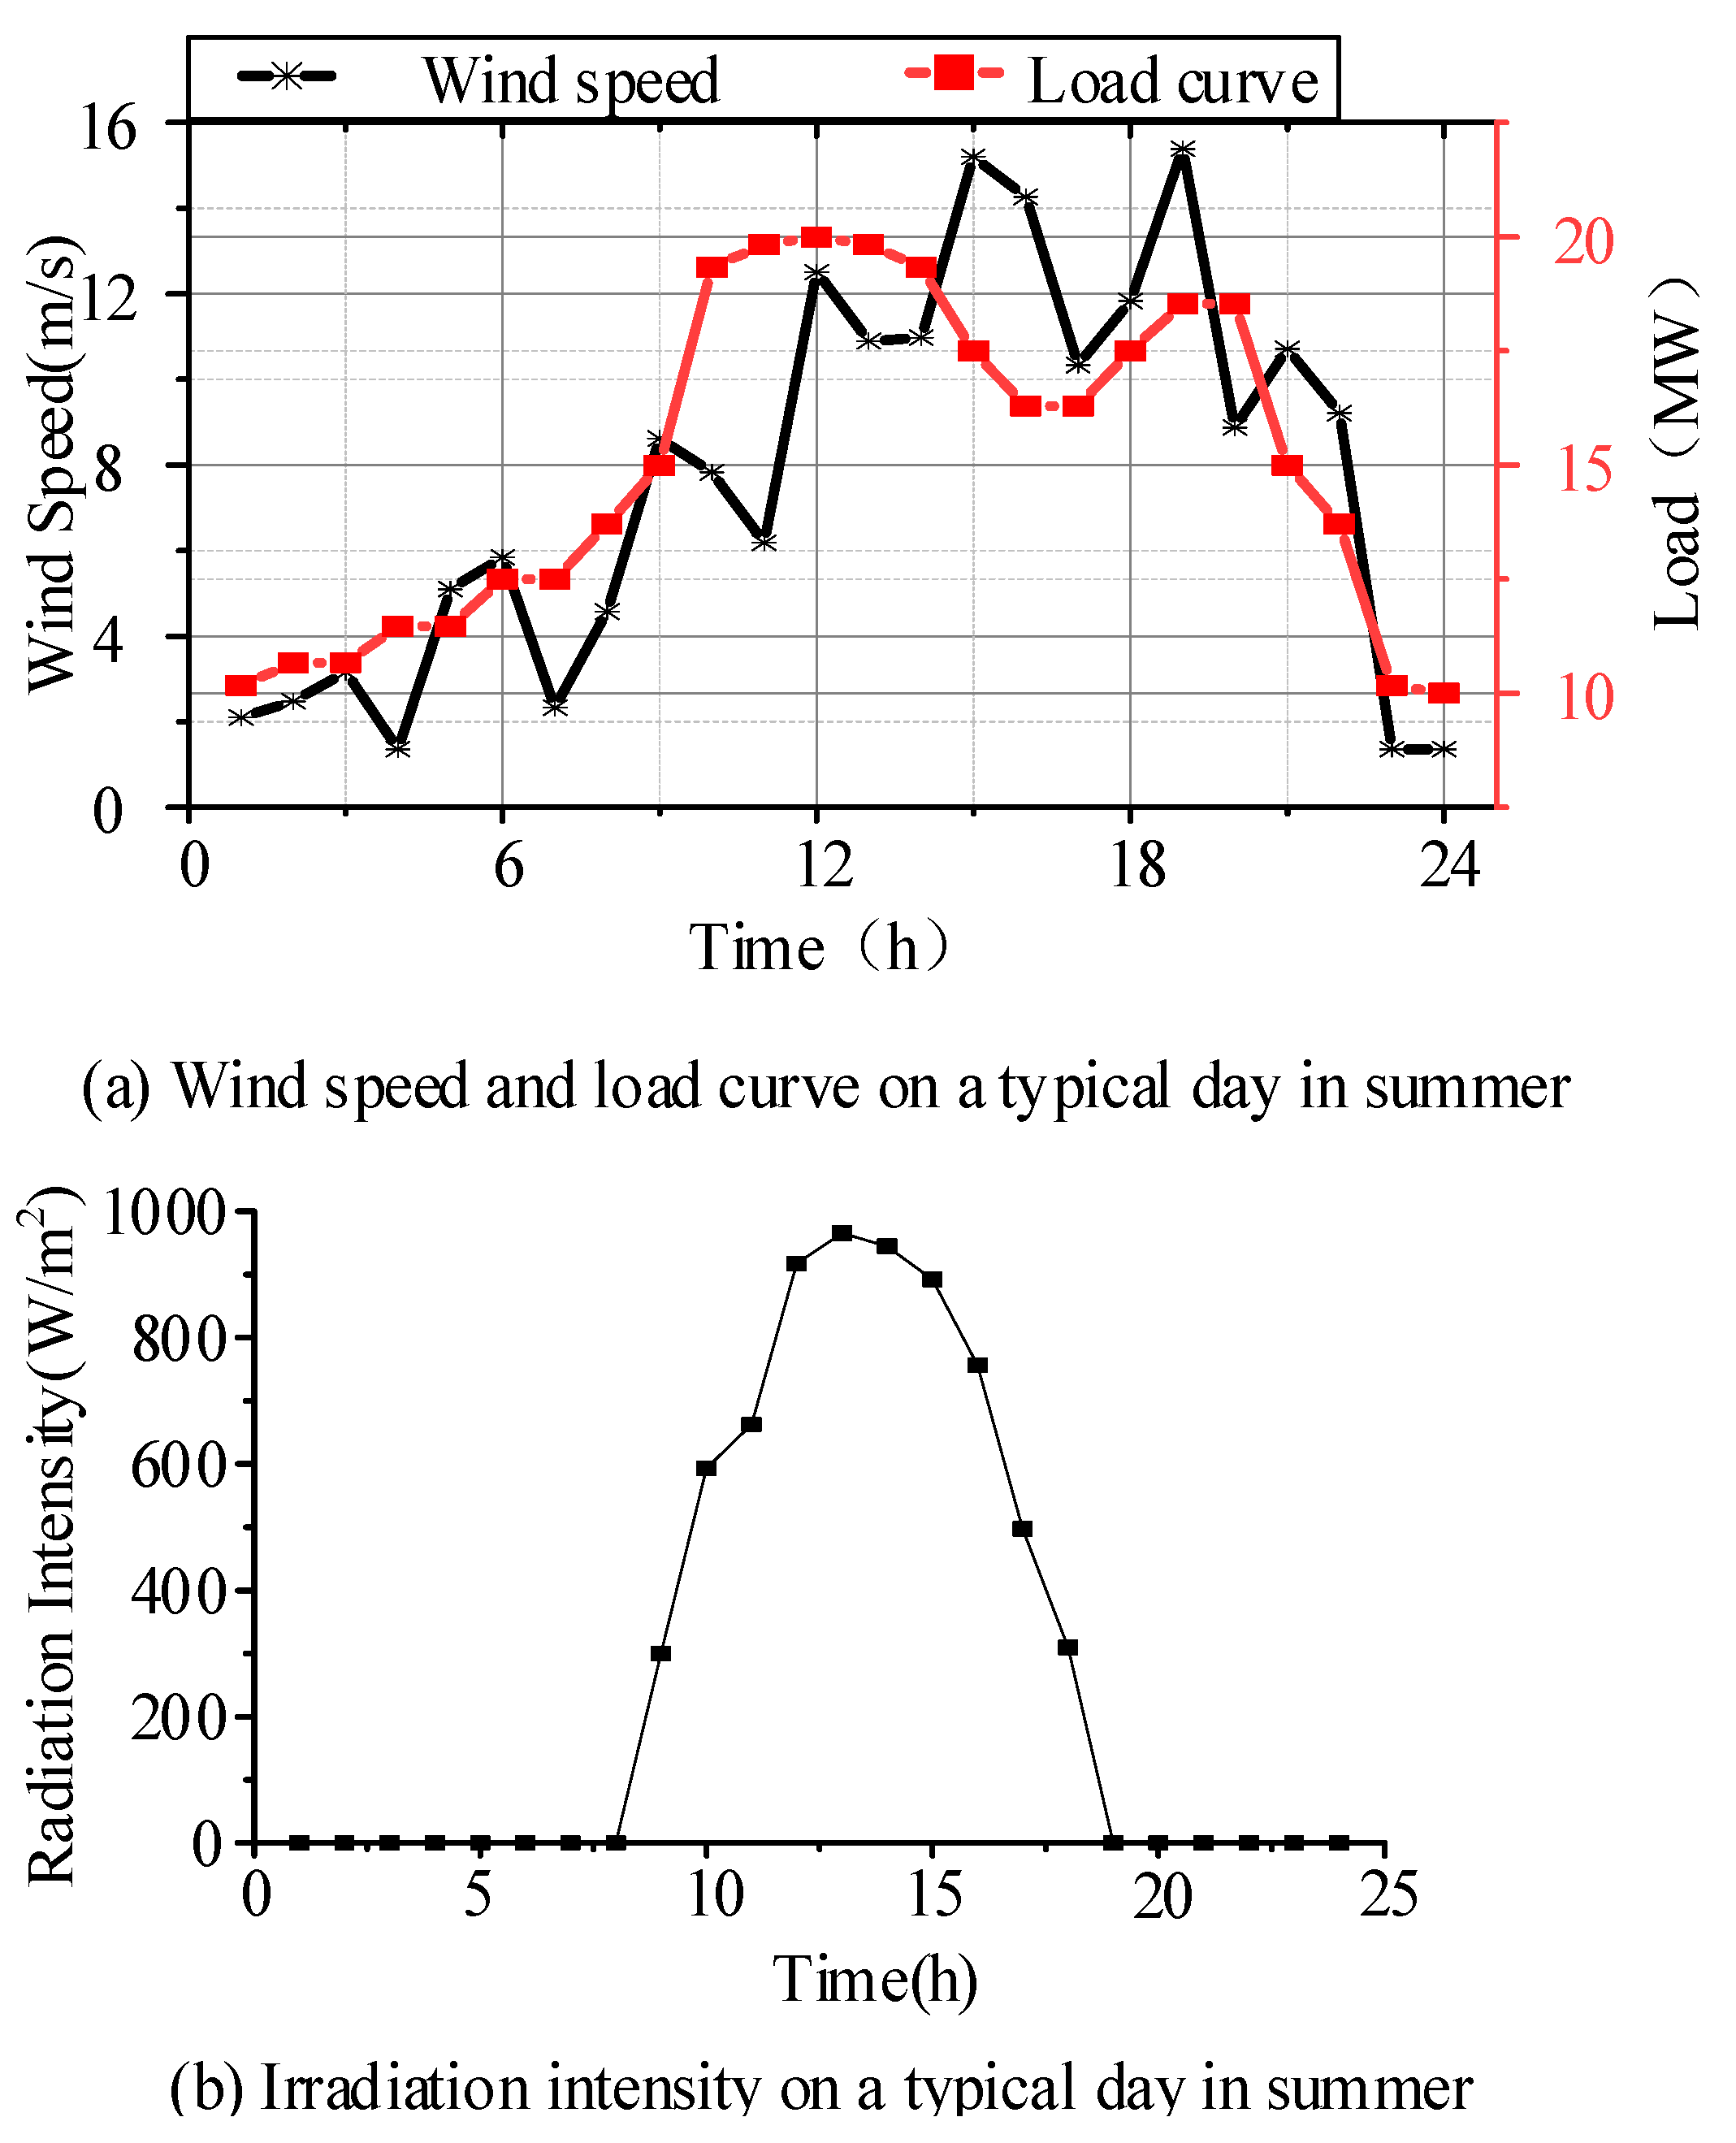
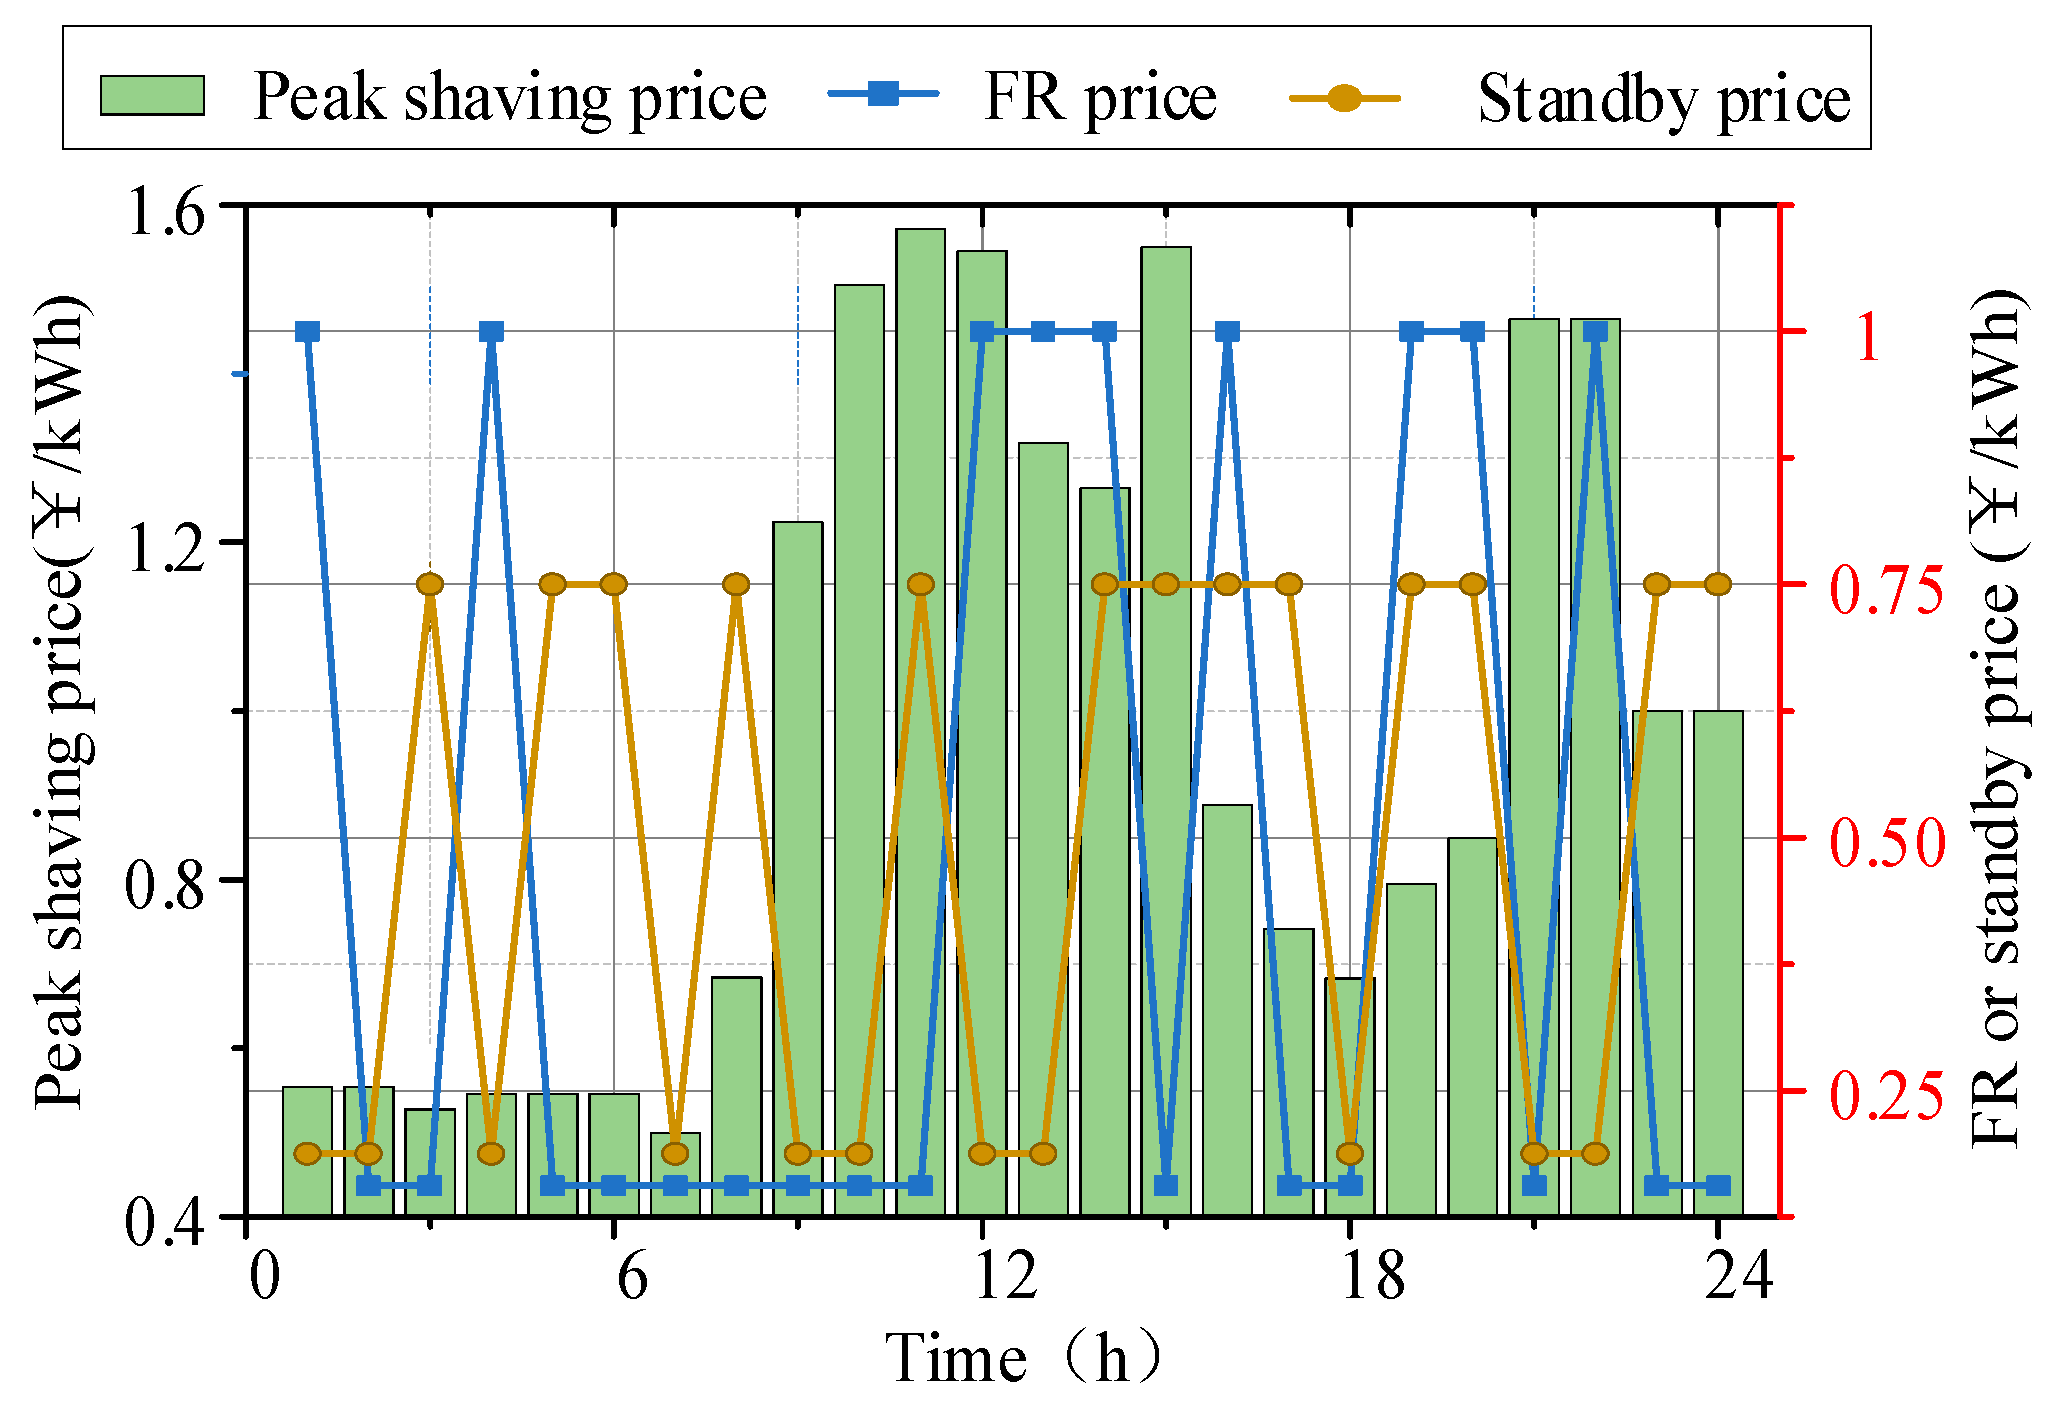
5.1. Basic Parameter
5.2. Analysis of Joint Bidding Results for Multiple ESSs
5.3. Benefit and Utilization Analysis of Multiple ESSs
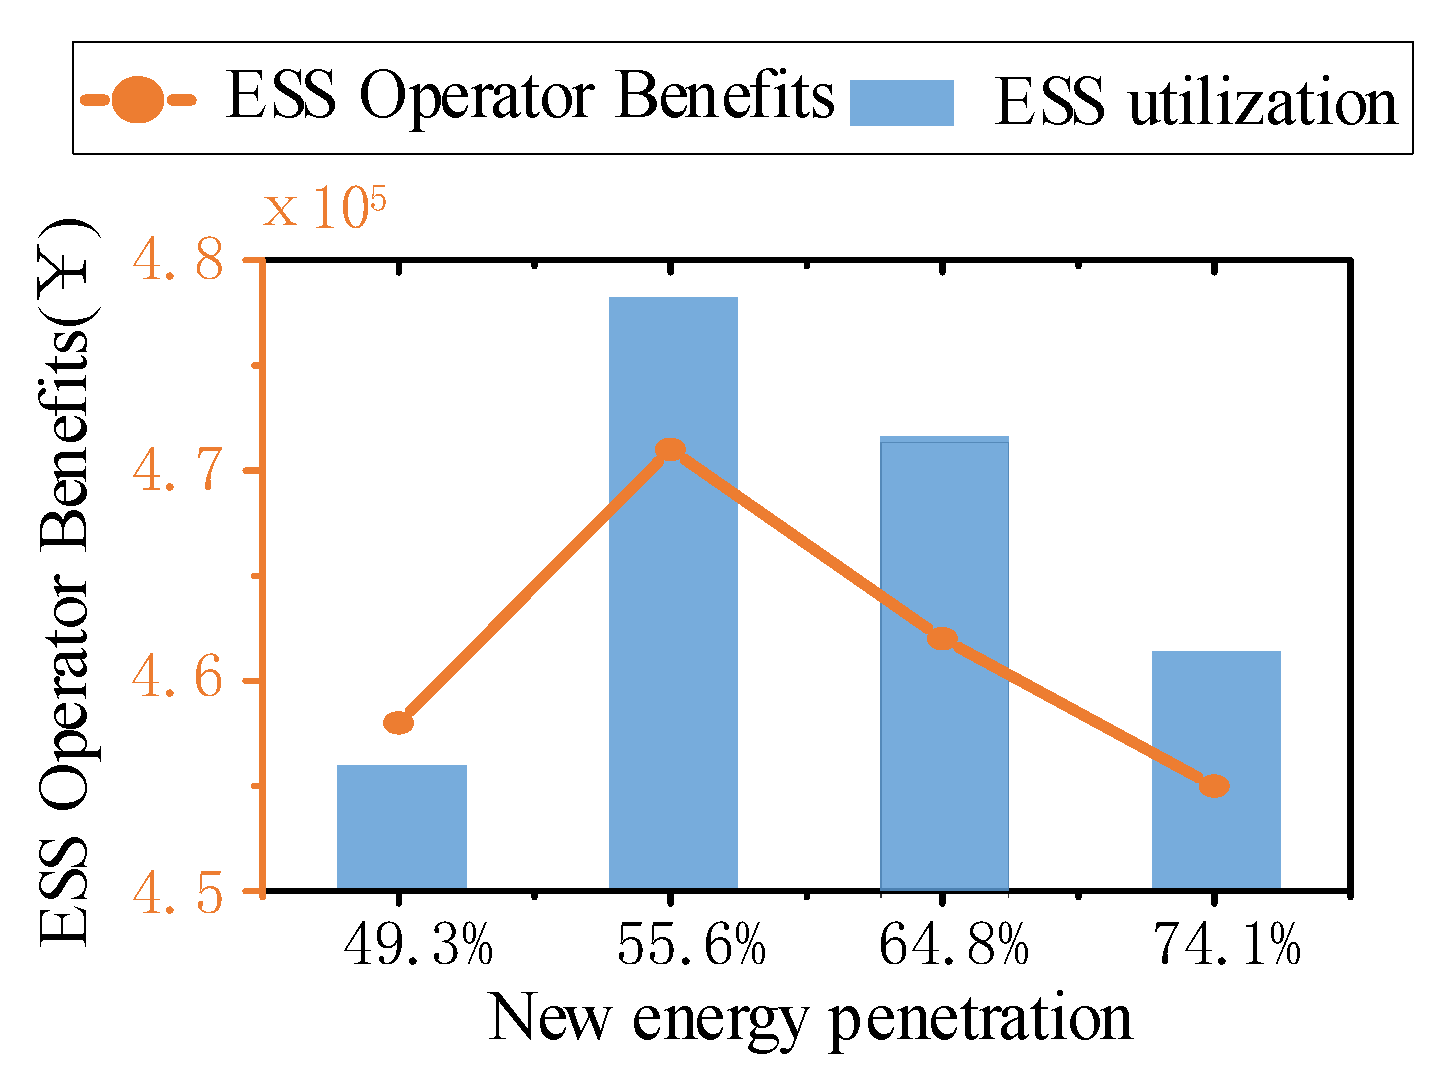
5.4. Analysis of Trading Influence
6. Conclusions
- (1)
- A two-layer game model based on the N–S–C game was constructed. The model balanced the regulating total costs and multiple independent operating profit. The model correctly reflected the supply and demand relationship of the market, surpassing the limitation of poor flexibility caused by insufficient grid-connected synchronous machines.
- (2)
- A trading pattern for the participation of the ESS in the combined peak-frequency-standby market was designed. The pattern enabled us to boost ESS revenues and utilization and to cut down the payback period. However, a small-scale ESS with a rated power of less than 18 MWh lacked a price advantage, indicating the necessity of upgrading the configuration of the ESS from a decentralized to an independent/shared pattern.
- (3)
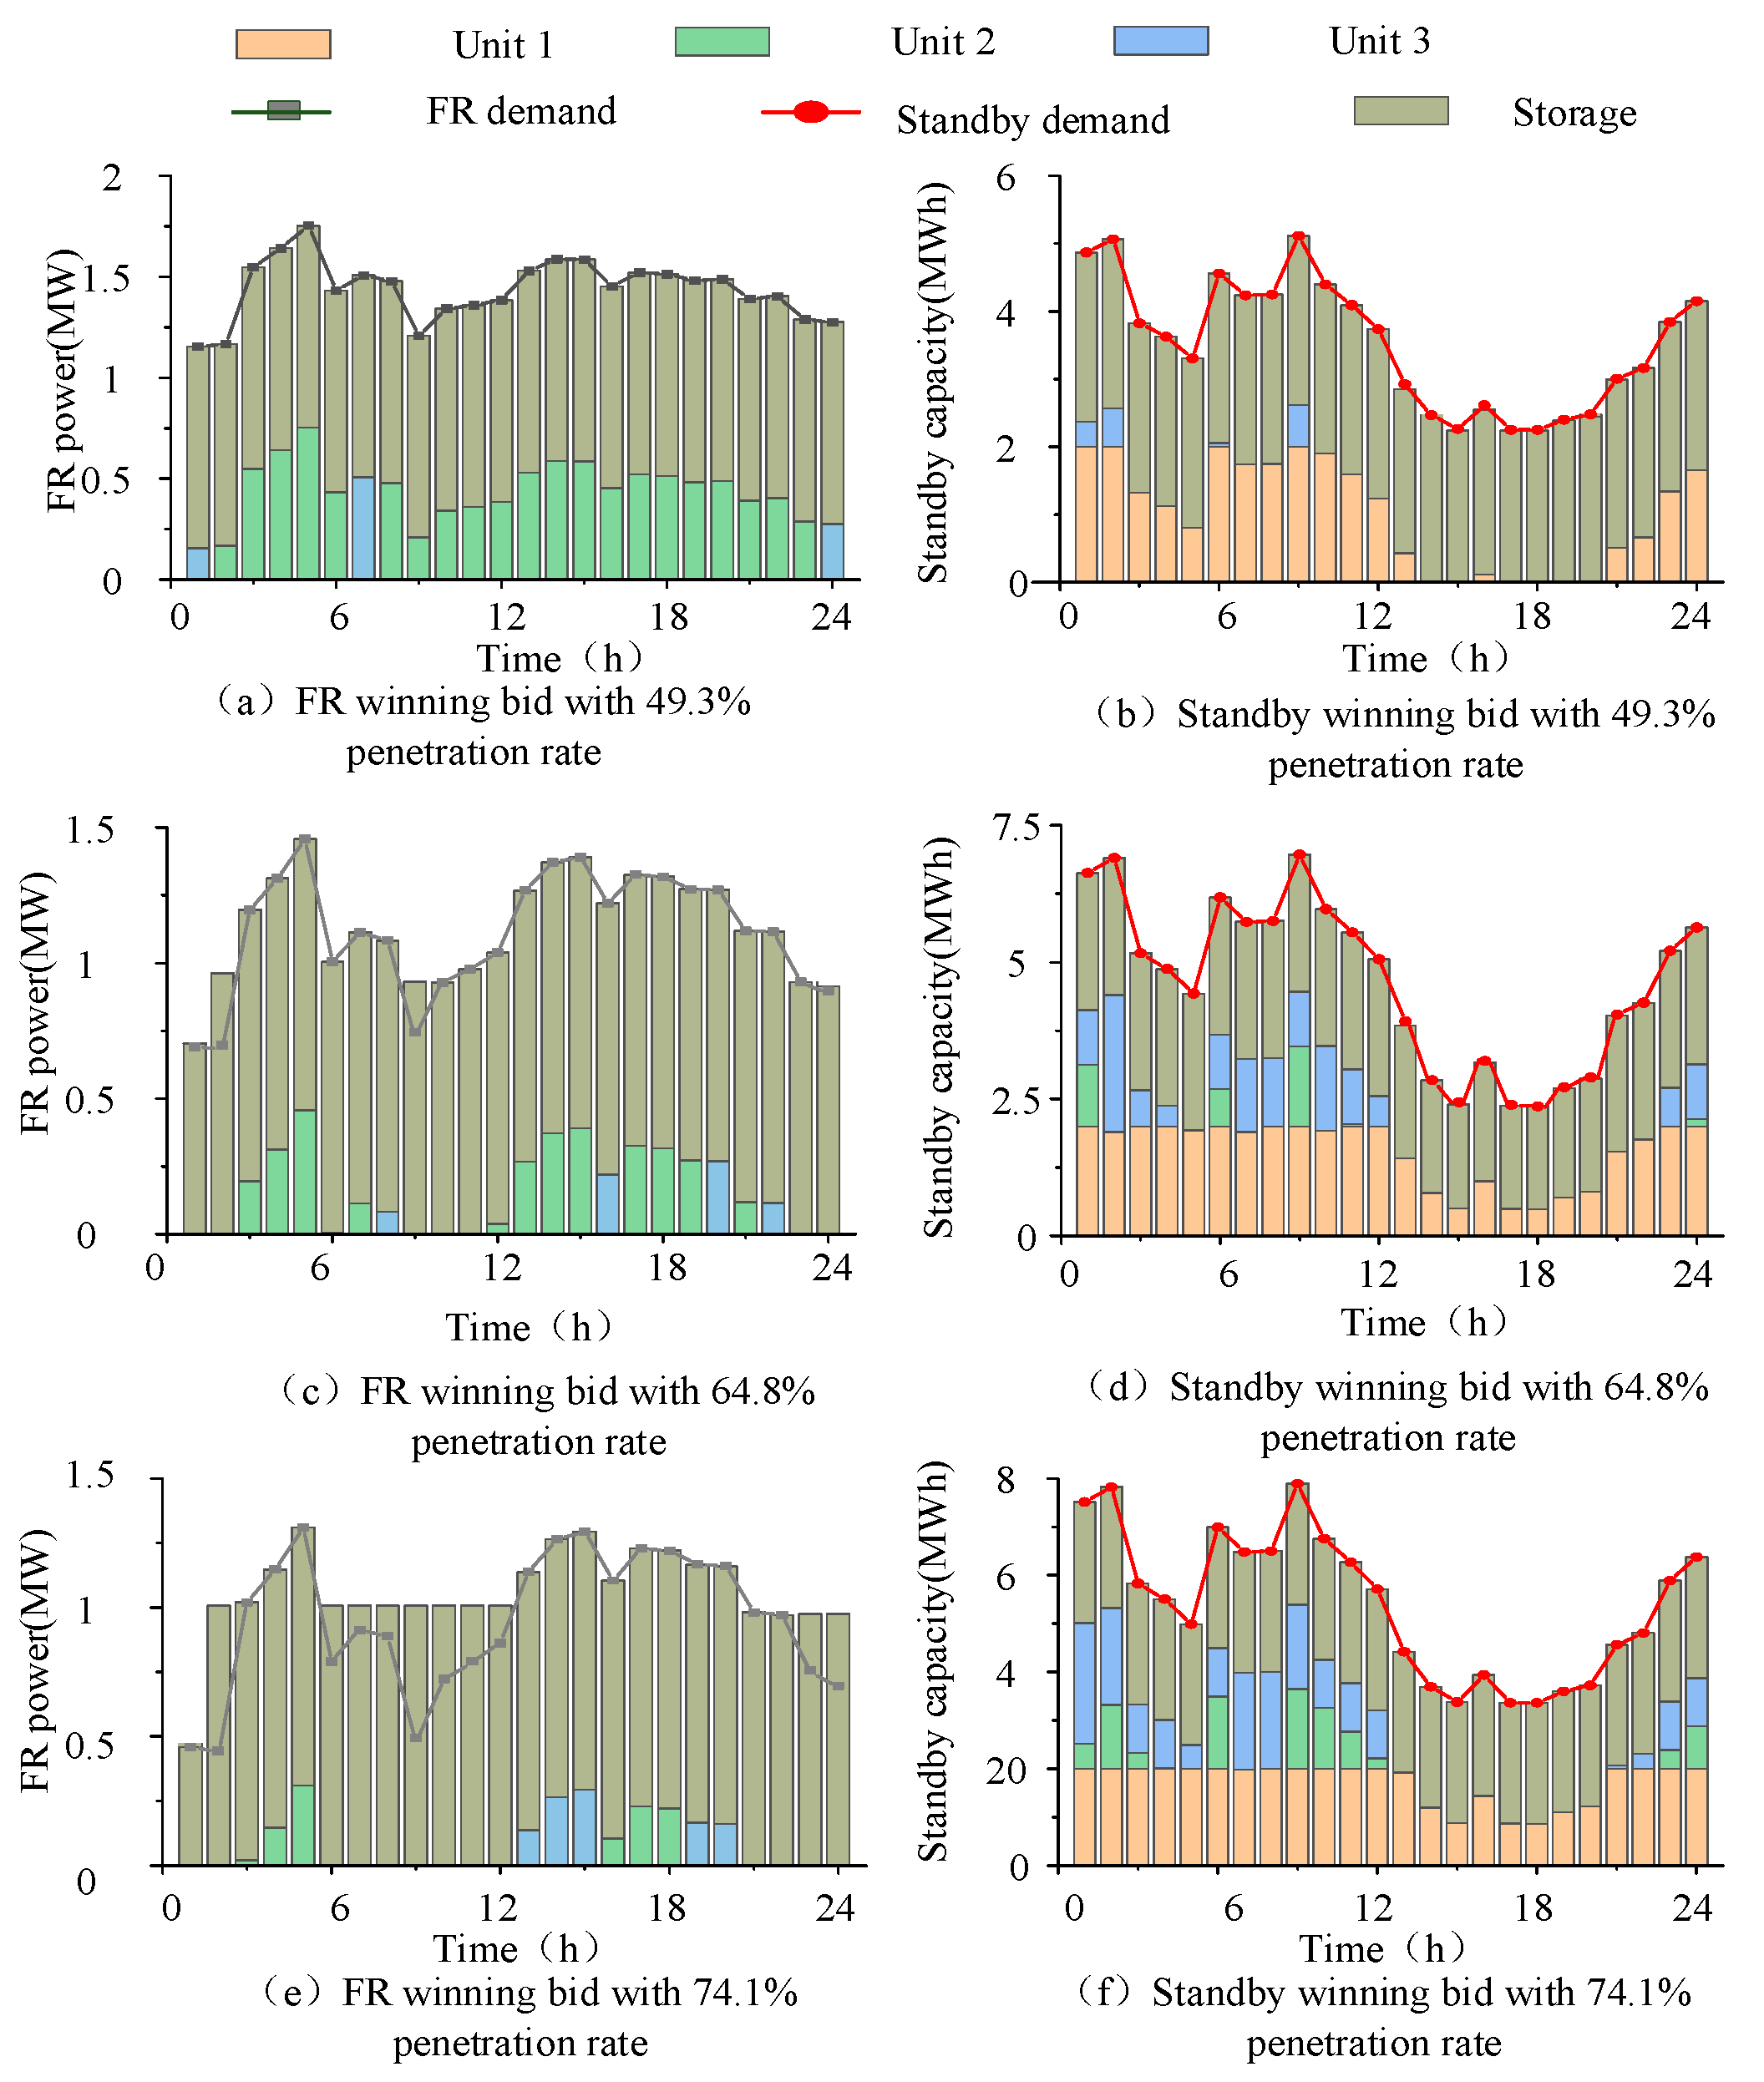
- A comprehensive analysis setting the perspective of a gradual increase in the penetration of the RES was conducted, pointing to the trend of increasing and then decreasing the benefits and utilization of the ESS. Derived from this, the sensitivity parameters had to be rationally selected for ensuring the operation of the system and improving the economy of the system regulation.
Author Contributions
Funding
Institutional Review Board Statement
Informed Consent Statement
Data Availability Statement
Conflicts of Interest
Nomenclature
| , | Abandoned wind and solar power at time t | Output of thermal power generator i at time t | |
| Standby, peak shaving, and frequency regulation demands for energy storage users at time t | The cost and declared amount of energy storage type K for regulating demand m | ||
| Response of energy storage operators to standby, peak shaving, and frequency regulation needs at time t | Trading prices for standby, peak shaving, and frequency modulation needs at time t | ||
| Benefits of wind and photovoltaic power stations | Penalty cost for abandoned wind and solar power at time t | ||
| Cost functions for power generation, frequency regulation, and standby of thermal units | The planned output, frequency regulation and standby of thermal power generation unit i used for output and at time t | ||
| Grid benefits | Feedback deviation | ||
| Feedback deviation factor | Predicted load at time t | ||
| , | Predicting wind power and photovoltaic output at time t | Upper and lower limits of output for thermal unit i | |
| Up and down climbing rates of thermal power generator i | Benefits of hybrid energy storage systems | ||
| Charging and discharging power of electrochemical energy storage at time t | The power of electrolytic cells and fuel cells at time t | ||
| The power of the air compressor and expander at time t | , | Declared power of each type of entities participating in primary frequency regulation at time t | |
| , , | The declared standby capacity of multiple entities at time t | The charging and discharging state of electrochemical energy storage at time t | |
| Maximum charging and discharging power of energy storage | Factors involved in frequency regulation and standby of electrochemical energy storage | ||
| Upper and lower limits of electrochemical energy storage capacity | Charging and discharging efficiency of electrochemical energy storage | ||
| , , | Gas in the hydrogen storage tank at time t and its upper and lower bounds | Energy conversion efficiency of electrolytic cells and fuel cells | |
| ,, | Air pressure and its upper and lower limits in the storage chamber at time t | Air storage chamber volume | |
| , | Air mass flow rates into out of the expander at time t | , | The temperature at the air inlet and inside the storage chamber |
| , | Ideal gas constant and specific heat capacity | , | Operating efficiency of compressors and expanders |
| , | Ideal air temperature at the inlet of the k stage and final stage compressors | , | The compression ratio of the k stage and the final stage compressor under rated operating conditions at time t |
| n | Number of compressor and expander stages | Ideal air temperature at the inlet of the j stage expander | |
| Expansion ratio of j level expander under rated operating state | , | Operating state variables of compressor and expander at time t | |
| , | Minimum working time for compressors and expanders | Factors of hydrogen energy storage participating in frequency modulation mileage |
References
- Ding, T.; Sun, J.; Huang, Y.; Mu, C.; Huang, W.; Geng, S. Domestic and Foreign Present Situation of Capacity Market with Energy Storage and Thought on Its Mechanism. Autom. Electr. Power Syst. 2023, 1–22. [Google Scholar]
- Xie, X.; Ma, N.; Liu, W.; Zhao, W.; Xu, P.; Li, H. Functions of Energy Storage in Renewable Energy Dominated Power Systems: Review and Prospect. In Proceedings of the CSEE, Lisbon, Portugal, 29–31 March 2023; Volume 43, pp. 158–169. [Google Scholar]
- Chen, X. Research on the Development Problems and Countermeasures of Electrochemical Energy Storage Industry in China. Energy Res. Util. 2023, 15, 39–42. [Google Scholar]
- National Development and Reform Commission. Notice on Further Promoting the Participation of New Energy Storage in the Electricity Market and Dispatching Application. Bull. State Counc. People’s Repub. China 2022, 475. [Google Scholar]
- Ahmadi, S.E.; Sadeghi, D.; Marzband, M.; Abusorrah, A.; Sedraoui, K. Decentralized bi-level stochastic optimization approach for multi-agent multi-energy networked micro-grids with multi-energy storage technologies. Energy 2022, 245, 123223. [Google Scholar] [CrossRef]
- Cheng, S.; Wang, R.; Xu, J.; Wei, Z. Multi-time scale coordinated optimization of an energy hub in the integrated energy system with multi-type energy storage systems. Sustain. Energy Technol. Assess. 2021, 47, 101327. [Google Scholar] [CrossRef]
- Liu, Y.; Liu, Q.; Guan, H.; Li, X.; Bi, D.; Guo, Y.; Sun, H. Optimization strategy of configuration and scheduling for user-side energy storage. Electronics 2021, 11, 120. [Google Scholar] [CrossRef]
- Okubo, T.; Shimizu, T.; Hasegawa, K.; Kikuchi, Y.; Manzhos, S.; Ihara, M. Factors affecting the techno-economic and environmental performance of on-grid distributed hydrogen energy storage systems with solar panels. Energy 2023, 269, 126736. [Google Scholar] [CrossRef]
- Anthony, M.G.; Xiao-Yu, W. Hybrid lithium-ion battery and hydrogen energy storage systems for a wind-supplied microgrid. Appl. Energy 2023, 345, 121311. [Google Scholar]
- Yan, H.; Zhang, W.; Kang, J.; Yuan, T. The necessity and feasibility of hydrogen storage for large-scale, long-term energy storage in the new power system in china. Energies 2023, 16, 4837. [Google Scholar] [CrossRef]
- Deng, J.; Wang, X.; Chen, T.; Meng, F. An energy router based on multi-hybrid energy storage system with energy coordinated management strategy in island operation mode. Renew. Energy 2023, 212, 274–284. [Google Scholar] [CrossRef]
- Cui, S.; Wu, J.; Gao, Y.; Zhu, R. A high altitude prosumer energy cooperation framework considering composite energy storage sharing and electric-oxygen-hydrogen flexible supply. Appl. Energy 2023, 349, 121601. [Google Scholar] [CrossRef]
- Pan, C.; Fan, H.; Zhang, R.; Sun, J.; Wang, Y.; Sun, Y. An improved multi-timescale coordinated control strategy for an integrated energy system with a hybrid energy storage system. Appl. Energy 2023, 343, S0306261923005019. [Google Scholar] [CrossRef]
- Jiang, Y.; Kang, L.; Liu, Y. Multi-objective design optimization of a multi-type battery energy storage in photovoltaic systems. J. Energy Storage 2021, 39, 102604. [Google Scholar] [CrossRef]
- Lai, S.; Qiu, J.; Tao, Y. Credit-based pricing and planning strategies for hydrogen and electricity energy storage sharing. IEEE Trans. Sustain. Energy 2022, 13, 67–80. [Google Scholar] [CrossRef]
- Hemmati, R.; Mehrjerdi, H.; Bornapour, M. Hybrid hydrogen-battery storage to smooth solar energy volatility and energy arbitrage considering uncertain electrical-thermal loads. Renew. Energy 2020, 154, 1180–1187. [Google Scholar] [CrossRef]
- Li, X.; Chen, L.; Du, X.; Wen, J. Research Status and Prospect of Shared Energy Storage Operation Mechanism and Trading Mode on Generation Side. J. Electr. Eng. 2023, 18, 188–200. [Google Scholar]
- An, Q.; Wang, J.; Wu, Z.; Zhong, H.; Li, G. Benefit allocation mechanism design of electricity markets with penetration of high proportion of renewable energy. Autom. Electr. Power Syst. 2022, 46, 13–22. [Google Scholar]
- Xing, S.; Xie, J.; Jin, Y.; Zhou, C. Agent-based simulation of day-ahead market pricing mechanism for energy-frequency regulation-reserve combined operation for power systems with wind power. Power Syst. Technol. 2022, 12, 1–12. [Google Scholar]
- Fan, T.Y.; Wang, H.Y.; Wang, W.Q. Coordinated optimization scheduling of microgrid and distribution network based on cooperative game considering active/passive demand response. Power Syst. Technol. 2022, 46, 453–463. [Google Scholar]
- Seyedali, M.; Lewis, A. The Whale Optimization Algorithm. Adv. Eng. Softw. 2016, 95, 51–67. [Google Scholar]
- Li, X.; Wang, W. Bi-level robust game optimal scheduling of regional comprehensive energy system. J. Zhejiang Univ. Eng. Sci. 2021, 55, 177–188. [Google Scholar]


| Thermal Units | Upper Limit /MWh | Lower Limit /MWh | Climbing Power /MW | Cost Coefficient/Ұ (MWh)−1 | |||
|---|---|---|---|---|---|---|---|
| 1 | 8 | 3 | 2 | 160 | 1.6 | 14 | 12 |
| 2 | 5 | 2 | 0.5 | 140 | 1.4 | 12 | 15 |
| 3 | 5 | 2 | 0.5 | 210 | 2 | 16 | 15 |
| Parameter | Value | Parameter | Value | Parameter | Value | Parameter | Value |
|---|---|---|---|---|---|---|---|
| (%) | 95 | (%) | 15 | (MWh) | 2 | 1 | |
| (%) | 93 | (%) | 93 | (kg/s) | 0.4 | (%) | 50% |
| (MW) | 0.5 | (MWh) | 1 | (kg/s) | 1.44 | (%) | 20% |
| (MW) | 1/0 | (MPa) | 4 (5.5) | Compressor (expander) efficiency (%) | 85 | Compressor (expansion) level | 4 |
| 3.5 | (%) | 60/95 | (MW) | 2.5/2 | (MW) | 2/1.2 | |
| (MW) environment temperature (K) | 0.8/0.48 298 | (kg) | 2800/500 | Rated inlet temperature of compressor (K) | 312 | Rated inlet temperature of expander (K) | 363 |
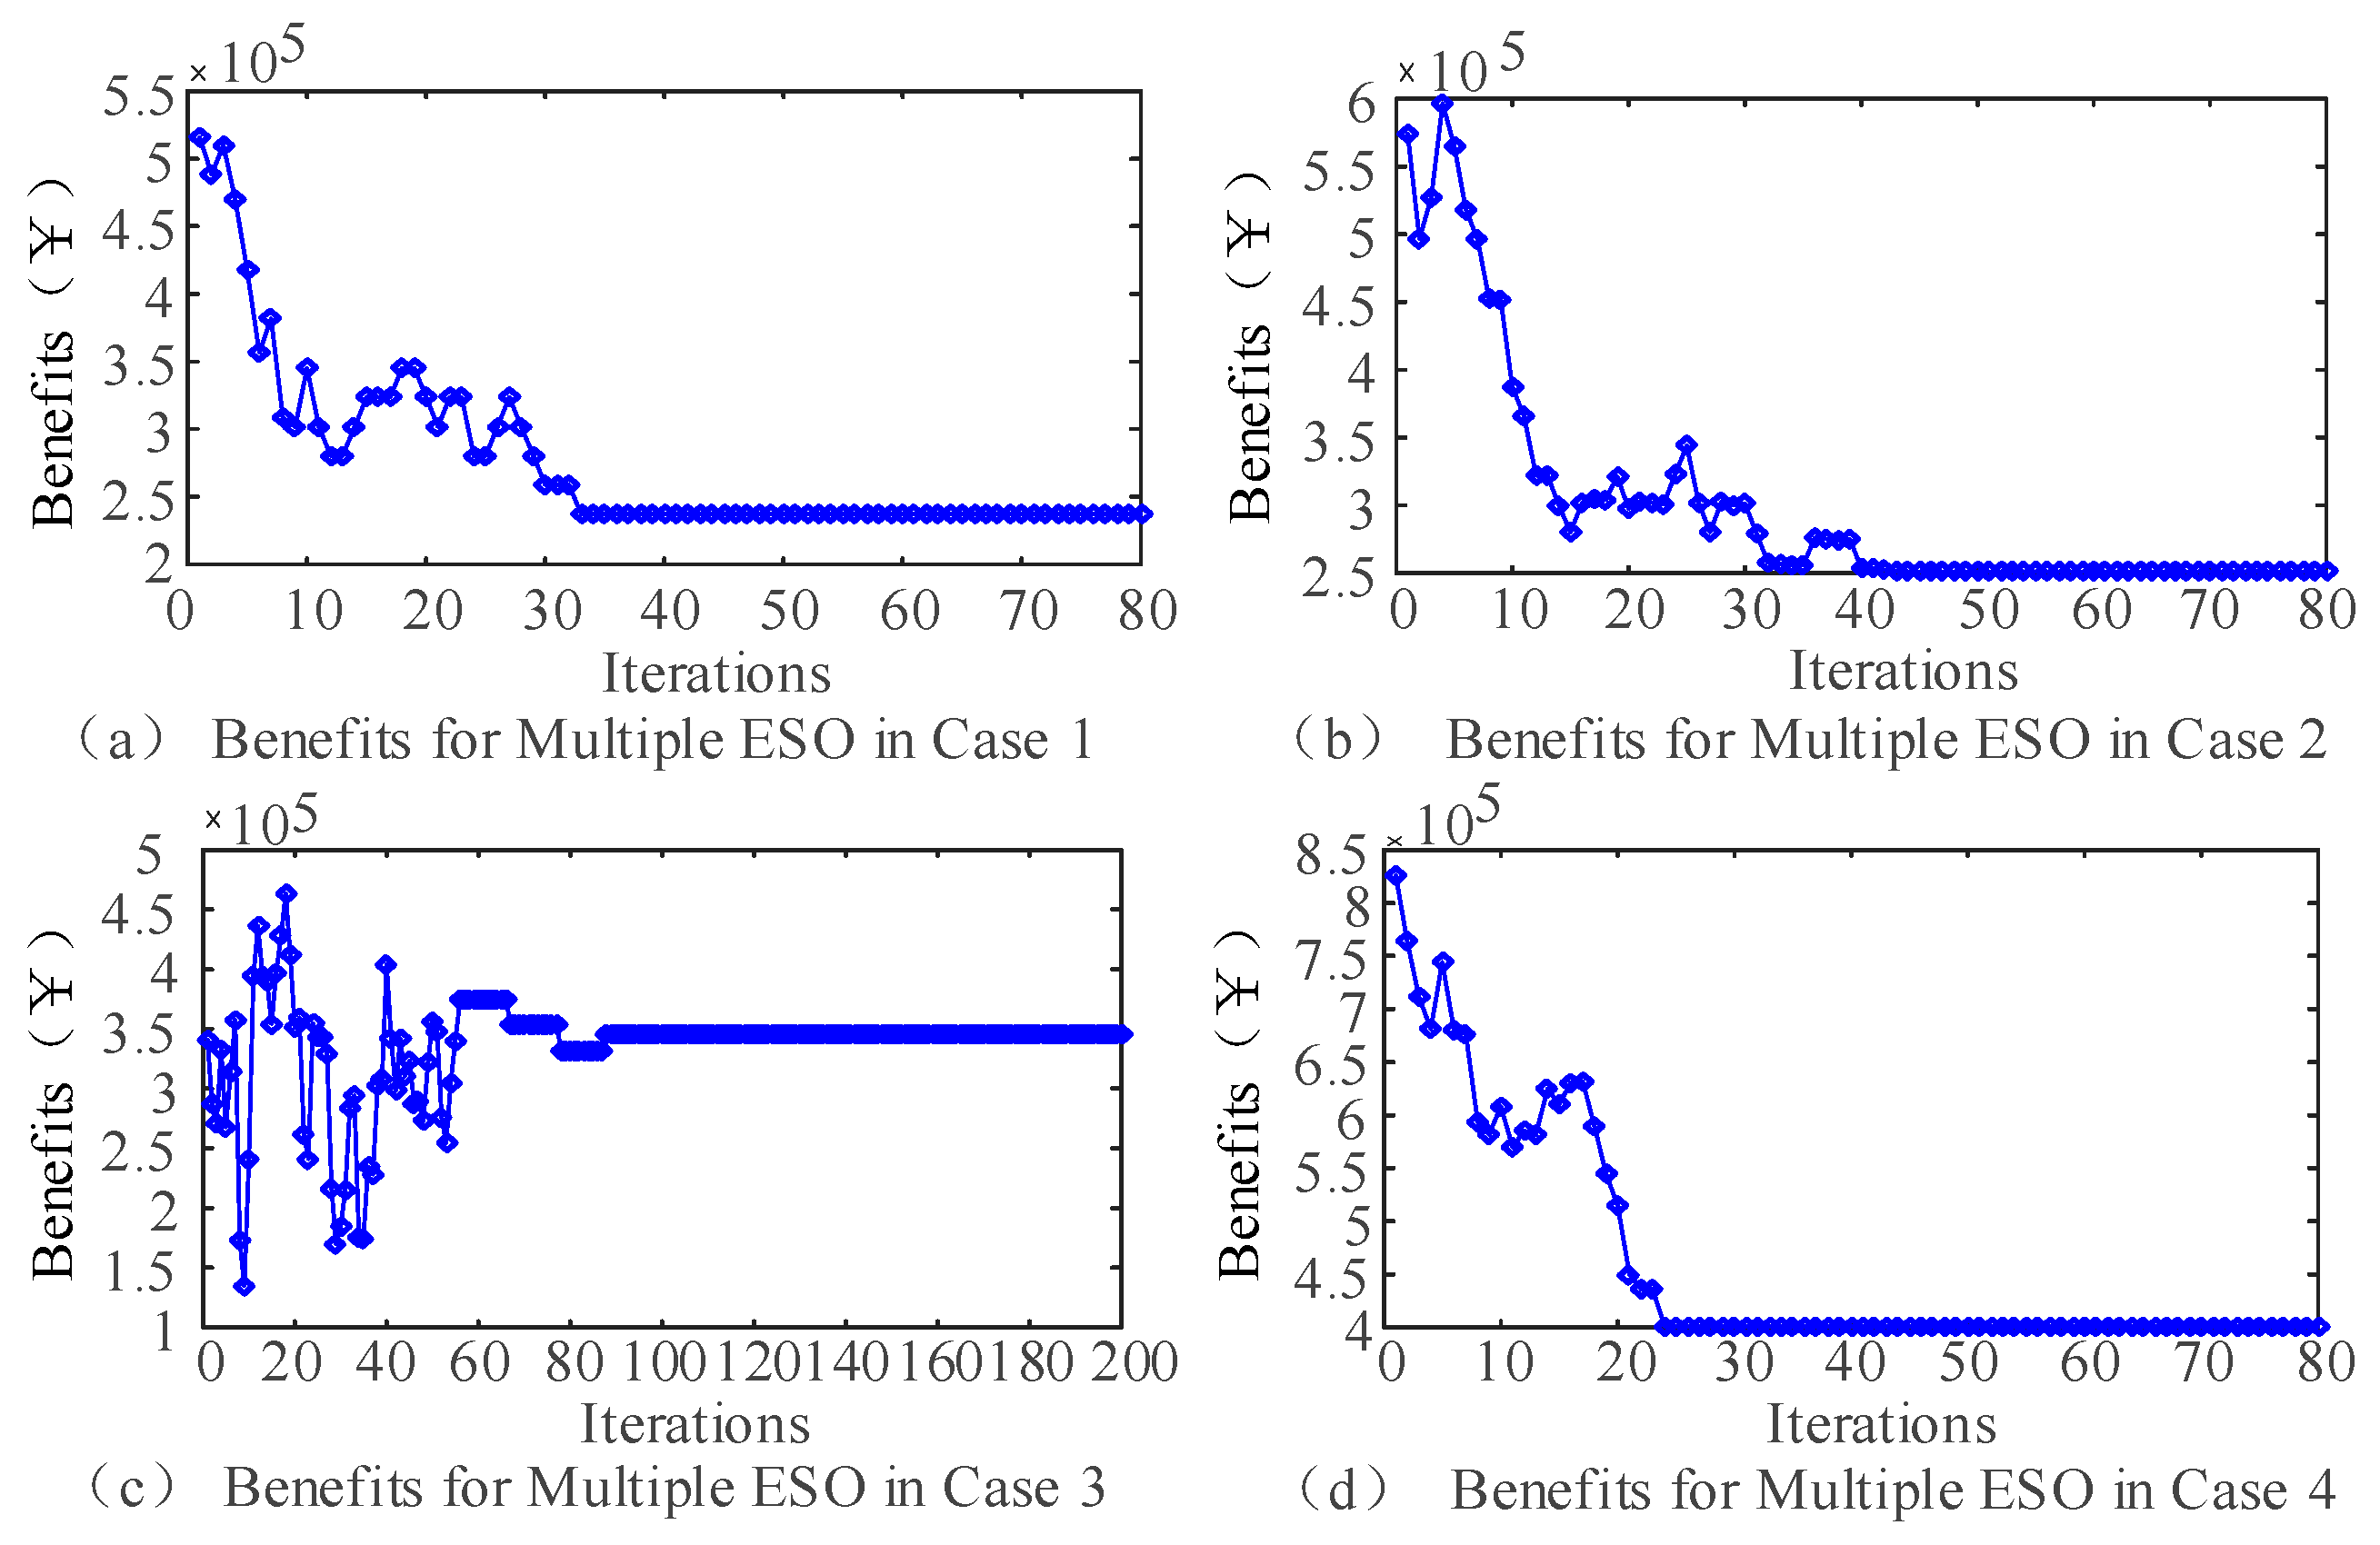
| Case | Participation in Electricity Markets | Participation in FR Market | Participation in Standby Power Market | Multiple ESO Benefits (Ұ) |
|---|---|---|---|---|
| Case 1 | √ | 2.67 × 10⁵ | ||
| Case 2 | √ | √ | 2.82 × 10⁵ | |
| Case 3 | √ | √ | 3.95 × 10⁵ | |
| Case 4 | √ | √ | √ | 4.69 × 10⁵ |
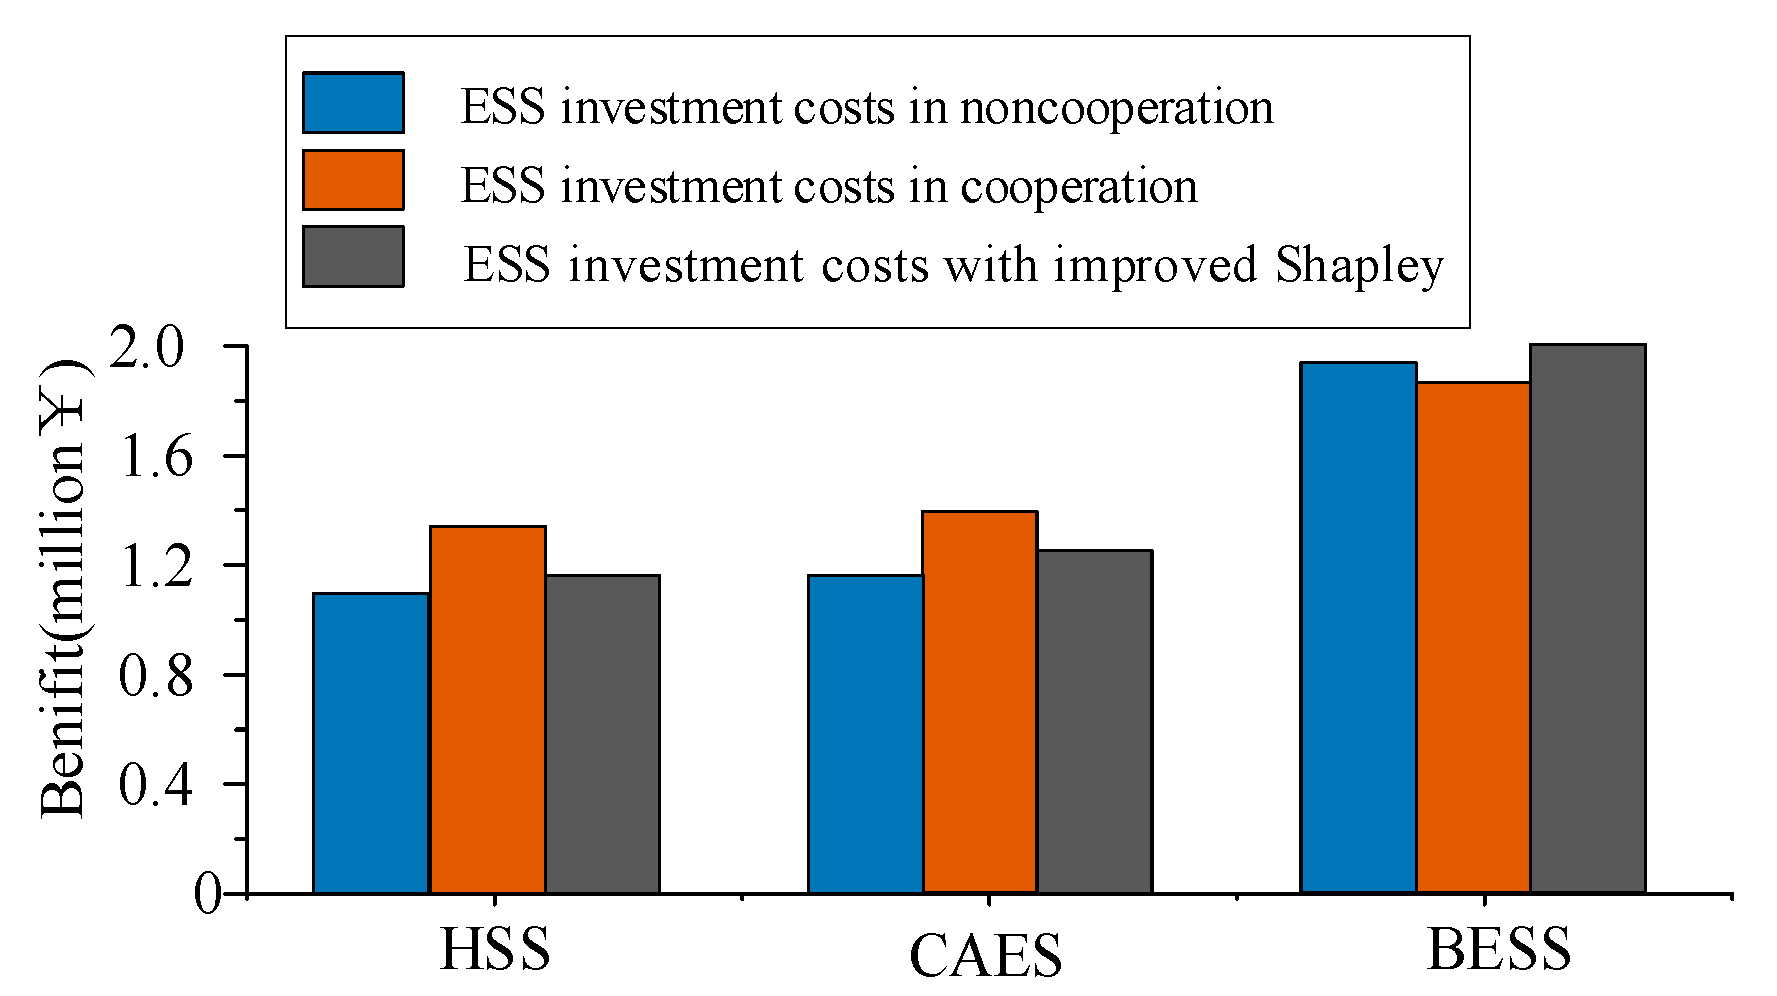
| Extent of Cooperation | Participants | Benefits of ESS (Ұ) | Total Profit (Ұ) |
|---|---|---|---|
| Full cooperation | BESS | 180,524 | 4.69 × 10⁵ |
| HES | 138,727 | ||
| CAES | 149,859 | ||
| Noncooperation | BESS | 182,258 | 4.16 × 10⁵ |
| HES | 110,825 | ||
| CAES | 123,324 |
Disclaimer/Publisher’s Note: The statements, opinions and data contained in all publications are solely those of the individual author(s) and contributor(s) and not of MDPI and/or the editor(s). MDPI and/or the editor(s) disclaim responsibility for any injury to people or property resulting from any ideas, methods, instructions or products referred to in the content. |
© 2023 by the authors. Licensee MDPI, Basel, Switzerland. This article is an open access article distributed under the terms and conditions of the Creative Commons Attribution (CC BY) license (https://creativecommons.org/licenses/by/4.0/).
Share and Cite
Zhi, J.; Xue, Y.; Li, X.; Song, C.; Zhang, K.; Chen, L. A Transaction Model and Profit Allocation Method of Multiple Energy Storage Oriented to Versatile Regulation Demand. Sustainability 2023, 15, 15849. https://doi.org/10.3390/su152215849
Zhi J, Xue Y, Li X, Song C, Zhang K, Chen L. A Transaction Model and Profit Allocation Method of Multiple Energy Storage Oriented to Versatile Regulation Demand. Sustainability. 2023; 15(22):15849. https://doi.org/10.3390/su152215849
Chicago/Turabian StyleZhi, Jin, Yuantian Xue, Xiaozhu Li, Changcheng Song, Kaipeng Zhang, and Laijun Chen. 2023. "A Transaction Model and Profit Allocation Method of Multiple Energy Storage Oriented to Versatile Regulation Demand" Sustainability 15, no. 22: 15849. https://doi.org/10.3390/su152215849