Article

Local Government Debt and Corporate Investment Behavior in China: Real versus Financial Investment

College of Economics, Jinan University, Guangzhou 510632, China
*
Author to whom correspondence should be addressed.
Sustainability 2023, 15(22), 15756; https://doi.org/10.3390/su152215756
Submission received: 18 October 2023 / Revised: 2 November 2023 / Accepted: 6 November 2023 / Published: 8 November 2023
(This article belongs to the Special Issue Corporate Governance for Sustainable Finance)

Abstract

:
The ongoing expansion of local government debt (LGD) in China constitutes a significant impediment to economic development, while the existing literature predominantly concentrates on macro-level investigations, neglecting the repercussions of government debt expansion on firms. Firms serve as fundamental constituents of the real economy, and the suitability of their investment structure is a pivotal determinant of their robust development. Therefore, it is of great significance to investigate whether the investment structure of non-financial firms will undergo deviations attributable to the expansion of local government debt. This paper uses a two-way fixed-effects model to examine the causal effect of local government debt on firms’ investment structures. The quasi-natural experiment using the DID model with “Document 43” issued by China on local government debt governance as a policy shock can be a good endogeneity test. It is found that local government debt exacerbates the trend of “exit from real to virtual” of enterprises, leading to a bias towards financial investment in the investment structure of enterprises, and this result is still robust after a series of robustness tests. A heterogeneity analysis shows that the impact of LGD on the investment structure of firms mainly exists in non-state-owned firms, small-scale firms, and firms with high financing constraints. Overall, this study provides new evidence on how the government influences the investment structure of Chinese firms through the perspective of LGD, which helps firms to prevent and cope with the risks associated with LGD. Furthermore, it offers practical references and policy insights for government initiatives in the realm of local debt governance.

1. Introduction

During the past decades, the world economy has witnessed a series of crises. One notable instance is the onset of the global financial crisis in 2008, which triggered a synchronized deceleration in economic activity across the globe. Moreover, the outbreak of the COVID-19 epidemic at the end of 2019 intensified the vulnerability of a global economic downswing, bringing a high degree of uncertainty and a huge devastating impact on global economic development. It was even declared by the World Health Organization as a global health disaster.
To withstand external shocks and cope with economic recessions, governments worldwide have implemented a series of fiscal and monetary measures. For instance, the Chinese government executed a “four trillion” fiscal stimulus strategy, complemented by credit expansion [1]. Responding to the central government’s directive, local governments at various tiers implemented a high-density investment approach accompanied by elevated debt levels, leading to a sharp increase in the number of local government financing platforms (LGFPs) and an unanticipated expansion of local debt magnitude. These massive and diverse forms of local government debt served as a safeguard for public investment during China’s rapid economic growth phase, emerging as a pivotal driving force behind the “growth miracle” of the Chinese economy. However, concurrently, the risks associated with these debts have accumulated. They transmit to the real economy through complex financial channels, which has a serious impact on the stability of the external business environment of enterprises and has become a major hidden danger hindering the development of China’s economy [2,3].
Up to this point, a significant amount of literature has been dedicated to the expansion of government debt. However, the majority of these analyses have been conducted at the macro level [4,5]. For instance, the investigation by Mao et al. (2023) [6] reveals that the competitive economic growth objectives set by local governments serve as an endogenous root cause for the surge in urban debt in China. In addition, Cai and Song (2022) [7] confirm that the role of China’s local government debt in fostering regional economic growth is notably significant. Moreover, this promotion exhibits a substantial spatial spillover effect, with the central region experiencing the most pronounced impact on economic growth, followed by the eastern region, while the western region remains largely unaffected. Interestingly, similar outcomes are also reported by Yang et al. (2022) [8]. Furthermore, as revealed by Tang (2022) [9], the debt levels of local governments in China have exceeded a reasonable threshold, and the expansion of debt has demonstrated a pronounced crowding-out effect on the real economy. While these macro-level studies offer a comprehensive depiction of overarching trends, they may not fully elucidate the intricacies that distinguish individual firms [10].
To the best of our knowledge, there has been limited research conducted at the micro level concerning government debt, with a predominant focus on its implications for corporate innovation and pollution. For example, as illustrated by Fan et al. (2022) [11], government debt escalation elevates the cost of capital for firms, thereby constraining their capacity to engage in research and development (R&D) initiatives. Notably, firms with financial constraints are more vulnerable to the adverse effects of government debt expansion. Similar findings are reported by Chen et al. (2022) [12]. Their research indicates that the escalation of local debt levels not only weakens firms’ capabilities for green innovation but also generates larger financial risks. In addition, Zhou et al. (2023) [13] observed that the proliferation of local government debt amplifies the financing constraints faced by firms. This, in turn, accentuates the level of pollution attributable to firms, particularly those located in areas characterized by weaker financial resilience and lower governance quality. Moreover, Xie et al. (2023) [14] confirmed a substantial positive correlation between local government debt and the pollution emissions of firms. They further ascertain that this is realized through the means of increased investments in fixed assets and a reduction in firms’ R&D expenditures.
As is well known, enterprises serve as the fundamental constituents of the real economy, and the structure of their investments constitutes a crucial factor for the healthy development of enterprises, especially when faced with a highly turbulent external market environment and challenging conditions of deteriorating external financing. The significance of investment decision-making is particularly underscored in such circumstances [15,16]. It is worth noting that although a limited number of scholars have explored the ramifications of government debt on firms from an investment perspective, their investigations have primarily delved into the specific investment practices of firms [17], with less emphasis on the structural aspects of investment. However, emerging markets typically exhibit institutional imperfections and regulatory gaps compared to developed markets, which may incentivize non-financial firms to pursue speculative financial investments over long-term productive investments [18]. In particular, the trend of economic virtualization has emerged in China at this stage. Many non-financial enterprises have not increased their financial investments due to the liquidity of financial assets but rather as a result of pursuing short-term benefits without due consideration, exacerbating the operational risks faced by these firms [19]. Therefore, it is crucial to delve deeply into the micro-level analysis to ascertain whether the investment decisions of non-financial firms are influenced by the expansion of government debt, and if so, what form of bias may arise in their investment patterns. These studies hold significant relevance, particularly in the context of the ongoing deceleration in China’s real economy and the growing trend of aggressive financialization among non-financial firms. They also carry important implications for policymakers and corporate management.
This study investigates the impact of LGD on the investment arrangement of non-financial corporations in China. We employed a two-way fixed effects model to identify the causal relationship between LGD and the investment structure of non-financial firms. Additionally, to alleviate endogeneity, we utilized a double difference model for quasi-natural experiments. The results indicate that the expansion of LGD exacerbates the inclination of non-financial firms toward financialization. Importantly, we observed that effectively managing the magnitude of local debt results in non-financial firms decreasing their financial investment and increasing their bias towards real investment. Moreover, we find this result to be robust through various robustness tests, such as parallel trend tests, modified model settings, the substitution of explanatory variables, and placebo tests. Notably, our further analysis demonstrates that the increase in LGD leads to a bias in the investment structure of non-SOEs and highly constrained financing firms towards financial investment, while SOEs and low-constrained financing firms are not affected.
This paper’s main findings are summarized below. First, although a large number of studies have examined the impact of LGD from the macro level, we analyze the impact of LGD on the investment structure of enterprises from the micro level, which enriches and expands the study of the microeconomic effects of LGD governance. This study is particularly timely, given China’s accelerating pace of capital market opening. Additionally, the “over-financialization” of non-financial enterprises has led to the “exit from real to virtual” investment structure. As such, this paper offers valuable insights to policymakers to clarify the impact of LGD governance on correcting the bias of corporate investment structures. Second, while some literature has explored the “crowding out” [20,21,22] and “crowding in” [1,23] effects of LGD on corporate investment, there is no consensus on this issue [24]. More importantly, financial investment, another important component of corporate investment structures, has not been explored thoroughly. To address this gap in the literature, this paper aims to construct a first-order differential index of investment that considers both the real investments and financial investments of non-financial enterprises, which not only can better identify the influence of LGD on the bias of corporate investment structures but also incorporates financial investment into the research framework of this paper. In addition, to guarantee the strength and dependability of the outcomes, this paper employs a difference–in-differences model to mitigate the endogeneity problem.
It is essential to maintain logical connections between these sections. The paper is structured as follows: firstly, Section 2 provides an overview of the policy context of the study. Following this, Section 3 introduces the theoretical analysis and research hypotheses. In Section 4, our data and empirical strategy are presented. Section 5 reports and discusses the empirical results, and the final section, Section 6, focuses on the research mechanism and heterogeneity. The last part concludes our work with a discussion of its implications.

2. Background

Following the implementation of the tax-sharing reform in 1994, local governments in China have been faced with a significant challenge concerning the misalignment between their duty, expenditure responsibilities, and available financial resources [2]. Consequently, there is often a substantial funding gap in the process of economic construction, particularly in the realm of infrastructure construction. This predicament, characterized by an “upward concentration of financial resources” and a “downward concentration of duty”, has compelled local governments to resort to borrowing from formal and informal channels [25], either directly or indirectly. In response to the challenge of insufficient funds in the face of rapid economic development, they have commonly established financing platforms to issue debt financing and obtain mortgage loans from banks.
Local government financing platforms are usually financial institutions or investment and construction companies funded or controlled by local governments. The main objective of these platforms is to raise funds for local governments to support local infrastructure construction and project financing needs. These financing platforms are typically established under the direct control of the local government, with the platform’s leadership appointed and directly led by the local government. Furthermore, these platforms benefit from guarantees or implicit guarantee commitments provided by the local government to facilitate their financing activities [26]. More importantly, local government financing platforms will directly participate in local infrastructure investment and contribute to overall economic construction.
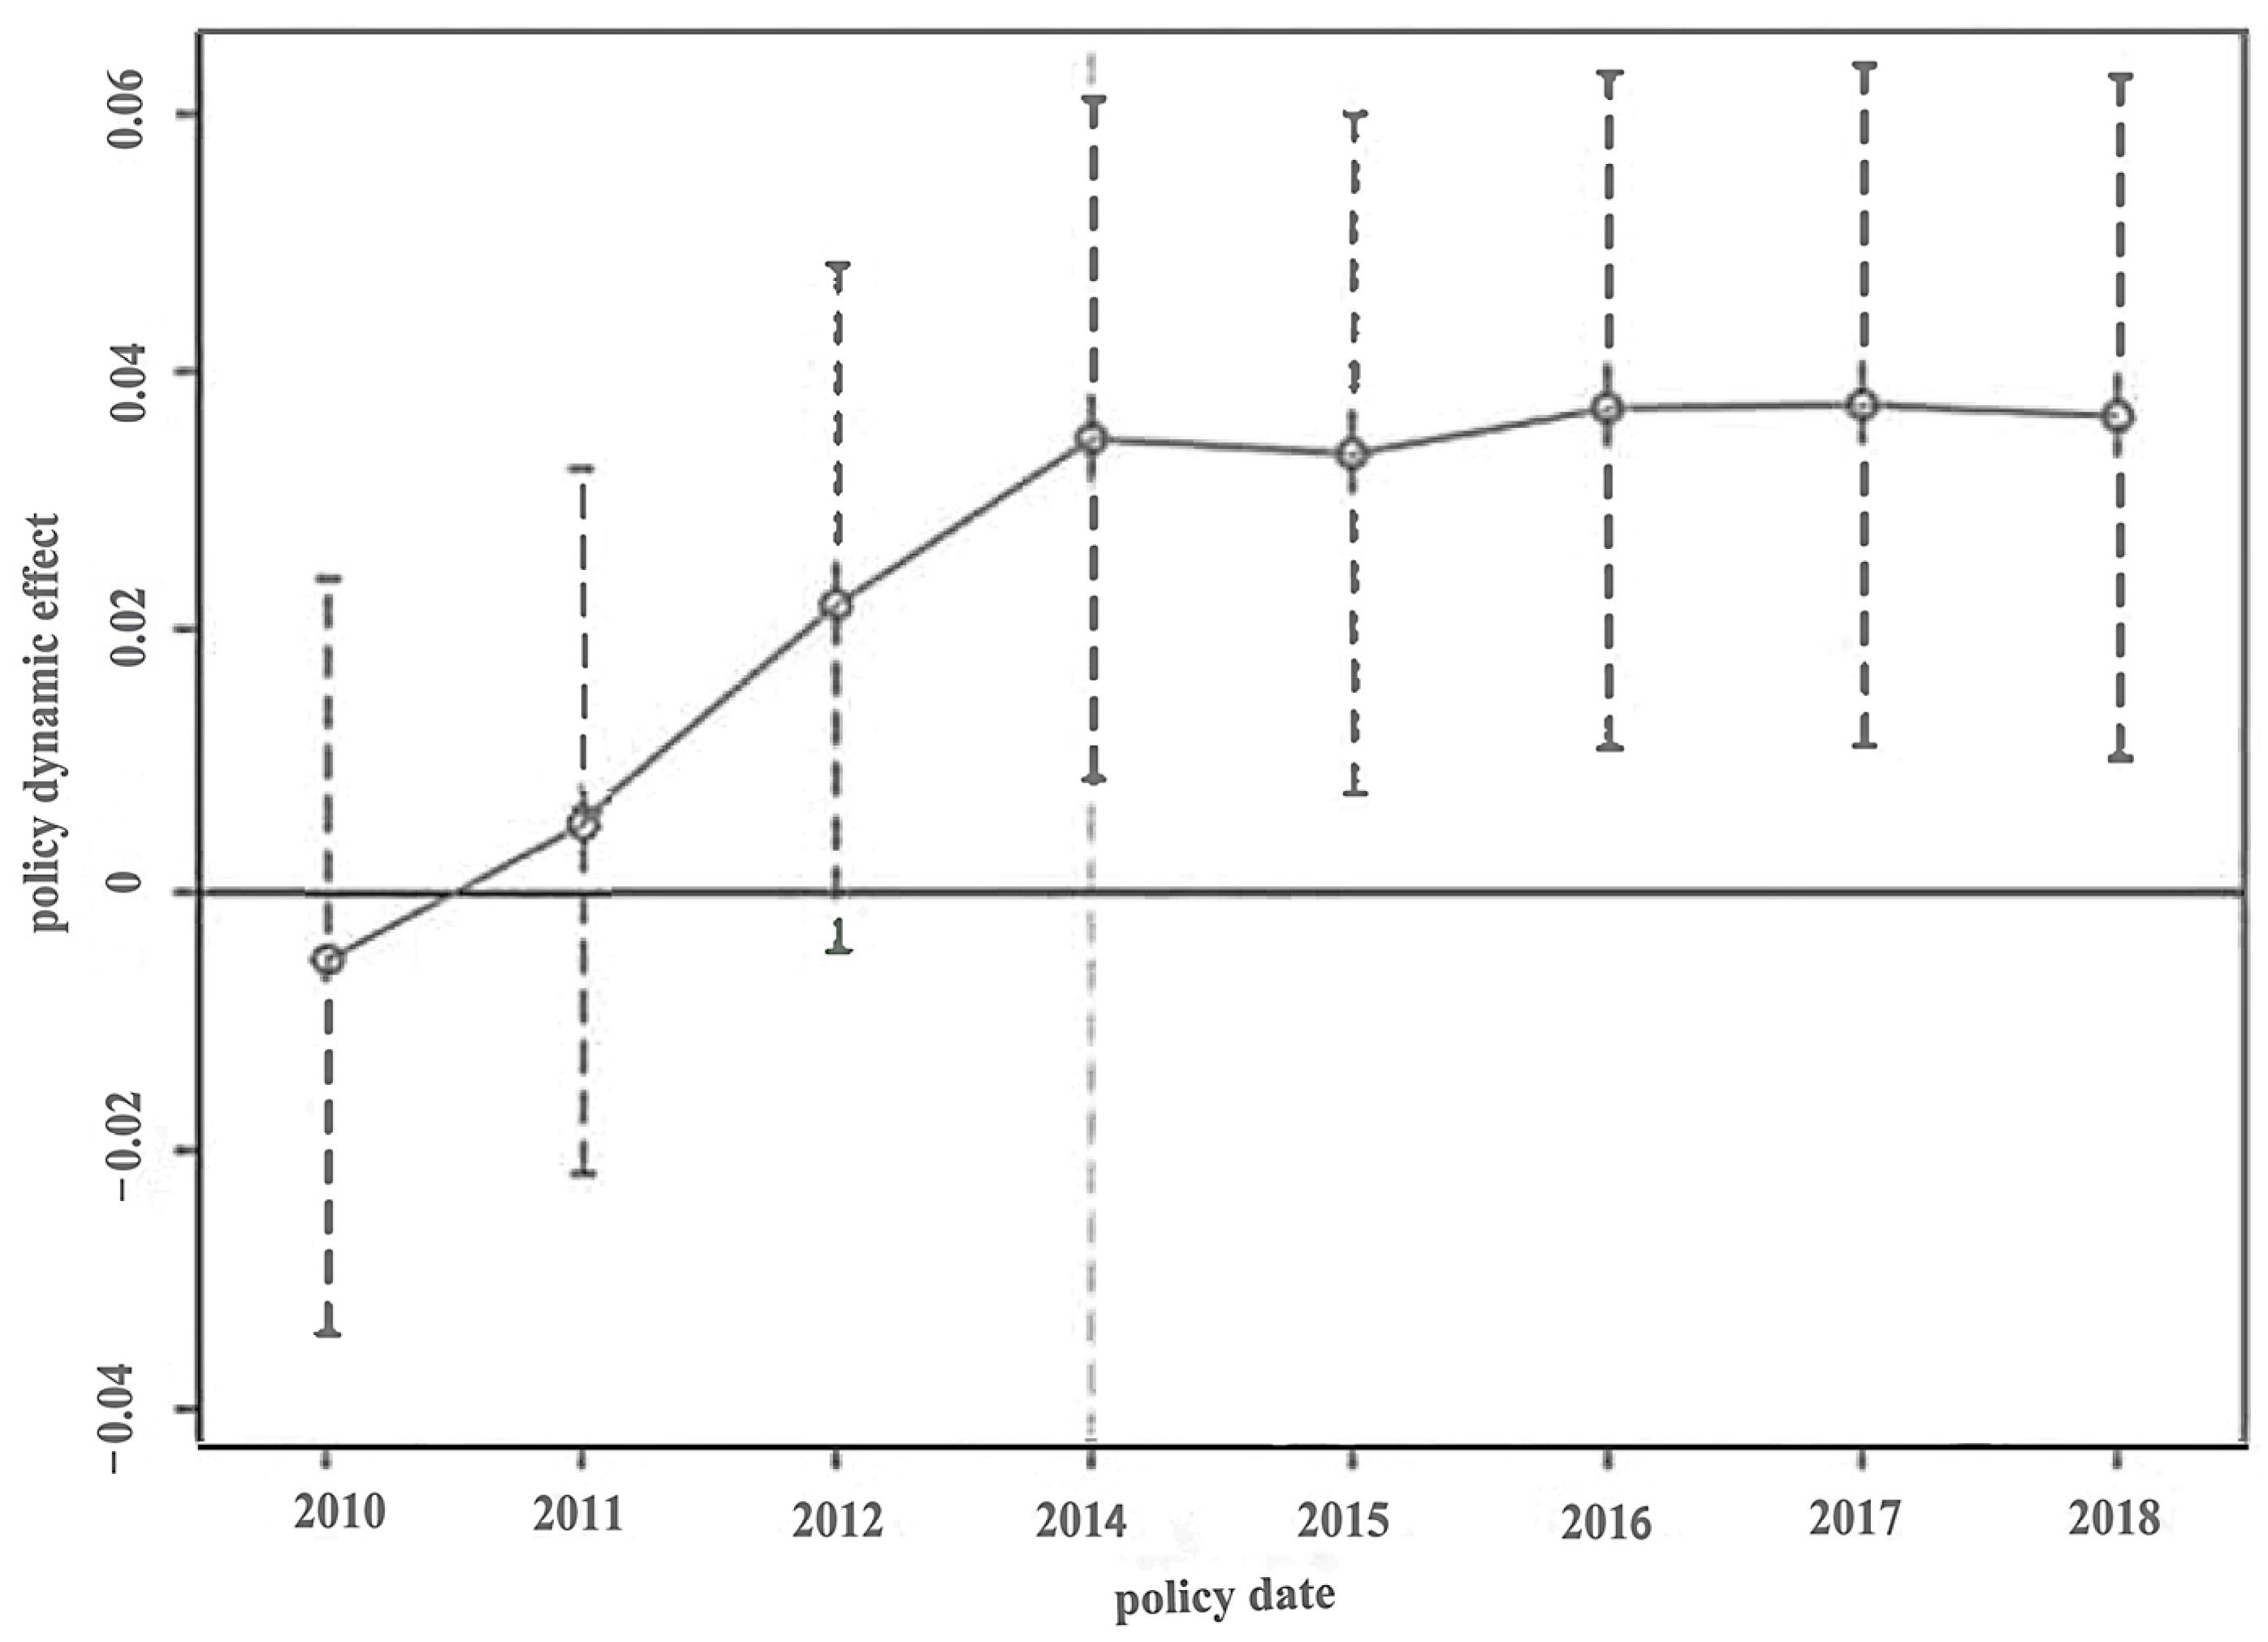
However, with the dramatic expansion of the LGD scale of financing platforms, some local government debt risks are increasingly accumulating, which reduces the quality of economic growth and may even induce a widespread financial crisis. In light of these concerns, the central government has shifted its policy orientation towards local government financing platforms from encouragement to a more stringent approach aimed at tightening control. This change in direction is driven by the goal of strengthening local government debt management and promoting the sustainable and healthy development of the national economy. In 2014, the State Council promulgated “Document No. 43”, known as the “Opinions of the State Council on Strengthening the Management of LGD”, which explicitly prohibits local governments from providing guarantees for financing platform companies. Instead, it advocates for measures such as the replacement of local government bonds and the regulation of urban investment bonds to address the potential risks associated with local government debts [27]. The implementation of this document signifies a gradual control and management of the extensively expanded local government debt, ultimately aiming to establish a sustainable local debt model by effectively controlling the scale of LGD.

3. Theoretical Analysis and Hypothesis

Generally speaking, non-financial firms’ investments can be classified into two main categories: investments in real assets and investments in financial assets. Specifically, real investments primarily comprise the purchase or acquisition of physical assets, such as real estate, production equipment, infrastructure, and other tangible assets. In contrast, financial asset investment refers to investing in a range of financial assets that are available in the financial market. Thus, firms can accumulate profits not only through investment and production operations but also through diverse financial channels. Nevertheless, under the constraint of resource boundaries, enterprises face complementary and substitution dynamics among various resources. They must make choices and allocations between fixed assets and financial assets based on their specific business development requirements. This implies the existence of a substitution effect between investment in real assets and financial assets investments [28].

3.1. The Impact of LGD on the Real Investments of Non-Financial Firms

Based on the existing literature, we learned that scholars usually analyze the impact of LGD on firms’ real investments mainly through the lenses of the crowding-in effect and the crowding-out effect. Among them, advocates of the crowding-in effect contend that local governments resort to debt issuance primarily to address the demands of local economic and social advancement, encompassing investing in local infrastructure construction and some other public welfare expenditures. These endeavors not only serve as crucial determinants in maintaining economic stability and fostering high-quality growth but also present firms with enhanced prospects for engaging in real investment activities [29]. Specifically, the crowding-in effect is observed predominantly in three areas: First, government debt is often used to invest in infrastructure construction and social public utilities, thereby amplifying the demand for goods and services, and then stimulating the production and investment of enterprises procured from relevant enterprises [30,31]. Correspondingly, such increased demand stimulates production and investment activities within enterprises. This, in turn, compels firms to expand their operational scope to cater to the burgeoning market demands and generate higher profits, thereby facilitating real investment endeavors. Second, the utilization of government debt to enhance local infrastructure construction not only fosters economic growth and social development but also improves the local investment environment, thereby increasing the willingness of enterprises to invest and attracting social capital [32]. Third, from the perspective of externality in economics, the improvement of urban basic transportation facilities can improve urban connectivity, reduce inter-city transportation costs, and promote inter-city factor flows. This optimization of resource allocation, reduction of trade barriers, and promotion of market integration collectively bestow positive externalities on corporate real investment activities [33,34].
Scholars subscribing to the theory of the crowding-out effect posit that the availability of funds and resources within society is inherently limited. In cases where the level of local debt is low, government borrowing can effectively activate idle funds in the area, thereby improving the investment environment for livelihood projects and enterprises. However, exceeding the equilibrium threshold of government debt can trigger a crowding-out effect [31,35]. On the one hand, local government financing platforms are often on the dominant side of financing in the traditional credit market, and thus local government debt expansion can displace credit resources that would otherwise be available to enterprises [22,36]. In particular, local governments in China generally have a strong incentive to invest, and overinvestment is commonplace [37]. This displacement, in turn, diminishes firms’ opportunities for debt financing [21], consequently hampering their real investment endeavors. On the other hand, the expansion of LGD simultaneously drives up the cost of debt financing for enterprises [12,38], intensifying the problem of “difficult and expensive financing” faced by private enterprises and SMEs, which ultimately leads to a decline in the scale of corporate investment and revenue. It is noteworthy to mention that Homapour et al. (2022) [39] have observed that corporations tend to exhibit elevated levels of leverage during periods of business cycle contractions. This finding suggests that expansionary fiscal and monetary policies implemented by governments to stimulate increased corporate borrowing may not yield the anticipated effectiveness.
As mentioned above, a reasonable level of government debt can promote economic growth, whereas exceeding a certain threshold may hinder economic development [11]. Nevertheless, considering that the heterogeneity of legal systems and financial markets among nations can lead to diverse micro-level implications of government debt, we propose the following two contrasting hypotheses:
 Hypothesis 1a (H1a).
LGD in China is dominated by the “crowding out effect”, which squeezes out the real investment of non-financial firms.
 Hypothesis 1b (H1b).
LGD in China is dominated by the “crowding-in effect”, which crowds in the real investment of non-financial firms.

3.2. The Impact of LGD on the Financial Investments of Non-Financial Firms

Currently, China is experiencing a deceleration in economic growth. In response, a large number of these enterprises have increasingly engaged in financial investments and have even invested funds that were originally used for production and business operations in financial activities, exhibiting an increasingly obvious tendency of financialization [40]. While the phenomenon of “hollowing out” of China’s real economy resulting from this “exit from the real to the virtual” has garnered scholarly attention, few scholars have examined the implications for the financialization of real enterprises arising from government debt expansion. Generally speaking, non-financial enterprises predominantly invest in financial assets for two reasons: precautionary savings and investment substitution.
The expansion of government debt has significantly exacerbated the financing environment of firms, leading to elevated financing costs [21] and heightened exposure to liquidity constraints [41]. From the perspective of precautionary savings, non-financial firms are increasingly inclined to take advantage of the inherent financial flexibility of financial assets as a mechanism for safeguarding future liquidity. Specifically, the liquidity of financial assets proves to be a pivotal advantage over their real counterparts. The earnings garnered from financial assets not only serve as a potential source of funds for industrial operations but also assume a critical role during periods of constrained access to external capital or credit markets. In such circumstances, the realization of financial assets can offer a timely and efficient solution to supplement the necessary funds required for production and operations. This strategic utilization effectively alleviates the financing constraints encountered by firms, thereby attenuating the adverse repercussions of disruptions in capital flow on their production and innovation endeavors [42,43].
In light of the ongoing economic decline and the decrease in profits for non-financial companies, some non-financial firms choose to invest in financial investments with higher returns that are accompanied by heightened risks rather than pursuing real investment. From the perspective of investment substitution, the reason for choosing this strategy is because the financial assets have the characteristics of high yields [44,45] and swift returns [46] on investment. These qualities can mitigate the volatility in firms’ investments, diminish operational risks faced by firms, and curtail the likelihood of descending into financial distress [47,48]. Moreover, the substantial debt demands imposed by local governments not only elevate the financing costs for enterprises, thereby exerting further pressure on the profit margins of real investments, but also enhance the financial yields of local commercial banks, prompting non-financial firms to tend to invest in financial assets with higher returns. Consequently, the expansion of government debt instead induces non-financial firms to divert the resources initially allocated for productive business operations towards financial assets, thereby intensifying the financialization trend with non-financial firms.
In summary, considering the impact of LGD on the investment decisions of non-financial firms encompassing both real and financial investments, we propose two competing hypotheses as follows:
 Hypothesis 2a (H2a).
The expansion of LGD intensifies the inclination of non-financial firms towards financialization, leading to a bias in their investment structure favoring financial investment.
 Hypothesis 2b (H2b).
The expansion of LGD curtails the propensity of non-financial firms towards financialization, leading to a bias in their investment structure favoring real investment.

4. Empirical Tests

4.1. Sample Selection and Data Sources

We utilized the data of China A-share listed companies from 2010 to 2018 as the initial research dataset for our study. Specifically, the firms’ investment data and corresponding financial information data were obtained from the CSMAR database, while regional economic development data were sourced from the China Regional Statistical Yearbook. Furthermore, we gathered the debt information of the corresponding financing platform from the Wind financial database and then aggregated the debt information at the prefecture-city level and used it as the proxy variable for LGD financing. It should be noted that the sample was subjected to the following treatments: (1) exclusion of financial firms, (2) exclusion of ST and PT firms, (3) exclusion of firms with substantial data deficiencies, and (4) application of winsorize at the 1% level to continuous variables to mitigate the influence of outliers. Finally, we obtained a total of 15,312 observations across 9 years. Specifically, the number of observations exhibited a gradual increase over time, with over half of the samples originating from the manufacturing industry. The specific distribution of the samples is thoughtfully presented in Table A1 of Appendix A.

4.2. Measurement of Variables

4.2.1. Dependent Variables

As previously mentioned, we categorized the investment activities of non-financial firms into two components: real investment (RI) and financial investment (FI). Real investment predominantly encompasses the firm’s inventory, fixed assets, and construction in progress, while financial investment primarily includes trading financial assets, derivative financial assets, available-for-sale financial assets, held-to-maturity investments, and net investment properties. It should be noted that to further examine the dynamic evolution of the investment structure bias of non-financial firms, we employed the first-order difference between the ratio of real investment and financial asset investment as a metric for measuring the investment structure bias (Structure). A higher value of this metric indicates a swifter adjustment rate of corporate investment structure bias towards real investment, whereas a lower value suggests a faster adjustment rate towards financial investment.

4.2.2. Independent Variables

Following the approach of Huang et al. (2020) [22], we used “local financing platform debt to GDP ratio” as the proxy variable for LGD, serving as the main explanatory factor of this paper, which is the ratio of interest-bearing debt balance of the financing platform to GDP, denoted as LGD. The interest-bearing debt of financing platforms mainly includes bank loans, municipal bonds, and long-term debt with maturity within one year.

4.2.3. Control Variables

We selected control variables based on the available literature [11,49,50], including firm size (Size), firm leverage ratio (Lev), firm age (lnAge), profitability (Roa), fixed assets ratio (Tang), sales growth rate (Growth), Tobin’s Q (Tobinq), and equity concentration (Top1). Moreover, the control variables at the regional level included the urban GDP growth rate (GDPgrowth), the proportion of secondary industry output value to GDP (I2), the proportion of the output value of the tertiary industry to GDP (I3), GDP per capita (GDPPC), and the ratio of the loan balance of financial institutions to GDP. A detailed definition of all the variables is provided in Table 1.

4.3. Model Design

4.3.1. Baseline Regression Model

To test the impact of LGD financing on the structure of corporate investment, we constructed the following three-panel models concerning Zhou et al. (2023) [13]:
S t r u c t u r e i t = β 0 + β 1 L G D c t + γ X i c t + μ i + θ t + ε i c t
R I i t = β 0 + β 1 L G D c t + γ X i c t + μ i + θ t + ε i c t
F I i t = β 0 + β 1 L G D c t + γ X i c t + μ i + θ t + ε i c t
where subscripts i and t represent the firm and year, respectively, and subscript c represents the city. Among the dependent variables, the variable “Structure” indicates the bias of the firm’s investment structure, while “RI” and “FI” indicate the real investment level and financial investment level of the firm, respectively. As for the core explanatory variable of the model, denoted by “LGD”, this represents the extent of local government debt financing. Additionally, the matrix “X” comprises a comprehensive array of firm-specific and regional macro-level characteristic variables previously mentioned. Furthermore, μ i and θ t represent the individual-level fixed effects and the time-level fixed effects at the firm level, respectively.

4.3.2. Descriptive Statistics

The descriptive statistics for the main variables are presented in Table 2. It is of significance to highlight that the investment structure bias (Structure) within the cohort of the listed firms exhibited a mean of −0.026, accompanied by a standard deviation of 0.753. The range of value spanned from a minimum of −3.585 to a maximum of 3.828, thereby indicating pronounced dissimilarities in the investment structure tendencies of diverse companies. In addition, the average local government debt was 0.177, with a minimum of 0 and a maximum of 0.845. In addition, the results of the correlation analysis related to the main variables are displayed in Table A2 of Appendix B.

5. Results

5.1. Influence of LGD on Corporate Investment Structure

Table 3 reports the empirical findings derived from the regression of LGD on the investment structure of the firms. More specifically, this paper employed models (1), (2), and (3) to perform regressions on the entire dataset. Within the context of these models, column (1) presents the outcomes of the univariate test of LGD on real investment, which shows that the coefficient estimation of the pivotal explanatory variable, LGD, was significantly negative at the 1% level. In the proceeding column (2), the results persisted in retaining a significant negative nature even after the integration of control variables, reaffirming the noteworthy observation that local debt crowds out the real investment of firms and testing hypothesis H1a. Column (3) shows the univariate test results of the impact of LGD on financial investment, with the coefficient of the key explanatory variable LGD being significantly positive at the 1% level. Similarly, column (4) incorporates the control variables, and the result remains significantly positive, which indicates that local government debt financing catalyzes heightened financial investment by firms. Further scrutiny in column (5) involves the univariate regression analysis of the bias of LGD on the firms’ investment structures. The coefficient of LGD demonstrates a statistically significant negative at the 1% level. Remarkably, the coefficient remained consistently negative even after accounting for control variables, as depicted in column (6). These collective outcomes firmly underscore the phenomenon wherein local government debt exacerbates the trend of “exit from real to virtual” of the local firms’ investment structure, thereby leading to the bias of the firms’ investment structure in favor of financial investment. Hypothesis H2a is tested.

5.2. Difference-in-Differences Model

In this paper, the regions characterized by elevated levels of local government debt financing constitute the experimental group, while the regions with comparatively lower debt financing levels serve as the control group. The exogenous shock induced by the release of the “No. 43 Document” stands as a pivotal event shaping local government debt financing, and the double-difference method is adopted to test whether this policy can alleviate the bias of the enterprise investment structure toward financial investment by suppressing LGD financing. The specific model is set as follows (Equation (4)):
S t r u c t u r e i t = β 0 + β 1 T r e a t i × P o s t t + γ X i c t + μ i + θ t + ε i c t
Given the direct influence of the “No. 43 Document” on the LGD, this paper adopts a grouping strategy predicated on the mean value of the core explanatory variable, local government debt (LGD), during the pre-Document 43 era (2010–2013). Specifically, the firms situated in regions with lower local government financing before the enactment of Document 43 comprise the control group (Treat = 0), whereas the remaining firms fall into the treatment group (Treat = 1). In addition, to assess policy-induced shocks, the dummy variable “Post” was employed to distinguish between periods on or after the year 2014 (assigned a value of 1) and periods before that (assigned a value of 0). The interaction term denoted as “Treat × Post” encapsulates the specific policy impact under scrutiny, elucidating the influence of the “No. 43 Document” on the firms’ investment structure bias. All the other variables and parameters adhere to the specifications outlined in the model (1).
Table 4 unveils the regression results derived from the double-difference model (Equation (4)). Notably, the coefficient of the interaction term “Treat × Post” is positive and achieves statistical significance at the 1% level. This result underscores a critical observation, that the promulgation of the No. 43 Document engenders a reduction in the scale of LGD financing. Simultaneously, it inhibits the trajectory of the firms’ investment inclination, particularly the propensity for “exit from real to virtual”. In other words, it makes the investment structure of the enterprises biased toward real investment. The empirical results, based on the quasi-natural experimental shocks, once again verify the research hypothesis of this paper; that is, that local government debt causes firms to shift from financial investments to real ones (“exit from real to virtual”). Consequently, this analysis underscores that with the effective constraint of LGD financing. The investment structure of the firms experiences a recalibration, reorienting the bias towards real investments.

5.3. Robustness Test

5.3.1. Parallel Trend Test

It is well known that the difference-in-differences (DID) methodology is often used to gauge policy effectiveness because it can be a good solution to mitigate endogeneity concerns. Nevertheless, the reliability of the results hinges upon the fulfillment of the parallel trend assumption. Therefore, to ensure the validity of our findings, we estimated model (4), assessing the parallelism of trends exhibited by the treatment group and the control group in the period preceding the policy shock. Following our methodology, we designated the year before the policy as the reference baseline for our assessment.
Figure 1 demonstrates the estimation results of the regression coefficient estimates along with their corresponding confidence intervals regarding model (4). Notably, the coefficients before the implementation of the No. 43 Document do not intersect significantly with 0, indicating that the difference between the treatment group and the control group before the implementation of the policy is insignificant and satisfies the parallel trend assumption. Furthermore, we find that the expansion of local government debt was effectively governed after the policy was introduced in 2014. Notably, the investment structure of the firms situated in the regions characterized by higher government debt levels gradually favored real investment within their investment structure. These results are in line with our expectations.

5.3.2. Modifying the Model Setting

To engage in a more comprehensive exploration of the relationship between LGD and the investment structure of firms, we refined our model specifications. Specifically, within models (1) and (4), we replaced the firm- and year-level fixed effects with a more encompassing framework, encompassing firm-level, year-level, city, and industry-level fixed effects.
The tabulated results in Table 5 provide a detailed exposition of the regression analyses. Within columns (1) to (2), the findings substantiate that local government debt financing indeed triggers a discernible shift characterized by an “exit from real to virtual” within the firms’ investment patterns. The outcomes in columns (3) to (4) show that upon the successful containment of government debt escalation, the firms’ investment structures recalibrate, favoring real investments. This observed trend underscores the consistency and validation of our research outcomes.

5.3.3. Replacing the Dependent Variable

To make sure that our results were strong and dependable, we replaced the dependent variables in this paper. In this context, we adopted the first-order difference of the ratio between real investment (RI2) and financial investment (FI2) to quantify the bias of a firm’s investment structure, which is denoted as Structure 2. It is important to underscore that the real investment (RI2) adds engineering material items to the original one. Specifically, this revised real investment variable (RI2) encompasses inventories, fixed assets, construction in progress, and engineering materials. As for the financial investment (FI2), this adds the net receivable interest and the net receivable dividend to the original basis. In other words, the new financial investment variable includes trading financial assets, derivative financial assets, available-for-sale financial assets, held-to-maturity investments, investment properties, net interest receivable, and net dividend receivable.
Table 6 reports the outcomes derived from the regression analyses after the substitution of the dependent variables. Notably, the estimated coefficients corresponding to Structure 2 consistently exhibited a statistically significant negative orientation, regardless of whether the other variables and fixed effects were introduced as control measures. This suggests that the influence of LGD is indeed conducive to shaping the firms’ investment structures in favor of financial investment.

5.3.4. Excluding Four Municipalities Directly under the Central Government

Table 7 presents the influence of local government debt on the investment structure of the firms, excluding the sample of four centrally administered municipalities. These four cities, namely Beijing, Tianjin, Shanghai, and Chongqing, hold a distinct political status in China, potentially giving rise to variations in the behavioral dynamics of diverse government tiers. These disparities may, in turn, have implications for the operational behaviors of the firms within the respective regions. Hence, we opted to exclude the firms located in these four cities from our analysis. Column (1) depicts the outcomes of a univariate regression that investigates the relationship between local government debt (LGD) and investment structure. In Column (2), the regression is expanded to include control variables. Subsequently, Columns (3) and (4) expound upon the regressions after a successive introduction of the city and industry fixed effects. Notably, the observed coefficients of the primary explanatory variables (LGD) consistently exhibited negative values, irrespective of the incorporation of control variables. This steadfast alignment with the outcomes of the benchmark regression substantiates the robustness and validity of the findings presented in this study.

5.3.5. Placebo Test

In pursuit of enhancing our confidence in the identification of causality, we resorted to a placebo test involving the random generation of treatment groups [51,52]. This strategy served to assess whether the policy effect was attributable to factors unrelated to the No. 43 Document. To perform this test, we replicated the process of generating randomized treatment groups a total of 200 times. Subsequently, we plotted the distribution of the estimated coefficient of Treat × Post to verify whether LGD financing in China is significantly affected by factors unrelated to the No. 43 Document policy, thus validating the robustness of our DID modeling approach. If the estimated coefficients of Treat × Post consistently cluster around 0 under the randomized treatment context, it indicates that our DID modeling effectively captures the salient influencing factors.
Figure 2 depicts the distribution of the estimated coefficients associated with Treat × Post. Notably, the estimated coefficients on the interaction terms (Treat × Post) generated by the randomly selected treatment groups are all clustered around 0 within the depicted figure. This salient observation stands as a compelling indicator that the research modeling setup of this paper remains resilient against potential omitted variable concerns; i.e., the main conclusions are robust.
In addition, we employed an alternative placebo test to bolster the credibility of the causal relationship attributed to local government debt governance policies. The objective of this test was to affirm that the observed biased behavior in the firms’ investment structures could be attributed to the implementation of local debt governance policies while effectively excluding the confounding influence of random factors. Specifically, we introduced a pseudo-policy time, advancing the policy intervention by increments of 1 year and 2 years. Subsequently, we proceeded to run regression analyses using model (4) within this pseudo-policy context, and the findings from these alternative regressions are summarized in Table 8. The outcomes indicate that the coefficient estimates lack significance in the case of inaccurate policy settings.

6. Further Analyses

6.1. Mechanism Analysis

Real investment cost and financial investment income serve as the primary determinants of corporate asset portfolio allocation, influencing the bias in the corporate investment structure. Therefore, this study employed real investment cost and financial investment income as moderating variables to investigate the impact of LGD on corporate investment structures. We utilized income statement data from the listed companies to construct two moderating variables, shedding light on how LGD affects corporate investment structure through real investment cost and financial investment income. The real investment cost of the enterprise entity (Cost) is calculated as follows: Cost = (operating cost + business tax and surcharges + sales expenses + administrative expenses + financial cost + asset impairment loss)/operating income. On the other hand, enterprise financial investment income (Income) is defined as: Income = (fair value change income + investment income)/operating income.
Table 9 displays the findings of the mechanism analysis. In this analysis, we cross-multiplied the real investment cost (Cost) and financial investment income (Income) with the local government debt (LGD). Firstly, the impact of LGD on corporate activities directly manifests as the crowding out of external credit funds, increasing enterprise entity investment costs and reducing their investment levels. Columns (1), (2), and (3), each with the different fixed effects controlled, demonstrate how the cost of real investment further leads enterprises to decrease their real investment levels. Secondly, the increase in financial investment income encourages enterprises to favor financial investments in their investment structure. Columns (4), (5), and (6), with the different fixed effects controlled, illustrate how financial investment income promotes higher levels of financial investment within enterprises.

6.2. Cross-Sectional Analysis

6.2.1. Firm Ownership

Considering the pivotal role played by the ownership structure in shaping the investment and financing within China’s distinct institutional context, we partitioned the sample into state-owned and non-state-owned firms, as well as further sub-categorizing them into local state-owned firms and local non-state-owned firms, carry out regression analyses on the respective sub-samples based on model (1).
Table 10 presents the regression findings obtained from the ownership-based analysis. The results show that the influence of local government on the firms’ investment structures exhibits significance solely within the domain of non-state-owned firms, and this influence does not bear significant implications for state-owned firms. The reason for this result is associated with the distinctive characteristics of state-owned firms. Given their inherent “blood” relationship with the government, state-owned firms often benefit from an obvious “fatherly love effect”, which makes state-owned firms often enjoy relatively favorable access to loans and other forms of financial support at a reduced cost [53]. In contrast, non-state-owned firms frequently encounter challenges when seeking equivalent credit assistance under similar circumstances [1]. Consequently, the impact of LGD financing on the investment structures of non-state-owned firms is more pronounced.

6.2.2. Financing Constraint Heterogeneity

Building upon the insights garnered from the previous theoretical analysis, it becomes obvious that firms grappling with financing constraints tend to exhibit a heightened sense of preventive motivation [42,54]. Therefore, we refer to the financing constraint indicator SA index constructed by Hadlock and Pierce (2010) [55], which divides firms into two distinct groups: the high-constrained-to-finance and the low-constrained-to-finance group. We also conduct a heterogeneity analysis.
Table 11 demonstrates the outcomes derived from the heterogeneity analysis based on financing constraints. Specifically, column (1) reveals the regression outcomes for the group of firms characterized by low financing constraints, and the estimate associated with LGD remains statistically insignificant. Conversely, the analysis conducted on firms marked by high financing constraints, as depicted in column (2), unveils a significantly negative coefficient estimate associated with LGD at the 1% level. These outcomes suggest that the local debt policy exerts a more pronounced impact on firms grappling with substantial financing constraints. This influence becomes manifest in the discernible shift within the investment structures of high financing constraint firms, characterized by a pronounced trend of transitioning from real to financial investment.

6.2.3. Firm Size Heterogeneity

Generally speaking, firms of varying sizes often possess distinct resource endowments. Under China’s unique market economic system, this divergence in resource circumstances between large and small firms may be accentuated, given the predilection of financial institutions towards larger entities. Consequently, within China’s credit market, banks tend to exhibit a preference for extending loans to larger firms, potentially mitigating their financing constraints [56]. This implies that most of the credit resources of financial institutions go to large and well-capitalized enterprises rather than to SMEs. Consequently, the influence of government debt expansion on the investment structure of firms is likely to exhibit variations contingent upon firm size. Referring to Bronzini and Iachini (2014) [57], this paper adopts the average total assets of firms as the reference metric to create a categorical variable reflecting firm size. Subsequently, the sample of firms is categorized into large-scale firms and small-scale firms, allowing for an examination of the size-related heterogeneity among firms.
Table 12 presents the regression outcomes of firm size heterogeneity. Notably, the significance levels of the regression coefficients linked to LGD exhibit variations contingent upon firm size. Specifically, as observed in column (1), the regression findings for large-scale firms indicate that the estimates associated with LGD lack statistical significance. In contrast, column (2) reveals the results of regressions conducted for small-scale firms, where the coefficient estimate linked to LGD exhibits a significant negative association at the 10 percent significance level. These findings imply that local government debt exerts a more pronounced impact on the investment structure of small-scale firms.

7. Conclusions

In recent years, the rapid expansion of LGD in China has been a notable trend. However, the associated risks and potential economic ramifications stemming from this phenomenon have yet to receive comprehensive recognition [58,59]. The surge in local government debt has further exacerbated an existing imbalance between China’s financial sector and the trajectory of real economic development. Particularly, the observed shift towards an “exit from real to virtual” within the real economy’s developmental trajectory has become a significant concern. This phenomenon is discernible at both the macro and micro levels. On a macroscopic scale, there is a noticeable decline in the efficacy of financial services in catering to tangible economic activities. This is coupled with a concerning occurrence of funds becoming dormant within the financial system [60]. At the micro level, enterprises are increasingly diverting their funds away from real investments, instead channeling substantial amounts into financial products. This transition of investment of firms from tangible to intangible activities severely hampers the advancement of the real economy. This development has elicited considerable attention from both governmental bodies and the academic community. In the current economic climate, particularly within the context of the post-pandemic era and the ongoing economic downturn, comprehending the underlying drivers behind this financialization of enterprises assumes heightened significance.
Consequently, it becomes imperative to explore strategies for controlling the burgeoning scale of LGD, guiding the rechanneling of funds into tangible economic sectors and thereby fostering the steady and sustainable growth of the real economy. Addressing these issues becomes a pivotal step in navigating the economic challenges ahead and establishing a more balanced and resilient economic trajectory. In view of this, we propose some recommendations for the effective management of local government debt in China.
Firstly, it is advisable to optimize the debt financing structure of local governments and rigorously enforce debt management practices. Drawing from the regression results in this paper, it is evident that local debt governance can improve the corporate investment structure. Therefore, local governments should comprehensively consider the influence of debt financing on corporate investment structures and actively promote the optimization of debt financing structures. This can be achieved through the adoption of innovative financing instruments, such as infrastructure funds and equity financing, thereby mitigating the adverse effects suffered by firms as a result of the conventional debt financing approach employed by local governments. Simultaneously, it is imperative for local governments to bolster their debt management protocols to guarantee the rational allocation and repayment of debt. Furthermore, establishing a robust risk-monitoring mechanism is essential for identifying potential debt risks, thereby preventing the debt from becoming an onerous burden on firms. This approach ultimately safeguards the stability of corporate investment structures.
Secondly, it is imperative to foster the growth of non-state-owned firms. The regression results indicate variations in the influence of local government debt on firms based on their ownership properties, necessitating the implementation of tailored support policies. Compared with state-owned firms, non-state-owned firms often encounter competitive disadvantages in the marketplace. Therefore, for non-state-owned firms, the government may contemplate initiatives such as tax incentives, reducing financing entry barriers, and extending loan guarantees to help these firms overcome the distress caused by local government debt financing. Such actions would contribute to optimizing corporate investment structures and fostering the sustainable development of non-state-owned firms, thereby promoting shared prosperity.
Lastly, it is imperative to advocate for the development of financial markets and the introduction of innovative financing mechanisms. The government should proactively undertake initiatives to promote the development and innovation of financial markets, while also ensuring firms have access to a diverse array of financing avenues. In particular, the government can incentivize financial institutions to introduce novel financing instruments, such as supply chain finance and microfinance, to meet the financing requirements of diverse firms. This approach will effectively enhance the financing capabilities of firms, fortify their production and market competitiveness, and mitigate the potential adverse effects of local government debt.
There are some limitations to this study. First and foremost, it is worth noting that an appropriate level of government debt can promote economic development, while excessive government debt will accumulate a large amount of debt risk, leading to a shift in corporate investment structures towards financial investment. Hence, the pursuit of an optimal debt balance point is a noteworthy avenue for future exploration. Secondly, we used the data of the listed companies to investigate the influence of local government debt on the firms’ investment structures. Extending the applicability of these findings to non-listed companies represents an area for further in-depth examination. Thirdly, it is important to acknowledge that this study primarily approached the subject from the perspective of non-financial firms and did not consider the impact of local government debt on financial institutions. As such, future research could be directed toward investigating the impact of local government debt on financial institutions.

Author Contributions

Conceptualization, Y.W. and G.W.; methodology, Y.W. and C.T.; software, Y.W.; validation, Y.W., C.T. and G.W.; formal analysis, Y.W. and G.W.; investigation, Y.W. and G.W.; resources, Y.W.; data curation, Y.W.; writing—original draft preparation, Y.W. and G.W.; writing—review and editing, Y.W. and G.W.; visualization, Y.W.; supervision, Y.W. and G.W.; project administration, Y.W. and C.T.; funding acquisition, Y.W. All authors have read and agreed to the published version of the manuscript.

Funding

This research was funded by the Guangdong Provincial Philosophy and Social Science Planning Project (Grant number GD22XYJ01).

Institutional Review Board Statement

Not applicable.

Informed Consent Statement

Not applicable.

Data Availability Statement

All data included in the paper are openly achieved.

Conflicts of Interest

The authors declare no conflict of interest.

Appendix A

Table A1. Sample distribution.
Panel A: Sample Distribution by Year
Year# of Observations% of Observations
201013238.64%
201115279.97%
2012165910.83%
2013170811.15%
2014168010.97%
2015170911.16%
2016182611.93%
2017193312.62%
2018194712.72%
Total15,312100%
Panel B: Sample Distribution by Industry
Industry Name# of Observations% of Observations
Agriculture, forestry, and fishing2231.46%
Mining4512.95%
Manufacturing10,02865.49%
Electricity6244.08%
Construction4793.13%
Transportation11497.5%
Information technology6073.96%
Wholesale and retail750.49%
Resident services2151.4%
Culture, sport, and entertainment1921.25%
General industry12698.29%
Total 15,312100%
Note: Panel A lists the yearly distribution of the sample, and panel B lists the industry distribution of the sample.

Appendix B

Table A2. Correlation analysis.
StructureLGDSizeRoalnAgeLevTangTobinTop1GrowthGDPgrowthI2I3GDPPCLoan
Structure10.02 *0.07 *−0.03 *0.10 *0.08 *−0.03 *0.04 *−0.04 *−0.03 *−0.05 *−0.05 *0.03 *0.010.02 *
LGD0.0110.08 *−0.02 *0.05 *0.05 *−0.05 *−0.03 *0.05 *−0.03 *−0.05 *−0.17 *0.12 *0.12 *0.40 *
Size0.03 *0.06 *100.10 *0.41 *0.07 *−0.58 *0.21 *0.07 *−0.18 *−0.16 *0.13 *0.10 *0.14 *
Roa−0.01 *−0.05 *0.05 *1−0.10 *−0.43 *−0.21 *0.19 *0.13 *0.30 *0.03 *00.05 *0.03 *−0.03 *
lnAge0.11 *0.08 *0.07 *−0.10 *10.11 *−0.03 *−0.01−0.17 *−0.11 *−0.27 *−0.22 *0.17 *0.10 *0.13 *
Lev0.05 *0.06 *0.38 *−0.39 *0.13 *10.25 *−0.32 *0.02 *00.05 *0.05 *−0.09 *−0.03 *0.04 *
Tang−0.04 *−0.02 *0.10 *−0.16 *00.25 *1−0.15 *0.07 *−0.07 *0.12 *0.18 *−0.22 *−0.21 *−0.16 *
Tobin0.06 *0.01−0.48 *0.04 *0.06 *−0.19 *−0.14 *1−0.17 *0.01 *0.06 *−0.01 *0.01−0.03 *−0.04 *
Top1−0.04 *0.04 *0.25 *0.14 *−0.17 *0.01 *0.07 *−0.15 *10.010.01−0.03 *0.05 *0.05 *0.08 *
Growth−0.01−0.01 *0.04 *0.19 *−0.02 *0.02 *−0.07 *−0.01 *0.0110.08 *0.03 *−0.01−0.01−0.06 *
GDPgrowth−0.03 *0.02 *−0.18 *0.05 *−0.24 *0.06 *0.12 *0.03 *0.010.05 *10.61 *−0.63 *−0.41 *−0.36 *
I2−0.02 *−0.05 *−0.19 *0.01−0.11 *0.02 *0.17 *−0.02 *−0.08 *0.010.46 *1−0.88 *−0.41 *−0.54 *
I30.01−0.010.18 *0.03 *0.08 *−0.05 *−0.19 *0.010.10 *−0.01−0.51 *−0.94 *10.57 *0.51 *
GDPPC00.07 *0.11 *0.010.09 *−0.03 *−0.20 *−0.03 *0.05 *−0.01−0.41 *−0.32 *0.46 *10.41 *
Loan0.010.38 *0.14 *−0.04 *0.13 *0.04 *−0.14 *00.07 *−0.03 *−0.32 *−0.52 *0.47 *0.38 *1
Notes: Within the correlation matrix, the upper triangle is the Spearman correlation coefficient, and the lower triangle is the Pearson correlation coefficient. * p < 0.05.

References

  1. Liang, Y.; Shi, K.; Wang, L.; Xu, J. Local Government Debt and Firm Leverage: Evidence from China. Asian Econ. Policy Rev. 2017, 12, 210–232. [Google Scholar] [CrossRef]
  2. Lu, Y.; Sun, T. Local Government Financing Platforms in China: A Fortune or Misfortune? Social Science Electronic Publishing: New York, NY, USA, 2014; Volume 13. [Google Scholar]
  3. Eggertsson, G.B.; Krugman, P. Debt, Deleveraging, and the Liquidity Trap: A Fisher-Minsky-Koo Approach. Q. J. Econ. 2012, 127, 1469–1513. [Google Scholar] [CrossRef]
  4. Pan, F.; Zhang, F.; Zhu, S.; Wójcik, D. Developing by borrowing? Inter-jurisdictional competition, land finance and local debt accumulation in China. Urban Stud. 2017, 54, 897–916. [Google Scholar] [CrossRef]
  5. Grobéty, M. Government debt and growth: The role of liquidity. J. Int. Money Financ. 2018, 83, 1–22. [Google Scholar] [CrossRef]
  6. Mao, W.; Cai, S.; Lu, J.; Yang, H. What Triggered China’s Urban Debt Risk? Snowball Effect under the Growth Target Constraint. Struct. Change Econ. Dyn. 2023, 67, 1–13. [Google Scholar] [CrossRef]
  7. Cai, X.; Song, X. Analyzing the Mechanism Between Local Government Debts and China’s Economic Development: Spatial Spillover Effects and Environmental Consequences. Front. Environ. Sci. 2022, 10, 928975. [Google Scholar] [CrossRef]
  8. Yang, W.; Zhang, Z.; Wang, Y.; Deng, P.; Guo, L. Impact of China’s Provincial Government Debt on Economic Growth and Sustainable Development. Sustainability 2022, 14, 1474. [Google Scholar] [CrossRef]
  9. Tang, Z. Local Government Debt, Financial Circle, and Sustainable Economic Development. Sustainability 2022, 14, 11967. [Google Scholar] [CrossRef]
  10. Xu, S.; Guo, L. Financialization and corporate performance in China: Promotion or inhibition? Abacus 2023, 59, 776–817. [Google Scholar] [CrossRef]
  11. Fan, J.Y.; Liu, Y.; Zhang, Q.; Zhao, P. Does government debt impede firm innovation? Evidence from the rise of LGFVs in China. J. Bank. Financ. 2022, 138, 106475. [Google Scholar] [CrossRef]
  12. Chen, W.; Zhu, Y.F.; He, Z.H.; Yang, Y. The effect of local government debt on green innovation: Evidence from Chinese listed companies. Pac.-Basin Financ. J. 2022, 73, 101760. [Google Scholar] [CrossRef]
  13. Zhou, M.; Jiang, K.; Chen, Z. The side effects of local government debt: Evidence from urban investment bonds and corporate pollution in China. J. Environ. Manag. 2023, 344, 118739. [Google Scholar] [CrossRef]
  14. Xie, H.; Zhang, W.; Liang, H. Can Local Government Debt Decrease the Pollution Emission of Enterprises?—Evidence from China’s Industrial Enterprises. Sustainability 2023, 15, 9108. [Google Scholar] [CrossRef]
  15. Gulen, H.; Ion, M. Policy uncertainty and corporate investment. Rev. Financ. Stud. 2016, 29, 523–564. [Google Scholar] [CrossRef]
  16. Istiak, K.; Serletis, A. Economic policy uncertainty and real output: Evidence from the G7 countries. Appl. Econ. 2018, 50, 4222–4233. [Google Scholar] [CrossRef]
  17. Cao, M.; Duan, K.; Ibrahim, H. Local government debt and its impact on corporate underinvestment and ESG performance: Empirical evidence from China. Sustainability 2023, 15, 11116. [Google Scholar] [CrossRef]
  18. Leng, T.; Liu, Y.; Xiao, Y.; Hou, C. Does firm financialization affect optimal real investment decisions? Evidence from China. Pac.-Basin Financ. J. 2023, 79, 101970. [Google Scholar] [CrossRef]
  19. Deng, M.; Fang, X.; Lyu, Q.; Luo, W. How does corporate financialization affect operational risk? Evidence from Chinese listed companies. Ekon. Istraz. 2023, 1–21. [Google Scholar] [CrossRef]
  20. Graham, J.R.; Leary, M.T.; Roberts, M.R. A century of capital structure: The leveraging of corporate America. J. Financ. Econ. 2015, 118, 658–683. [Google Scholar] [CrossRef]
  21. Demirci, I.; Huang, J.; Sialm, C. Government debt and corporate leverage: International evidence. J. Financ. Econ. 2019, 133, 337–356. [Google Scholar] [CrossRef]
  22. Huang, Y.; Pagano, M.; Panizza, U. Local crowding-out in China. J. Financ. 2020, 75, 2855–2898. [Google Scholar] [CrossRef]
  23. Eden, M.; Kraay, A. “Crowding in” and the returns to government investment in low-income countries. Policy Res. Work. Pap. Ser. 2014. [Google Scholar] [CrossRef]
  24. Checherita-Westphal, C.; Hallett, A.H.; Rother, P. Fiscal sustainability using growth-maximizing debt targets. Appl. Econ. 2014, 46, 638–647. [Google Scholar] [CrossRef]
  25. Song, Z.; Xiong, W. Risks in China’s financial system. Annu. Rev. Financ. Econ. 2018, 10, 261–286. [Google Scholar] [CrossRef]
  26. Zhang, K. Government’s implicit guarantee and the credit spread of the quasi-municipal bonds. Financ. Res. Lett. 2023, 55, 103861. [Google Scholar] [CrossRef]
  27. Zheng, C.; Huang, S.; Qian, N. Analysis of the co-movement between local government debt risk and bank risk in China. Singap. Econ. Rev. 2021, 66, 807–835. [Google Scholar] [CrossRef]
  28. Tobin, J. Money and economic growth. Econometrica 1965, 33, 671–684. [Google Scholar] [CrossRef]
  29. Gu, Y.; Guo, J.; Liang, X.; Zhao, Y. Does the debt-growth link differ across private and public debt? Evidence from China. Econ. Model. 2022, 114, 105930. [Google Scholar] [CrossRef]
  30. Coenen, G.; Straub, R.; Trabandt, M. Gauging the effects of fiscal stimulus packages in the euro area. J. Econ. Dyn. Control 2013, 37, 367–386. [Google Scholar] [CrossRef]
  31. Traum, N.; Yang, S.C.S. When does government debt crowd out investment? J. Appl. Econom. 2015, 30, 24–45. [Google Scholar] [CrossRef]
  32. Chen, Z.; He, Z.; Liu, C. The financing of local government in China: Stimulus loan wanes and shadow banking waxes. J. Financ. Econ. 2020, 137, 42–71. [Google Scholar] [CrossRef]
  33. Chen, C.; Yao, S.; Hu, P.; Lin, Y. Optimal government investment and public debt in an economic growth model. China Econ. Rev. 2017, 45, 257–278. [Google Scholar] [CrossRef]
  34. Donaldson, D. Railroads of the Raj: Estimating the impact of transportation infrastructure. Am. Econ. Rev. 2018, 108, 899–934. [Google Scholar] [CrossRef]
  35. Qu, X.; Xu, Z.; Yu, J.; Zhu, J. Understanding local government debt in China: A regional competition perspective. Reg. Sci. Urban Econ. 2023, 98, 103859. [Google Scholar] [CrossRef]
  36. Liu, Q.; Pan, X.; Tian, G. To what extent did the economic stimulus package influence bank lending and corporate investment decisions? Evidence from China. J. Bank Financ. 2016, 86, 177–193. [Google Scholar] [CrossRef]
  37. Du, J.; Fang, H.; Jin, X. The “growth-first strategy” and the imbalance between consumption and investment in China. China Econ. Rev. 2014, 31, 441–458. [Google Scholar] [CrossRef]
  38. Zhang, X.; Jin, R. Has local government debt crowded out enterprise innovation? PLoS ONE 2022, 17, e0277461. [Google Scholar] [CrossRef]
  39. Homapour, E.; Su, L.; Caraffini, F.; Chiclana, F. Regression analysis of macroeconomic conditions and capital structures of publicly listed British firms. Mathematics 2022, 10, 1119. [Google Scholar] [CrossRef]
  40. Zhang, C.; Zheng, N. Monetary policy and financial investments of nonfinancial firms: New evidence from China. China Econ. Rev. 2020, 60, 101420. [Google Scholar] [CrossRef]
  41. Guariglia, A.; Liu, X.; Song, L. Internal finance and growth: Microeconometric evidence on Chinese firms. J. Dev. Econ. 2011, 96, 79–94. [Google Scholar] [CrossRef]
  42. Opler, T.; Pinkowitz, L.; Stulz, R.; Williamson, R. The determinants and implications of corporate cash holdings. J. Financ. Econ. 1999, 52, 3–46. [Google Scholar] [CrossRef]
  43. Brown, J.R.; Petersen, B.C. Cash holdings and R&D smoothing. J. Corp. Financ. 2011, 17, 694–709. [Google Scholar]
  44. Demir, F.R. Financial liberalization, private investment and portfolio choice: Financialization of real sectors in emerging markets. J. Dev. Econ. 2009, 88, 314–324. [Google Scholar]
  45. Orhangazi, O. Financialisation and capital accumulation in the non-financial corporate sector. Camb. J. Econ. 2008, 32, 863–886. [Google Scholar]
  46. Smith, C.W.; Stulz, R.M. The Determinants of Firms’ Hedging Policies. J. Financ. Quant. Anal. 1985, 20, 391–405. [Google Scholar]
  47. Klinge, T.J.; Fernandez, R.; Aalbers, M.B. Whither corporate financialization? A literature review. Geogr. Compass 2021, 15, e12588. [Google Scholar]
  48. Duchin, R.; Gilbert, T.; Harford, J.; Hrdlicka, C. Precautionary Savings with Risky Assets: When Cash Is Not Cash. J. Financ. 2017, 72, 793–852. [Google Scholar]
  49. Zhu, J.; Xu, H.; Zhang, Y. Local government debt and firm productivity: Evidence from China. Res. Int. Bus. Financ. 2022, 63, 101798. [Google Scholar]
  50. Liu, Q.; Bai, Y.; Song, H. The crowding out effect of government debt on corporate financing: Firm-level evidence from China. Struct. Change Econ. Dyn. 2023, 65, 264–272. [Google Scholar]
  51. Ferrara, E.L.; Chong, A.; Duryea, S. Soap operas and fertility: Evidence from Brazil. Am. Econ. J.-Appl. Econ. 2012, 4, 1–31. [Google Scholar] [CrossRef]
  52. Li, P.; Lu, Y.; Wang, J. Does flattening government improve economic performance? Evidence from China. J. Dev. Econ. 2016, 123, 18–37. [Google Scholar]
  53. Cong, L.W.; Gao, H.; Ponticelli, J.; Yang, X. Credit allocation under economic stimulus: Evidence from China. Rev. Financ. Stud. 2019, 32, 3412–3460. [Google Scholar] [CrossRef]
  54. Almeida, H.; Campello, M.; Weisbach, M.S. The cash flow sensitivity of cash. J. Financ. 2004, 59, 1777–1804. [Google Scholar] [CrossRef]
  55. Hadlock, C.J.; Pierce, J.R. New evidence on measuring financial constraints: Moving beyond the KZ index. Rev. Financ. Stud. 2010, 23, 1909–1940. [Google Scholar] [CrossRef]
  56. Chaney, T.; Sraer, D.; Thesmar, D. The collateral channel: How real estate shocks affect corporate investment. Am. Econ. Rev. 2012, 102, 2381–2409. [Google Scholar] [CrossRef]
  57. Bronzini, R.; Iachini, E. Are incentives for R&D effective? Evidence from a regression discontinuity approach. Am. Econ. J.-Econ. Polic. 2014, 6, 100–134. [Google Scholar]
  58. Guo, Y.; Li, Y.; Qian, Y. Local government debt risk assessment: A deep learning-based perspective. Inform. Process. Manag. 2022, 59, 102948. [Google Scholar] [CrossRef]
  59. Cheng, Y.; Jia, S.; Meng, H. Fiscal policy choices of local governments in China: Land finance or local government debt? Int. Rev. Econ. Financ. 2022, 80, 294–308. [Google Scholar] [CrossRef]
  60. Nozawa, W.; Managi, S. Financial constraints of firms and bank characteristics. Econ. Anal. Policy 2019, 64, 302–316. [Google Scholar] [CrossRef]
Figure 1. Parallel trend test.
Sustainability 15 15756 g001
Figure 2. Random placebo test.
Sustainability 15 15756 g002
Table 1. Definition of variables.
Variable SymbolsExplanationDefinition
StructureCorporate investment structureThe first-order difference between the ratio of real investment and investment in financial assets
RIReal investment The sum of inventories, fixed assets, and construction in progress divided by the total assets
FIFinancial investmentThe sum of investments in financial assets divided by the total assets
LGDLocal government debtThe ratio of interest-bearing debt balance of financing platforms to GDP at the prefecture-city level
SizeFirm sizeThe natural logarithm of the total assets
RoaTotal return on assetsNet profit divided by total assets
lnAgeFirm ageExpressed as the natural logarithm of the difference between the year of observation and the year the firm went public
LevLeverage ratioThe aggregate of short-term liabilities and long-term liabilities divided by the total assets
TangPercentage of fixed assetsNet fixed assets divided by total assets
TobinqTobin’s Q valueUsing the ratio of the market value of the stock to the book value of the asset
Top1Equity concentrationThe sum of ownership proportions of the top shareholders
GrowthSale growthThe growth rate of the operating revenue
GDPgrowthGDP growth rate (%)City GDP growth rate
I2Share of secondary sector (%)Secondary sector output as a proportion of GDP
I3Share of tertiary sector (%)Tertiary sector output as a proportion of GDP
GDPPCGDP per capitaGDP per capita taken as a logarithm
LoanLoan balances of financial institutionsBalance of loans to financial institutions divided by GDP
Note: This table shows the variable definitions in this paper.
Table 2. Descriptive statistics.
VariablesNMeanStdMinMedianMax
Structure15,312−0.0260.753−3.585−0.0083.828
RI15,3120.4230.1910.0230.4160.846
FI15,3120.2090.1390.0210.1730.677
LGD15,3120.1770.1850.0000.1270.845
Size15,31222.2311.28419.56022.08526.135
Roa15,3120.0350.059−0.2420.0330.195
lnAge15,3122.8140.3561.6092.8903.434
Lev15,3120.4570.2090.0600.4520.959
Tang15,3120.3830.1760.0250.3740.806
Tobin15,3122.1101.4460.8881.6309.614
Top115,31235.39415.2898.44833.46075.734
Growth15,3120.1850.470−0.5590.1083.240
GDPgrowth15,3129.2102.6473.3008.42017.100
I215,31243.8499.02518.63045.96256.330
I315,31249.28611.80432.00046.67780.980
GDPPC15,31211.2630.5009.83811.35112.092
Loan15,3121.4770.6520.4131.4423.418
Data source: CSMAR database, Wind financial database, and China Regional Statistical Yearbook.
Table 3. Influence of local government debt on corporate investment structures.
Variables(1)(2)(3)(4)(5)(6)
RIRIFIFIStructureStructure
LGD−0.023 ***−0.018 **0.014 **0.016 **−0.385 ***−0.468 ***
(−2.80)(−1.98)(2.15)(2.51)(−3.01)(−3.48)
Size 0.009 *** −0.024 *** 0.030
(7.01) (−11.81) (1.56)
Roa −0.044 *** 0.060 *** 0.426 ***
(−4.26) (3.71) (2.76)
lnAge −0.017 ** −0.122 *** 0.730 ***
(−2.23) (−10.10) (6.40)
Lev 0.031 *** −0.123 *** 0.286 ***
(6.56) (−16.69) (4.08)
Tang 0.817 *** −0.376 *** −1.057 ***
(171.70) (−49.71) (−14.77)
Tobin −0.002 *** −0.001 * 0.025 ***
(−3.70) (−1.72) (3.23)
Top1 0.002 *** 0.007 *** −0.004 ***
(2.68) (6.20) (−3.56)
Growth −0.004 *** −0.003 ** −0.017
(−4.48) (−1.98) (−1.20)
GDPgrowth 0.002 0.003 0.006
(0.75) (0.56) (1.26)
I2 0.006 −0.023 * 0.019
(0.76) (−1.83) (1.59)
I3 0.001 −0.007 0.020 *
(0.02) (−0.58) (1.78)
GDPPC −0.010 0.010 0.126
(−1.36) (0.87) (1.18)
Loan 0.012 0.001 0.051
(0.56) (0.04) (1.61)
Constant0.427 ***0.0270.202 ***1.270 ***0.042 *−5.694 ***
(200.23)(0.25)(65.36)(7.53)(1.80)(−3.59)
Firm FEYesYesYesYesYesYes
Year FEYesYesYesYesYesYes
N15,31215,31215,31215,31215,31215,312
R 2 0.800.940.650.730.150.17
Notes: Robust standard errors are clustered at the firm level, and t-statistics are provided in parentheses. ***, **, and * indicate significance at the 1%, 5%, and 10% levels, respectively.
Table 4. Quasi-natural impact test based on Document 43.
Variables(1)(2)
StructureStructure
Treat × Post0.045 *0.061 **
(1.74)(2.30)
Constant−0.130 **−4.669 ***
(−2.37)(−2.97)
ControlsNoYes
Firm FEYesYes
Year FEYesYes
N15,31215,312
R 2 0.150.17
Notes: Robust standard errors are clustered at the firm level, and t-statistics are provided in parentheses. ***, **, and * indicate significance at the 1%, 5%, and 10% levels, respectively.
Table 5. Alternative measures of fixed effects.
Variables(1)(2)(3)(4)
StructureStructureStructureStructure
LGD−0.475 ***−0.466 ***
(−3.52)(−3.45)
Treat × Post 0.057 **0.053 **
(2.14)(2.01)
Constant−5.703 ***−5.985 ***−4.621 ***−4.929 ***
(−3.58)(−3.75)(−2.93)(−3.12)
ControlsYesYesYesYes
Firm FEYesYesYesYes
Year FEYesYesYesYes
City FEYesYesYesYes
Industry FENoYesNoYes
N15,31215,31215,31215,312
R 2 0.180.180.180.18
Notes: Robust standard errors are clustered at the firm level and t-statistics are provided in parentheses. ***, **, and * indicate significance at the 1%, 5%, and 10% levels, respectively.
Table 6. Alternative measures of the dependent variable.
Variables(1)(2)(3)(4)
Structure 2Structure 2Structure 2Structure 2
LGD−0.383 ***−0.465 ***−0.475 ***−0.466 ***
(−2.96)(−3.42)(−3.48)(−3.41)
Constant0.044 *−5.775 ***−5.788 ***−6.075 ***
(1.85)(−3.60)(−3.59)(−3.76)
ControlsNoYesYesYes
Firm FEYesYesYesYes
Year FEYesYesYesYes
City FENoNoYesYes
Industry FENoNoNoYes
N15,31215,31215,31215,312
R 2 0.150.180.180.18
Notes: Robust standard errors are clustered at the firm level, and t-statistics are provided in parentheses. ***, **, and * indicate significance at the 1%, 5%, and 10% levels, respectively.
Table 7. Excluding four municipalities directly under the central government.
Variables(1)(2)(3)(4)
Structure 2Structure 2Structure 2Structure 2
LGD−0.257 **−0.357 ***−0.365 ***−0.351 **
(−1.99)(−2.61)(−2.66)(−2.57)
Constant0.018−6.453 ***−6.357 ***−6.498 ***
(0.77)(−3.93)(−3.87)(−3.95)
ControlsNoYesYesYes
Firm FEYesYesYesYes
Year FEYesYesYesYes
City FENoNoYesYes
Industry FENoNoNoYes
N12,35712,35712,35712,357
R 2 0.150.170.170.18
Notes: Robust standard errors are clustered at the firm level, and t-statistics are provided in parentheses. ***, **, and * indicate significance at the 1%, 5%, and 10% levels, respectively.
Table 8. Fictitious policy times.
VariablesOne Year AheadTwo Years Ahead
(1)(2)(3)(4)
StructureStructureStructureStructure
Treat × Post0.0410.0340.0210.013
(1.41)(1.16)(0.66)(0.39)
Constant−4.770 ***−5.026 ***−4.850 ***−5.098 ***
(−3.13)(−3.21)(−3.09)(−3.23)
ControlsYesYesYesYes
Firm FEYesYesYesYes
Year FEYesYesYesYes
City FENoYesNoYes
Industry FENoYesNoYes
N15,31215,31215,31215,312
R 2 0.170.180.170.18
Notes: Robust standard errors are clustered at the firm level, and t-statistics are provided in parentheses. ***, **, and * indicate significance at the 1%, 5%, and 10% levels, respectively.
Table 9. Mechanism analysis.
Variables(1)(2)(3)(4)(5)(6)
StructureStructureStructureStructureStructureStructure
LGD × Cost−0.012 *−0.013 *−0.013 *
(−1.83)(−1.91)(−1.85)
LGD × Income −0.284 **−0.359 ***−0.346 ***
(−2.25)(−2.83)(−2.72)
Constant−1.313 ***−1.323 ***−1.359 ***−1.291 **−1.436 **−1.493 **
(−2.61)(−2.62)(−2.69)(−2.04)(−2.25)(−2.34)
ControlsYesYesYesYesYesYes
Firm FEYesYesYesYesYesYes
Year FEYesYesYesYesYesYes
City FENoYesYesNoYesYes
Industry FENoNoYesNoNoYes
N15,31215,31215,31215,31215,31215,312
R 2 0.190.200.200.210.220.22
Notes: Robust standard errors are clustered at the firm level, and t-statistics are provided in parentheses. ***, **, and * indicate significance at the 1%, 5%, and 10% levels, respectively.
Table 10. Corporate heterogeneity.
Variables(1)(2)(3)(4)
Non−SOEs StructureSOEs StructureNon−Local SOEs StructureLocal SOEs Structure
LGD−0.389 ***−0.165−0.330 ***−0.076
(−2.97)(−1.33)(−3.36)(−0.50)
Constant−7.180 **−3.238 **−6.461 ***−1.980
(−2.26)(−1.98)(−3.43)(−0.82)
ControlsYesYesYesYes
Firm FEYesYesYesYes
Year FEYesYesYesYes
N8288702412,8992413
R 2 0.200.160.170.24
Notes: Robust standard errors are clustered at the firm level, and t-statistics are provided in parentheses. ***, **, and * indicate significance at the 1%, 5%, and 10% levels, respectively.
Table 11. Financing constraint heterogeneity.
Variables(1)(2)
Low Financing Constraints StructureHigh Financing Constraints Structure
LGD−0.328−0.657 ***
(−1.59)(−3.01)
Constant−2.328−6.694 **
(−0.90)(−2.39)
ControlsYesYes
Firm FEYesYes
Year FEYesYes
N74367876
R 2 0.270.22
Notes: Robust standard errors are clustered at the firm level, and t-statistics are provided in parentheses. ***, **, and * indicate significance at the 1%, 5%, and 10% levels, respectively.
Table 12. Firm size heterogeneity.
Variables(1)(2)
Large-Scale StructureSmall-Scale Structure
LGD−0.259−0.373 *
(−1.53)(−1.65)
Constant−3.235−7.686 ***
(−1.54)(−2.80)
ControlsYesYes
Firm FEYesYes
Year FEYesYes
N68858427
R 2 0.280.22
Notes: Robust standard errors are clustered at the firm level, and t-statistics are provided in parentheses. ***, **, and * indicate significance at the 1%, 5%, and 10% levels, respectively.
Disclaimer/Publisher’s Note: The statements, opinions and data contained in all publications are solely those of the individual author(s) and contributor(s) and not of MDPI and/or the editor(s). MDPI and/or the editor(s) disclaim responsibility for any injury to people or property resulting from any ideas, methods, instructions or products referred to in the content.

