Article

Analysis of Country Economic Growth Based on Industries Chain Position

1
School of Systems Science, Beijing Normal University, Beijing 100875, China
2
School of Management and Economics, North China University of Water Resources and Electric Power, Zhengzhou 450046, China
*
Author to whom correspondence should be addressed.
Sustainability 2023, 15(21), 15528; https://doi.org/10.3390/su152115528
Submission received: 30 September 2023 / Revised: 24 October 2023 / Accepted: 30 October 2023 / Published: 1 November 2023
(This article belongs to the Special Issue Economic Sustainability of the Economy)

Abstract

:
In contrast to the past, the trade behavior of countries has become increasingly intricate, encompassing domestic trade rooted in local markets, traditional trade centered on final exports, and value chain trade reliant on intermediate goods. To tailor their strategies to their unique circumstances, nations judiciously allocate their economic focal points across these three trade modalities, engendering distinct national development models. By discerning the varying emphases placed by countries on these three trade modes, this paper employs clustering techniques to extract and analyze divergent national development models. Additionally, this paper assesses countries’ performance in various trade activities and introduces a new indicator, Total Trade Ability ( T T A ), to examine the impact of these models on the economy. With our approach, one can easily distinguish how different countries develop their economies. Our findings indicate a strong correlation between economic growth and T T A . In general, countries with higher T T A tend to exhibit higher economic growth.

1. Introduction

In recent decades, technological advances and trade barrier reductions have propelled the globalization of the economy and production [1]. The global value chains (GVCs) revolution has reshaped trade dynamics, resulting in shifts in trade growth-development links, trade-competitiveness links, and trade-governance options [2,3]. Kogut [4] defined the value chain as a combination of production elements, including products, services, and technology, culminating in the creation of intermediate goods. These intermediate goods are subsequently assembled into final products, which go through stages of market transactions and consumer consumption to achieve a value cycle and foster the sustainable development of enterprises. These early definitions highlighted the notion that strategic integration into the GVC could make developing countries “better”, enhancing various facets of their business operations. Regardless of its investment, consumption, or exports, these activities take on diverse forms. Exchanges between countries have become more frequent, encompassing cross-border investments and the diversification of domestic and imported consumer goods. Similarly, exports have diversified to include both final products and intermediate goods; this allows countries to select from a broader range of economic development models. Determining the most suitable model, in accordance with their own circumstances, remains an enduring challenge for all countries.
There exist various perspectives on the construction of GDP [5,6,7]. A country’s GDP (value added) can be dissected into distinct components: purely domestic, traditional trade where a product is manufactured in one country and consumed in another; simple value chain trade where a good produced in one country crosses a single border and is utilized in the production process in a partner country before consumption; and complex value chain trade where production spans multiple borders [8]. Within a production network, technical advancements can be amplified as they propagate through the production chains. A longer production chain tends to bias a country towards faster growth [9]. GVC accounting utilizes a single-country input–output model to analyze the domestic and foreign components (vertical specialization) incorporated into a country’s exports. Vertical specialization, as introduced by Hummels et al. [10,11], involves measuring the proportion of imported intermediate products in a country’s exports, leading to the revelation that vertical specialization trade constitutes approximately 25% of global trade. However, it is important to note that a single country’s input–output model may not fully capture the intricate industrial interdependencies within the value chain division system among economies. Koopman et al. [12] integrated aspects of vertical specialization and value-added trade in the literature to redefine the comparative advantages of countries in international trade [13]. Furthermore, numerous studies regarding the production length (“upstreamness” or “downstreamness”) and the country’s position in global trade have been proposed [14,15,16,17,18,19]. Johnson and Noguera [20] and Gong and Yin [21] used the ratio of domestic value added to total exports (VAX) to measure the degree of a country’s embeddedness in the GVC and established a general value-added trade accounting method. Wang et al. [22,23,24] developed a new set of country-sector level indicators of GVCs characteristics in terms of average production length and relative “upstreamness” in production. Leveraging such an accounting framework, we proceed to decompose the total production length into different segments. In previous papers, the focus was primarily on theoretical analysis or the construction of descriptive indicators related to traditional trade, often mixing all trade activities together. There has been relatively less discussion about economic growth based on the subdivision of economic activities, such as domestic trade, traditional trade, and intermediate trade.
In this paper, we decompose the GDP and economic activities into distinct segments, allowing us to ascertain the contribution of each component (domestic consumption, traditional trade, intermediate trade) to the overall GDP. Based on the above-mentioned information, this paper categorizes the development models of various countries and elaborates on their distinct characteristics and distribution patterns. Simultaneously, we analyze the country’s performance in different trade activities and construct a new indicator ( T T A ), which examines the driving influence of these models on the economy. We compare the evolving trends of T T A and GDP for various development modes over time, establishing a strong relationship between GDP growth and T T A . Finally, we provide recommendations for the future development of countries amidst a tumultuous international environment.
The rest of the paper is organized as follows: Section 2 provides a formal definition of the total production length measure and outlines how it can be decomposed into domestic and GVC production length using the production activity account framework proposed by Wang et al. [24]. Section 3 analyses the economic development of both the global economy and individual countries, identifying evolving trends and categorizing countries into different developmental paths. Section 4 employs the production length to determine a country’s position in the global context. It defines a country’s trade ability in the world and analyzes how these trade ability changes in relation to economic growth. Additionally, it compares how different modes affect both of these factors. Section 5 serves as the conclusion of the paper, offering constructive suggestions for countries to prioritize their economic development efforts.

2. The Decomposition of Production Chains
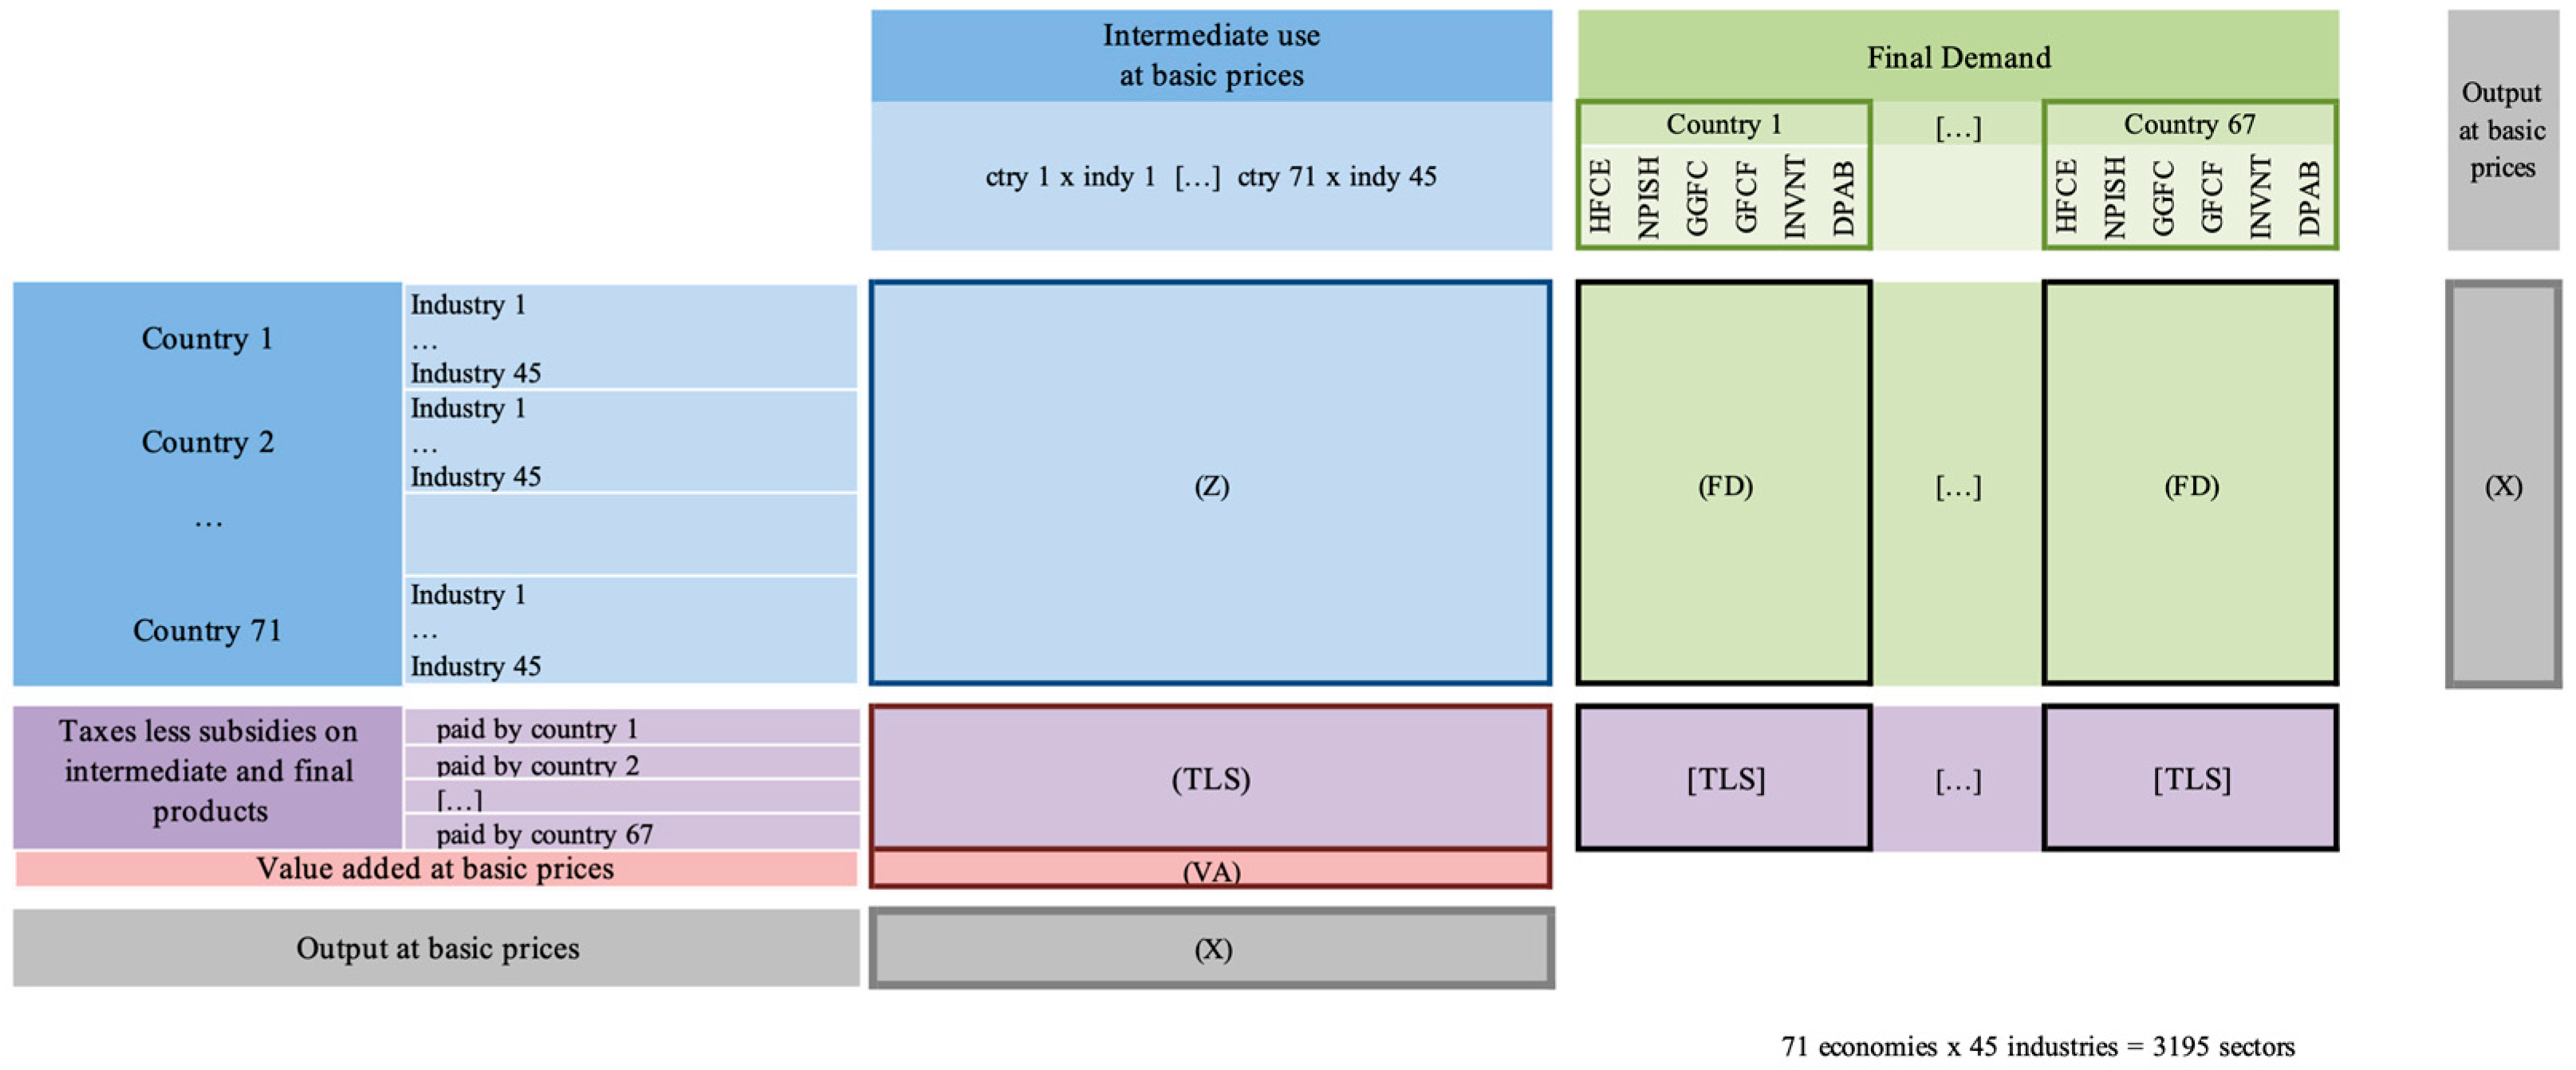
2.1. Data

The analysis conducted here is based on data from the 2021 release of the OECD, which comprises an annual time series of global input–output tables. The global input–output table can be viewed as a set of national input–output tables linked together through detailed bilateral international trade statistics. In essence, it provides a comprehensive overview of all international transactions between industries and final consumers. The columns in the table contain information about production processes. When expressed as ratios to gross input, the cells in the columns provide information about the shares of inputs in total costs. Such a vector of cost shares in gross output is commonly referred to as a production technology. Products can be purchased by final users or be part of final demand expenditures (including household consumption, government consumption, gross fixed capital formation, and changes in inventories) or integrated into other goods and services as intermediates. The distribution of the output of industries over user categories is indicated in the rows of the table. An important accounting principle of the table is that the gross input of each industry (given in the last element of each column) is equal to the sum of all uses of the output from the industry (given in the last element of each row).
The OECD’s input–output table covers 67 economies (38 OECD countries and 28 non-OECD economies) and the Rest of the World (ROW). Each economy contains 45 sectors ranging from agriculture to household employees. The structure is shown in Figure 1. In the data, China is divided into two parts (export processing activities and activities excluding export processing), and Mexico is divided into global manufacturing activities and activities excluding global manufacturing. As a result, the metadata includes a total of 71 economies. However, in this paper, our computations will be based on the total data (i.e., merging the two parts). We ended up with data from 67 economies, each consisting of 45 sectors.

2.2. Method

We define the length of production as the average number of production stages between the primary inputs in a sector of a country to final products in another country or sector: it is the average number of times that value-added created by the prime factors employed in the sector of country pair has been counted as gross output in the production process until it is embodied in final products.
Based on input–output balance conditions and inter-industry input–output relationship, a country’s total output can be expressed as:
X = Z + Y = A X + Y = A D X + Y D + A F X + Y F
where X represents the total output (size: 3015 × 1), Z is a matrix of intermediate input flows produced between each industry of each country. Y stands for final demand, A represents the input–output coefficient matrix (denoted as A = Z X ), and A D refers to the domestic consumption coefficient matrix, which is a diagonal block part of A , A F = A A D .
Based on Leontief [25], the relationship between value-added and final products is constrained by the following equation: V a = V ^ X = V ^ X Y , where V a represents the value added of the sector (size: 1 × 3015). In the production process, primary inputs (value added) of sector i can only be directly embodied in the final products of sector j if sector i and j are the same.
At the first stage of the process, the value added of sector i of country s embodied in the final products of sector j of country r can be quantified as δ i j s r ν i s y j r , where δ i j s r = 1 when i = j , s = r , otherwise δ i j s r = 0 . At this stage, the length of the production chain is 1, and the output in production chains is δ i j s r ν i s y j r .
In the second stage, the value added of sector i of country s embodied directly in its gross output that is used as intermediates to produce final products of sector j in country r can be measured as ν i s a i j s r y j r , where a i j s r signifies the input–output coefficient, a i j s r = z i j s r x j r , z i j s r corresponds to the production flow of industry i in country s to industry j in country r . In this stage, the value added of sector i of the country s embodied indirectly in the final products of sector j of country r , the length of the production chain is 2, and the output induced by this production chain is 2 ν i s a i j s r y j r , because in this process, it accounts for added ν i s a i j s r y j r twice, one for sector i of country s , and another for sector j of country r .
In the third stage, indirect value added from sector i of country s can be embodied in intermediates goods from any sectors of countries, which are used as intermediates to produce final products in sector j of country r . Domestic value added from sector i of country s in this stage can be measured as ν i s t , k G , N a s t i k a t r k j y j r ; this is the second round of indirect value added from sector i of country s embodied in intermediate goods used by sector k of country t and absorbed by final goods in sector j of country r . At this stage, the length of the production chain is 3 , and the output induced by this production chain is 3 ν i s t , k G , N a s t i k a t r k j y j r . The same value-added produced from sector i in country s is counted as output three times: one in sector i of country s , one in sector k in country t , another in sector j in country r .
As for the infinite stage, we can obtain that:
δ i j s r ν i s y j r + ν i s a i j s r y j r + ν i s t , k G , N a s t i k a t r k j y j r + = ν i s b i j s r y j r
This can be expressed in matrix notation as:
V ^ Y ^ + V ^ A Y ^ + V ^ A A Y + = V ^ I + A + A 2 + A 3 + Y ^ = V ^ I A 1 Y ^ = V ^ B Y ^
Furthermore, following the value-added and final goods production decomposition framework proposed by Wang et al. [24], production activities can be categorized into four components depending on the presence of cross-border activities in production, as outlined below:
V ^ B Y = V ^ L Y D V _ D + V ^ L Y F V _ R T + V ^ L A F L Y D V _ G V C _ S + V ^ L A F B Y L Y D V _ G V C _ C
where L = I + A D + A D A D + = ( I A D ) 1 , B = ( I A ) 1 , Y D represents the domestic demand. The meanings of V _ D , V _ R T , V _ G V C _ S and V _ G V C _ C are as follows:
  • V _ D refers to the value-added created within the country and utilized to meet the demand within the country. This value added is utilized in the production of final products to cater to the domestic market;
  • V _ R T represents the value added produced domestically, serving as the final product to meet demand from foreign markets. The value added generated within the country is used as an input to create goods and services demanded by other countries;
  • V _ G V C _ S denotes the domestic value added employed by the importing country as an intermediate input for producing final products. This value added is absorbed by the importing nation and is not re-exported to a third country. It crosses the border only once;
  • V _ G V C _ C signifies the domestic value added utilized by the importing country as an intermediate input for both intermediate and final product production. These products then return to the exporting country as a flow-back of value added.
Based on it, we can calculate the production length using labor as a factor:
P L v _ D = V ^ L L Y ^ V ^ L Y ^
P L v _ R T = V L L Y ^ F V L Y ^ F
P L v _ G V C = V L L A F B Y ^ V L A F B Y ^
P L v _ G V C _ S = V L L A F L Y ^ D V L A F L Y ^ D
P L v _ G V C _ C = V L L A F ( B Y ^ L Y ^ D ) V L A F ( B Y ^ L Y ^ D )
Similarly, we can compute the Forward Length P L y _ D , P L y _ R T , P L y _ G V C ,   P L y _ G V C _ S , and P L y _ G V C _ C .

3. The Current State of International Trade

We focus on the allocation of the GDP in domestic trade, traditional trade, and GVC trade. We aim to identify the differences among countries from 1995 to 2018. We analyze the evolutionary path of each country and cluster them accordingly. The reason this paper began its research in the mid-1990s is that the world structure was evolving towards multi-polarization; this led to significant changes in trade patterns compared to earlier periods, coinciding with China’s rapid economic ascent and the swift development of its foreign trade [26].

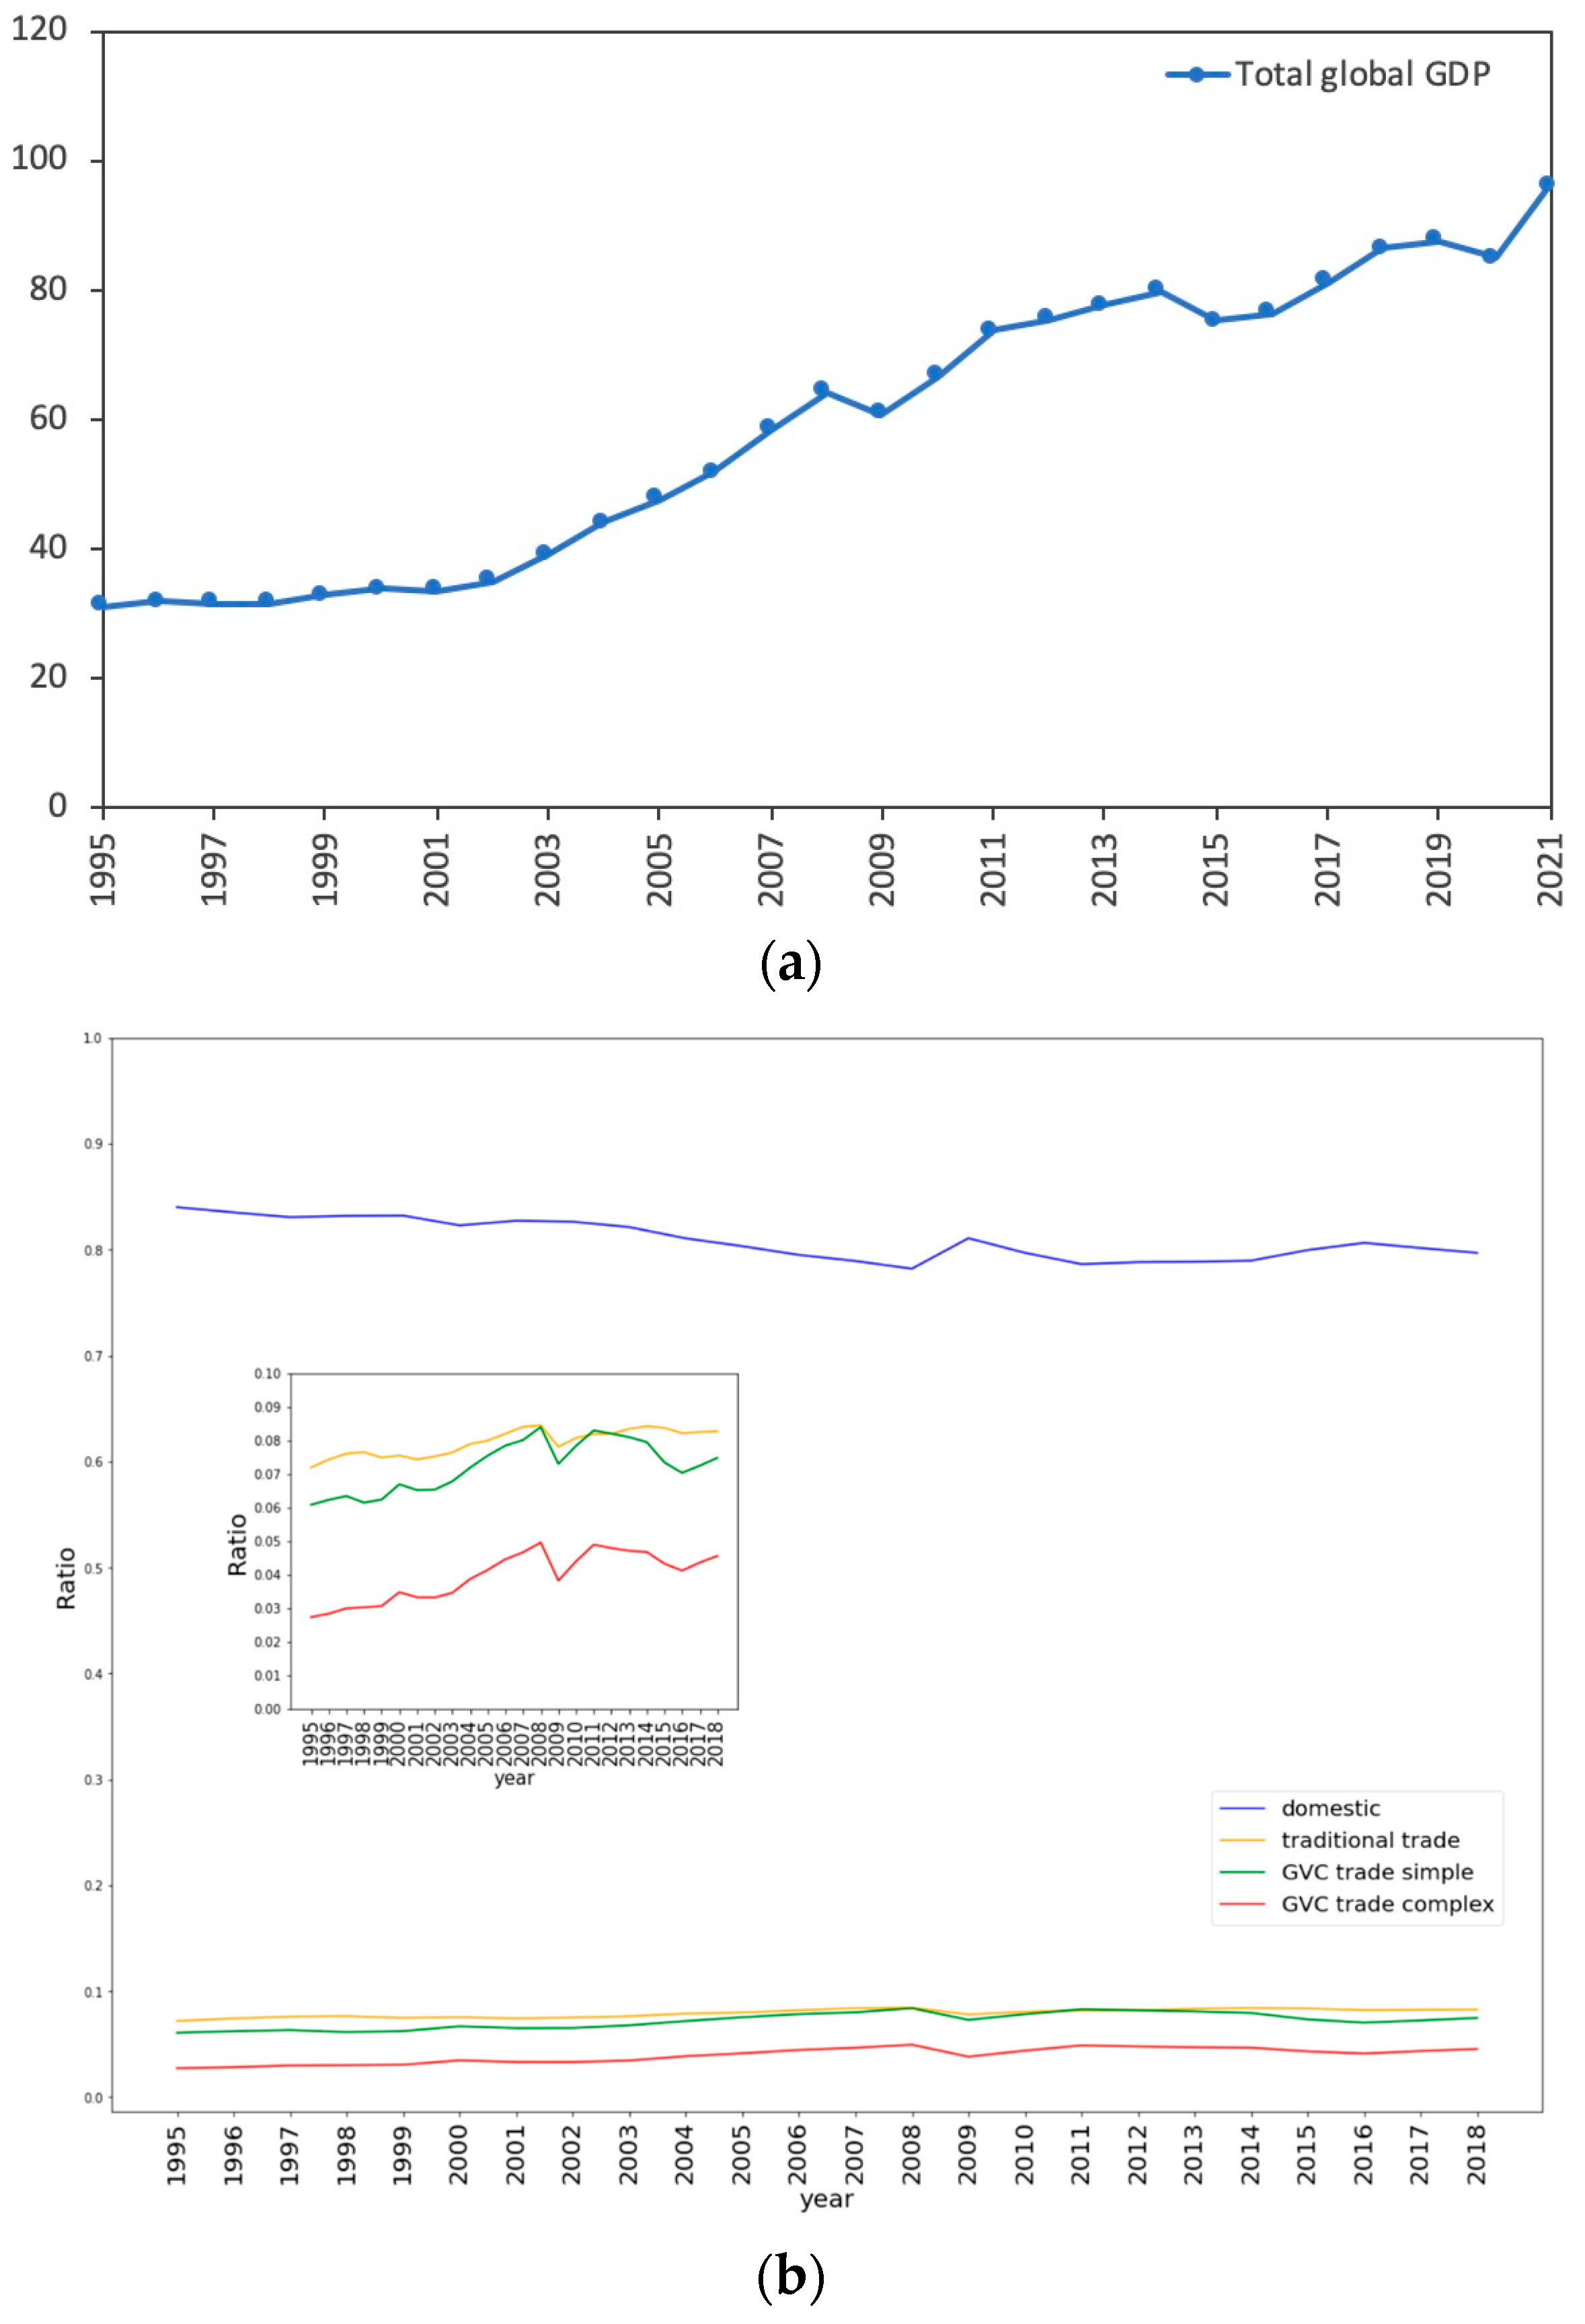
3.1. The Development of Trade among Countries

We utilize the input–output table and value-added decomposition to obtain the value added of every country in domestic trade, traditional trade, and GVC trade. As depicted in the left panel, the global economy has undergone rapid expansion since 1995. Interactions between countries became more frequent. However, in 2008 and 2009, growth was interrupted due to a severe global financial crisis. The world subsequently underwent a slow recovery. With the rise of protectionism and anti-globalization sentiments, countries began to shift their focus towards domestic trade in 2015 [27].
Based on Figure 2b, we observe domestic activities (utilizing domestic resources to meet domestic final demand) consistently hold a dominant position. In addition, the rest of the value added in the three international trade activities increases at a similar rate to the value-added in GVC trade [8].
To delve further, we analyze the country-specific value added among these activities. While most countries adhere to the pattern we discussed earlier, there are exceptions. For instance, countries like Luxembourg and Vietnam exhibit distinct patterns. Another notable exception is China, which also demonstrates unique characteristics. These findings are presented in Figure 3. Firstly, the contribution of traditional trade activity in almost all countries has remained relatively stable; this implies that the market dynamics for final consumer products have become largely established. Gaining new market share has become challenging, emphasizing the need for increased focus on GVC activity and domestic operations. Secondly, most countries have placed emphasis on GVC trade, including Germany, France and Vietnam. They have ramped up their involvement in GVC activities while scaling down domestic operations. This trend holds true for both developed and developing nations. Thirdly, there are exceptions with an evolutionary path distinct from others. For instance, the USA exhibits minimal changes in its entire trade model. As for China, the contribution of traditional trade to GDP has remained nearly unchanged. The primary shifts have occurred in both the domestic and GVC sectors. The domestic ratio has held steady at around 0.8, but after China’s accession to the WTO and active participation in international trade, this ratio decreased from 0.81 to 0.72. China officially joined the WTO in 2001, and its trade policy underwent tremendous changes during this period, including adjusting market access policies, implementing tariff protection, and adjusting import and export substitution policies. Taking tariff protection as an example, the average tariff on all products in China was 36% in 1994, dropped to 23% in 1996, 17% in 1997, 15.3% in 2001, and 9.4% in 2004. In general, a reduction in tariffs may be beneficial for developing economies since it may increase their incentive to develop sectors with higher growth potential [28,29,30]. Simultaneously, GVC activity surged to 0.15. Since 2000, the increase in net exports of goods and services has emerged as a significant driver of economic growth, marking the first time in nearly a decade. According to China’s Ministry of Commerce, net exports of goods just saw a threefold rise, surging from USD 32 billion, constituting 1.7 percent of GDP in 2004, to over USD 100 billion, representing 4.6 percent of GDP in 2005. In 2005, the net exports of goods and services, reflected in China’s GDP expenditure, more than doubled to reach USD 125 billion, contributing to one-quarter of the economy’s growth [31]. After the financial crisis, it saw a dramatic increase to 0.79 and remained steady. After 2014, both traditional trade activity and GVC activity experienced a further reduction. Finally, the ratio of domestic activity reached 0.825 in 2018, marking the highest point in the past 20 years.

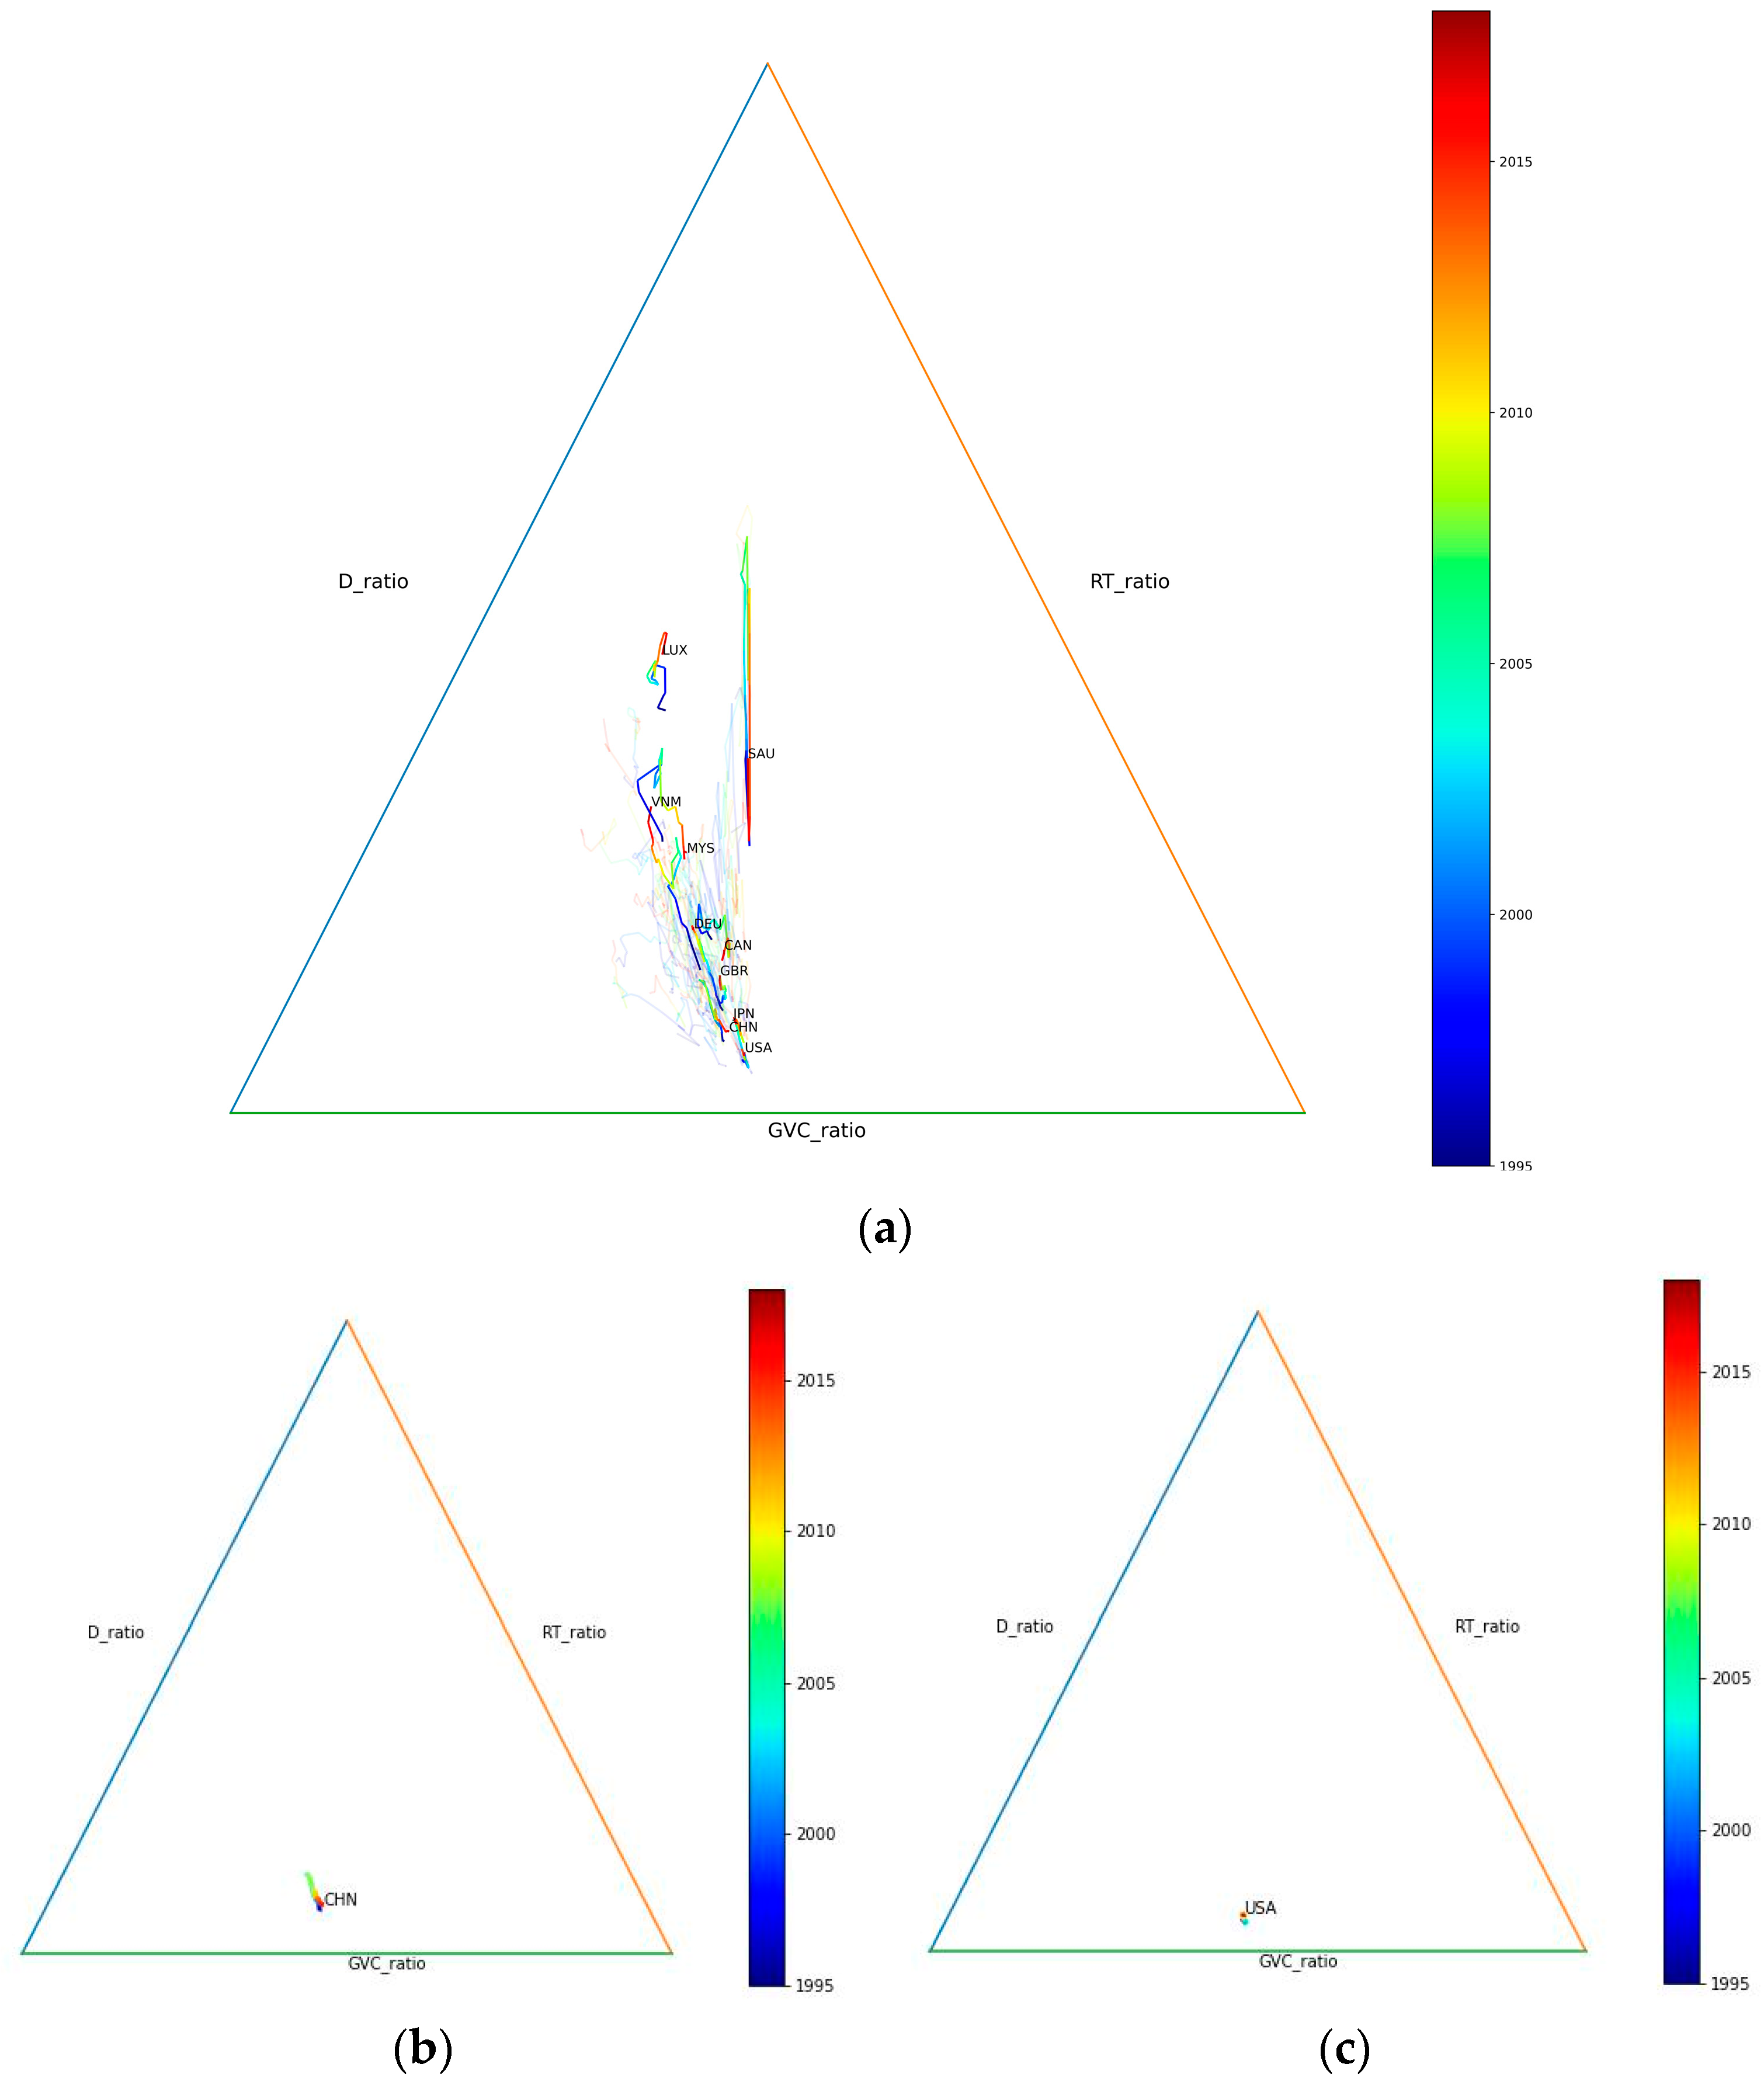
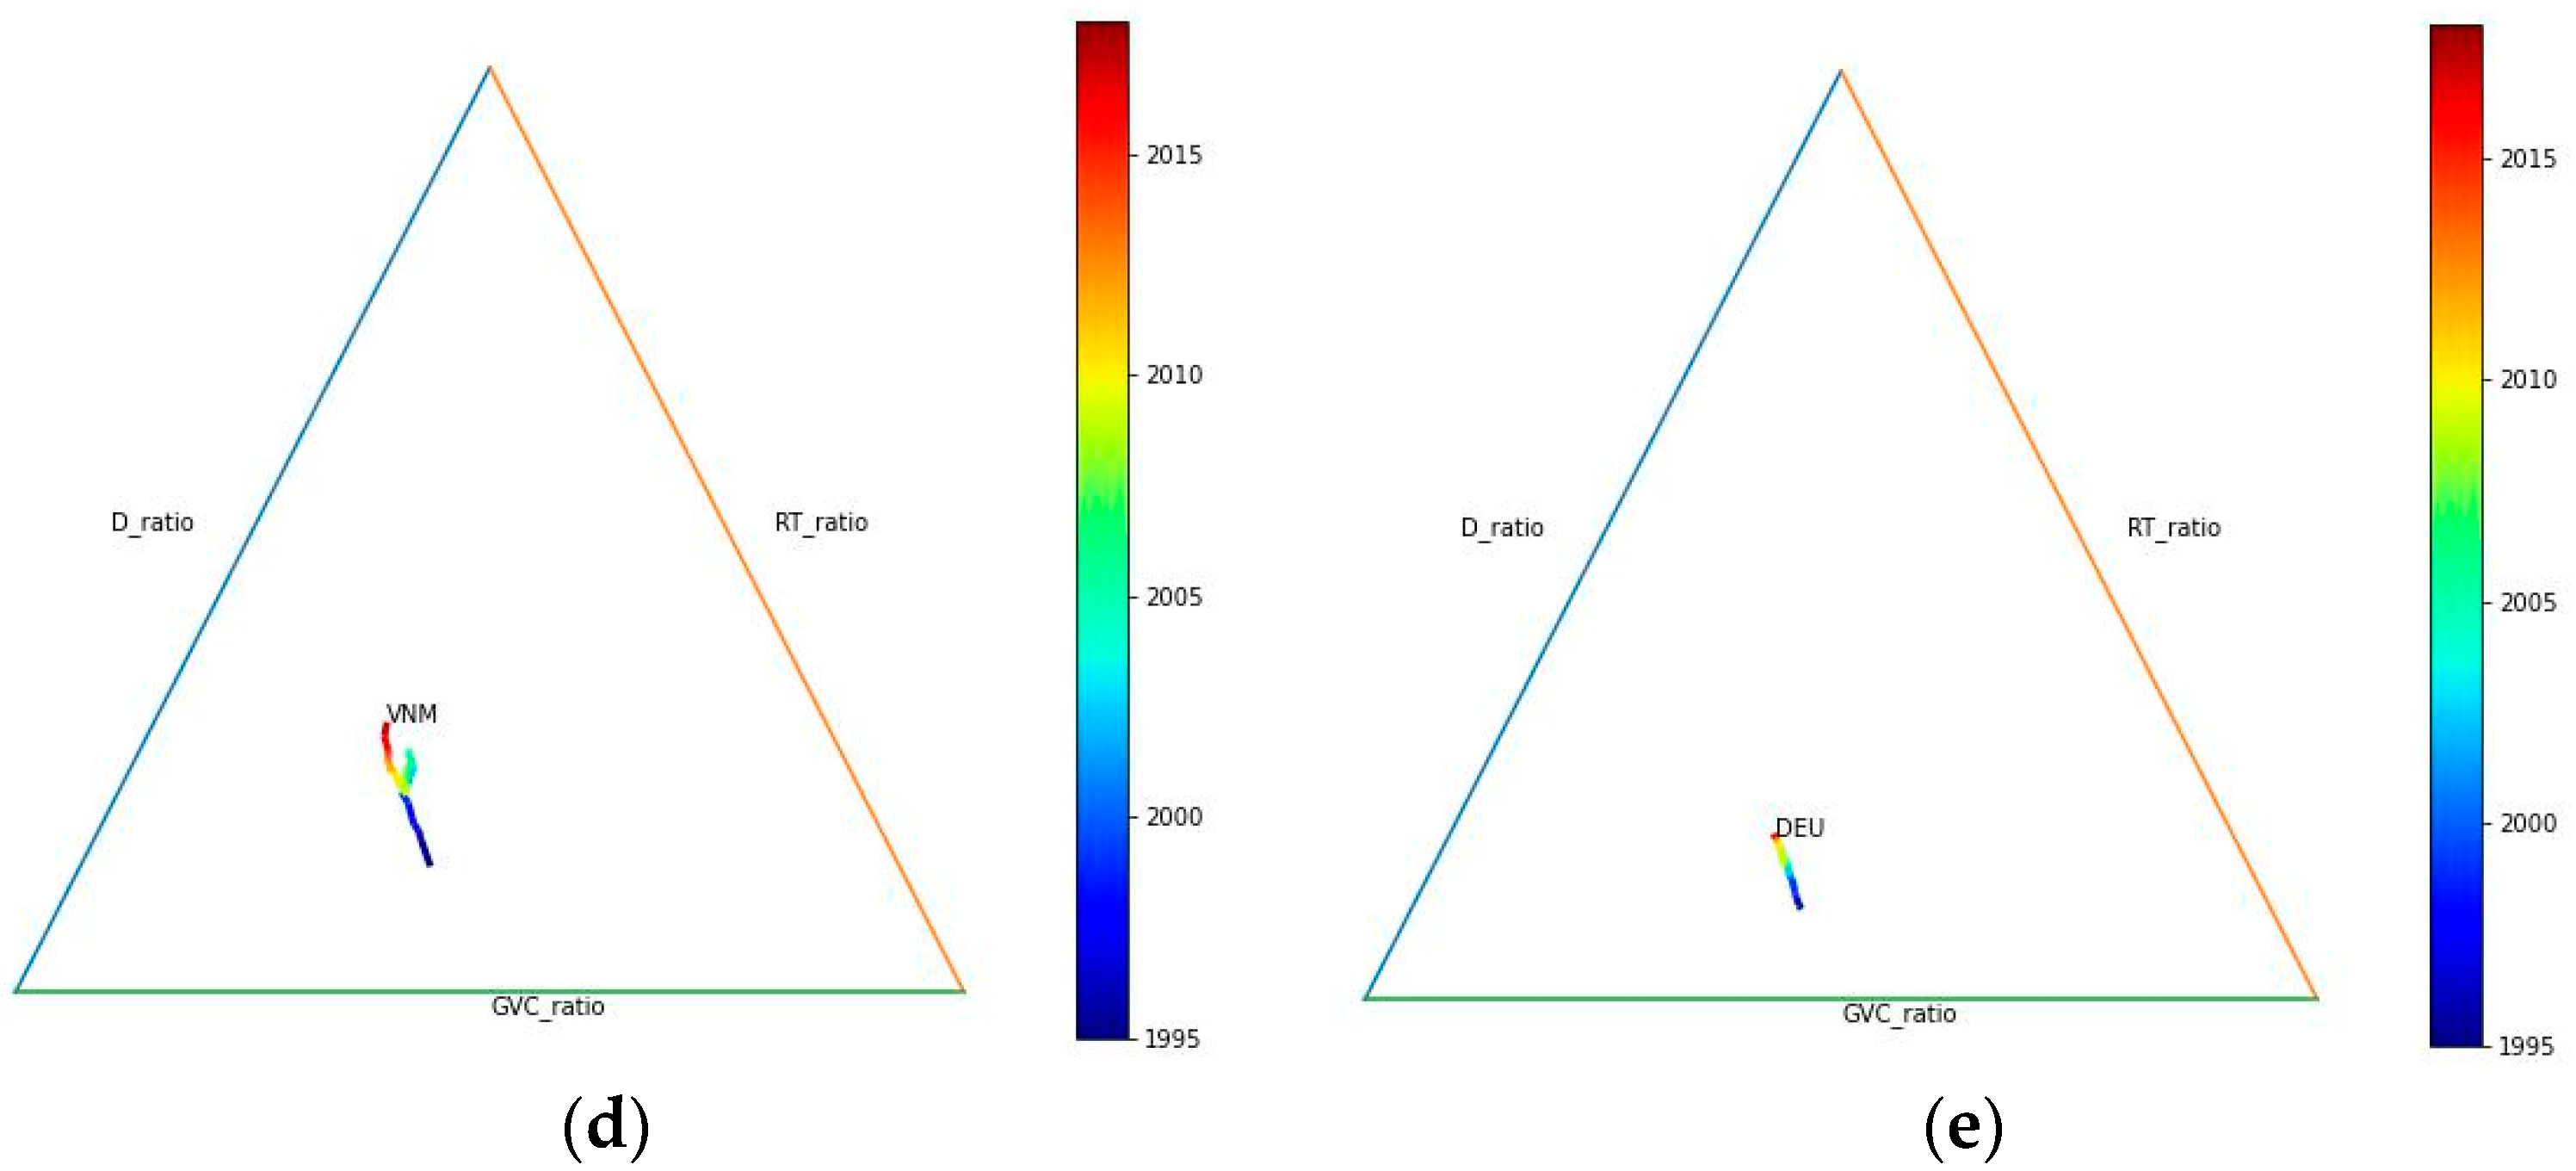
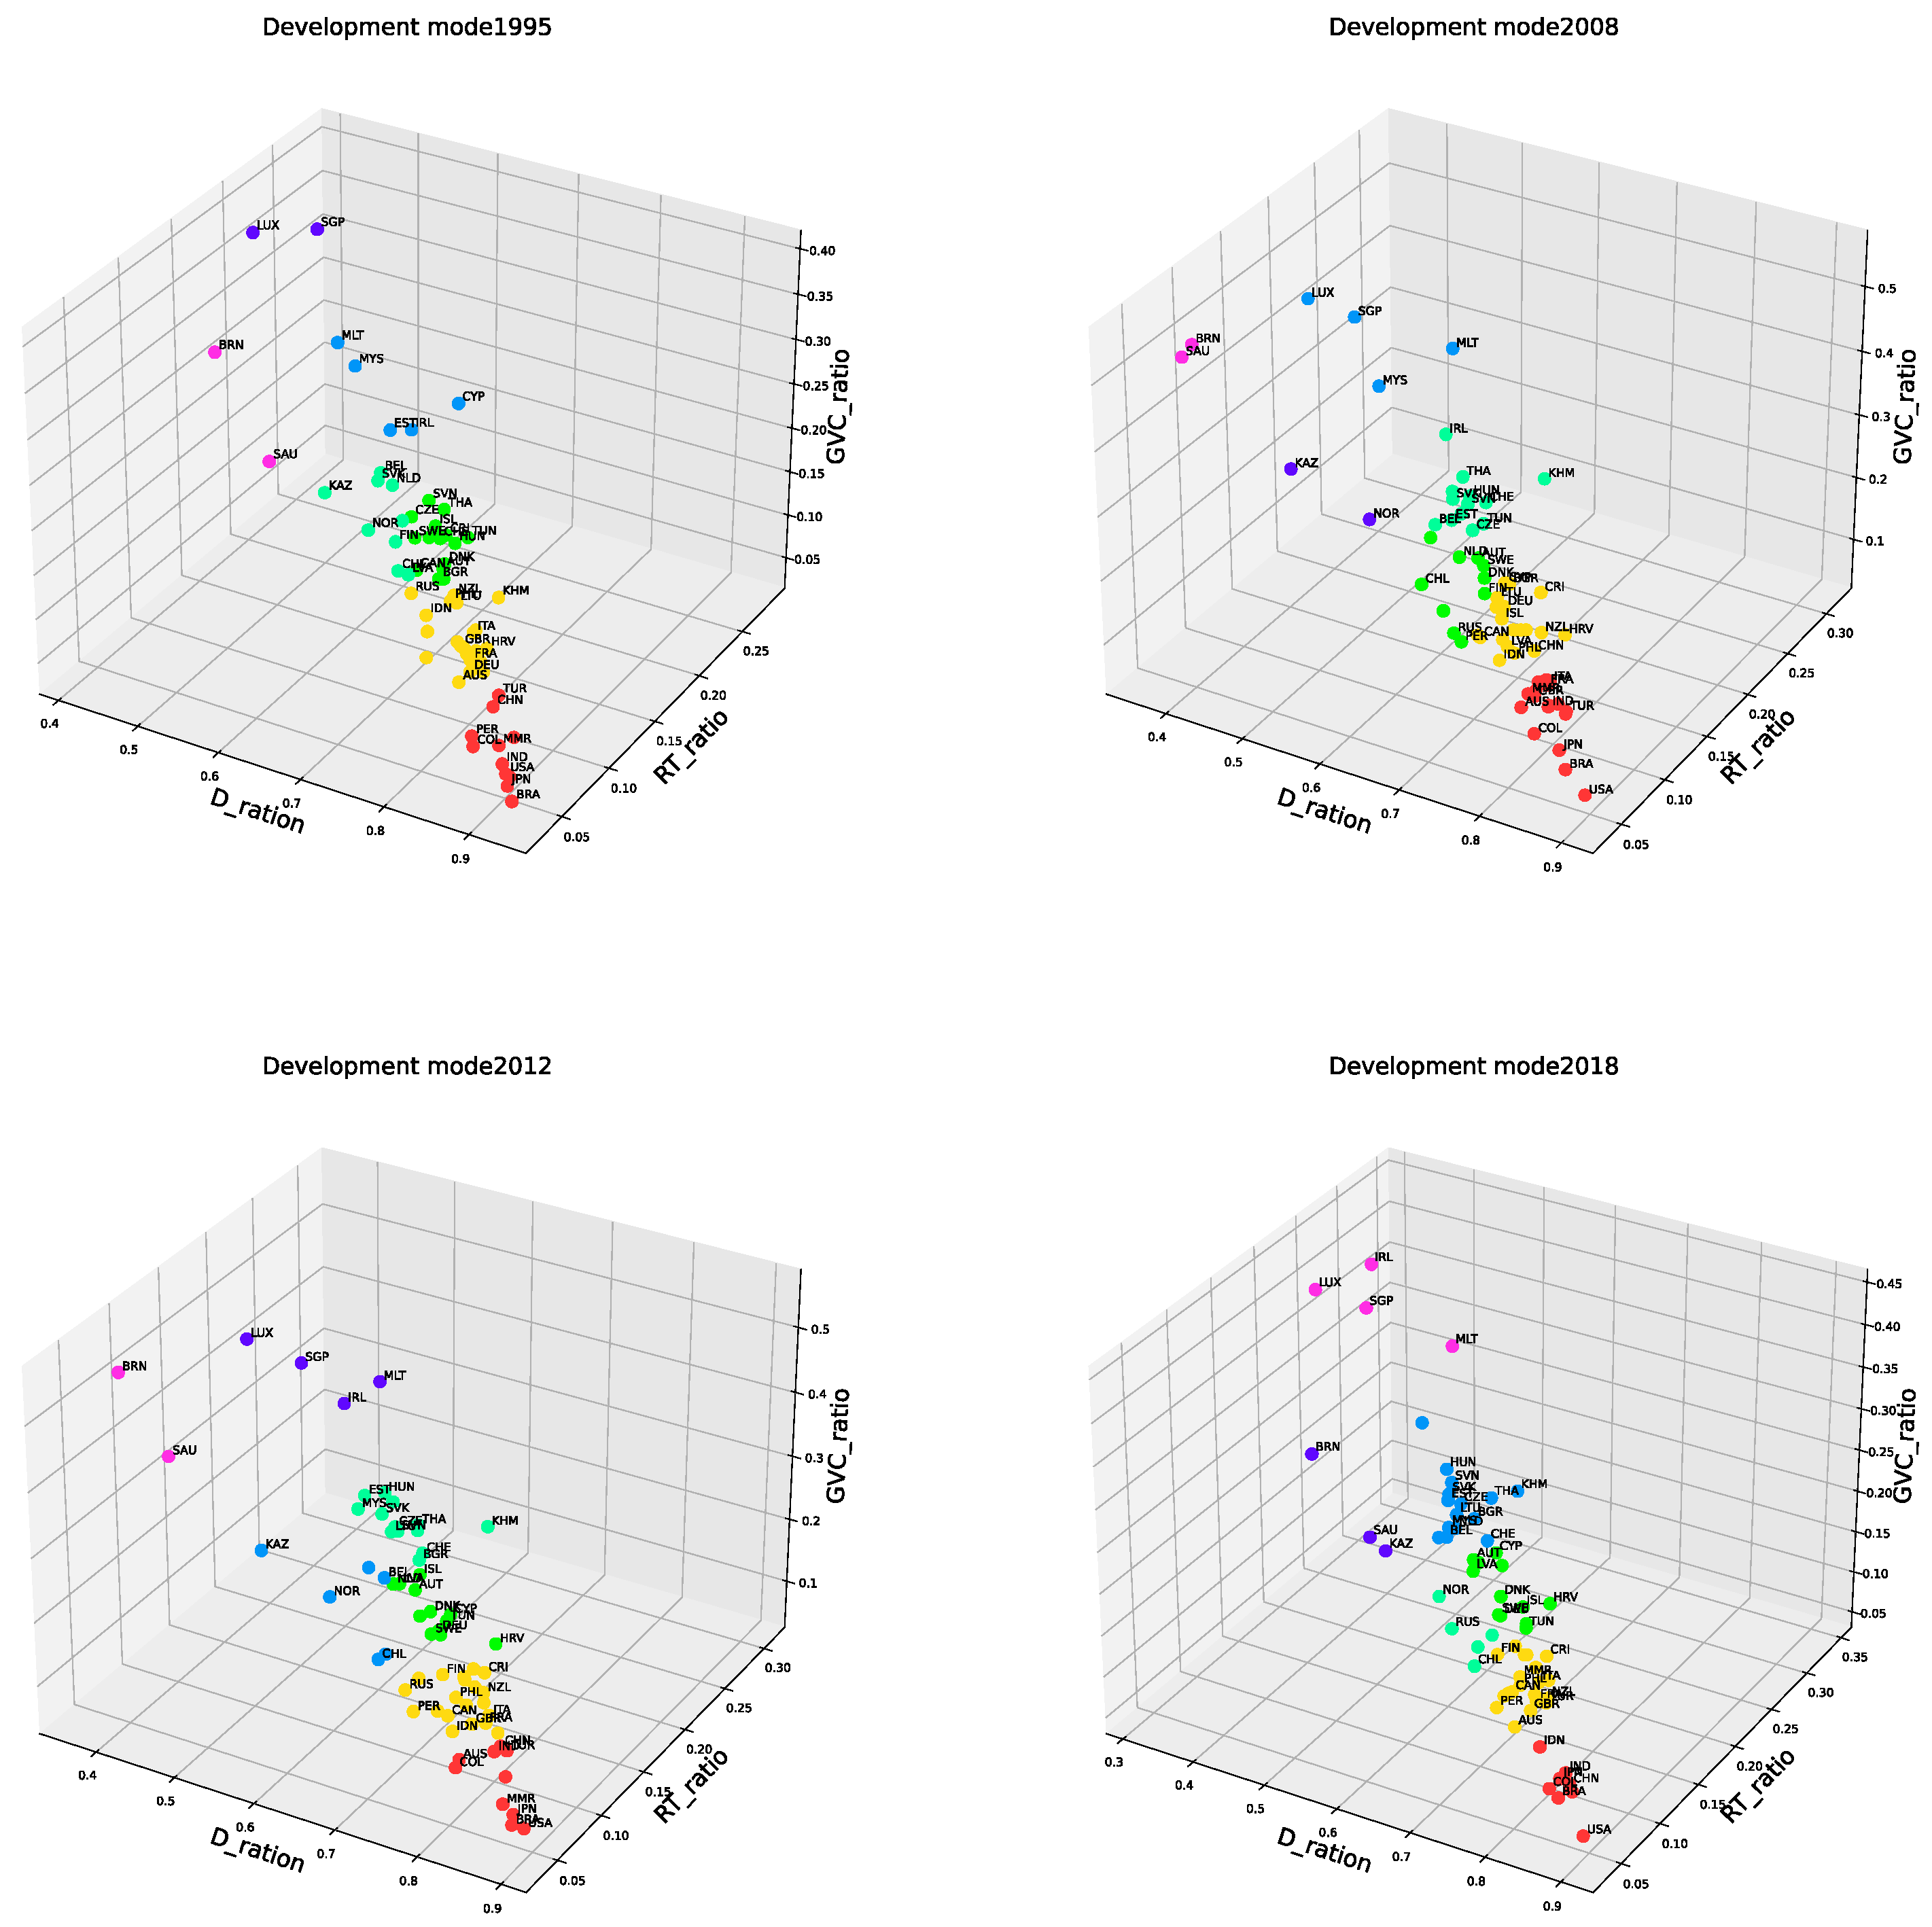
3.2. Country Development Mode Cluster

Utilizing the country’s distinct distribution in production activities, we applied K-Means clustering to categorize them into different groups, as illustrated in Figure 4.
Referring to the figure, we observe that certain countries, like Singapore, Luxembourg, and Malta, exhibit a high dependence on GVC trade; this implies that their economies are particularly sensitive, as even a slight disruption in international trade could lead to significant turbulence. Countries in Southeast Asia and non-core European nations cluster around [0.55, 0.2, 0.25] (representing domestic, traditional trade, and GVC trade, respectively). Given their proximity to major economies like the EU, China, and Japan, they tend to place a greater emphasis on international trade. In contrast to Asia and Europe, North America and Latin America, despite having some of the world’s largest economies, do not exhibit very high levels of GVC activity or traditional trade activity. One significant reason for this is that since the debt crisis in Latin America in the 1980s, the economy has struggled to regain its footing. Argentina and Brazil have consistently grappled with high levels of debt. Moreover, Latin America lacks the labor advantage seen in countries like Vietnam, which hinders their ability to partake in the dividends offered by the GVC, particularly in low-end segments. From a global perspective, we can discern that the prevailing trend worldwide continues to gravitate towards tighter and more frequent trade; this is primarily depicted in the figure as the clustered centers of various types converging towards the middle.

4. How Trade Mode Effects Economy Growth

As we examine the diverse economic models adopted by countries, we aim to understand how these modes impact economic growth. Is there an optimal development mode that fosters economic progress? To address this, we employ the concept of production length to gauge a country’s total trade ability in both domestic and international production. By utilizing this index, we investigate the correlation between GDP growth and changes in this trade ability.

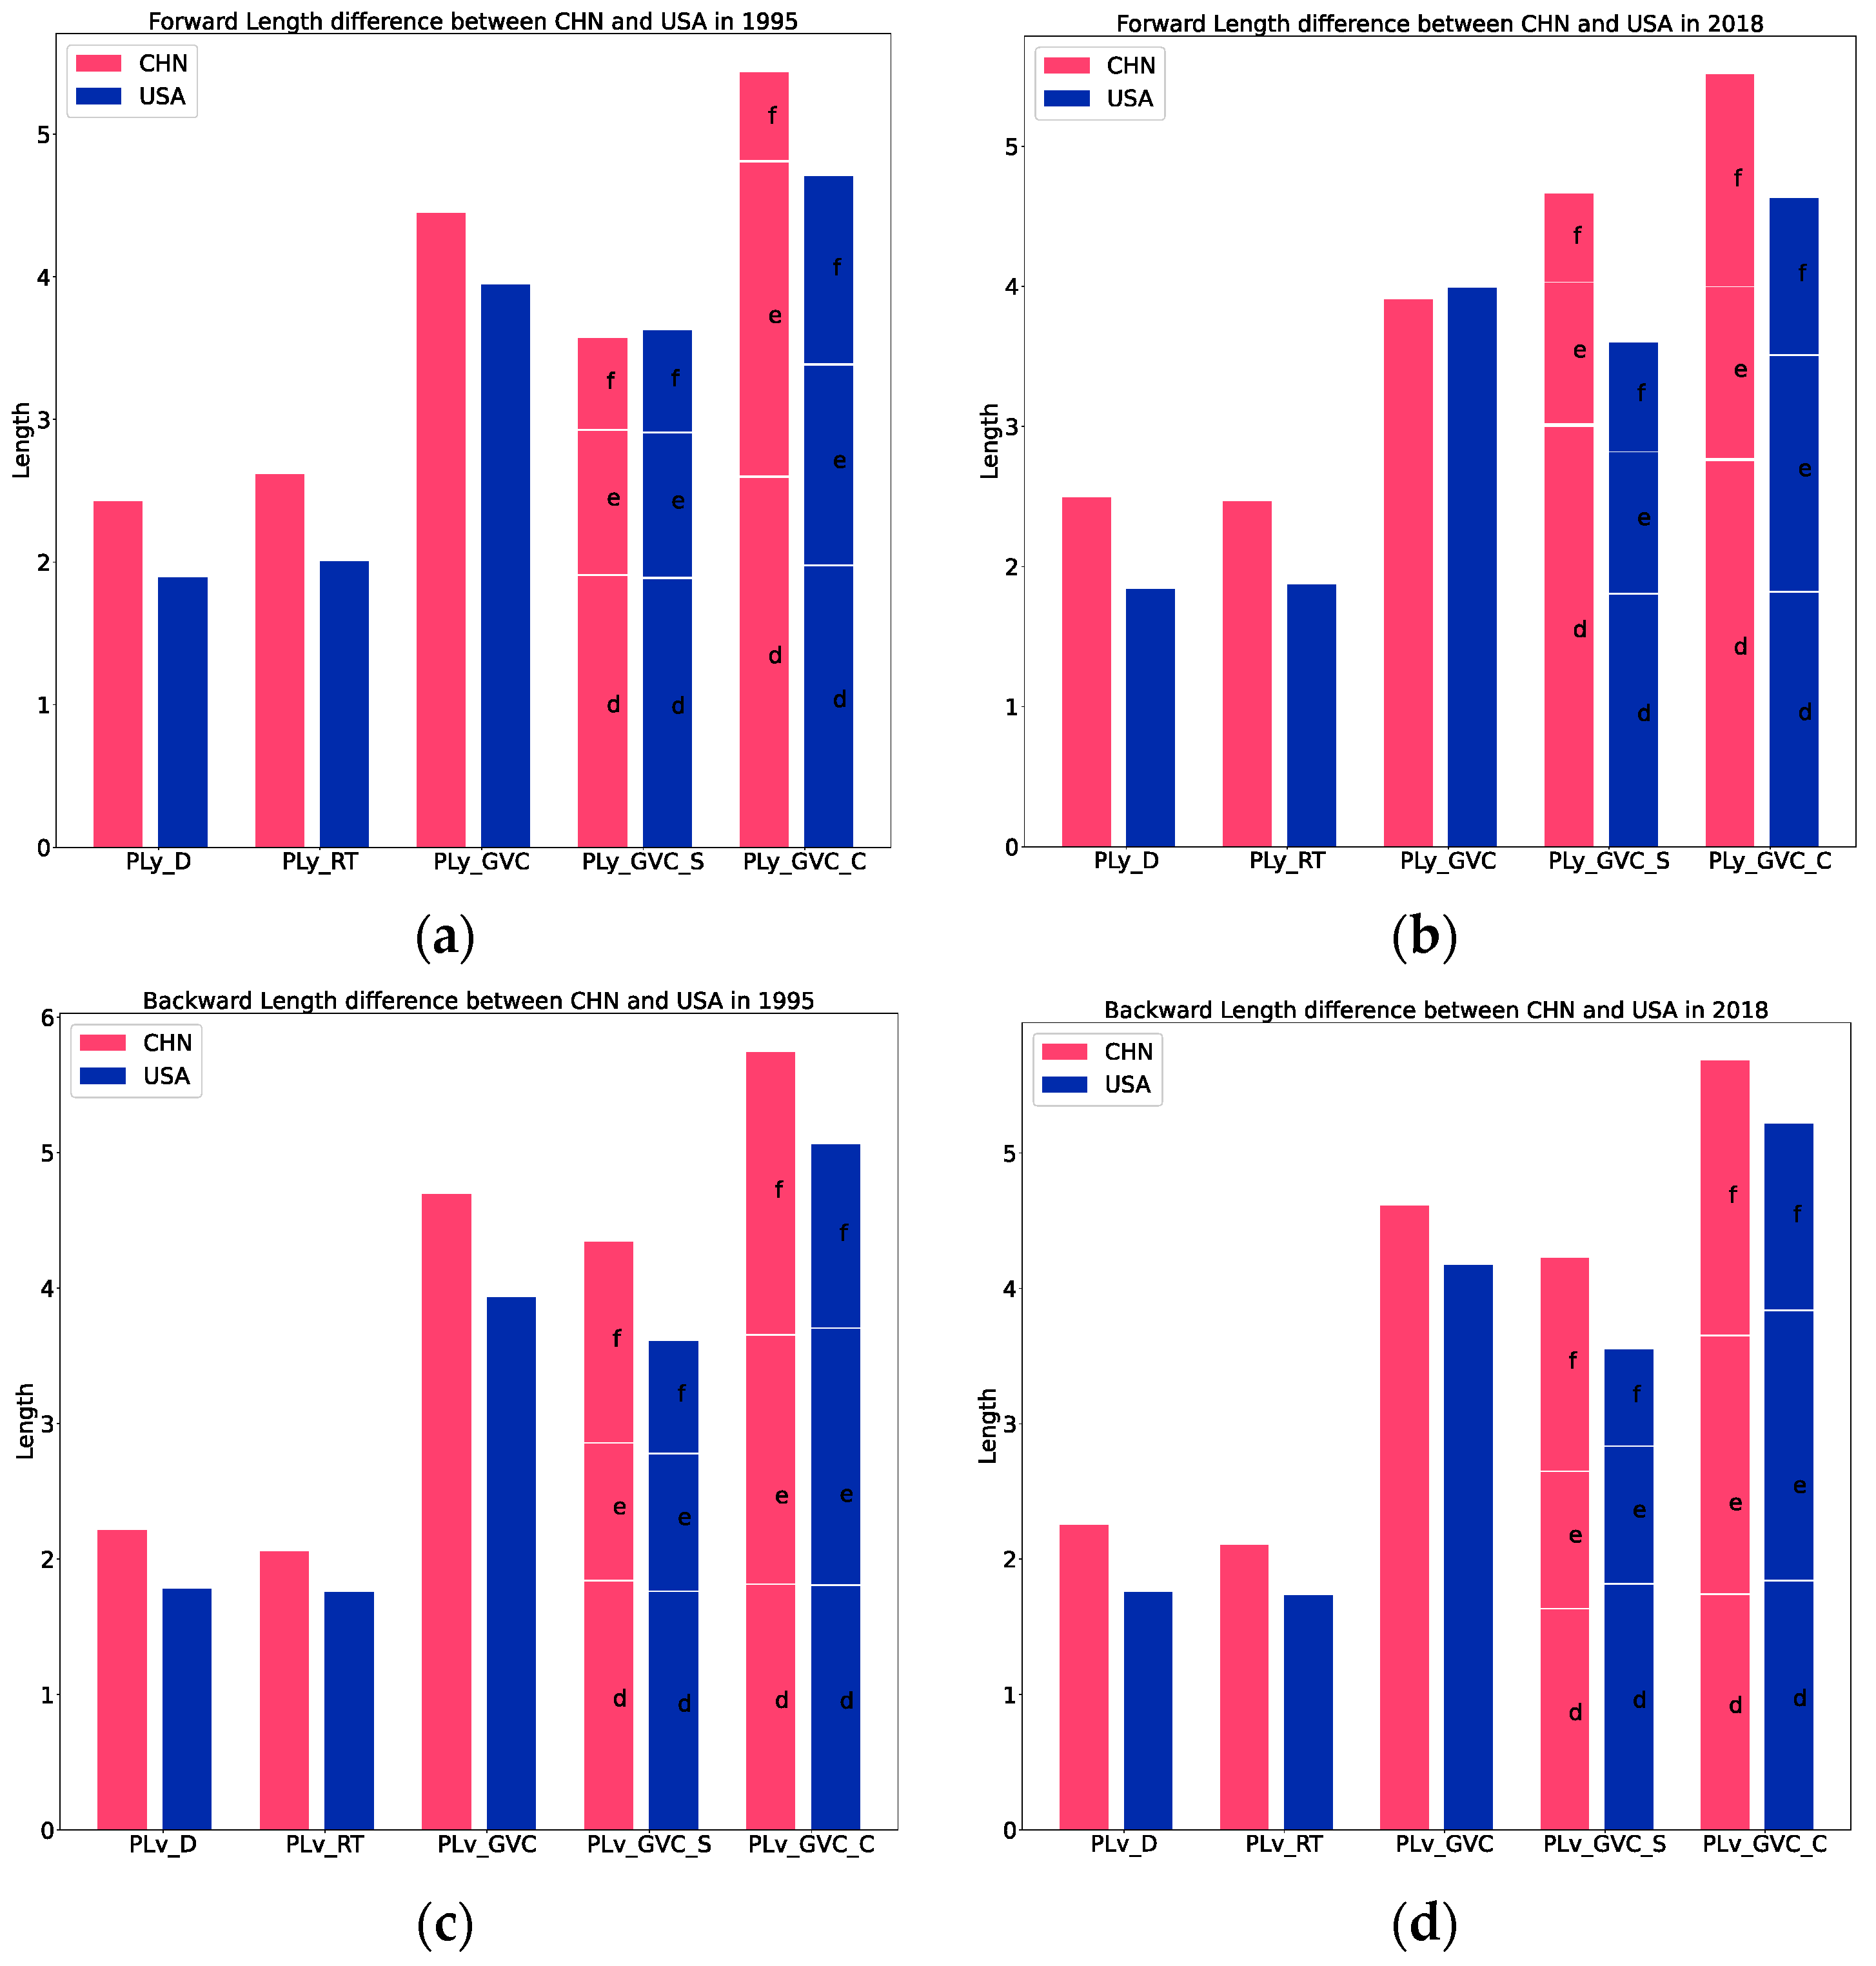
4.1. Production Length and Production Position

Utilizing Wang’s method [23], we can determine the varying lengths of economic activities worldwide. In Figure 5, we present a comparative analysis of China and the United States.
Upon calculating both forward and backward production lengths, it becomes evident that, regardless of the category, there is minimal change observed in both the USA and China; this suggests that despite economic growth and technological advancements, the product structure remains largely stable. This can be attributed to the fact that the production length is contingent on the comparative advantages of countries and the structure of industries, rendering substantial changes over a short period challenging. However, a country can take measures to adjust its overall production stage; this is achievable primarily in countries with high technological capabilities, as they can attain a form of downward compatibility in production. For example, in the case of the USA, we observe a substantial increase in the domestic component of simple GVC activities. This shift occurred in 2008, following the financial crisis. In response to this, the United States implemented a series of measures involving industrial realignment to create additional job opportunities. Consequently, this led to an extension in the length of domestic production for simple GVC activities. A country with a longer forward production length signifies that it holds a prominent position and assumes a leading role in subsequent stages. Conversely, a country with an extended backward production length implies a lag in development, leading to dependence on other countries. Based on this hypothesis, we can ascertain a country’s position in various economic activities.
T A = F o r w a r d   L e n g t h B a c k w a r d   L e n g t h
Trade ability ( T A ) implies that a country situated far from the final consumer (indicating a large forward length) or in proximity to the original producer (indicating a small backward length) exerts greater control over the trade chain and plays a more significant role in trade. A higher T A corresponds to a more prominent position for the country within the production stage. We determine the positions of 67 economies in terms of domestic trade, traditional trade, G V C _ S , and G V C _ C . Subsequently, we depict this information in a radar chart shown in Figure 6.
Upon reviewing the radar chart, it becomes apparent that some developing countries’ domestic T A aligns with the intermediate level of the developed countries, and it maintains a relatively stable trajectory. This pattern is also observed in the case of China, suggesting that these countries possess a well-established industry structure capable of meeting the needs of their citizens. With the exception of Vietnam, which experienced an increase from 1995 to 2009 followed by a decrease up to 2018, possibly attributable to globalization, it appears that Vietnam’s technological and production capabilities face challenges in meeting the escalating material and cultural demands of its populace. In addition, the T A of developed countries in other activities remains unchanged. As for China, it experienced an initial increase followed by a subsequent decrease to a certain extent in all three aspects; this aligns with the changes in the value-added ratio, as discussed earlier.

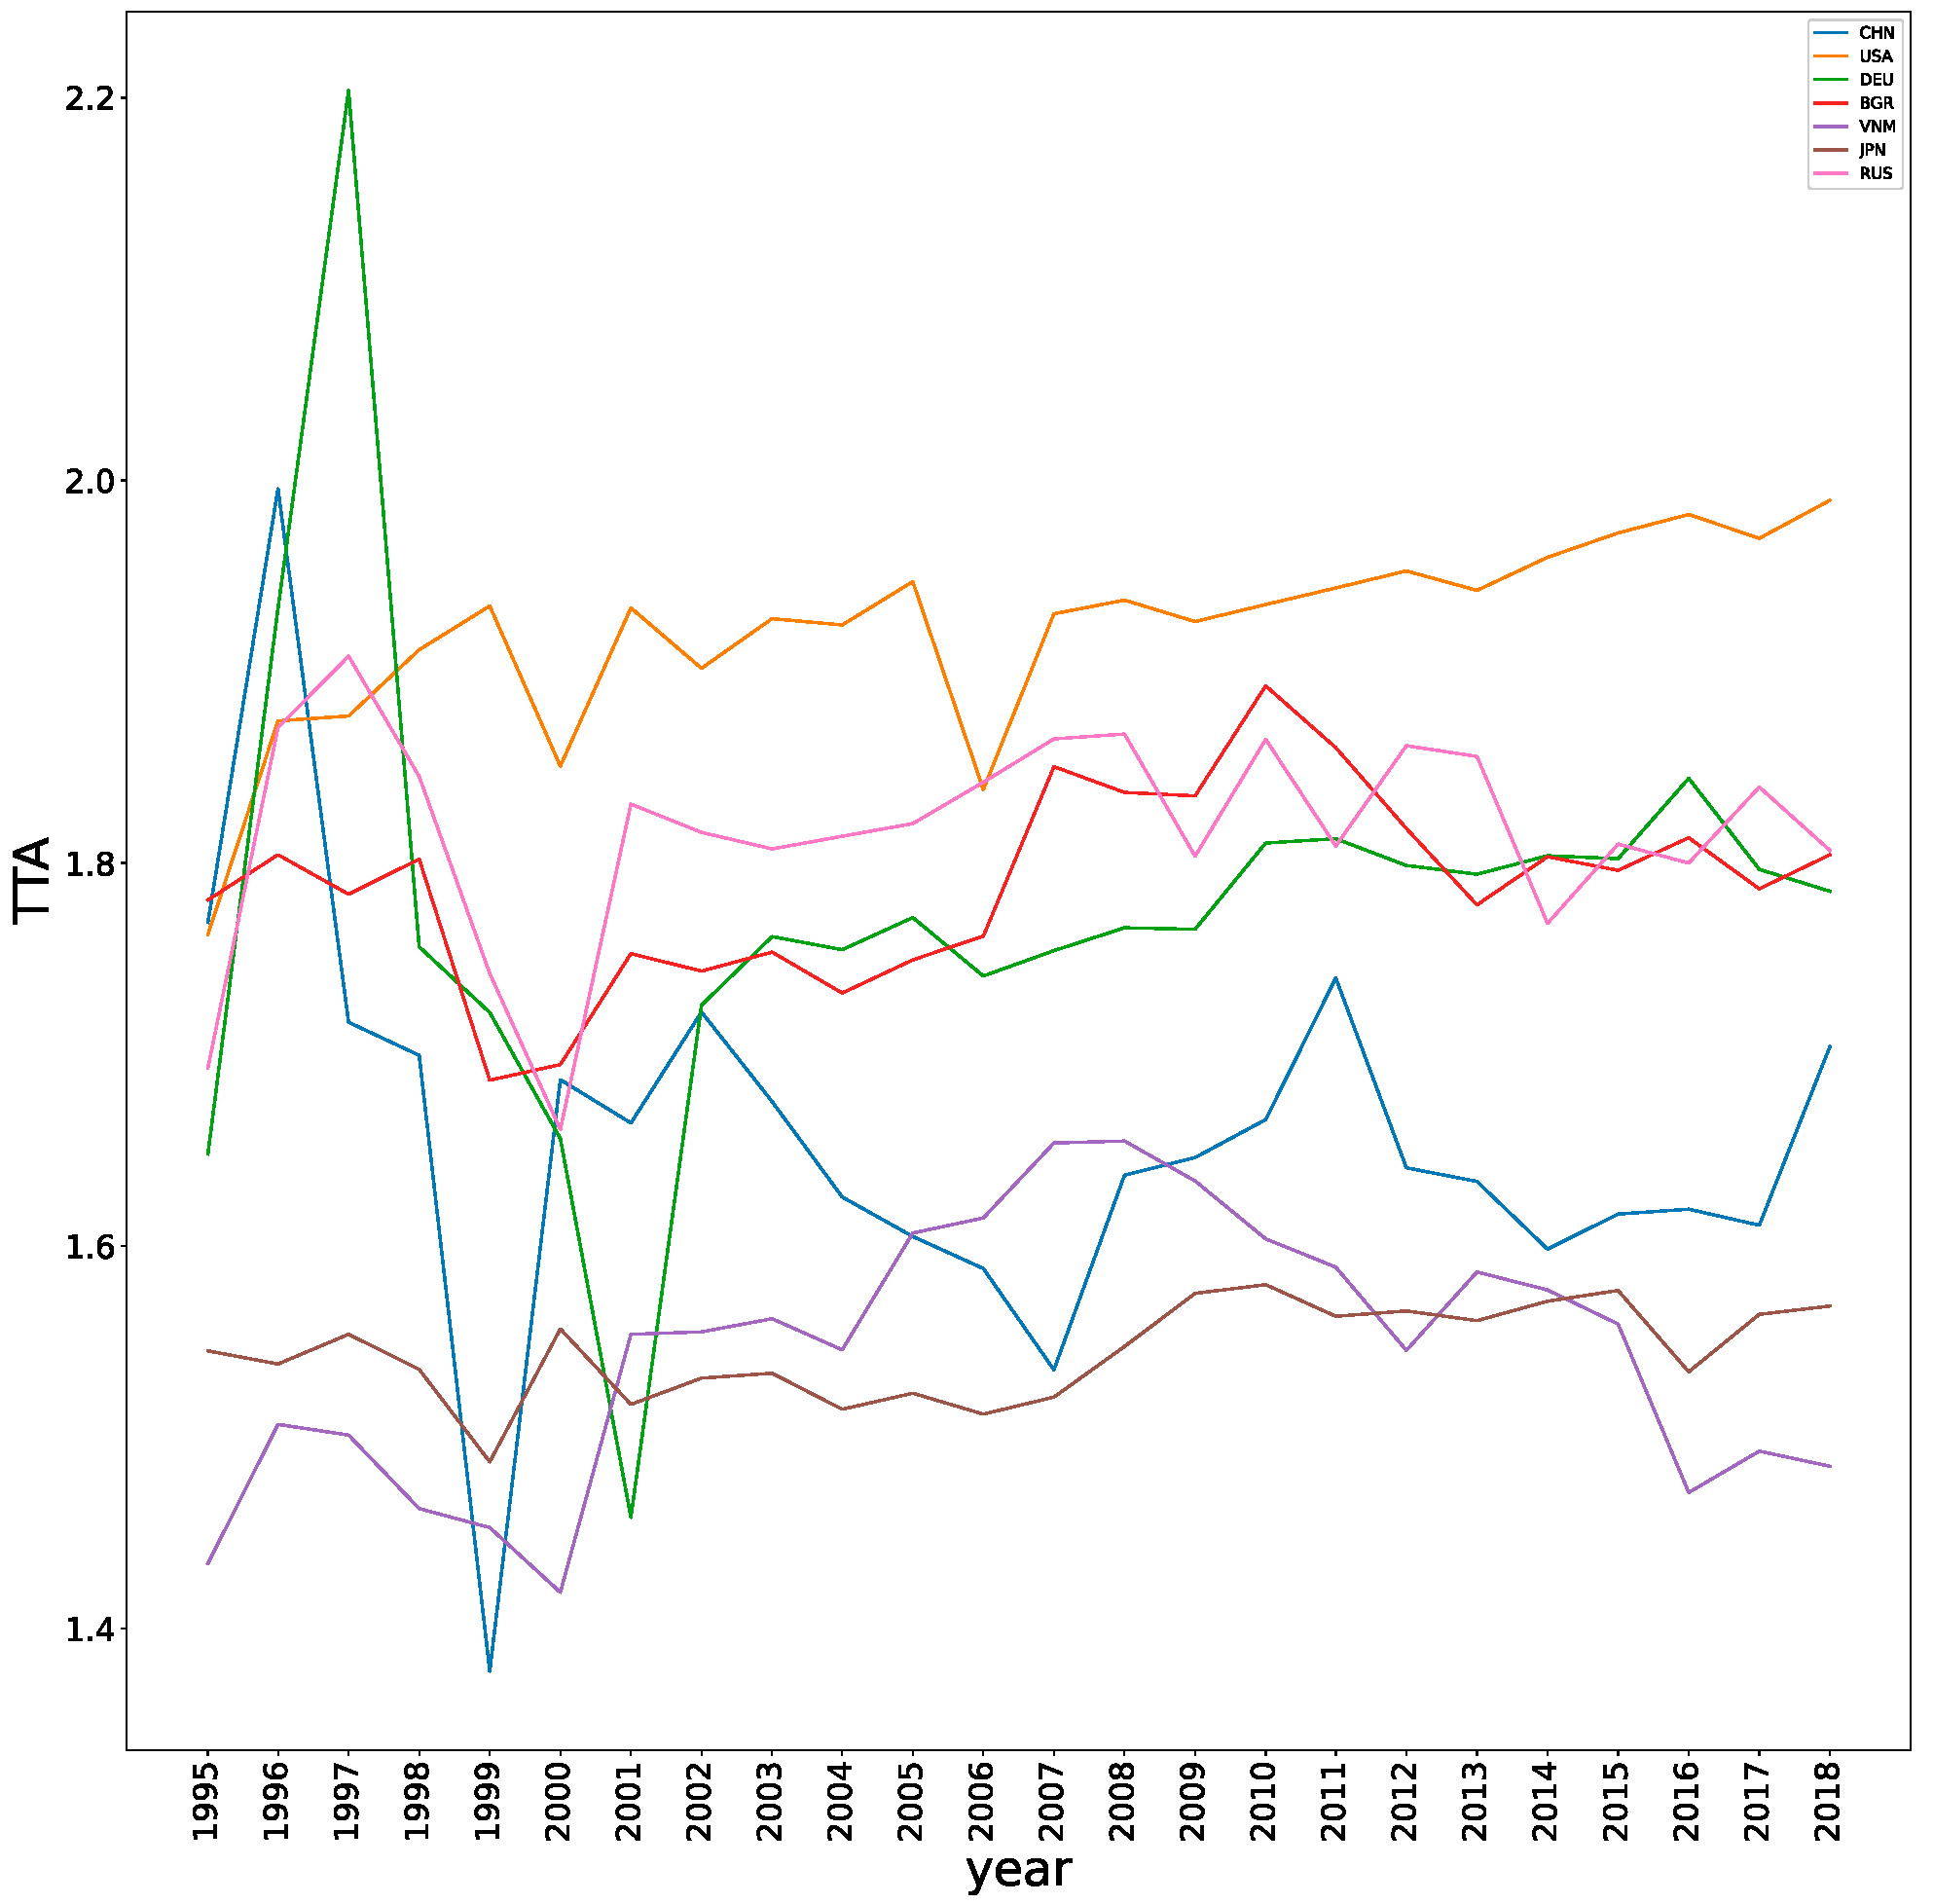
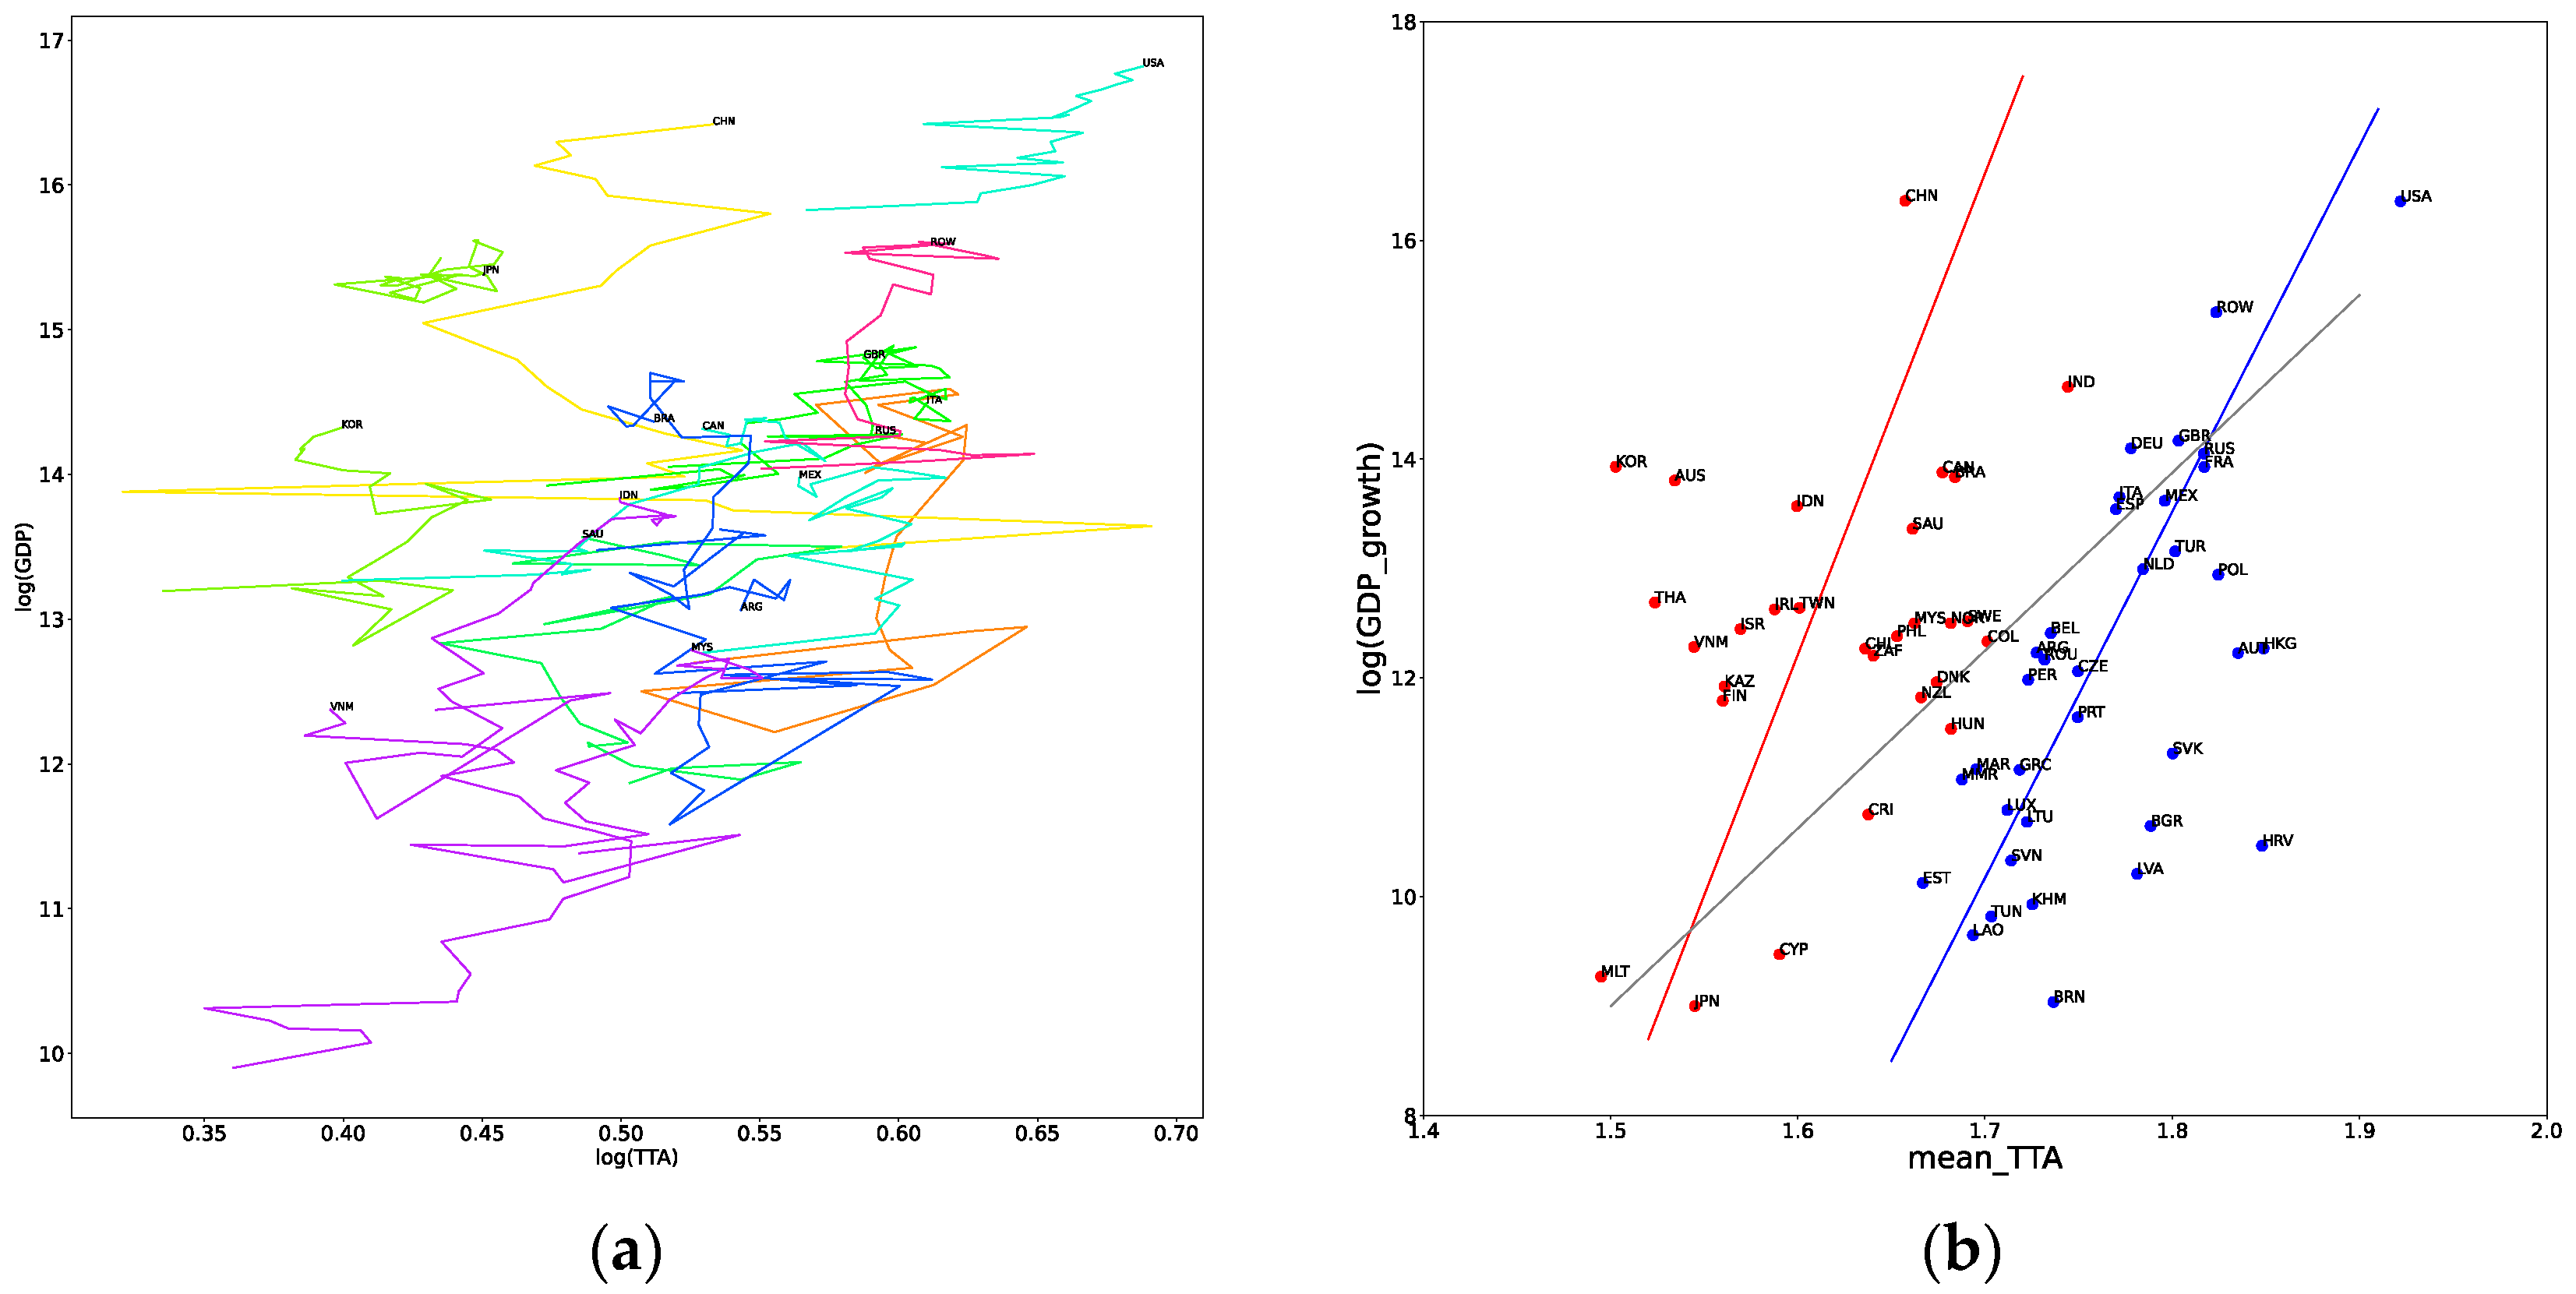
4.2. TTA Change and GDP Growth

After we construct the trade abilities of these countries in different types of trade, we create a final index to measure a country’s true ability on the global stage. The total ability ( T T A ) of a country is determined by calculating the area on the Radar Chart, as depicted in Figure 7.
We obtained the changes in the area from 1995. The USA consistently ranks at the top globally. As for China, we observed a decrease from 1997 to 2007. During this period, China absorbed a large amount of foreign capital and joined the WTO, which led to an increase in backward production length and a decrease in its T T A . During the financial crisis, international investment and trade were impeded. China shifted towards self-reliance, resulting in an increase in its T T A . After 2012, although the T T A decreased, the rate of decrease slowed due to 2011 being the inaugural year of the ‘12th Five-Year Plan’. In the face of multiple risks and challenges at home and abroad, China initiated economic restructuring. It aimed to meticulously manage the balance between ‘quality’ and ‘speed’ while addressing the issues of imbalance, lack of coordination, and sustainability in development [32,33]. Regarding Vietnam, it is evident that when China decided to optimize its industrial structure, a significant number of industries relocated to Vietnam and other Southeast Asian countries; this resulted in Vietnam taking on some of the functions previously held by China, leading to a dramatic decrease in its T T A [34].
Furthermore, we attempt to explore the relationship between T T A and GDP growth, as depicted in Figure 8. In Figure 8, the color of the lines is based on the cluster results discussed in Section 3.2. We aim to understand how different development modes of a country affect its T T A and economic growth. In the left panel, a notable trend emerges: countries, exemplified by the USA and CHN, gravitate towards the upper-right quadrant, signifying an increased dominance in global trade. Conversely, countries like JPN and ARG experience a relative shift or even a decline in their trade influence, consequently contributing to lower GDP growth rates compared to the global mean.
As a further step, we conducted a linear regression analysis to investigate the relationship between distinct levels of T T A and GDP growth, as depicted by the gray line in the right panel. Nevertheless, the overall goodness of fit was found to be unsatisfactory. Furthermore, to examine the impact of T T A on diverse nations, an EM sampling approach was employed to classify the aforementioned countries into two distinct categories. The first category encompassed nations with a production advantage (in red), including populous countries with labor force advantages such as CHN, VNM, and IND, as well as resource-rich nations typified by AUS, SAU, and CAN. The second category primarily consisted of conventional countries (in blue), exemplified by DEU, BGR, and POL, with relatively limited population and natural resource endowments, devoid of a particular outstanding production advantage. When conducting separate regressions for the two categories of nations, it was observed that both exhibited relatively similar slopes, implying that T T A exerted nearly identical effects on GDP growth. Nonetheless, a substantial discrepancy was noted in the intercepts of the two regression lines. It is conjectured that this dissimilarity may be attributed to the division of labor within the value chain of each country. Generally speaking, both labor force advantages and abundant natural resources have a positive and direct impact on GDP growth [35,36,37]. Overall, irrespective of the category, a robust positive correlation between GDP growth and T T A is evident; countries with higher T T A tend to exhibit higher economic growth.

5. Conclusions

In this paper, we first focus on the three most prevalent types of economic activities in countries. Our analysis of the economic evolution from 1995 to 2018 reveals that, for most countries, the share of traditional trade in the economy has remained relatively stable; this suggests a preliminary establishment of the international trade pattern, particularly in the domain of final consumer goods. Furthermore, as GVC trade and the globalization of production have gained prominence, we observe a gradual shift towards value chain trade, supplanting traditional trade in many cases. Yet, in the wake of the 2008 financial crisis and the emergence of anti-globalization sentiments, we have witnessed an escalation of external factors impacting trade dynamics; this has contributed to a relatively sluggish pace of development since 2012.
In addition, this paper introduces a trade ability index based on trade status to evaluate the trade patterns of individual countries. It combines this assessment with an analysis of the economic development levels of countries exhibiting varying trade capabilities and their corresponding evolution paths in economic activities. With our approach, one can easily distinguish how different kinds of countries develop their economy. What we have discovered is a significant correlation between economic growth and T T A . Countries with higher T T A tend to exhibit higher economic growth.
Based on our findings, it is evident that countries aiming for higher economic growth should focus on increasing their T T A . In the case of countries like China, which possess a considerable economic scale and a complete industrial structure, we propose the following policy recommendations to enhance T T A :
(1) The country must adhere to the innovation-driven development strategy. In the GVC division of labor system, technological advancement plays a pivotal role in determining a country’s position in GVC. In the agricultural sector, the government should provide increased guidance on agricultural technological innovation, aiming to expand and elevate the middle-to-high-end market of agriculture while promoting enhancements in the value chain position. In the industrial sector, the focus should be on developing the real economy; this entails boosting the independent innovation capabilities of industrial enterprises, particularly in the independent development of core technologies. This move is essential to break free from the “low-end lock-in” of GVC [38]. In the service sector, the country should accelerate the development of knowledge-intensive, modern, productive service sectors. By enhancing enterprise technological innovation capabilities, the service sector can expand towards the high-end of GVC. Moreover, it will also enhance the general demand for human capital, which is broadly shown to be a key factor in modern economic growth [29,39,40]. (2) The country needs to continue expanding international exchanges and cooperation, enhancing the openness of the economic system and strengthening involvement in GVC [41,42]. To achieve this, the country should further expand open areas, prioritize the establishment of open rules and systems, and attract foreign advanced brands and technologies to enter the domestic market while concurrently enhancing the global competitiveness of domestic brands; this will allow for the maximization of vast development prospects and upward mobility within the GVC framework, ultimately propelling the country toward the high-end of GVC. (3) The country is expected to actively engage in global governance and uphold the multilateral joint governance system for global trade. As a participant in economic globalization, the country bears the responsibility of upholding global trade liberalization. Faced with the challenges of slowing global economic growth and increasing trade protectionism, we should proactively contribute to sustaining the global free trade system by advocating for the establishment of a multilateral common governance framework for global trade; this will ultimately lead to the forging of a new global paradigm characterized by mutual benefit and win-win outcomes [43].
For further research, we suggest three improvement aspects: (1) Identifying specific sectors is crucial. In our current study, we assume that all sectors are homogeneous. However, it is evident that different sectors play distinct roles in global trade. For example, primary products like fossil fuels have a profound impact on the economy. (2) In this study, the primary focal point remains centered on the perspective of a nation’s aggregate economic output, rendering it notably susceptible to the influence of population size. In future investigations, a potential avenue for further exploration may involve constructing relationships using per capita GDP, which may potentially yield more robust and consistent conclusions. (3) Additionally, it is imperative to place greater emphasis on regionalized trade, which is gaining increasing significance in the global landscape.

Author Contributions

Data curation, C.W.; Methodology, C.W. and W.Z.; Writing—original draft, C.W. and B.L.; Writing—review and editing, C.W., W.Z. and B.L. All authors have read and agreed to the published version of the manuscript.

Funding

This research received no external funding.

Institutional Review Board Statement

Not applicable.

Informed Consent Statement

Not applicable.

Data Availability Statement

The data in this article can be obtained from the OECD website (https://www.oecd.org, accessed on 24 May 2022).

Conflicts of Interest

The authors declare no conflict of interest.

References

  1. Antràs, P.; De Gortari, A. On the geography of global value chains. Econometrica 2020, 88, 1553–1598. [Google Scholar] [CrossRef]
  2. Taglioni, D.; Winkler, D. Making Global Value Chains Work for Development; World Bank Publications: Washington, DC, USA, 2016; pp. 9–70. [Google Scholar]
  3. Baldwin, R.; Lopez-Gonzalez, J. Supply-chain trade: A portrait of global patterns and several testable hypotheses. World Econ. 2015, 38, 1682–1721. [Google Scholar] [CrossRef]
  4. Kogut, B. Designing Global Strategies: Comparative and Competitive Value-Added Chains. Sloan Manag. Rev. 1985, 26, 15–28. [Google Scholar] [CrossRef]
  5. Borin, A.; Mancini, M. Measuring What Matters in Global Value Chains and Value-Added Trade. World Bank Policy Research Working Paper. 2019. Available online: http://hdl.handle.net/10986/31533 (accessed on 6 September 2023).
  6. Antràs, P. Conceptual aspects of global value chains. World Bank Econ. Rev. 2020, 34, 551–574. [Google Scholar] [CrossRef]
  7. Johnson, R.C. Measuring global value chains. Annu. Rev. Econ. 2018, 10, 207–236. [Google Scholar] [CrossRef]
  8. Li, X.; Meng, B.; Wang, Z. Recent Patterns of Global Production and GVC Participation. Global Value Chain Development Report. 2019. Available online: https://eclass.aueb.gr/modules/document/file.php/DEOS287/GVC%20WTO%20labour.pdf#page=19 (accessed on 12 September 2023).
  9. McNerney, J.; Savoie, C.; Caravelli, F.; Carvalho, V.M.; Farmer, J.D. How production networks amplify economic growth. Proc. Natl. Acad. Sci. USA 2022, 119, e2106031118. [Google Scholar] [CrossRef]
  10. Hummels, D.; Ishii, J.; Yi, K.M. The nature and growth of vertical specialization in world trade. J. Int. Econ. 2001, 54, 75–96. [Google Scholar] [CrossRef]
  11. Huang, H.P.; Miao, Z.J.; Yuan, Y.; Li, S.Y. A Study on Global Value Chain of Producer Service Industry and the Level of China’s Participation. J. Manag. World 2020, 36, 82–97. [Google Scholar] [CrossRef]
  12. Koopman, R.; Powers, W.; Wang, Z.; Wei, S.J. Give Credit Where Credit is Due: Tracing Value Added in Global Production Chains; NBER: Cambridge, MA, USA, 2010. [Google Scholar] [CrossRef]
  13. TimmeP, M.P.; Erumban, A.A.; Los, B.; Stehrer, R.; De Vries, G.J. Slicing up global value chains. J. Econ. Perspect. 2014, 28, 99–118. [Google Scholar] [CrossRef]
  14. Antràs, P.; Chor, D.; Fally, T.; Hillberry, R. Measuring the upstreamness of production and trade flows. Am. Econ. Rev. 2012, 102, 412–416. [Google Scholar] [CrossRef]
  15. Antràs, P.; Chor, D. Organizing the global value chain. Econometrica 2013, 81, 2127–2204. [Google Scholar] [CrossRef]
  16. Chen, J.; Zhang, S.; Ma, X.; Zhao, X.; Song, Y.; Fan, Y.; Yu, Y. Global Value Chains Embedding and Carbon Productivity of China’s Manufacturing Industry: Direct Influence, Adjustment Effect, and Heterogeneity Analysis. Sustainability 2023, 15, 13272. [Google Scholar] [CrossRef]
  17. Miller, R.E.; Temurshoev, U. Output upstreamness and input downstreamness of industries/countries in world production. Int. Reg. Sci. Rev. 2017, 40, 443–475. [Google Scholar] [CrossRef]
  18. Kee, H.L.; Tang, H. Domestic value added in exports: Theory and firm evidence from China. Am. Econ. Rev. 2016, 106, 1402–1436. [Google Scholar] [CrossRef]
  19. Upward, R.; Wang, Z.; Zheng, J. Weighing China’s export basket: The domestic content and technology intensity of Chinese exports. J. Comp. Econ. 2013, 41, 527–543. [Google Scholar] [CrossRef]
  20. Johnson, R.C.; Noguera, G. Accounting for intermediates: Production sharing and trade in value added. J. Int. Econ. 2012, 86, 224–236. [Google Scholar] [CrossRef]
  21. Gong, J.; Yin, Z. A Study of International Division of Labor Status and Competitiveness of China’s Service Trade Exports under the Value-Added Accounting System: An Analysis Based on the Upstream Degree Index and NRCA Index by the WIOD in 2016. Int. Bus. 2018, 5, 73–84. [Google Scholar] [CrossRef]
  22. Koopman, R.; Wang, Z.; Wei, S.J. Tracing value-added and double counting in gross exports. Am. Econ. Rev. 2014, 104, 459–494. [Google Scholar] [CrossRef]
  23. Wang, Z.; Wei, S.J.; Yu, X.; Zhu, K. Characterizing Global Value Chains: Production Length and Upstreamness; NBER: Cambridge, MA, USA, 2017. [Google Scholar]
  24. Wang, Z.; Wei, S.J.; Yu, X.; Zhu, K. Measures of Participation in Global Value Chains and Global Business Cycles; NBER: Cambridge, MA, USA, 2017. [Google Scholar]
  25. Leontief, W.W. Quantitative input and output relations in the economic systems of the United States. Rev. Econ. Stat. 1936, 18, 105–125. [Google Scholar] [CrossRef]
  26. Schteingart, D.; Santarcángelo, J.; Porta, F. Global value chains: Transformations and economic development possibilities for the periphery since the mid-1990s. Apuntes Rev. Cienc. Soc. 2017, 44, 83–122. [Google Scholar] [CrossRef]
  27. Luo, Q.; Zhang, D.; Wang, H. Digital Economy, Industrial Structure, and Regional Trade Dependence: Mechanism Analysis Based on Chinese City Data. Sustainability 2023, 15, 13055. [Google Scholar] [CrossRef]
  28. Azarnert, L.V. Agricultural exports, tariffs and growth. Open Econ. Rev. 2014, 25, 797–807. [Google Scholar] [CrossRef]
  29. Feng, L.; Li, Z.; Swenson, D.L. Trade policy uncertainty and exports: Evidence from China’s WTO accession. J. Int. Econ. 2017, 106, 20–36. [Google Scholar] [CrossRef]
  30. Azarnert, L.V. Trade, Luxury Goods, And A Growth-Enhancing Tariff. Macroecon. Dyn. 2018, 22, 1462–1474. [Google Scholar] [CrossRef]
  31. Lardy, N.R. China: Toward a consumption-driven growth path. In Seeking Changes: The Economic Development in Contemporary China; Zhou, Y., Ed.; World Scientific: Singapore, 2016; pp. 85–111. [Google Scholar]
  32. Chen, F.; Sun, W. How Does Carbon Emissions Efficiency Affect OFDI? Evidence from Chinese Listed Companies. Sustainability 2023, 15, 13145. [Google Scholar] [CrossRef]
  33. Hanson, G.H. The rise of middle kingdoms: Emerging economies in global trade. J. Econ. Perspect. 2012, 26, 41–64. [Google Scholar] [CrossRef]
  34. Chen, X.; Yu, J. Study on Policy Promoting International Industrial Relocation. Econ. Manag. 2011, 25, 5–9. [Google Scholar]
  35. Khan, S.A.R.; Ponce, P.; Yu, Z.; Ponce, K. Investigating economic growth and natural resource dependence: An asymmetric approach in developed and developing economies. Resour. Policy 2022, 77, 102672. [Google Scholar] [CrossRef]
  36. Brunnschweiler, C.N. Cursing the blessings? Natural resource abundance, institutions, and economic growth. World Dev. 2008, 36, 399–419. [Google Scholar] [CrossRef]
  37. Costantini, V.; Monni, S. Environment, human development and economic growth. Ecol. Econ. 2008, 64, 867–880. [Google Scholar] [CrossRef]
  38. Li, Y.; Sun, H.; Huang, J.; Huang, Q. Low-end lock-in of Chinese equipment manufacturing industry and the global value chain. Sustainability 2020, 12, 2981. [Google Scholar] [CrossRef]
  39. Galor, O.; Mountford, A. Trading population for productivity: Theory and evidence. Rev. Econ. Stud. 2008, 75, 1143–1179. [Google Scholar] [CrossRef] [PubMed]
  40. Azarnert, L.V. Transportation costs and the great divergence. Macroecon. Dyn. 2016, 20, 214–228. [Google Scholar] [CrossRef]
  41. Pietrobelli, C.; Rabellotti, R. Global value chains meet innovation systems: Are there learning opportunities for developing countries. World Dev. 2011, 39, 1261–1269. [Google Scholar] [CrossRef]
  42. Lema, R.; Rabellotti, R.; Gehl Sampath, P. Innovation trajectories in developing countries: Co-evolution of global value chains and innovation systems. Eur. J. Dev. Res. 2018, 30, 345–363. [Google Scholar] [CrossRef]
  43. Siddiqui, K. Trade liberalization and economic development: A critical review. Int. J. Political Econ. 2015, 44, 228–247. [Google Scholar] [CrossRef]
Figure 1. Input–output table structure.
Sustainability 15 15528 g001
Figure 2. Total global GDP change and different trade ratio change: (a) this panel represents the total global GDP from 1995 to 2021, with the currency unit in current US dollars; (b) this panel illustrates the variations in different trade ratios from 1995 to 2018.
Sustainability 15 15528 g002
Figure 3. Country evolves trends of different activities: (a) this panel is all 67 economies’ ratio of the economy composed by domestic consumption, traditional trade, and GVC trade from 1995 to 2018, and we have highlighted a selection of prominently featured countries in the figure, while the remaining economies are depicted in a lighter shade; (b) CHN evolve trends of different activities; (c) USA evolve trends of different activities; (d) VNM evolve trends of different activities; and (e) DEU evolve trends of different activities.
Sustainability 15 15528 g003aSustainability 15 15528 g003b
Figure 4. Country evolve cluster. In the figure, colors denote different economic growth patterns. Countries of the same color exhibit a high similarity in their trade activities.
Sustainability 15 15528 g004
Figure 5. Total production length of countries, for value chain trade, whether it’s G V C _ S or G V C _ C , it can be further disaggregated into three components: domestic embeddedding length ( d ), export times ( e ), and foreign embeddedding length ( f ). What’ more, according to the previous definition of G V C _ S , its export times ( e ) always equals 1. (a) the forward embedding length of CHN and USA of 1995; (b) the forward embedding length of CHN and USA of 2018; (c) the backward embedding length of CHN and USA of 1995; (d) the backward embedding length of CHN and USA of 2018. Regarding the aforementioned variable definitions, please refer to format (5)–(9).
Sustainability 15 15528 g005
Figure 6. Country’s T A radar.
Sustainability 15 15528 g006
Figure 7. Country’s T T A change.
Sustainability 15 15528 g007
Figure 8. Country’s T T A change: (a) this panel indicates the relationship between T T A and GDP growth; the x-axis is the log ( T T A ), and the y-axis is log (GDP); (b) this panel implies the direct change between T T A and GDP; the x-axis is the country mean T T A from 1995 to 2018 and the y-axis is the log (GDP_growth), while GDP_growth = GDP_2018 − GDP_1995.
Sustainability 15 15528 g008
Disclaimer/Publisher’s Note: The statements, opinions and data contained in all publications are solely those of the individual author(s) and contributor(s) and not of MDPI and/or the editor(s). MDPI and/or the editor(s) disclaim responsibility for any injury to people or property resulting from any ideas, methods, instructions or products referred to in the content.

