Article

Economic Sustainability of the Milk and Dairy Supply Chain: Evidence from Serbia

1
Faculty of Agriculture, University of Novi Sad, 21000 Novi Sad, Serbia
2
Faculty of Economics in Subotica, University of Novi Sad, 24000 Subotica, Serbia
*
Author to whom correspondence should be addressed.
Sustainability 2023, 15(21), 15234; https://doi.org/10.3390/su152115234
Submission received: 12 September 2023 / Revised: 17 October 2023 / Accepted: 23 October 2023 / Published: 24 October 2023
(This article belongs to the Special Issue Sustainable Agricultural Economy)

Abstract

:
The sector of milk and dairy products in Serbia along the entire supply chain has been under significant challenges in recent years, especially in current crises. In this direction, this research looked at the supply chain of milk and dairy products by analyzing the primary production, the situation in the processing industry, and the international market’s competitiveness. Indicators of technical efficiency were used to analyze the situation on agricultural farms, while for the processing industry, the impact of various variables on profitability was evaluated using panel models. Furthermore, an examination of these products’ standings in the global market was conducted by assessing their revealed comparative advantages and integration index. The results of the research determined the level of technical efficiency of the producer, while the statistically significant influence of certain variables on profitability was determined within the processing industry. Additionally, the analysis showed modestly revealed comparative advantages in the international market but good integration with the international market. Finally, the sustainability of the milk and dairy products supply chain is highly questionable in crises, which will be a challenge for producers and policymakers.

1. Introduction

Agricultural production, as the primary sector, represents an activity that occupies a significant place in the total value of the Gross Domestic Products (GDP) of the Republic of Serbia. Namely, the average share of agricultural production in the total value of the GDP of the Republic of Serbia, for the period of 2011–2021, is about 7% [1]. In addition to the above, agricultural production has a significant impact on the food industry by providing raw materials for further processing in the food production process. In the aggregate value of agricultural production observed between 2011 and 2021, crop production takes the lead, contributing approximately 67.5%. Arable production is also noteworthy, accounting for over 50% of the total value of agricultural production. In contrast, the value attributed to livestock production constitutes only around 30% of the total agricultural production value, with the remaining 2.5% representing the value of agricultural services [1]. This relationship between different lines of production indicates the prevailing extensive nature of agricultural production in the Republic of Serbia, which further indicates an unsatisfactory vertical connection between crop and livestock production but also an insufficiently developed sector of processing agricultural products. In this regard, the developed countries of the world pay special attention to livestock production, which represents the basis of the development of the agricultural sector and the economic activity of a country as a whole. When it comes to livestock production in the Republic of Serbia, cattle breeding stands out to the greatest extent, which accounts for about 40% of the total realized value of livestock production [1]. Farms where cattle are raised are mainly oriented towards beef production and/or milk production.
Specifically, out of 445,414 registered agricultural holdings (RPG) in the Republic of Serbia in 2021, 21,141 RPGs were oriented towards dairy cattle breeding. The largest number of producers (80%) are located in the territory of the NUTS1 region Serbia-South, while about 20% are located in the territory of the NUTS1 region Serbia-North. The average age of owners of farms specializing in dairy cattle breeding is 56 years, while the majority of farms (63.1%) have between one and two members. The average economic size of the observed farms amounts to EUR 31,216.8, which is almost twice as much as the average value of EUR 12,137.3 at the level of the entire agricultural production. Farms specializing in milk production have an average of 8.8 ha and 18.1 dairy cows, which amounts to an average of 1.6 dairy cows/ha (edited by the author based on data from the Ministry of Agriculture, Forestry, and Water Management). Observing agricultural and food companies in the Republic of Serbia, out of the total number of 7819 companies that operated in 2021, only 393 companies were oriented towards the production of milk and its derivatives [2].
In the region of Šumadija and Western Serbia, almost half of the milk is produced, while Vojvodina is the next region in terms of production volume, accounting for nearly a third of production, followed by Southern and Eastern Serbia, with approximately 18%. Cow’s milk has the most significant share of 96.7%, while goat’s and sheep’s milk have marginal importance with shares of 2.2% and 1.1%, respectively [3].
Sustainability of the food supply chain of milk in Serbia is particularly interesting due to recent events. At the end of 2022, Serbia experienced a serious milk shortage which resulted in higher import from European Union (EU) countries. Consequently, the Serbian government decided to ban the export of milk [4] and to set a maximum price for milk [5]. If we take into account the increase in input prices, these circumstances have put producers in a very unfavorable position. The situation culminated in a farmer protest at the beginning of 2023. About 1000 dairy farmers blocked the road, spilling milk and demanding that the government introduce immediate measures to rescue the dairy industry. They also demanded a ban on milk imports and higher premiums and subsidies [6]. These events are the main motive of the research. Unfortunately, there are still no adequate data for this period, but it is certainly interesting to analyze the sustainability of the milk supply chain in Serbia, in order to potentially reveal shortcomings and give recommendations to policy makers, which is the main goal of this paper.
The structure of this work is as follows: Following the introduction, a concise summary of the literature and the methodology employed is provided. Subsequently, the results and discussions are categorized into three distinct levels. The first level deals with the production of milk on the farm, where the technical efficiency of milk producers is examined. The second level examines the profitability of milk processing companies. The competitiveness of Serbian milk and dairy products are analyzed at the third level. In this way, the entire milk supply chain and the competitiveness in the international market are included in the research. In the end, a conclusion and recommendations for policymakers are given.

2. Literature Review

Within the large number of scientific publications aimed at evaluating the technical efficiency of agricultural farms, two basic methodological approaches are distinguished: non-parametric and parametric. The non-parametric method of evaluating technical efficiency is based on mathematical programming, where the data envelopment analysis (DEA) stands out. On the other hand, the parametric approach is based on econometric modeling, where the stochastic frontier analysis (SFA) is most often used.
When it comes to the assessment of the technical efficiency of farms specialized in milk production, according to the meta-analysis of scientific publications presented in Mareth et al. [7], 51.5% of distributions of technical efficiency were assessed by parametric methods. The highest rating of technical efficiency was recorded among producers from the territory of Asia (90.2%), while the average rating of technical efficiency from the territory of Western Europe and Oceania was at the level of 84.2%. The average rating of technical efficiency of milk producers from the territory of Eastern Europe was at the level of 74.5%.
Similarly, Moreira Lopez and Bravo-Uerta [8] found that the parametric approach was used in 63.8% of cases when assessing technical efficiency. The largest number of works, which is also the case with all other meta-analyses, refers to Western Europe. Similar results were presented in the works of Gorton and Davidova [9], Thiam et al. [10], Bravo-Uerta et al. [11], and others. In addition to the above, it is important to point out that in more recent works, the assessment of technical efficiency based on panel data has been particularly highlighted.
The assessment of technical efficiency in the dairy cattle sector, using the SFA method on the example of EU countries, is presented in the paper by Čechura and Krouova [12]. High technical efficiency scores were found, suggesting that the European milk processing industry as a whole is competitive, while companies are extremely efficient. In contrast to the milk processing sector, an assessment of the technical efficiency of agricultural farms specializing in milk production in the European Union using the SFA method revealed that there is room for enhancing economic outcomes through farm size expansion. In addition to the above, subsidies were singled out as a limiting factor from the aspect of technical efficiency [13].
When it comes to the Republic of Serbia, the evaluation of the technical efficiency of the entire agricultural sector using the SFA method is presented in the paper by the authors Đokić et al. [14]. A significant deviation was found in terms of achieved technical efficiency in relation to EU countries, which can also be transferred to the milk production sector. The observed differences primarily arise from the production technology used, which can be observed from the aspect of milk production through the equipment of the farms and the characteristics of the breeds of exploited dairy cows.
Due to the fact that profitability is a measure of the success of every company, many authors have used different methods in order to evaluate profitability and factors affecting profitability. The results of this research differ based on the differences in the development of the observed countries, the observed industries, and the companies included in the research. A comparative analysis of the profitability of companies engaged in production and companies engaged in milk processing in the Republic of Serbia was conducted by Jakšić et al. [15]. Observed companies were analyzed in the period from 2010 to 2013. The analysis found that there are significant differences in the profitability of the observed sectors, in favor of companies in the processing sector. Based on the observation of individual profitability indicators, it was determined that there are significant differences in the rate of return on assets, profit margin, and asset turnover ratio between production companies and milk processing companies, while the differences in the rate of return on capital were minor.
Zdráhal et al. [16] analyzed the factors affecting the profitability of the dairy industry in Visegrad group countries (Czech Republic, Slovakia, Poland, and Hungary) in the period of 2006–2014. The results of descriptive statistics showed that the profitability of the observed companies was negative and amounted to −1.4%. The authors then observed how sector-wide and country-specific factors affect profitability and came to the conclusion that import penetration ratio, GDP, and market concentration stand out as key factors affecting profitability. The impact of different indicators of working capital management on the profitability of milk processing companies from Poland was investigated by Gołaś [17]. The author conducted research on 98 companies that operated in the period from 2007 to 2016 and in one of the formed models, came to the conclusion that the number of days of receivable collection has a statistically significant and negative impact on profitability.
Milošević-Avdalović [18] analyzed the factors affecting the profitability of dairy industry companies from the Republic of Serbia. The paper analyzed four companies in the period from 2008 to 2016. The author came to the conclusion that company size has a positive statistically significant impact on profitability, indebtedness has a significant negative impact on profitability, and book value per share also has a significant negative impact on the profitability of the observed companies. Additionally, Dakić et al. [19] analyzed the profitability of companies from the food sector of the Republic of Serbia. The analysis included 657 companies from the meat, fruit, and vegetable processing industry and the processing of milk and dairy products for the period from 2007 to 2015. The results of the panel analysis confirmed that the profitability of companies from all three industries has a positive and statistically significant influence on sales growth. The current liquidity ratio has a positive and statistically significant impact on the profitability of companies engaged in the production and processing of meat, while the size, indebtedness, and capital turnover ratio have a negative statistically significant impact on the profitability of these companies. The company’s size and the capital turnover ratio exert a statistically significant and adverse influence on the profitability of farms involved in fruit and vegetable processing. The current liquidity ratio has a positive, statistically significant influence on the profitability of companies engaged in the production and processing of milk, and the debt ratio is negative.
When it comes to the analysis of the competitiveness of milk and dairy products from Serbia, numerous authors have tried to determine the position of these products in the international market as part of the competitiveness analysis. For example, the authors Birovljev, Matkovski, and Ćetković [20] analyzed the competitiveness of agri-food products of Serbia in the market of the countries of the region and concluded that Serbia has revealed comparative advantages for milk and dairy products in the regional market and that these products are well integrated within the regional market. If the comparative advantages of Serbia and the remaining countries of the Western Balkan region are compared, Serbia is in the most favorable position [21], but with a modest indicator of revealed comparative advantages and a downward trend [22,23]. Additionally, Serbia is the only country from the Western Balkan region that is self-sufficient in milk production [24]. Despite the not so enviable position when it comes to comparative advantages, the results of the analysis of the character of trade indicate the significant integration of this sector of Serbia with the international market—the intra-industry character of trade [21].

3. Material and Methods

3.1. Farm Level Analysis

The methodology for estimating the stochastic frontier production function model at the farm level, where the functional form of the model is based on the Cobb–Douglas production function, was originally introduced in the works of Aigner et al. [25] and subsequently elaborated upon by Meeusen and van den Broeck [26]. In both of these works, significant emphasis was placed on the importance of stochastic factors that can influence the variability of the actual output. Hence, the overall expression for the stochastic frontier production function can be depicted as follows:
ln y i = β 0 + n β n ln x n i + ε i
In the model defined in this way, y i and x n i represent the realized output, that is, the used input for observation unit i, while β 0 and β n represent regression coefficients that must be evaluated and are common to all observation units. However, ε i denotes the composite random error within the model, so it holds that ε i = v i u i .
The first component ( v i ) includes all those stochastic factors that are outside the control of producers, follows a normal distribution, and has a homoscedastic variance. The u i component represents a one-sided, asymmetric component that includes the influence of all those factors that are under the control of producers and have an impact on the output. In other words, the component u i represents a measure of technical inefficiency.
The justification of evaluating the model, using the stochastic frontier analysis, is simply tested by examining the asymmetry of the composite random error ε i . If the composite error ε i is symmetric, it holds that u i = 0, which means that technical inefficiency is not present. Conversely, when u i > 0, the composite random error ε i is asymmetric, which clearly indicates the presence of technical inefficiency.
In the meantime, the estimation methodology of the stochastic frontier production function model has been significantly improved. A significant advance was provided by the introduction of a methodology for estimating models based on panel data [27]. Also, the separate assessment of the component that includes heterogeneity between observation units, as well as the separate assessment of persistent and residual technical efficiency, provides an assessment of technical efficiency that is less biased compared to older models.
In accordance with the above, the Kumbhakar, Lien, and Hardaker [28] model is structured as follows:
y i t = α 0 + n β n ln x n i t + μ i + v i t η i u i t
In the mentioned model, the composite error consists of up to four components, each representing distinct elements: heterogeneity between observation units ( μ i ), random effects ( v i t ) , persistent or time-invariant technical inefficiency ( η i ), and residual or time-variant technical inefficiency ( u i t ).
With the model defined in this way, it becomes feasible to estimate the time-varying technical inefficiency for period t, independently of the technical inefficiency for period t − 1. Moreover, this model specifically assesses time-invariant technical inefficiency which includes long-term constraints that are under the control of producers.
The specified stochastic marginal production function model can be evaluated using the maximum credibility method, which implies the prior introduction of assumptions related to the distribution of the model’s random error components [29]. In accordance with the above, the centered model has the following form:
y i t = α 0 * + n β n ln x n i t + α i + ε i t
So, the following applies: α 0 * = α 0 E η i E ( u i t ) , α i = μ i η i + E η i , and i  ε i t = v i t u i t + E ( u i t ) .
Parameters α i and ε i t possess a mean value of zero and homoscedastic variance, allowing for the evaluation of the entire model through three sequential steps.
In the initial step, when employing the standard procedure inherent in panel regression analysis, whether with fixed or random individual effects, it is essential to estimate the model’s unknown regression coefficients denoted as β n s . Furthermore, this initial assessment of the model yields the estimated values for α i and ε i t .
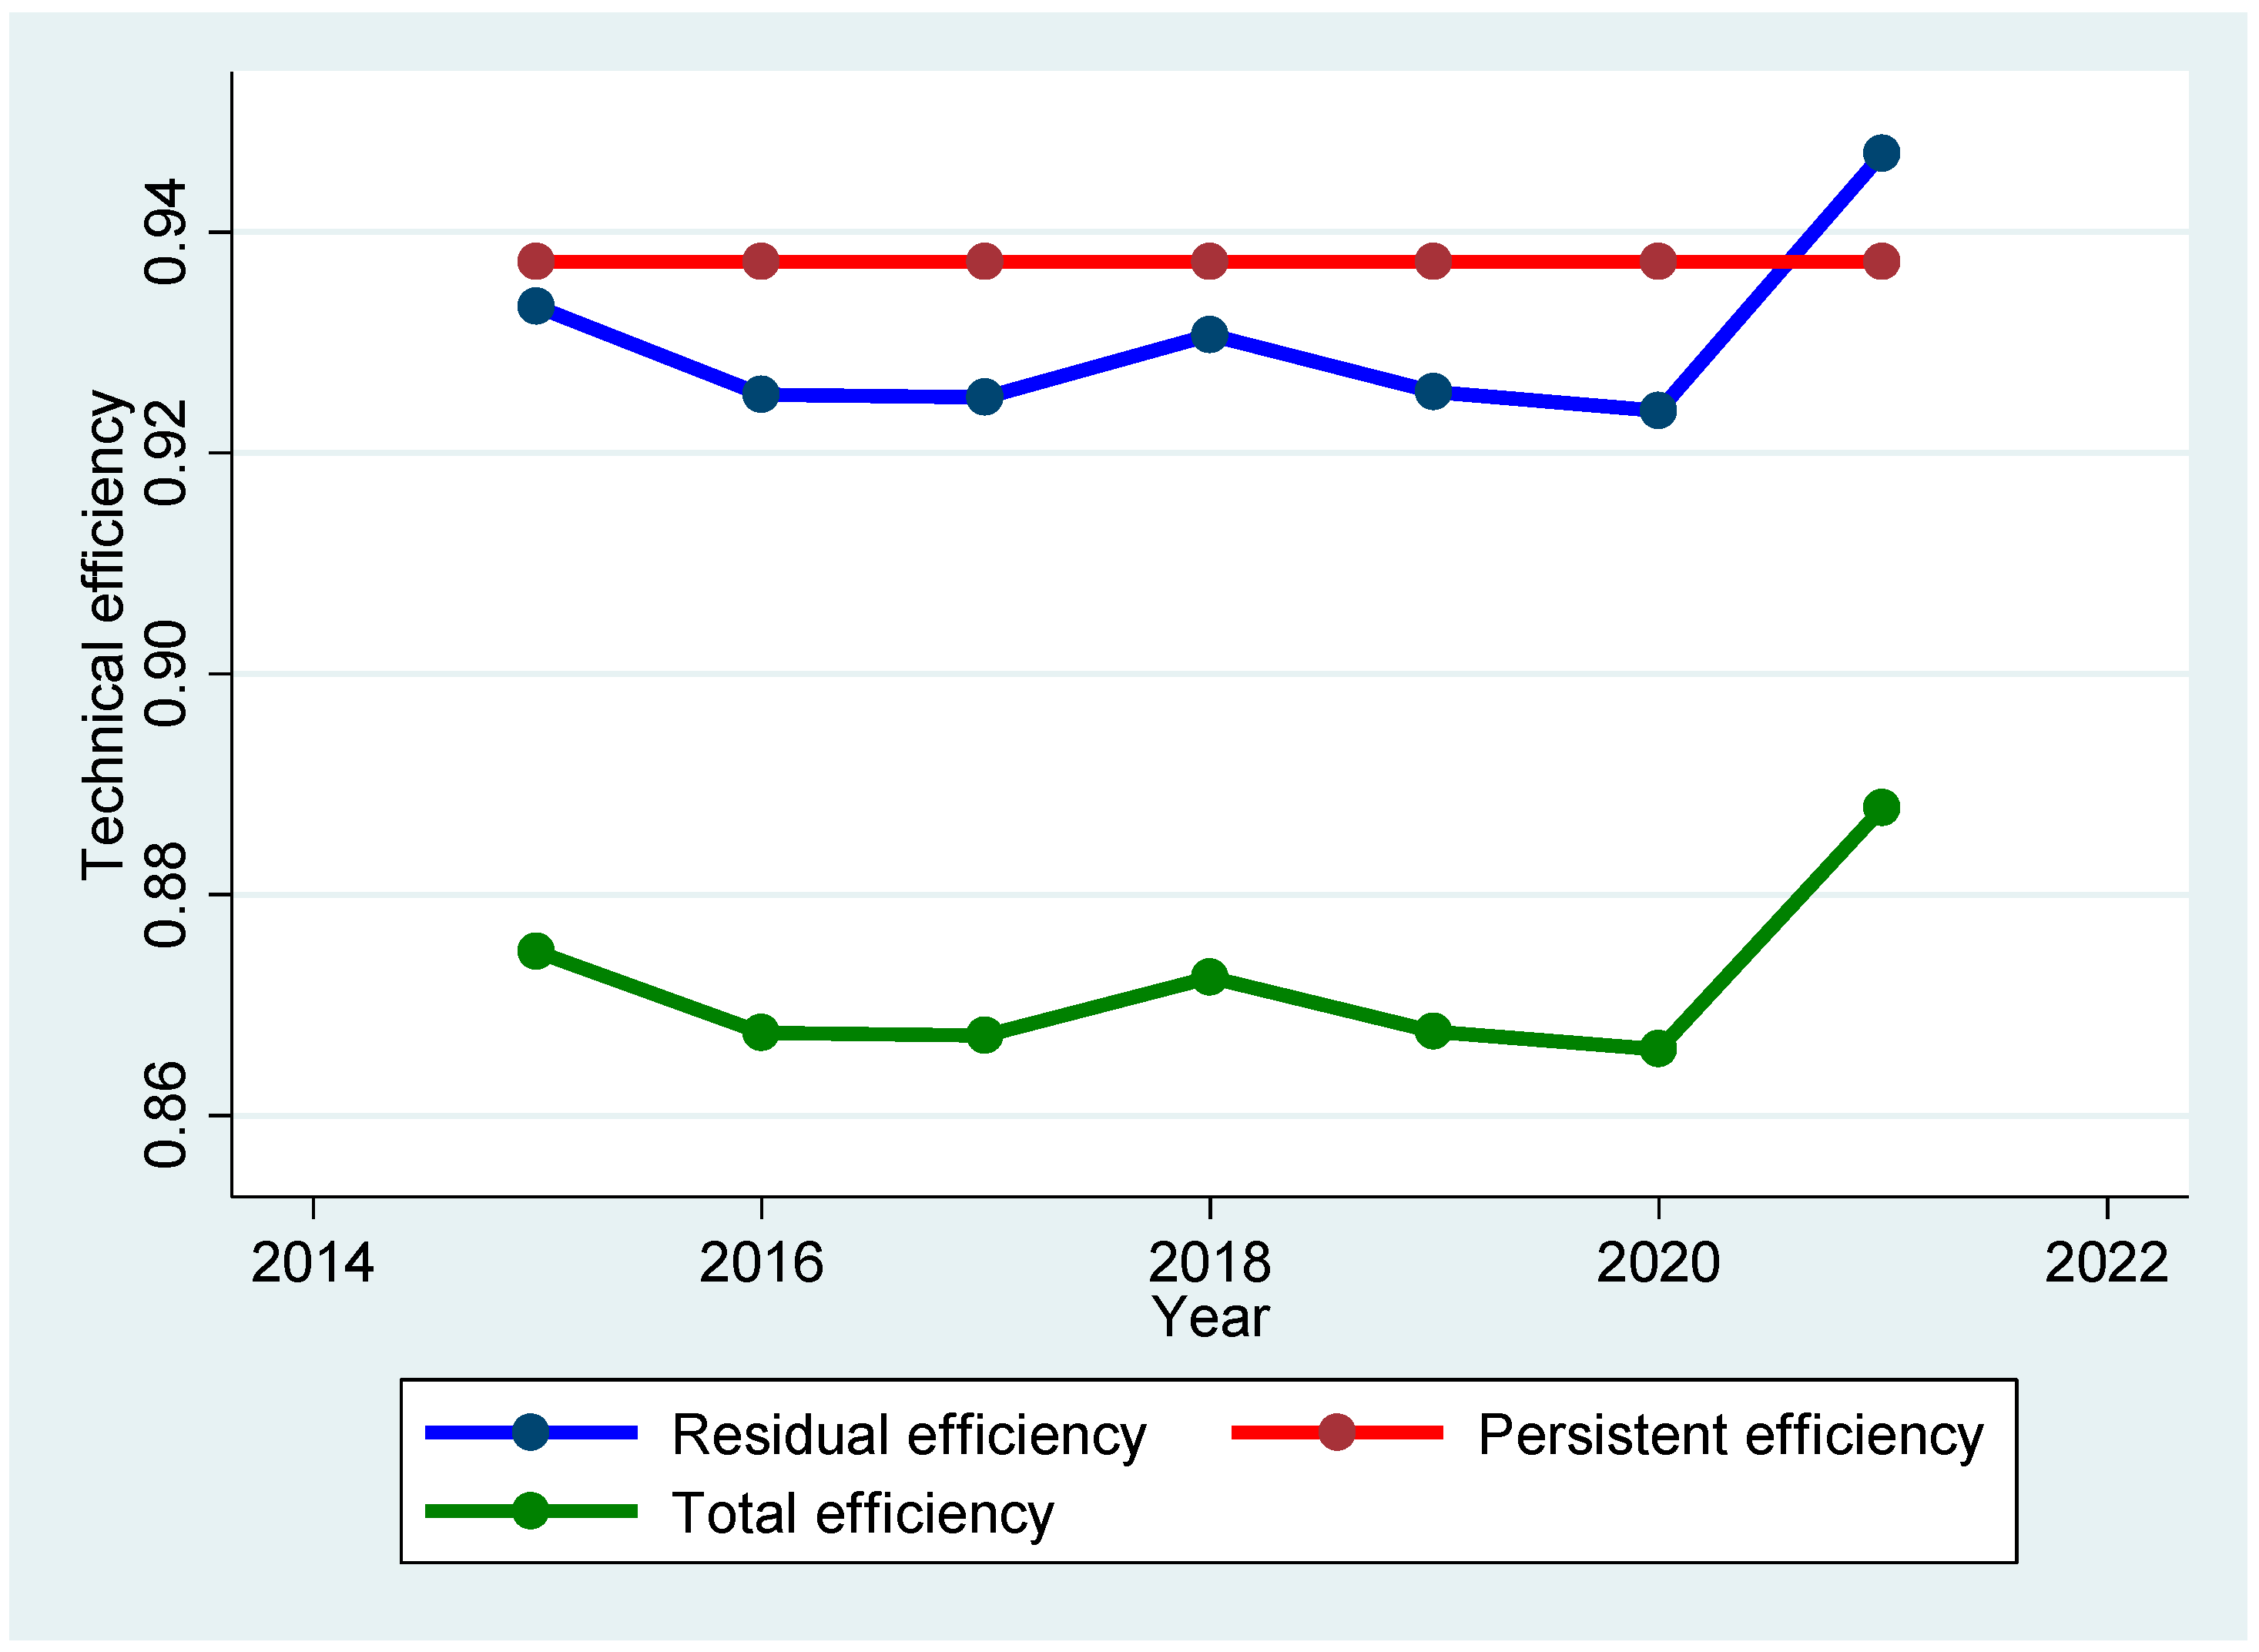
During the second step, the evaluation of time-varying (residual) technical inefficiency u i t is performed. Previously, the assessment values for ε i t , which can be expressed as ε i t = v i t u i t + E ( u i t ) , have been used. It is worth reminding that v i t follows a normal and u i t a half-normal distribution. For the expected mean value of the residual technical inefficiency u i t , the following relationship holds: E u i t = 2 / π σ u . The rating of residual technical efficiency in the RTE designation is obtained as follows: R T E i t = e x p u ^ i t .
In the third step, the time-invariant (persistent) technical inefficiency η i is evaluated using a similar procedure as in the second step.
This evaluation relies on the parameter values α i obtained in the first step. It is assumed that μ i follows a normal distribution and η i follows a half-normal distribution, with the expected mean value for η i given by E η i = 2 / π σ η . The evaluation of persistent technical efficiency, now denoted as PTE, is conducted as follows: P T E i = e x p η ^ i . Ultimately, the comprehensive technical efficiency rating is derived by multiplying the residual and persistent technical efficiencies (OTE = RTE × PTE).
In addition to the above, it is crucial to highlight that during the second and third phases of model evaluation, there is the option to incorporate the assumption of a non-zero mean value for both persistent and residual technical inefficiencies. This implies that, using the observed model, we can explore how additional explanatory variables might impact the attained technical efficiency.
When evaluating the Kumbhakar, Lien, and Hardaker [28] stochastic frontier production function model, in order to calculate the technical efficiency of farms specialized in milk production, the FADN sample data were used as the basic data source. Specifically, 104 registered agricultural farms were observed for the period from 2015 to 2021. The criterion according to which farms were selected for analysis is the valid production subtype (milk production subtype) at the end of the accounting year.
In accordance with the previously explained evaluation methodology of the Kumbhakar, Lien, and Hardaker model [28], in order to evaluate the technical efficiency of the observed farms, variables representing the realized output and used inputs were used. Therefore, as a dependent variable (output), a variable representing the total realized value of agricultural production expressed in EUR/LSU was used. On the other hand, as independent variables (inputs), the following variables were used: labor (GJR/LSU) in the label lnLabour, value of capital (EUR/LSU) in the label lnCapital, used agricultural land (ha/LSU) in the label lnUAA, the value of variable costs (EUR/LSU) in the label lnInput, and time (observation years) in the label time. In order to avoid harmful multicollinearity, the value of owned land is excluded from the value of capital because the model includes a variable related to used land.
When evaluating the impact of received subsidies on the achieved technical efficiency, a variable was used that is expressed as a share of current subsidies in total revenue (%), in the Direct_Payments tag, where revenue is defined as the difference between the total value of assets and liabilities.
The same and similar variables were used in numerous publications aimed at evaluating the technical efficiency of dairy farms using the SFA model [30,31,32,33,34,35,36,37,38,39,40,41,42].

3.2. Analysis of Dairy Processors

In order to evaluate factors affecting the profitability of companies engaged in the production and processing of milk in the Republic of Serbia, a sample of 102 companies that operated in the period of 2015–2021 was taken. The data for this analysis were provided from the Serbian Business Registers Agency [2]. In order to evaluate the factors affecting the profitability of agricultural enterprises engaged in the production of milk and dairy products, a panel regression model was applied.
The most commonly used panel data models are linear models, which represent a kind of combination of comparative data and time series. In its general form, a panel data regression model can be displayed using the following function:
y i t = β 1 i t + k = 2 K β k i t x k i t + u i t , i = 1 , , N ; t = 1 , , T ; k = 1 , , K
where y i t is the value of the dependent variable for the ith unit of observation in period t; x k i t is the value of the k independent variable for the i unit of observation in period t; β k i t is the regression parameters, which in the general form of a panel data model are variable by observation units and by time periods; u i t is the random error, which has an arithmetic mean equal to one and a constant common variance for each i and t.
In order to examine the presence of multicollinearity in the regression model, VIF and TOL values were calculated for the used independent variables. The absence of harmful multicollinearity can be considered if the values of the VIF indicator are less than the reference value 5, that is, if the values of the TOL indicator are greater than the reference value 0.1. Before evaluating the final specification of the model, a series of tests was conducted to verify the basic assumptions for the application of panel regression models, i.e., homoscedasticity, presence of autocorrelation, panel dependence, and presence of unit root were tested. To test heteroskedasticity, the Breusch–Pagan/Cook–Weisberg test and the modified Wald test were applied. These tests start from the null hypothesis that all variances are equal, against the alternative hypothesis that the variances are not equal, i.e., that they are heteroskedastic. The Wooldridge test was performed in order to check the presence of autocorrelation; the null hypothesis of this test implies that there is no first-order autocorrelation. The Pesaran CD dependence test was employed to assess panel dependence, while the Levin–Lin–Chu test was utilized to examine the presence of a unit root, ensuring the stationarity of the series.
In accordance with the previous review of the literature and the panel’s methodology, the following variables were selected in order to evaluate the factors affecting profitability: return on assets—ROA (net income/average total assets)—was considered as the dependent variable, and liquidity—LIQ (current assets/short-term liabilities), financial leverage—LEV (total liabilities/equity), debt ratio—DEBT (total liabilities/total assets), average number of days of receivables—ANDR (365/customer turnover ratio), total asset turnover ratio—TOAT (sales revenue/average business assets), GDP, and CPI were considered as the independent variables.
A panel regression model of the following form was estimated for the selected variables:
R O A i t = β i t + β 1 L I Q + β 2 L E V + β 3 D E B T + β 4 A N D R + β 5 T O A T + β 6 G D P + β 7 C P I + + u i t
where i is the label for each company (i = 1, 2, 3, …, n), and t is the label for each year (t = 1, 2, 3, …, 7).

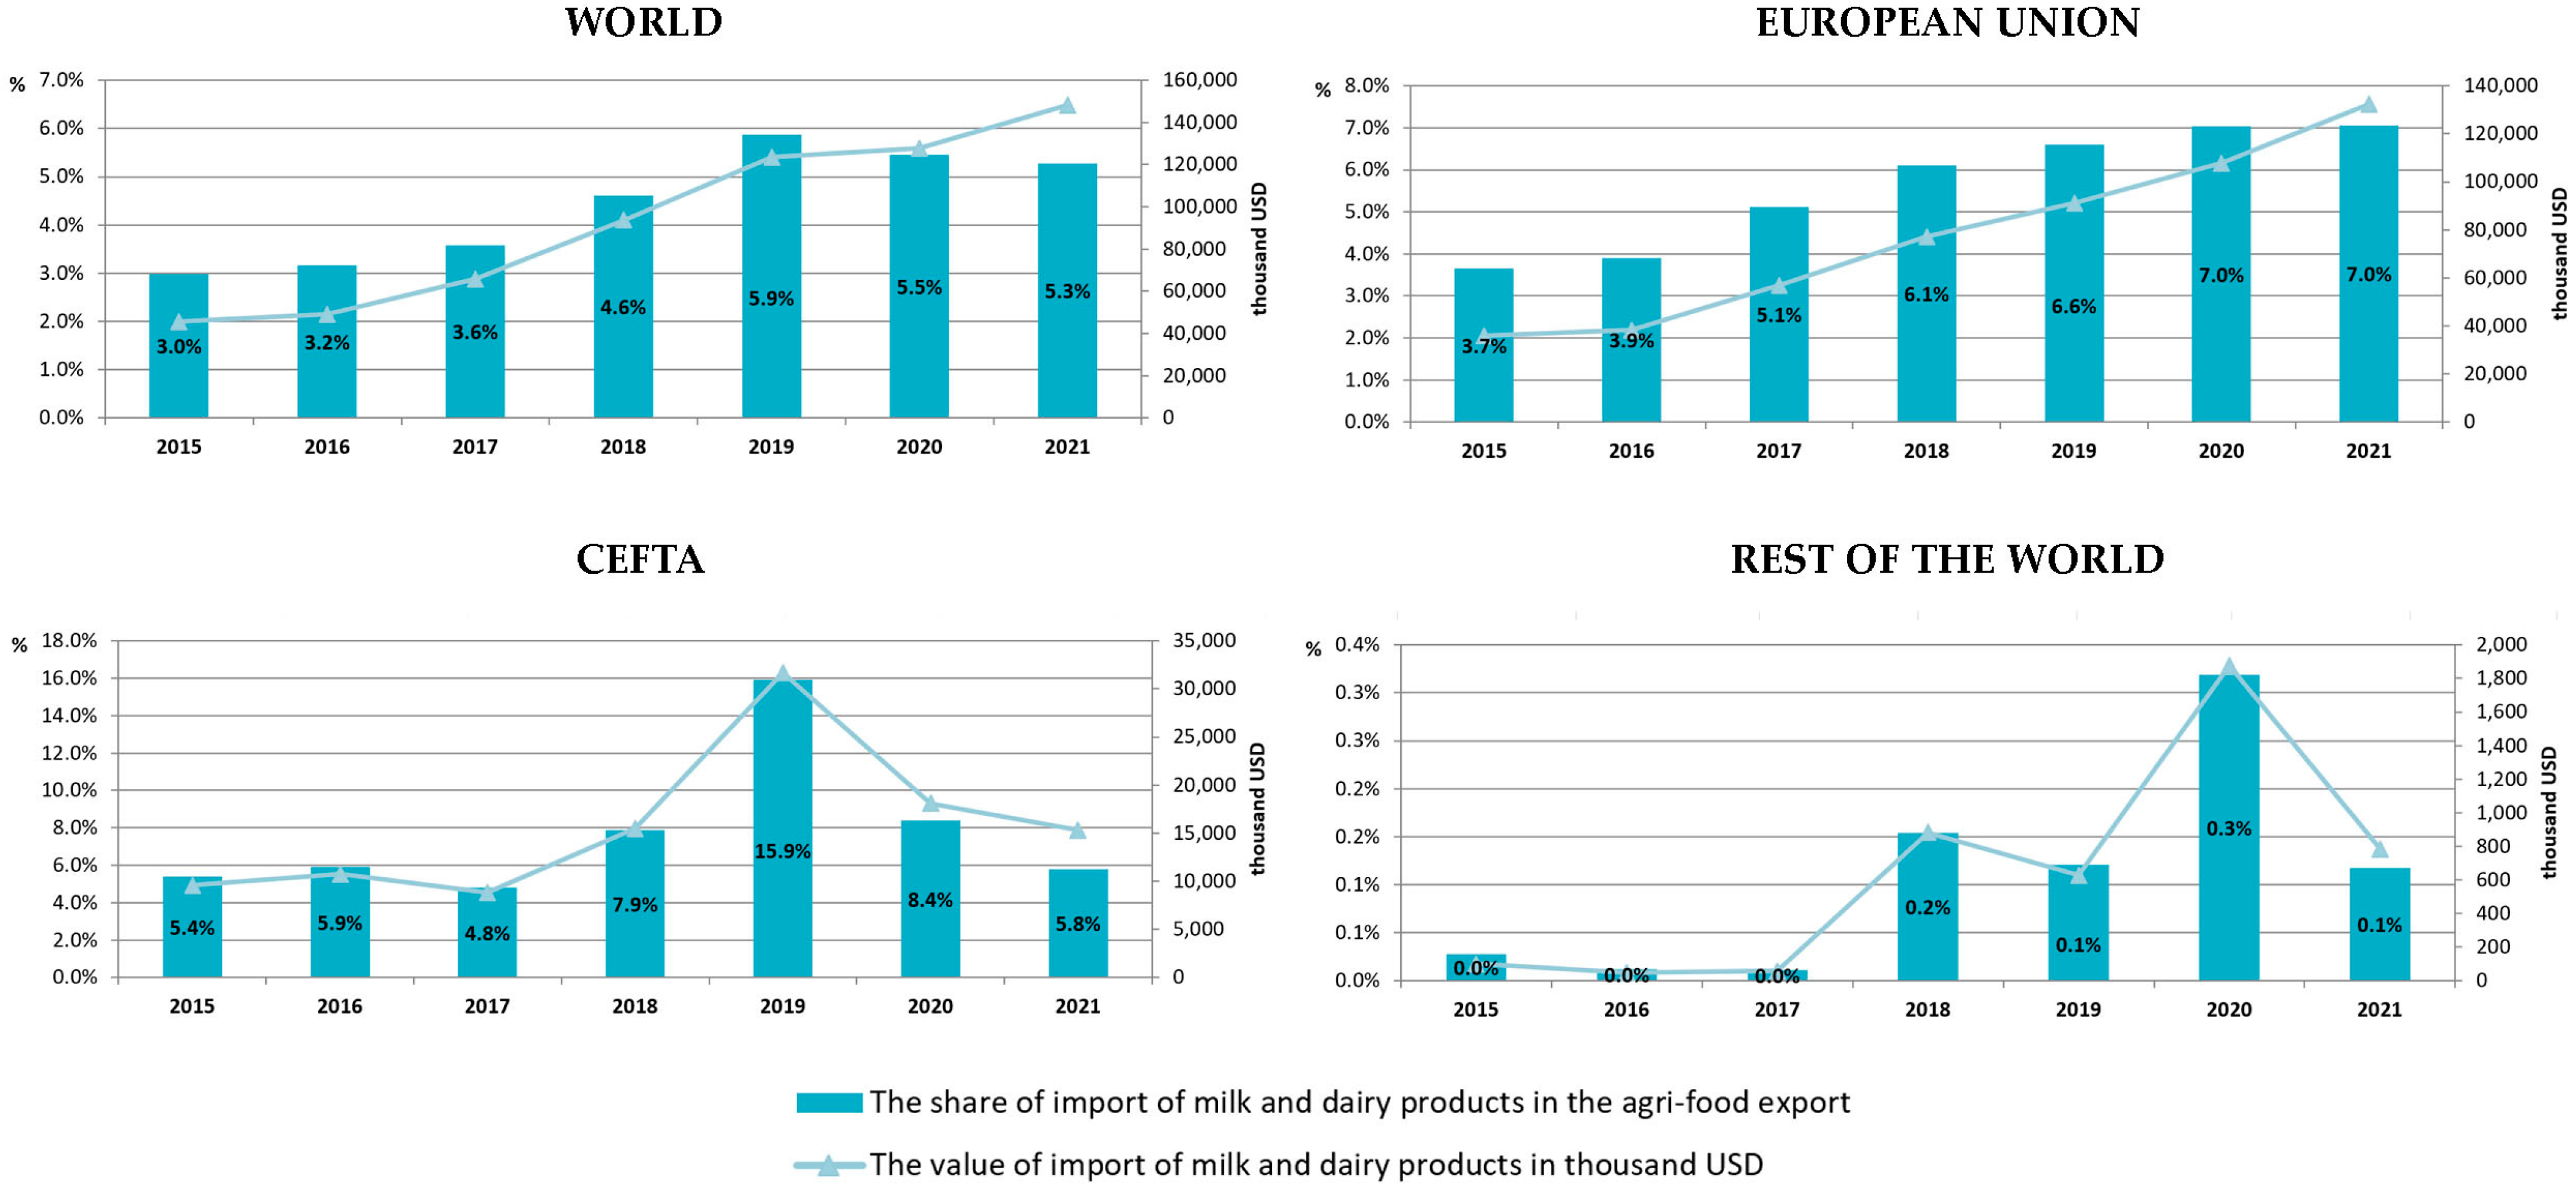
3.3. Analysis of Competitiveness

Additionally, this paper examines the trends in the competitiveness of this sector through the analysis of foreign trade indicators using data from the Statistical Office of the Republic of Serbia [1]. Namely, the Standard International Trade Classification (rev 4) [43] was used; the groups were as follows: 022 milk, cream, and milk products other than butter or cheese, 023 butter and other fats and oils derived from milk, and 024 cheese and curd. The analysis of foreign trade exchange implies the analysis of exports, imports, and the foreign trade balance, in addition to the observed indicators of revealed comparative advantages and integration in trade in the international market.
Bearing in mind the multidimensionality of competitiveness [44], the analysis at the macro level is very complex and trade tendencies [45], i.e., indices of revealed comparative advantages, are most often used. In this research, the analysis of comparative advantages was looked at using the Lafay index (LFI), which is often used in the literature to analyze revealed comparative advantages at the level of sectors, groups, or products [21]. Numerous papers highlight the advantages of this index in relation to the traditional Balassa index of revealed comparative advantages [46], pointing out that it is a more complete type of analysis, given that it also takes into account the import side. The LFI index is calculated as follows:
L F I j i = 100 x j i m j i x j i + m j i j = 1 N x j i m j i j = 1 N x j i + m j i x j i + m j i j = 1 N x j i + m j i .
In this context, x denotes exports, m stands for imports, i represents a specific country, j is an analyzed group from SITC, and N indicates the total number of items under analysis. Consequently, L F I j i corresponds to the Lafay index for country i (Serbia) within the analyzed groups j (milk and dairy products, specifically groups 022, 023, and 024). When the LFI exceeds 0, it indicates the presence of comparative advantages.
For the integration of milk and dairy products from Serbia with the international market, the Grubel–Lloyd index of intra-industry trade (GLIIT) is analyzed [47]:
G L I I T j = 1 j X i j M i j j X i j + M i j 100
where X represents exports, M stands for imports, i represents a specific country, and j signifies the analyzed group within the SITC classification (milk and dairy products—groups 022, 023, and 024). When the GLIIT is greater than 15%, it signifies the intra-industry character of trade (good integration with the international market).

4. Results and Discussion

4.1. Farm Level

The evaluation of the Cobb–Douglas production function model in order to evaluate the technical efficiency of farms specialized in milk production began by checking the fulfillment of the initial assumptions related to the presence of harmful multicollinearity, heteroskedasticity, autocorrelation, panel dependence, and unit root.
Table 1 presents the values of VIF and TOL indicators. Since the values of the VIF indicator are significantly lower than the reference value 5, that is, the TOL indicator is higher than the reference value 0.1, it can be stated that there is no harmful multicollinearity in the production function model.
In the next step (Table 2), the evaluation of the panel regression model in the fixed and stochastic specification was performed, after which the Hausman test of the model specification was carried out. The corresponding test statistic following the χ 2 distribution for 5 degrees of freedom was 17.16, so the null hypothesis that the model is in the stochastic specification is rejected in favor of fixed individual effects.
As the fixed individual effects model was selected, in order to verify the fulfillment of the homoscedastic variance assumption, a modified Wald test was conducted, which was adapted precisely to fixed individual effects models (Table 3). The associated test statistic was 5083.8, which is considerably greater than the critical value of the χ 2 distribution with 104 degrees of freedom at a significance level of α = 0.01. Therefore, the initial assumption that the variance of the residuals is homoscedastic must be rejected. In order to check the presence of panel interdependence, the Pesaran CD test was conducted. The corresponding test statistic was 10.06, so the null hypothesis that the panels are mutually independent is rejected for the significance threshold α = 0.01. Finally, the presence of first-order autocorrelation was checked with the Wooldridge test. The corresponding test statistic F(1;103) was 2.49, so the null hypothesis is accepted, indicating the absence of first-order autocorrelation. The presence of a unit root was checked using the Levin–Lin–Chu test and the series was found to be stationary (Table 4).
As the conducted tests established the presence of heteroscedastic variance and statistically significant panel interdependence, in the continuation of the analysis, a fixed effects model with a robust standard error was evaluated. Since there was no multicollinearity among the independent variables, as well as the presence of first-order autocorrelation, it was not necessary to carry out additional transformations of the used variables.
Based on the estimated panel regression model of fixed individual effects with a robust standard error (Table A1), whose functional form of the model is based on the Cobb–Douglas production function, the technical efficiency of the observed farms was calculated. It was previously established that all inputs (except for the labor-related variable) in the Cobb–Douglas production function model have a statistically significant impact on the realized value of production.
Although the interpretation of the estimated impact of production inputs on the realized output is not the focus of the research, it is important to point out that technical progress was also established, which is 5.11% on average on an annual basis. Given that the Republic of Serbia can be characterized as a developing country without a significant contribution to the development of agricultural production technology on a global level, the slight increase in productivity can be explained as a consequence of the import of technological solutions (procurement of more modern machinery, use of better seed hybrids, exploitation of better breeds of cattle, etc.) [48].
In accordance with the above, the assessed technical efficiency of farms specialized in dairy cattle breeding for the period of 2015–2021 was 87.19%. In addition to the above, the evaluated components of total technical efficiency, i.e., persistent and residual technical efficiency, were on average 91.73 and 93.01%, respectively. Table 5 presented below gives an insight into the ratings of the total, persistent, and residual technical efficiency of the observed farms for the period of 2015–2021.
Figure 1 presented below provides an insight into the movement of the total, persistent, and residual technical efficiency for the observed time period. It is noticeable that the observed farms achieve a higher persistent compared to residual technical efficiency for all years of observation, except for the last year, 2021. Although the values of the components of the total technical efficiency are at a relatively similar level, a slight advantage during the additional analysis of the causes of the achieved inefficiency is provided by the factors influencing the residual technical inefficiency. Therefore, it is a question of influencing factors which profile short-term aspects of business that are often beyond the control of production entities, such as administrative measures of agricultural policy.
In this regard, in the second step of the evaluation of the model of the stochastic marginal production function, an additional explanatory variable was introduced, which aims to evaluate the impact of received subsidies on the realized residual technical inefficiency. As the variable related to subsidies is statistically significant with a positive sign in the model of residual technical inefficiency, it can be concluded that the realized subsidies have a negative impact on the residual and then consequently on the overall assessment of technical efficiency.
The foregoing can be explained by the nature of the subsidies placed, which mostly refer to direct payments aimed at income support. As the subsidies are aimed at income support, the negative impact on the achieved productivity can be explained by the lack of motivation among agricultural producers to improve the performance of farms, with an additional effort needed in order to achieve more efficient production. Similar conclusions were reached by numerous other authors who analyzed the dairy cattle sector of EU countries [36,37]. In accordance with the above, Brümmer et al. [49] and Lakner [48], using the example of farms specialized in milk production in Germany, state the importance of investment subsidies that, in the long term, provide the possibility of technical progress and consequently lead to improved production productivity.

4.2. Dairy Processors

Table 6 presents the results of a descriptive statistical analysis of the observed variables used in the assessment of profitability and factors influencing the profitability of companies engaged in the production and processing of milk. Based on the presented results of descriptive statistics, it can be seen that the average value of profitability indicators in the observed period was 3.36%, and based on the quartile value, it can be seen that 25% of companies had profitability below 0.46%, and only 25% of companies had profitability above 5.25%. The average number of days to collect receivables was 127, and it is characteristic of these companies that only 25% of those analyzed managed to collect their receivables within 33 days. The turnover ratio of total business assets averaged at 1.98, which means that total business assets are turned over almost two times a year. The GDP of the Republic of Serbia in the observed period was positive and amounted to an average of 3.22%, while inflation was at an average level of 2.15%.
In order to evaluate the factors affecting the profitability of agricultural enterprises engaged in the production of milk and dairy products, a panel regression model was applied. The analysis began by checking the fulfillment of the basic assumptions for the application of panel regression models, which refer to the presence of multicollinearity, heteroscedasticity, autocorrelation, panel dependence, and the presence of unit roots.
Table 7 presents the values of VIF and TOL indicators. Since the values of the VIF indicator are significantly lower than the reference value 5, that is, the TOL indicator is higher than the reference value 0.1, it can be stated that there is no harmful multicollinearity in the regression model.
For the purpose of examining the nature of individual effects, i.e., to test whether these effects are fixed or stochastic, a modified Hausman model specification test was applied (Table 8). The corresponding test statistic following the χ2 distribution for 6 degrees of freedom was 5.37, so the null hypothesis is accepted, i.e., the random individual effects model was selected.
In the next part of the research, the basic assumptions for the application of panel regression models were checked (Table 9 and Table 10). The presence of heteroscedasticity was assessed using the Breusch–Pagan/Cook–Weisberg test and the results of the test determined the existence of heteroscedasticity (p < 0.05). In order to check the interdependence of the panels, the Pesaran CD test was conducted, which showed that there is interdependence in the model (p < 0.05). Checking the presence of first-order autocorrelation was achieved using the Wooldridge test, and the results showed the existence of autocorrelation (p < 0.05). The presence of a unit root was checked using the Levin–Lin–Chu test and the series was found to be stationary.
As the conducted tests determined the presence of heteroscedastic variance, autocorrelation, and statistically significant cross-sectional dependence, the stochastic effects model with a robust standard error was estimated in the continuation of the analysis (Table 11).
The panel regression model was formed on the basis of 102 companies and a period of 7 years, and the total number of observations was 714. The variables that have a significant impact on profitability were liquidity, the average number of days of receivables collection, the turnover ratio of total business assets, and inflation. It was observed that liquidity and the turnover ratio of total business assets have a positive impact on profitability, while the number of days of receivables collection and inflation have a negative impact on profitability.
The results of the evaluated panel regression model for companies engaged in the production and processing of milk in the Republic of Serbia established the existence of a statistically significant and positive influence of liquidity on the profitability of the observed companies. Based on the regression coefficient, it can be determined that with an increase in liquidity, an increase in profitability can be expected, which is in line with the results obtained by Dakić et al. [19] during the analysis of dairy companies, as well as by Deari and Lakshina [50]. A positive and statistically significant impact, based on the estimated regression model, was also found in the turnover ratio of total business assets, i.e., it was confirmed that more efficient management of total business assets leads to higher profitability of the observed companies. Kim et al. [51] analyzed the profitability factors of manufacturing companies from Vietnam and also came to the conclusion that the turnover ratio of total business assets has a positive impact on profitability. Based on the results of the descriptive statistical analysis, it was observed that the observed companies have a long period of collection of their receivables; the high value of this ratio indicates that companies from this sector have problems with cash flows due to the long period between sales and collection. The results of the evaluated panel regression model determined that the average number of days of receivables collection has a negative impact on profitability, which is in accordance with the results obtained by Gołaś [17]; in order to improve profitability, companies should pay attention to credit policy and policy collection of their claims. Inflation exerted a notable and adverse influence on the profitability of dairy industry companies, which is expected, considering that inflation was growing in the mentioned period. The negative impact of inflation on profitability was determined in the research by Egbunike and Okerekeoti [52], Odusanya [53], and Dalci et al. [54].

4.3. Competitiveness of Milk and Dairy Products in Foreign Trade

The export of milk and dairy products in the analyzed period is on average 3% of the export of agri-food products in Serbia; on average, USD 177 million was the value of these products that were exported (Figure 2). There was a significant increase in the export of milk and dairy products, especially to EU countries, where in the analyzed period, the value of exports grew at an average annual rate of 36%. When analyzing the regional structure of exports of milk and dairy products, CEFTA countries dominated, and in recent years, there has been a noticeable growth trend in exports to the EU. In the last few years, exports to EU countries make up a third of total exports. The highest value of exports to the world market is achieved by products from group 022—milk, cream, and milk products other than butter or cheese, while the export of products from group 024—cheese and curd—is also significant. Exports from group 024, i.e., cheese exports, are very significant when it comes to exports to Russia.
The import of milk and dairy products in the analyzed period is on average 4% of the import of agri-food products in Serbia; on average, USD 93 million was value of these products that were imported (Figure 3). There was a significant increase in the import of milk and dairy products from all import destinations in the analyzed period. Imports from EU countries dominate the overall structure of imports to Serbia. Imports from group 022—milk, cream, and milk products other than butter or cheese—dominate, while the import of products from group 024—cheese and curd—is also significant.
Milk and dairy products recorded a positive foreign trade balance in the analyzed period, with a downward trend (Figure 4). When looking at the foreign trade balance of these products by individual trading partners (Figure 5), the most favorable situation is with the countries of the rest of the world, and a positive foreign trade balance is also observed with CEFTA countries. A negative foreign trade balance, with a tendency of permanent deterioration, is observed in trade with EU countries, where these products are the least competitive [3].
When it comes to the analysis of comparative advantages (Figure 6), as observed in previous literature, milk and dairy products are not particularly competitive in the international market. If the world market is analyzed, it is observed that there are no comparative advantages of LFI < 0 in all analyzed years, and the same situation occurs with CEFTA and EU countries, with the worst situation arising in trade with EU countries. When it comes to the rest of the world, comparative advantages are observed in exports of LFI > 0, although the value of exports to these countries is lower than that of exports to EU and CEFTA countries in the last few years.
When it comes to the integration of milk and dairy products with the world market (Figure 7), it can be seen that this sector is well integrated with the international market, but integration is also good with the EU and CEFTA—GLIIT > 15%—which indicates the intra-industrial character of trade, that is, it indicates good integration with the world market. The only exception is integration with the remaining trading partners, which is not at a satisfactory level (GLIIT < 15%).
Dairy consumption in the Republic of Serbia leans heavily toward staple items like pasteurized milk, yogurt, sour cream, fruit yogurts, and low-fat cheeses. These products remain in constant demand, with swift turnover in the market due to their perishable nature.
Conversely, the availability of long-lasting dairy products remains limited in local markets, primarily seen in the form of high-quality, high-fat content cheeses. Such dairy products are predominantly reliant on imports to meet consumer needs.
There are several contributing factors to this current situation. Firstly, the Republic of Serbia hosts a substantial number of small-scale producers lacking the necessary equipment for milk storage and analysis. Consequently, to minimize transportation expenses, milk purchasers aggregate collected quantities in one location and assess average quality. However, the amalgamation of varying quality milk hampers opportunities for further processing.
Moreover, considering the limited purchasing power of consumers in the Republic of Serbia and the absence of a culture for consuming premium dairy products, domestic milk and dairy production primarily caters to local consumer demands. A notable aspect influencing the production of lower quality milk by small-scale producers is the prevalence of domestic cow breeds (such as the Simental breed) on agricultural farms. While these breeds demonstrate adaptability to abrupt changes in feed quality caused by the rising frequency of droughts, they tend to yield lower quantities of milk of inferior quality.
In contrast, larger producers are equipped with suitable facilities for storing milk on-site, while quality analysis is conducted during the direct sale of raw milk to buyers. This suggests that larger producers have the potential to yield better quality milk. However, the market demands for milk and milk products in the Republic of Serbia prioritize securing larger quantities and capturing the maximum market share through effective marketing. Consequently, investing more money to achieve superior milk quality does not guarantee a better financial outcome.
As previously indicated, the local market demand for milk and dairy products is primarily fulfilled through domestic production. With a notable output of dairy products of moderate quality, export activities remain constrained, largely limited to neighboring countries within the CEFTA agreement. These markets share similar consumption patterns and needs.
Conversely, dairy and milk product manufacturers in EU nations, under the pressure of fierce competition, prioritize cost reduction, standardized quality, and collaborative efforts to negotiate better milk purchase prices. Consequently, Serbian milk and dairy product producers face considerable challenges in competing within the EU market, resulting in a relatively limited presence.
The results obtained within this research are in accordance with previous research on this issue, i.e., negative tendencies are also observed when it comes to comparative advantages, and a fairly good level of integration of milk and dairy products with the international market is found [21,22]. The reason for the relatively negative tendencies in competitiveness is the poor functioning of the milk supply chain, despite the fact that the dairy industry is one of the biggest beneficiaries of the agricultural budget [3]. There are permanent tendencies in the decline of primary production, and processing is concentrated in a few large companies with monopsony characteristics. Sustainable development in the dairy production sector requires balanced business performance, which means that the dominance of one group could threaten the survival of other participants, which in the long run would have a negative impact on the overall development of this segment of agricultural production. Bearing in mind the current crisis of world circumstances, the process of stabilizing the milk supply chain will be even more difficult, given that previous research shows that there have been massive changes on the agricultural patterns, especially when it comes to input and investment price changes [55].

5. Conclusions

Based on the obtained results, it is possible to draw several conclusions.
  • In the observed period, the technical efficiency of dairy farms was at a high level, with significant growth in the last observed year. Additional analysis showed that subsidies have a negative impact on overall efficiency. This result was expected because the subsidies were mainly realized through premiums, while a very small part was directed to investments.
  • The profitability of milk-producing companies is greatly influenced by their liquidity, which may suggest that the ability to pay farmers for raw milk immediately after delivery is a crucial factor in the success of a producer’s business. In addition, the results showed that companies do not cope well with inflation, one of the main characteristics of previous crises. Limiting the prices of milk and banning exports can further threaten the business of processors due to the inability to amortize unfavorable inflationary trends on the input market with higher prices of their products.
  • In terms of international competitiveness, Serbia’s position could be better. It is difficult for milk producers to compete with competition from the EU, which has received support through the CAP for years.
  • The stability of domestic milk production is apparent; however, the market remains susceptible to significant disruptions that pose potential threats. Furthermore, the current quality of dairy products in the market falls short of desirable standards. Additionally, domestic producers are yet to establish a robust potential for a substantial surge in the export of milk and associated dairy products. Following the precedents set by the EU and the Common Agricultural Policy, there is a need to intensify efforts aimed at bolstering competitiveness within the milk and dairy product market in the Republic of Serbia. Subsidies directed towards producers must prioritize the enhancement of milk quality and the promotion of more efficient production, rather than merely serving as income support, as observed in the current practices of the Republic of Serbia. The resulting intensification of competitiveness would compel adequately equipped large-scale producers to place heightened emphasis on quality improvements, potentially paving the way for the establishment of export opportunities. Such initiatives are likely to foster a heightened degree of sustainability within both the dairy cattle sector and the dairy processing sector in the Republic of Serbia.
  • The common problem of farmers and companies is the low price of milk. During the crisis, government measures were primarily aimed at consumer protection by limiting milk prices, resulting in farmers’ protests. It is clear that in the coming period, it is necessary to strengthen the position of producers, and the question is how it can be achieved without foreign trade measures, because free trade agreements limit the possibilities. Limiting the import of milk and dairy products for a certain period and encouraging investments in physical assets to increase production and processing would be ideal. However, such measures are not welcome from the point of view of international politics nor of social policy due to the potential price increase. A more realistic scenario is the selection of measures that will increase investments in production with continued support in the form of premiums.
In addition to the economic aspects, the sustainability of the dairy cattle sector and dairy product production necessitates a comprehensive consideration of the social and environmental dimensions. From a social standpoint, fostering heightened competitiveness within the realms associated with milk and dairy product production may potentially yield an upsurge in the overall quality of end products. This, in turn, could significantly contribute to the improved health standards for both consumers and the farmed animals.
Furthermore, with the prospective enhancement of the economic sustainability aspect, it is foreseeable that living standards, particularly for milk producers residing predominantly in rural areas, would witness an improvement. This positive development is expected to have a ripple effect, contributing to the overall betterment of the entire community.
Moreover, it is crucial to emphasize that the realization of economic and social security objectives alone falls short of encompassing the complete spectrum of a truly sustainable concept. Special emphasis must be placed on the environmental dimension. Enhancements in the production process, focusing on production efficiency and the strategic combination of suitable nutrients, offer the potential to effectively regulate the emission of harmful gases originating from the excrement and urine of dairy cattle. Nevertheless, it is important to note that this area of research remains incomplete, necessitating further exploration and data acquisition to bolster the understanding of how dairy systems impact the overall sustainability of dairy products.
Future research will be devoted to the effects of the crisis on the milk market in Serbia in 2022, as well as further analysis of factors that affect the competitiveness of milk producers.

Author Contributions

Conceptualization, D.M., T.N. and B.M.; methodology and investigation, D.M., T.N., D.T., B.M. and S.Z.; writing—original draft preparation, T.N., D.T., B.M. and D.Đ.; writing—review and editing, T.N. and D.Đ.; visualization, B.M.; supervision, T.N., D.T., B.M., D.Đ. and S.Z. All authors have read and agreed to the published version of the manuscript.

Funding

This research was funded by the Provincial Secretariat for Higher Education and Scientific Research of Autonomous Province of Vojvodina, the Republic of Serbia, during the project Assessment of economic performance of the agricultural and food sector of AP Vojvodina, grant number 142-451-2567/2021-01/2.

Institutional Review Board Statement

Not applicable.

Data Availability Statement

Not applicable.

Conflicts of Interest

The authors declare no conflict of interest.

Appendix A

Table A1. Fixed individual effects panel model with robust standard errors for farms.
ParameterVariableFixed Effects Model with Robust Standard Errors
EstimateStandard Error
β 0 Intercept3.4594 **0.4517
β 1 lnLabour0.04560.0424
β 2 lnCapital0.1719 **0.0467
β 3 lnUAA0.1266 *0.0627
β 4 LnInput0.3733 **0.0457
β 5 Time0.0511 **0.0066
Model of time-varying technical efficiency
ω η 0 Intercept−8.05630.9085
ω η 1 Direct_Payments0.22100.0419
σ u 0.1819
σ v 0.1795
λ = σ u / σ v 1.0130
ρ = σ u 2 / σ 2 0.5064
Number of observations728
Number of farms104
Note: **—level of significance 1%; *—level of significance 5%. Source: authors’ calculation.

References

  1. Statistical Office of the Republic of Serbia. Database. Available online: https://data.stat.gov.rs/?caller=SDDB (accessed on 10 August 2023).
  2. Serbian Business Registers Agency. Available online: https://www.apr.gov.rs/registers/companies.1786.html (accessed on 6 April 2023).
  3. Konkurentnost Poljoprivrede Srbije; SEEDEV, 2017. Available online: https://www.seedev.org/publikacije/Konkurentnost_poljoprivrede_Srbije/Konkurentnost_Srbije_Analiza.pdf (accessed on 6 April 2023).
  4. “Sl. glasnik RS”, br. 110/2022. ODLUKA O PRIVREMENOJ ZABRANI IZVOZA MLEKA I PROIZVODA OD MLEKA. Available online: http://demo.paragraf.rs/demo/combined/Old/t/t2022_10/SG_110_2022_005.htm (accessed on 7 September 2023).
  5. Srbija.gov.rs. Ограничена цена млека у пакoвању oд Једнoг литра на 128,99 динара. Available online: https://www.srbija.gov.rs/vest/649267/ogranicena-cena-mleka-u-pakovanju-od-jednog-litra-na-12899-dinara.php (accessed on 7 September 2023).
  6. Popović, D. Serbian Dairy Farmers Block Road, Spill Milk. N1. Available online: https://n1info.rs/english/news/serbian-dairy-farmers-block-road-spill-milk/ (accessed on 7 September 2023).
  7. Mareth, T.; Thomé, A.; Oliveira, F.; Scavarda, L.F. Systematic Review and Meta-Regression Analysis of Technical Efficiency in Dairy Farms. Int. J. Product. Perform. Manag. 2016, 65, 279–301. [Google Scholar] [CrossRef]
  8. Moreira López, V.H.; Bravo-Ureta, B. A Study of Dairy Farm Technical Efficiency Using Metaregression: An International Perspective. Chil. J. Agric. Res. 2009, 69, 214–223. [Google Scholar] [CrossRef]
  9. Gorton, M.; Davidova, S. Farm Productivity and Efficiency in the CEE Applicant Countries: A Synthesis of Results. Agric. Econ. 2004, 30, 1–16. [Google Scholar] [CrossRef]
  10. Thiam, A.; Bravo-Ureta, B.E.; Rivas, T.E. Technical Efficiency in Developing Country Agriculture: A Meta-Analysis. Agric. Econ. 2001, 25, 235–243. [Google Scholar] [CrossRef]
  11. Bravo-Ureta, B.E.; Rivas, T.E.; Thiam, A. A Meta-Analysis of Technical Efficiency in Farming: A Multi-Country Perspective. In Proceedings of the 13th Congress, Wageningen, The Netherlands, 7–12 July 2002. [Google Scholar]
  12. Čechura, L.; Žáková Kroupová, Z. Technical Efficiency in the European Dairy Industry: Can We Observe Systematic Failures in the Efficiency of Input Use? Sustainability 2021, 13, 1830. [Google Scholar] [CrossRef]
  13. Náglová, Z.; Rudinskaya, T. Factors Influencing Technical Efficiency in the EU Dairy Farms. Agriculture 2021, 11, 1114. [Google Scholar] [CrossRef]
  14. Đokić, D.; Novaković, T.; Tekić, D.; Matkovski, B.; Zekić, S.; Milić, D. Technical Efficiency of Agriculture in the European Union and Western Balkans: SFA Method. Agriculture 2022, 12, 1992. [Google Scholar] [CrossRef]
  15. Jakšić, D.; Mijić, K.; Zekić, S.; Poljašević, J. Comparative Profitability Analysis of Milk Production Companies to Milk Processing Companies in Serbia. Custos e Agronegócio 2015, 11, 206–226. [Google Scholar]
  16. Zdráhal, I.; Chmelíková, G.; Blažková, I. Sector-Wide and Country-Specific Drivers of Firm Performance in the Visegrad Group Dairy Industry. AGRIS-Line Pap. Econ. Inform. 2018, 10, 89–100. [Google Scholar] [CrossRef]
  17. Gołaś, Z. Impact of Working Capital Management on Business Profitability: Evidence from the Polish Dairy Industry. Agric. Econ. Zemědělská Ekon. 2020, 66, 278–285. [Google Scholar] [CrossRef]
  18. Milošević-Avdalović, S. Determinants of Profitability in Dairy Industry. Agroekonomika/Agrieconomica 2018, 47, 1–9. [Google Scholar]
  19. Dakić, S.; Mijić, K.; Jakšić, D. Multiple Regression Approach to Modelling Determinants of Business Success Based on Financial Statements: Evidence from Food Processing Companies in the Republic of Serbia. Custos e Agronegócio 2019, 15, 485–501. [Google Scholar]
  20. Birovljev, J.; Matkovski, B.; Ćetković, B. The Competitiveness of the Serbian Agri-Food Products on the Market of Countries in the Region. Anali Ekon. Fak. U Subotici 2015, 51, 61–78. [Google Scholar]
  21. Matkovski, B.; Zekić, S.; Đokić, D.; Jurjević, Ž.; Đurić, I. Export Competitiveness of Agri-Food Sector during the EU Integration Process: Evidence from the Western Balkans. Foods 2022, 11, 10. [Google Scholar] [CrossRef] [PubMed]
  22. Božić, D.; Nikolić, M.M. Obeležja Spoljnotrgovinske Razmene Poljoprivredno-Prehrambenih Proizvoda Srbije: Characteristics of Serbian Foreign Trade of Agricultural and Food Products. Marketing 2016, 47, 293–304. [Google Scholar] [CrossRef]
  23. Božić, D.; Nikolić, M. Foreign Trade and Comparative Advantages of Agrarian Sector of Serbia and Neighboring Countries. Ekon. Poljopr. 2019, 66, 737–753. [Google Scholar] [CrossRef]
  24. Brankov, T.; Matkovski, B.; Jeremić, M.; Đurić, I. Food Self-Sufficiency of the SEE Countries; Is the Region Prepared for a Future Crisis? Sustainability 2021, 13, 8747. [Google Scholar] [CrossRef]
  25. Aigner, D.; Lovell, C.A.K.; Schmidt, P. Formulation and Estimation of Stochastic Frontier Production Function Models. J. Econom. 1977, 6, 21–37. [Google Scholar] [CrossRef]
  26. Meeusen, W.; van Den Broeck, J. Efficiency Estimation from Cobb-Douglas Production Functions with Composed Error. Int. Econ. Rev. 1977, 18, 435–444. [Google Scholar] [CrossRef]
  27. Schmidt, P.; Sickles, R.C. Production Frontiers and Panel Data. J. Bus. Econ. Stat. 1984, 2, 367–374. [Google Scholar] [CrossRef]
  28. Kumbhakar, S.; Lien, G.; Hardaker, J. Technical Efficiency in Competing Panel Data Models: A Study of Norwegian Grain Farming. J. Product. Anal. 2014, 41, 321–337. [Google Scholar] [CrossRef]
  29. Colombi, R.; Martini, G.; Vittadini, G. A Stochastic Frontier Model with Short-Run and Long-Run Inefficiency Random Effects. 2011. Available online: https://econpapers.repec.org/paper/brhwpaper/1101.htm (accessed on 6 April 2023).
  30. Johansson, H. Technical, Allocative, and Economic Efficiency in Swedish Dairy Farms: The Data Envelopment Analysis Versus the Stochastic Frontier Approach. In Proceedings of the 2005 International Congres, Copenhagen, Denmark, 23–27 August 2005. [Google Scholar]
  31. Lopes, F. Technical Efficiency in Portuguese Dairy Farms. In Proceedings of the 82nd Annual Conference, Royal Agricultural College, Cirencester, UK, 31 March–2 April 2008; Agricultural Economics Society, 2008. No. 36863. Available online: https://econpapers.repec.org/paper/agsaes008/36863.htm (accessed on 23 August 2023).
  32. Zhu, X.; Oude Lansink, A.G.J.M. Determinants of Productivity Change of Crop and Dairy Farms in Germany, the Netherlands and Sweden in 1995–2004. In Proceedings of the 2009 Conference, Beijing China, 16–22 August 2009. [Google Scholar]
  33. Kellermann, M.; Salhofer, K. (Eds.) Comparing Productivity Growth in Conventional and Grassland Dairy Farms; 2011; Available online: https://ideas.repec.org/p/ags/eaae11/114763.html (accessed on 23 August 2023). [CrossRef]
  34. Areal, F.J.; Balcombe, K.; Tiffin, R. Integrating Spatial Dependence into Stochastic Frontier Analysis. Aust. J. Agric. Resour. Econ. 2012, 56, 521–541. [Google Scholar] [CrossRef]
  35. Kargiannis, G.; Salhofer, K.; Sinabell, F. Scale Efficiency in Organic and Conventional Dairy Farming. In Proceedings of the 2012 First Congress, Trento Italy, 4–5 June 2012. [Google Scholar]
  36. Zhu, X.X.; Demeter, R.M.; Lansink, A.G.J.M.O. Technical Efficiency and Productivity Differentials of Dairy Farms in Three EU Countries: The Role of CAP Subsidies. Agric. Econ. Rev. 2012, 13, 66–92. [Google Scholar]
  37. Latruffe, L.; Bravo-Ureta, B.E.; Moreira, V.H.; Desjeux, Y.; Dupraz, P. Productivity and Subsidies in the European Union: An Analysis for Dairy Farms Using Input Distance Frontiers. In Proceedings of the 28 International Association of Agricultural Economists (IAAE) Triennial Conference, Foz de Iguaçu, Brazil, 18–24 August 2012; International Association of Agricultural Economists (IAAE): Foz de Iguaçu, Brazil, 2012; p. 18. [Google Scholar]
  38. Mamardashvili, P.; Bokusheva, R.; Schmid, D. Heterogeneous Farm Output and Technical Efficiency Estimates. Ger. J. Agric. Econ. 2014, 63, 1–15. [Google Scholar]
  39. Niskanen, O.; Heikkilä, A.-M. The Impact of Parcel Structure on the Efficiency of Finnish Dairy Farms. Agric. Resour. Econ. Rev. 2015, 44, 65–77. [Google Scholar] [CrossRef]
  40. Latruffe, L.; Bravo-Ureta, B.; Carpentier, A.; Desjeux, Y.; Moreira, V.H. Subsidies and Technical Efficiency in Agriculture: Evidence from European Dairy Farms. Am. J. Agric. Econ. 2017, 99, 783–799. [Google Scholar] [CrossRef]
  41. Manevska Tasevska, G.; Rabinowicz, E.; Surry, Y.R. Pure and Compensated Technical Efficiency of Swedish Dairy Farms. Agric. Food Sci. 2016, 25, 111–123. [Google Scholar] [CrossRef]
  42. Madau, F.A.; Furesi, R.; Pulina, P. Technical Efficiency and Total Factor Productivity Changes in European Dairy Farm Sectors. Agric. Food Econ. 2017, 5, 17. [Google Scholar] [CrossRef]
  43. Standard International Trade Classification. United Nations Statistics Division-Trade Statistics. Available online: https://unstats.un.org/unsd/trade/sitcrev4.htm (accessed on 1 July 2023).
  44. Krstić, M.; Gawel, A. IMPROVING THE COMPETITIVENESS–DETERMINANTS AND SOLUTIONS FOR QUALITY OF LOCAL BUSINESS CONDITIONS. Int. J. Qual. Res. 2023, 17, 529–554. [Google Scholar] [CrossRef]
  45. Jambor, A.; Babu, S. Competitiveness of Global Agriculture; Springer International Publishing: Cham, Switzerland, 2016. [Google Scholar] [CrossRef]
  46. Balassa, B. Trade Liberalisation and “Revealed” Comparative Advantage1. Manch. Sch. 1965, 33, 99–123. [Google Scholar] [CrossRef]
  47. Grubel, H.G.; Loyd, P.J. Intra-Industry Trade: The Theory and Measurement of International Trade in Differentiated Product; Wiley: London, UK, 1975. [Google Scholar]
  48. Lakner, S. Technical Efficiency of Organic Milk-Farms in Germany-the Role of Subsidies and of Regional Factors. Agron. Res. 2009, 7, 632–639. [Google Scholar]
  49. Brümmer, B.; Loy, J.P. The Technical Efficiency Impact of Farm Credit Programmes: A Case Study of Northern Germany. J. Agric. Econ. 2000, 51, 405–418. [Google Scholar] [CrossRef]
  50. Deari, F.; Lakshina, V.V. The Relationship between Liquidity and Prfitability of Russian Firms in the Agricultural Sector; ISCBE: Skopje/Tetovo, North Macedonia, 2019. [Google Scholar]
  51. Kim, N.L.T.; Duvernay, D.; Thanh, H.L. Determinants of Financial Performance of Listed Firms Manufacturing Food Products in Vietnam: Regression Analysis and Blinder–Oaxaca Decomposition Analysis. J. Econ. Dev. 2021, 23, 267–283. [Google Scholar]
  52. Egbunike, C.F.; Okerekeoti, C.U. Macroeconomic Factors, Firm Characteristics and Financial Performance: A Study of Selected Quoted Manufacturing Firms in Nigeria. Asian J. Account. Res. 2018, 3, 142–168. [Google Scholar] [CrossRef]
  53. Odusanya, I.A.; Yinusa, O.G.; Ilo, B.M. Determinants of Firm Profitability in Nigeria: Evidence from Dynamic Panel Models. Spoud. J. Econ. Bus. 2018, 68, 43–58. [Google Scholar]
  54. Dalci, I.; Tanova, C.; Ozyapici, H.; Bein, M.A. The Moderating Impact of Firm Size on the Relationship between Working Capital Management and Profitability. Prague Econ. Pap. 2019, 28, 296–312. [Google Scholar] [CrossRef]
  55. Andrei, J.V.; Rădulescu, I.D.; Chivu, L.; Erokhin, V.; Nancu, D.; Gao, T.; Vasić, M. A Short Descriptive Analysis of the European Evolutions of Input Price Indices of Agricultural Products between 2008–2017: Patterns, Trends and Implications. Strateg. Manag. 2022, 27, 39–47. [Google Scholar]
Figure 1. Evaluation of total, persistent, and residual technical efficiency based on the Kumbhakar, Lien, and Hardaker [28] model for the period of 2015–2021. Source: authors’ calculation.
Sustainability 15 15234 g001
Figure 2. Values of the export of milk and dairy products of Serbia. Source: the authors’ calculations.
Sustainability 15 15234 g002
Figure 3. Values of the import of milk and dairy products of Serbia. Source: the authors’ calculations.
Sustainability 15 15234 g003
Figure 4. Net export of milk and dairy products of Serbia. Source: the authors’ calculations.
Sustainability 15 15234 g004
Figure 5. Net export of milk and dairy products of Serbia by main partners. Source: the authors’ calculations.
Sustainability 15 15234 g005
Figure 6. Comparative advantages (LFI) of milk and dairy products of Serbia. Source: the authors’ calculations.
Sustainability 15 15234 g006
Figure 7. GLIIT of milk and dairy products of Serbia. Source: the authors’ calculations.
Sustainability 15 15234 g007
Table 1. Multicollinearity presence testing (farms).
VariableVIFTOL
lnInput1.410.7100
LnCapital1.340.7460
lnUAA1.290.7772
Time1.200.8368
lnLabour1.150.8665
Average1.280.7863
Source: authors’ calculation.
Table 2. Hausman’s test of the specification of the panel regression model (farms).
TestNull HypothesisTest Statisticp-ValueResult
Hausman test of model specificationRandom effects model χ 2 5 = 17.16 0.0042H0 is rejected
Source: authors’ calculation.
Table 3. Assumptions testing of the panel fixed effects models for farms.
TestNull HypothesisTest Statisticp-ValueResult
Modified Wald heteroskedasticity testHomoscedastic variance of residuals χ 2 104 = 5083.8 0.0000H0 is rejected
Pesaran CD test for cross-sectional dependenceCross-sectional independenceCD = 10.060.0000H0 is rejected
Wooldridge test for autocorrelationAbsence of first-order autocorrelation F ( 1 ; 103 ) = 2.49 0.1177H0 is accepted
Source: authors’ calculation.
Table 4. Levin–Lin–Chu unit root test results for farms.
VariableStatisticp-Value
Output16.8223 **0.0000
Labor24.6072 **0.0000
Capital−10.0357 **0.0000
Land−29.2755 **0.0000
Input−6.6636 **0.0000
Note: **—level of significance 1%. Source: authors’ calculation.
Table 5. Evaluation of technical efficiency based on the Kumbhakar, Lien, and Hardaker [28] model.
Technical EfficiencyNumber of ObservationsAverageStandard DeviationMinimumMaximum
Residual7280.93010.05010.44300.9874
Persistent7280.91730.01270.89690.9620
Total7280.87190.05010.41710.9381
Source: authors’ calculation.
Table 6. Descriptive statistics for variables used in panel regression model for companies.
VariableAverageStandard DeviationQ1Q3
ROA3.35788.96500.46255.2500
LIQ2.775215.48970.95002.2475
LEV4.615420.51830.37002.6100
DEBT0.52940.28630.29210.7546
ANDR127.21011065.190033.012586.8800
TOAT1.98141.69350.94002.6500
GDP3.22862.43281.80004.5000
CPI2.15710.98751.40003.1000
Source: authors’ calculation.
Table 7. Multicollinearity presence testing (companies).
VariableVIFTOL
GDP1.550.64
CPI1.550.64
DEBT1.210.83
LEV1.110.90
TOAT1.090.92
LIQ1.030.97
ANDR1.010.99
Source: authors’ calculation.
Table 8. Hausman’s test of the specification of the panel regression model (companies).
TestNull HypothesisTest Statisticp-ValueResult
Hausman test of model specificationRandom effects model χ 2 6 = 5.37 0.4969H0 is accepted
Source: authors’ calculation.
Table 9. Assumptions testing of the panel stochastic individual effect models for companies.
TestNull HypothesisTest Statisticp-ValueResult
Breusch–Pagan/Cook–Weisberg heteroskedasticity testHomoscedastic variance of residuals8.71000.0032H0 is rejected
Pesaran CD test for cross-sectional dependenceCross-sectional independence15.51800.0000H0 is rejected
Wooldridge test for autocorrelationAbsence of first-order autocorrelation6.58800.0117H0 is rejected
Source: authors’ calculation.
Table 10. Levin–Lin–Chu unit root test results for companies.
VariableStatisticp-Value
LIQ−13.1816 **0.0000
LEV−7.308 **0.0000
DEBT−15.0512 **0.0000
TOAT−6.932 **0.0000
ANDR−9.371 **0.0000
GDP−8.6830 **0.0000
CPI−8.391 **0.0000
Note: **—level of significance 1%; Source: authors’ calculation.
Table 11. Random individual effects panel model with robust standard errors for companies.
ParameterVariableRandom Effects Model with Robust Standard Errors
EstimateStandard Error
β 0 Intercept4.4907 **1.5595
β 1 LIQ0.0107 *0.0054
β 2 LEV0.01050.0122
β 3 DEBT−4.33852.6377
β 4 ANDR−0.0003 **0.0001
β 5 TOAT1.3463 **0.5125
β 6 GDP0.11150.1184
β 7 CPI−0.8919 **0.3216
Number of observations714
Number of companies102
Note: **—level of significance 1%; *—level of significance 5%. Source: authors’ calculation.
Disclaimer/Publisher’s Note: The statements, opinions and data contained in all publications are solely those of the individual author(s) and contributor(s) and not of MDPI and/or the editor(s). MDPI and/or the editor(s) disclaim responsibility for any injury to people or property resulting from any ideas, methods, instructions or products referred to in the content.

