1. Introduction
Green finance instruments have gained increasing importance over the last decade due to their relevance in international cooperation agreements and national policy-making targeting the climate crisis. The G20 Insights on Climate Policy and Finance defines the term as “all forms of investment or lending that consider the environmental effect and enhance environmental sustainability” ([
1], p. 1). Particularly after the Paris Agreement, discussion around the role of finance has gained critical importance in the green transition process. Green finance can significantly impact the allocation of resources to sustainable adaptation, mitigation, and infrastructure transformation projects, thereby accelerating the system’s transition to a low-carbon situation [
2]. Notwithstanding such relevance, the private sector “is not showing sufficient interest in green projects because of their higher risks and a lower rate of return when compared with fossil fuel projects” ([
3], p. 5). This aversion to risk fosters the green financial gap, and filling this void is not a trivial task.
The International Energy Agency (IEA) has estimated that to reach net-zero emissions by 2050, as targeted by the Paris Agreement, annual clean energy investment worldwide, for instance, will need to more than triple by 2030, by approximately U
$4 trillion [
4]. Furthermore, for global adaptation costs in general, the United Environment Programme (UNEP) estimates an amount as high as USD 300 billion per year by 2030 and USD 500 billion per year by 2050 [
5].
It is well-known that the scale of global warming effects and other related climate events will accelerate in the next decade while the window of action is rapidly closing [
6]. Moreover, there has been a growing amount of literature that has robust evidence that extreme weather events related to global warming will have harmful effects on labour productivity, aggregate product, energy needs, and agricultural production, among other degrading economic effects [
7,
8,
9]. Foremost, the climate crisis is a social crisis. The United Nations Refugee Agency (UNHCR) estimates that around 20 million people are forced to leave their homes and move to other areas yearly due to increasing extremes, such as heavy rainfall, droughts, desertification, sea-level rise, cyclones, and other intense climate occurrences [
10]. The World Bank evaluates that these events could force 216 million people, across six world regions, to move within their countries by 2050 [
11].
Addressing these issues requires not only adaptation measures but a structural transformation. Escaping a so-called “carbon lock-in” [
12,
13,
14] and promoting a green transition will require effort both on the supply side (R&D investments, innovation) and the demand side (changing consumption patterns, encouraging the dissemination of cleaner technologies) [
15,
16,
17]. The massive financial resources needed to invest in the low-carbon economy are a vital driver of this sociotechnical change. It is likewise decisive to understand the environmental issues within an integrated assembly of geophysical barriers, what Rockström et al. [
18] call “planetary boundaries”, inside which it is expected that humanity can operate safely. The Planetary Boundaries concept has been used to delimit the primary process of human effect on the environment. They constitute nine phenomena related to ecosystem services required to maintain the known stability of the Holocene Era and its current status [
18,
19].
As a result of its importance, the green finance theme has blossomed in recent research. However, the definition of green finance is challenging because there is no precise, common interpretation of the term or similar variations. Moreover, it is common to find relative terms, such as climate finance, carbon finance, or sustainable finance used interchangeably in the literature. Further exploration of such an important topic is required to understand the evolution of the publications and their knowledge frontiers and to infer possible approaches that can emerge from this field in the following years. For this reason, this paper proposes an analysis of the green finance field with the support of established bibliometric instruments combined with machine-learning tools represented by the structured topic modelling (STM) method. The objective is to explore the field’s evolution beyond a descriptive bibliometric analysis. The following research questions (RQ) guide the present study:
RQ1: is it possible to identify different groups within the green finance research field?
RQ2: if so, what are the characteristics of these groups?
RQ3: what are the field’s most prestigious articles and topics? What are their contributions to the literature?
The contribution of this paper is twofold. First, we identify the established and emergent groups of academic papers, highlighting their development trajectories and influential position within the literature. Second, we distinguish the different research themes (topics) for each group of articles and find the most prestigious topics in the network represented by their respective hub articles, which can influence their groups and, occasionally, the whole network. To do so, a novel computational method that combines complex networks [
20,
21], topological measures [
22], and structural topic modelling (STM) [
23] was applied, as presented in the subsequent sections.
Bibliometrics and complex network analysis are established methodologies to investigate the literature trends [
24]. However, using topological methodologies to define hub articles as proposed by Guimerà and Amaral [
22] and STM to establish topics are a recent trend in the scientometric field. One direct method to identify emerging research domains and topics in these domains is an expert-based approach. However, this procedure can often suffer from some difficulties, such as (1) the amount of information recently increasing fast, making it hard to capture the entire knowledge structure of an area; (2) expert-based approach knowledge is time-consuming; and (3) many emerging fields do not have a generally accepted definition [
25,
26,
27,
28]. Computational-based methods, such as the STM, are compatible with the scale of information. Therefore, they are expected to complement the expert-based approach, helping the researchers deal with the large volume of data. Topic modelling techniques are machine learning methods that automatically examine text data to identify word clusters for a collection of texts. Because it does not require a pre-existing list of tags or training data that humans have already classified, this type of machine learning is known as “unsupervised” [
28]. To our knowledge, this type of analysis has not previously been performed in the green finance field, nor has this combination of methodologies been jointly applied to analysing literature trends. This mixture of methods allows the researchers to organise academic documents while allocating the most influential documents into common topics.
Despite the lack of an established definition, the objective is not to define the term but to explore and understand the field’s heterogeneity. Some up-to-date definition efforts and previous attempts to comprehend the field are presented in
Section 2, and detailed descriptive bibliometric data are available in
Supplementary Materials. We made available a GitHub repository with all the R scripts and a link to the results report, which contains details about the methodology, descriptive bibliometric data, and software details. The data used in the present study and the methodology are described in
Section 3.
2. Literature Background
The analysis of the green finance field is still under construction. Despite the variation of terms and definitions, a significant portion of the explanation efforts has a typical definition core, considering green finance as a set of multiple financial instruments and policies to promote sustainable development involving financial and non-financial institutions. The Handbook of Green Finance, for instance, defines the term as “[...]new financial instruments and new policies, such as green bonds, green banks, carbon market instruments, fiscal policy, green central banking, fintech, community-based green funds, etc.” [
3], p. 5).
The banking sector is also attempting to specify the term, as explained by PwC: “[green finance] is defined as financial products and services, under consideration of environmental factors throughout lending decision-making, ex-post monitoring and risk-management process, provided to promote environmentally responsible investments and stimulate low-carbon technologies, projects, industries and business” ([
29], p. 15).
Within this broader perspective, some definitions focus on the availability of the investment to transition energy infrastructure: “[green finance] is essential in financing renewable and green energy projects to reduce carbon emission and its negative health impacts, develop climate-resilient infrastructure for cities and ensure environmental sustainability” as pointed out by (Taghizadeh-Hesary and Yoshino [
30], p. 5).
Lindenberg [
31] proposed the division of green finance into three main categories: (i) financing of public and private green investments (infrastructure), (ii) financing of green public policies, and (iii) financial instruments. This division acknowledges the broader aspects of green finance that make categorising it difficult. Nevertheless, recent literature has endeavoured to organise this emergent theme.
A collection of bibliometric studies has explored the field lately. Zhang et al. [
32], employing 381 papers selected from the Web of Science database, focuses on the leading journals, authors, their countries of origin, and collaborations in this literature, offering a comprehensive perspective on the field. The main findings reveal that authors from developed countries dominate the literature. Furthermore, publications are mainly placed in policy journals or journals focusing on environmental and climate change. The authors spotlight the interdisciplinarity of the field and the lack of attention it receives from mainstream economics and finance journals.
Wang et al. [
33] examined 815 articles from the Web of Science database from 2008 to 2020. Beyond a descriptive analysis that uncovered similar results to Zhang et al. [
32], the authors explored the implications of green finance literature for energy policy. Intending to identify critical policies emerging from the literature, the authors identified carbon tax policy, government subsidy policy, green bond policy, and green investment policy as the main policy recommendations within the publications. The authors also emphasised that green bonds have been a hot issue in the field.
Bhatnagar and Sharma [
34] analysed 666 articles in the Scopus database from 1997 to 2021. The authors reinforce the strong presence of developed countries in the sample, underscoring the recent emergence of the developing world with the protagonism of China and India; these results were also identified by Desalegn and Tangl [
35]. The authors also propose the identification of green finance’s enablers from recent articles (2018–2021), underlining the role of financial policies and regulations in boosting investment in green policies.
Naeem et al. [
36] is one of the first systematised attempts to explore the most influential topics in the field. Using bibliometrics allied with network analysis and scientific mapping methods, the authors explore the influence of documents and sources by citation indexes and listing relevant topics and subtopics by keyword analysis clustering. The authors also highlight that a further research avenue in exploring the green finance field would be using metadata, topographic view, and further scientometrics analysis.
While it is possible to identify a growing descriptive exploration of the field in terms of the most productive and cited articles, sources, countries, and even collaboration between authors and countries, an organised review of the main groups and influential topics still needs to be further explored. This article intends to diminish this literature gap by combining the proposed methods presented in
Section 3.
3. Data and Methodology
The methodology consists of a bibliometric analysis approach associated with computational methods [
25]. A broad definition of the bibliometric methodology is the quantification of bibliographic information for use in analysis or even “the use of statistical methods in the analysis of a body of literature to reveal the historical development of subject fields and patterns of authorship, publication, and use” [
37]. Although its use as an analysis instrument is recent, the bibliometric approach has progressively gained momentum, especially with the emergence of big data.
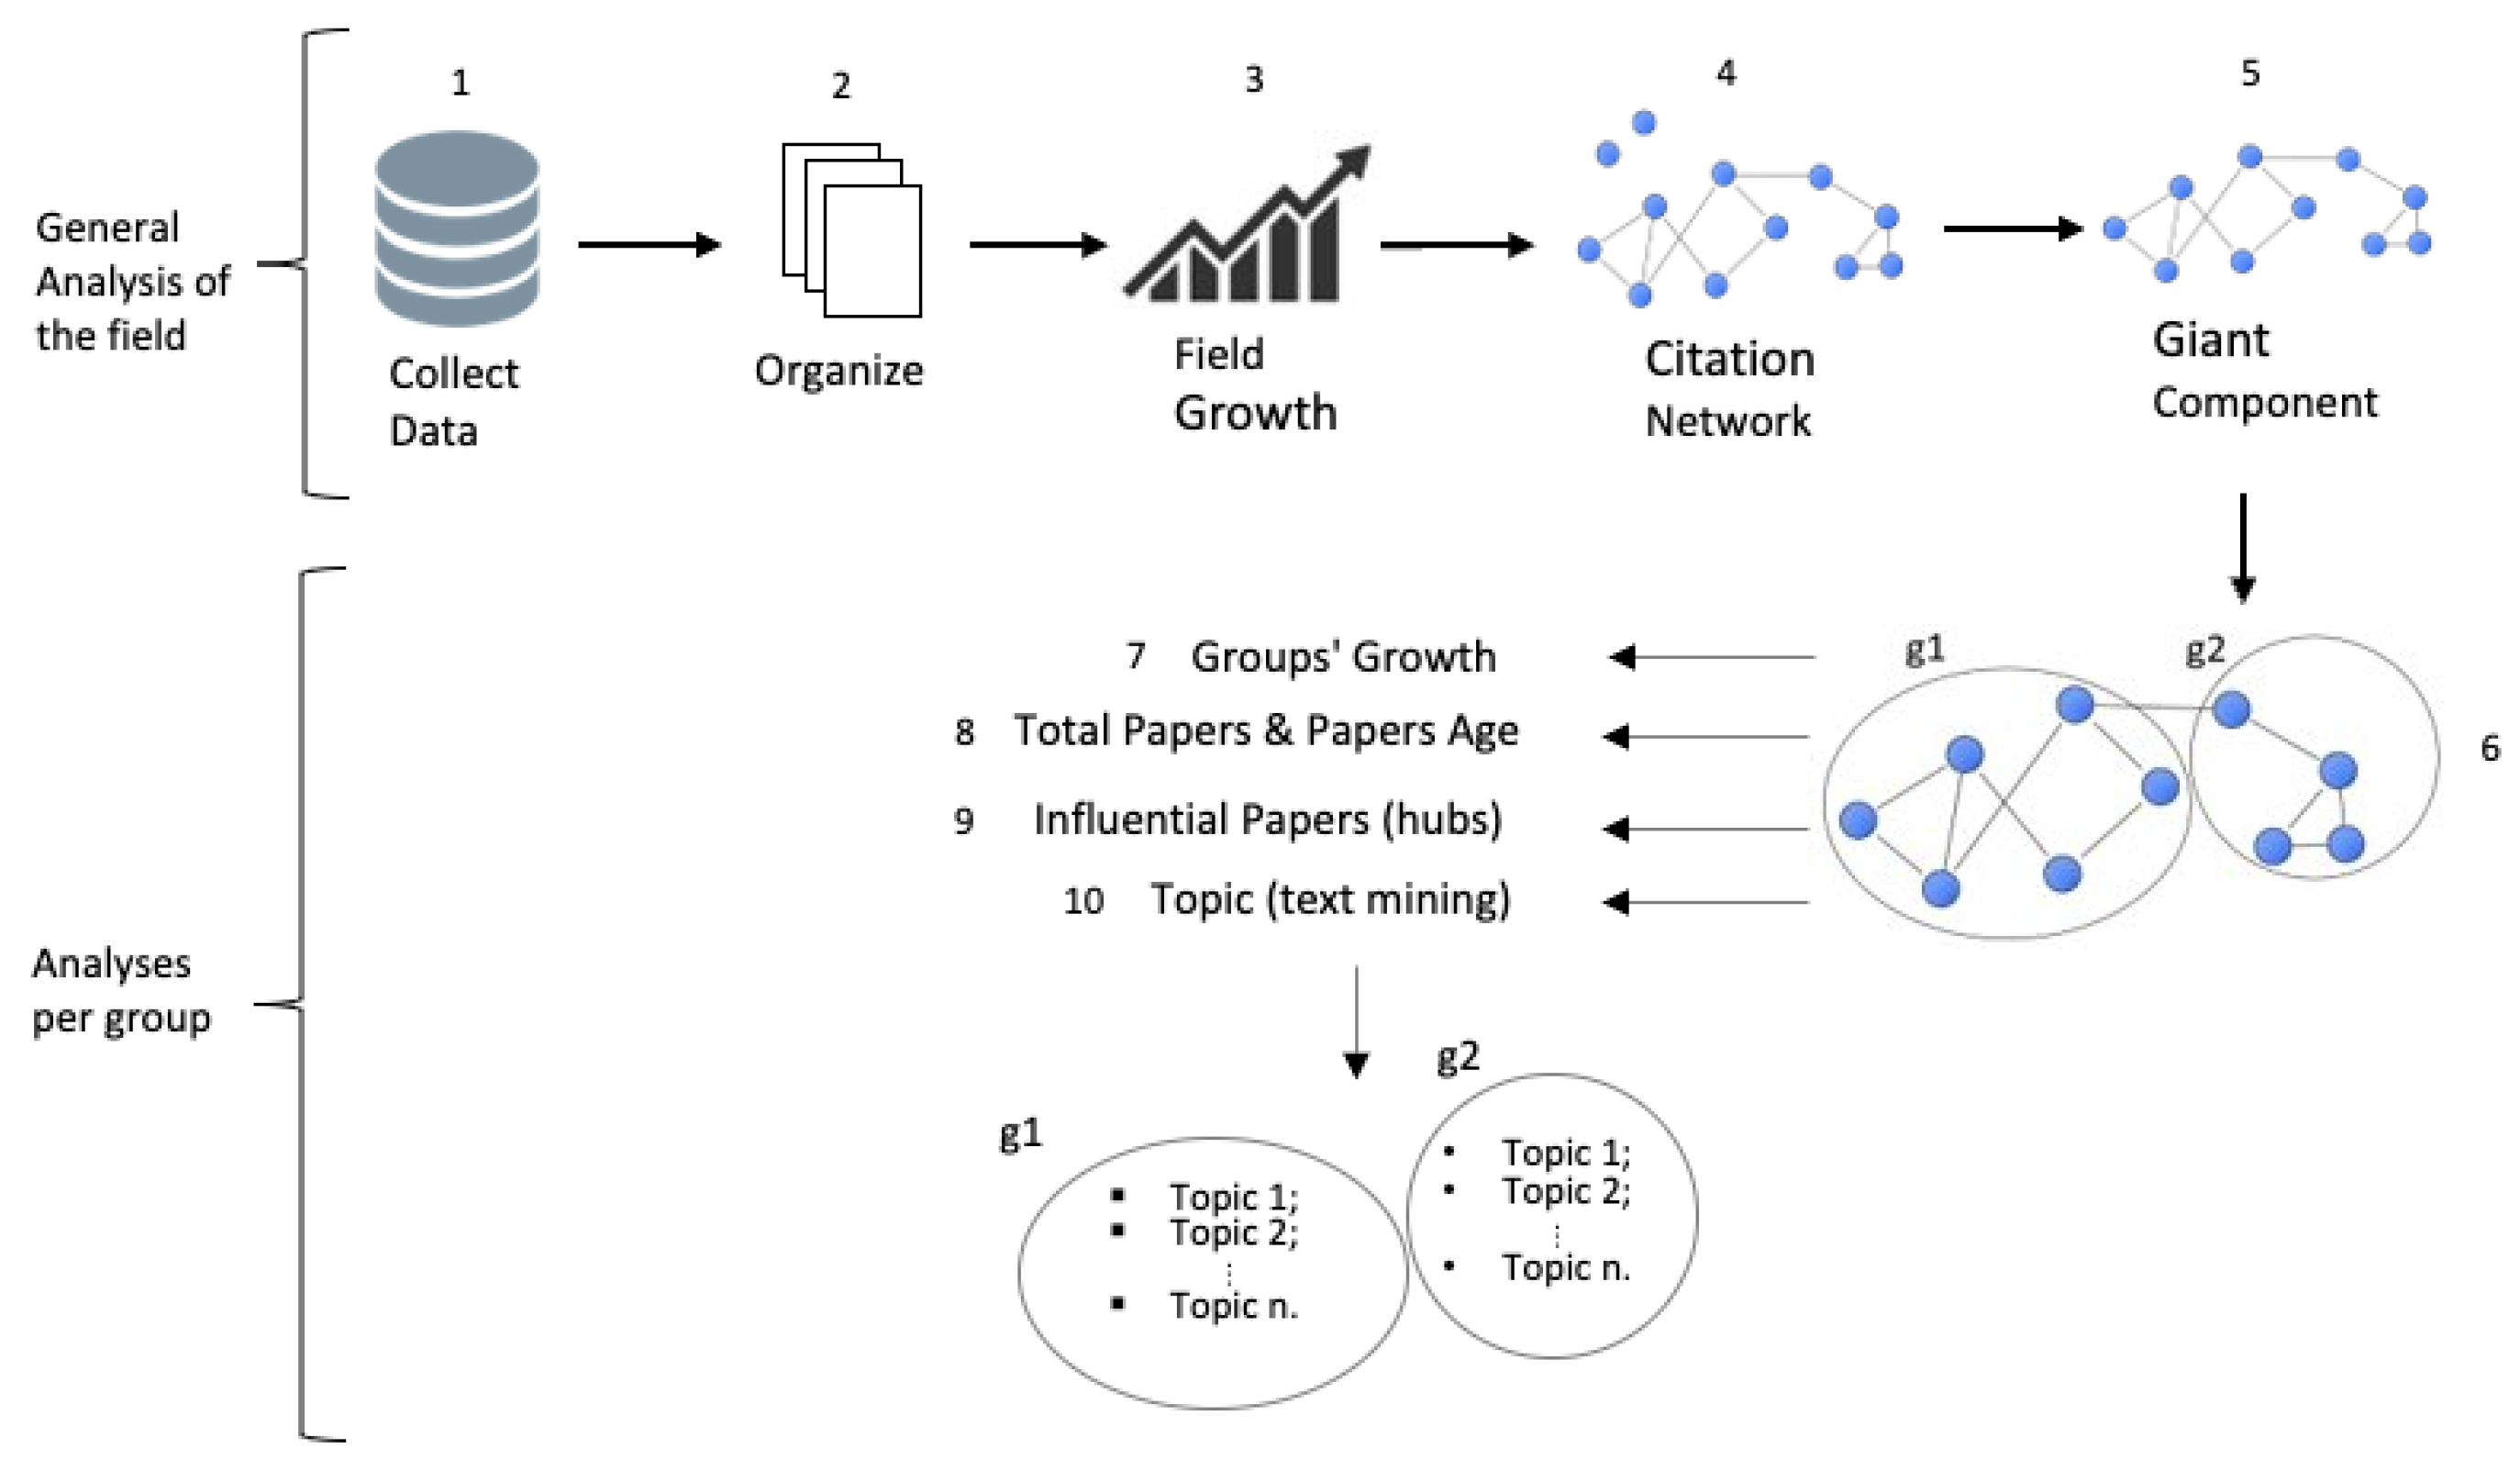
Figure 1 illustrates the methodological steps of the analysis.
R and its packages were the software instruments applied in the analysis [
38]. The packages Bibliometrix [
39], igraph [
40], and stm [
41] were used for the bibliometric analysis, organisation of data, network analysis and topic modelling, respectively. The VosViewer software rendered images of the network [
42]. The steps are guided by the main research questions previously mentioned.
3.1. Collecting and Organising Data: Step 1 to Step 3
Step 1 of the methodology involved collecting the data, and step 2 concerned organising it. Therefore, green finance and standard terms extracted from reports, handbooks, and previous articles were queried. The resulting keywords were green finance, climate finance, carbon finance, sustainable finance, and their variations. The search was limited to peer-reviewed articles, article reviews, books, and chapters published and indexed in the Scopus database as presented in
Table 1. This exploration resulted in 3663 documents in the first sample. The data were collected from the Scopus database through the Bibliometrix package, where it could also be organised as a bib extension document.
Step 3 consisted of the first exploratory analysis of the raw data concerning the dynamics of this scientific field. de Solla Price [
43] pioneered the study of scientific literature dynamics and identified exponential growth as an essential characteristic of this type of data. The growth rate of the green finance field was calculated with an exponential growth model to examine the trajectory of this literature over the past decades and compare it to science as a whole [
44].
3.2. Complex Network Analysis: Steps 4 to 8
Step 4 applied bibliographic coupling. Bibliographic coupling is an established measure of similarity used to analyse complex networks, as is the case in emergent research literature [
24]. It was first proposed as a method for detecting potential topical affinities among research publications [
20]. This measure considers two documents as similar when they commonly cite a third work in their bibliographies, which means they are coupled. The use of bibliographic coupling in emergent literature is relevant because this method highlights the most recent [
24].
After the literature was coupled, step 5 was to maintain only the giant component of the network, i.e., the isolated documents were excluded [
45]. After this process, the final sample contained 3275 documents. This robust process does not require manual checking. All the isolated or thematically unrelated documents from the first sample were excluded through coupling and giant component filtering.
From the giant component, we entered step 6, which initiated the analysis per group. Group specifications took place in this step using the Louvain algorithm, through which results were obtained by similarity [
46]. Step 6 constituted the identification of existing groups in the field based on the previous steps. Steps 7 and 8 involved the initial analysis of these groups by their growth rate, as well as total papers and paper age; this analysis is presented in
Section 5.
3.3. Topological Measures by a Hub Analysis: Step 9
Next, a hub analysis was conducted to identify each document’s degree of relevance and role in the network, including within its group and among groups (network-wide) [
22]. This approach, originally used to deal with complex network topologies in biological phenomena, is based on the idea that nodes with the same role should have similar topological properties. This within-cluster degree is used in complex network analysis to deepen the knowledge of emerging research. This method heuristically defines seven different “universal roles”, three of which are related to hubs’ roles in the network. The degree
measures to what extent the
i vertex is connected to the other vertices in the same group
s, which indicates how “well connected” node
i is to other nodes in the group. It is calculated as:
in which
is the number of connections of vertex
i to other vertices in its group
(number of citations of each document within its group), while
is the measure of
k on all vertices in
(number of citations of each document within the network as a whole), and
is the standard deviation of
k in
. The degree of relevance
of a vertex in the group is high if the number of connections of the vertex in the group is high. A well-connected vertex (i.e., article) is a prestigious article capable of influencing its group or the whole network.
The participation coefficient
among groups shows the degree to which the connections of vertex
i are distributed among different groups
. This coefficient is obtained by:
where
is the number of connections of the vertex
i to other vertices in its group
,
S is the number of groups, and
is the total degree of vertex
i, that is, the number of edges that the
i vertex holds (number of citation in all the network). When the participation coefficient
is close to one, it indicates that the vertex’s connections are distributed evenly among all groups. When it is close to zero, all connections are within one group [
22].
Equations (
1) and (
2) are applied to the networks and heuristically defined seven different rules, illustrated in a parameter space. The classification established by the authors suggests that the vertices with
are hubs, while the vertices with
are not considered hubs [
22].
3.4. Structural Topic Modelling within the Groups: Step 10
In addition to identifying the existing groups in the literature and distinguishing the most prestigious articles within those groups, it is also possible to recognise the heterogeneous topics that compose each particular group through the advanced methodology of structural topic modelling (STM). Topic modelling is a type of text-mining used to discover the “hidden” thematic structure of an extensive archive of documents [
47].
The STM modelling technique was developed in the interdisciplinary domains of statistics, computer science, machine learning, and computational linguistics and has recently been introduced to the topic modelling family [
48]. STM is a collection of statistical methods for textual data analysis built as an extension from latent Dirichlet allocation (LDA) [
47]. Distinctly from LDA, STM is considered a soft topic modelling approach, meaning that a document can be part of more than one thematic structure, an essential characteristic to social sciences and humanities. For this reason, it has been used by various political science and linguistics studies [
49,
50,
51,
52].
The results of a topic model analysis with LDA and STM typically reveal the topics, high-probability words associated with each topic, and topic proportions in each document. The topics are selected by using the high-probability words in each topic. Similar sets of words occurring repeatedly may likely indicate topics. In the green finance field, for instance, the word energy can be produced from a high-probability group containing development, emissions, and growth.
The number of topics analysed depends primarily on two measures: (i) semantic coherence, which reflects the fact that a topic’s high-probability terms tend to occur together across documents under analysis [
41]; and (ii) the exclusivity of topic terms, which dictates that high-probability terms in one topic should not overlap with high-probability terms in other topics and that high-probability terms should be unique and exclusive to one topic [
53]. The description of the topic decisions can be found in the
Supplementary Materials.
In step 9, STM was used to identify topics and in which topics the hubs were located for each group. This investigation allows the determination of the most prestigious and influential, as well as the peripheral topics for each group. In soft clustering, documents can belong to more than one topic, indicated by percentages (gamma) belonging to each topic.
Due to the extensive number of hubs and to characterise them thematically, we identify and present the ones that were more than 70%
relevant to a specific topic, which means that it was mainly representative of the respective topic. Only the topics containing hubs were further explored in the present study. This analysis is present in
Section 5.
4. Main Results: General Analyses of the Field
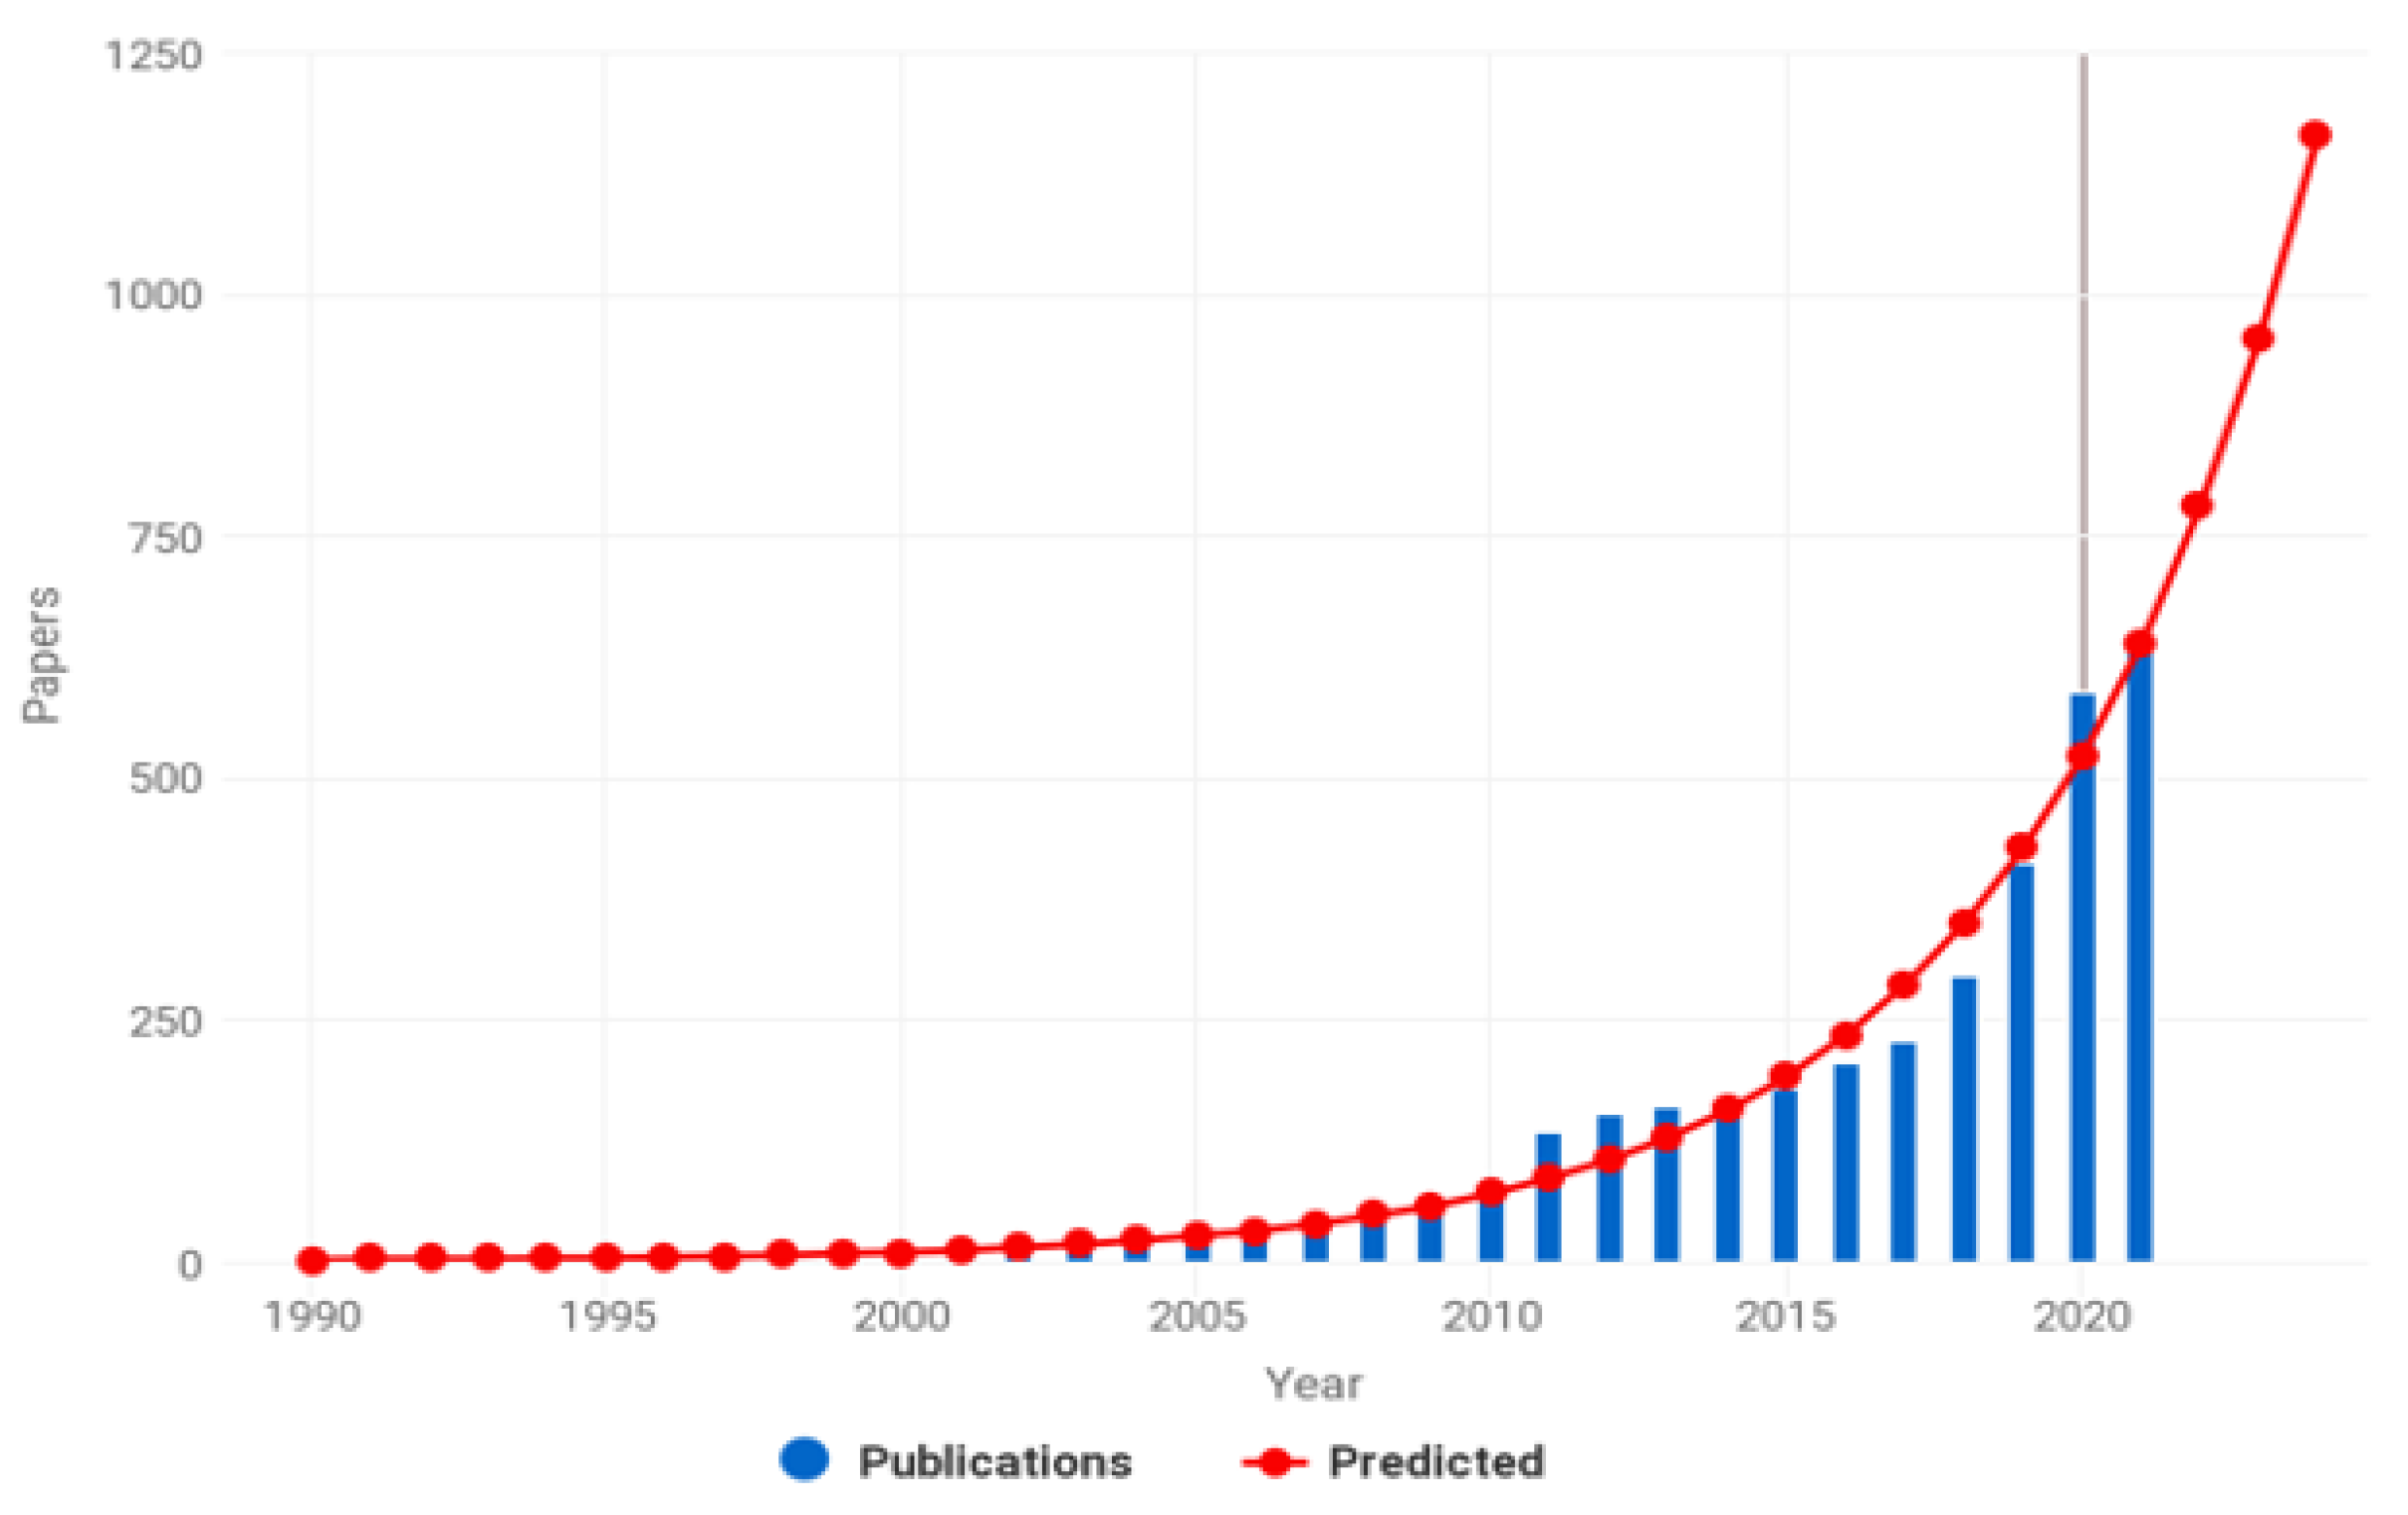
From 1990 to 2020, the growth rate of the green finance field was 22%, with the absolute number of publications doubling every 3.4 years. Comparing this rate with the publication growth across the whole Scopus database as a proxy of science growth for the same period, science as a whole grew by 5.5% and doubled, on average, every 13 years. From this perspective, it is possible to affirm that the green finance field is emerging as a prominent thematic field and is growing more rapidly than science in general.
Figure 2 also presents the predictions for the following year that show an expected exponential growth of the field. Estimation statistics can be found in
Appendix A.
The field was incipient at the beginning of 2000 and gained some consistency from 2005. This year coincides with the outset of the Kyoto Protocol. Created in 1997, the Protocol was submitted to a complex ratification process, only entering into force on 16 February 2005. This was a crucial step in climate commitments, setting binding targets to developed countries (known as Annex I Parties) to limit or reduce greenhouse gases emissions. Policy mechanisms should be set to achieve the emissions reduction targets in the “first commitment period” (2008–2012). The developed committed countries should not only undertake domestic policies and measures but provide additional financial resources to improve the implementation of policies in developing countries [
54].
From the end of 2010, the field’s growth enters a new level. This period corresponds to the last year of the Kyoto Protocol, starting a phase of assessment analysis of the Protocol in the years following. From 2010 to 2015, many important events took place, such as the creation of the Green Climate Fund by the United Nations Framework Convention on Climate Change (UNFCCC) in Cancun, the end of the Kyoto Protocol in 2012, and the Paris Agreement in 2015, that replaced the Kyoto Protocol. Additionally, in 2015, the 2030 Agenda for Sustainable Development was launched, substituting the Millennium Development Goals (MDGs) for the Sustainable Development Goals (SDGs). A more cooperative effort to tackle climate change and reach developing goals began with the active participation of developing countries, not only depending on the developed world measures but adjusting themselves to national actions registered by the Nationally Determined Contributions (NDCs). The NDCs “are national climate plans highlighting climate actions, including climate-related targets, policies and measures governments aim to implement in response to climate change and as a contribution to global climate action” [
55].
5. Main Results: Analyses per Group
The methodology presented in
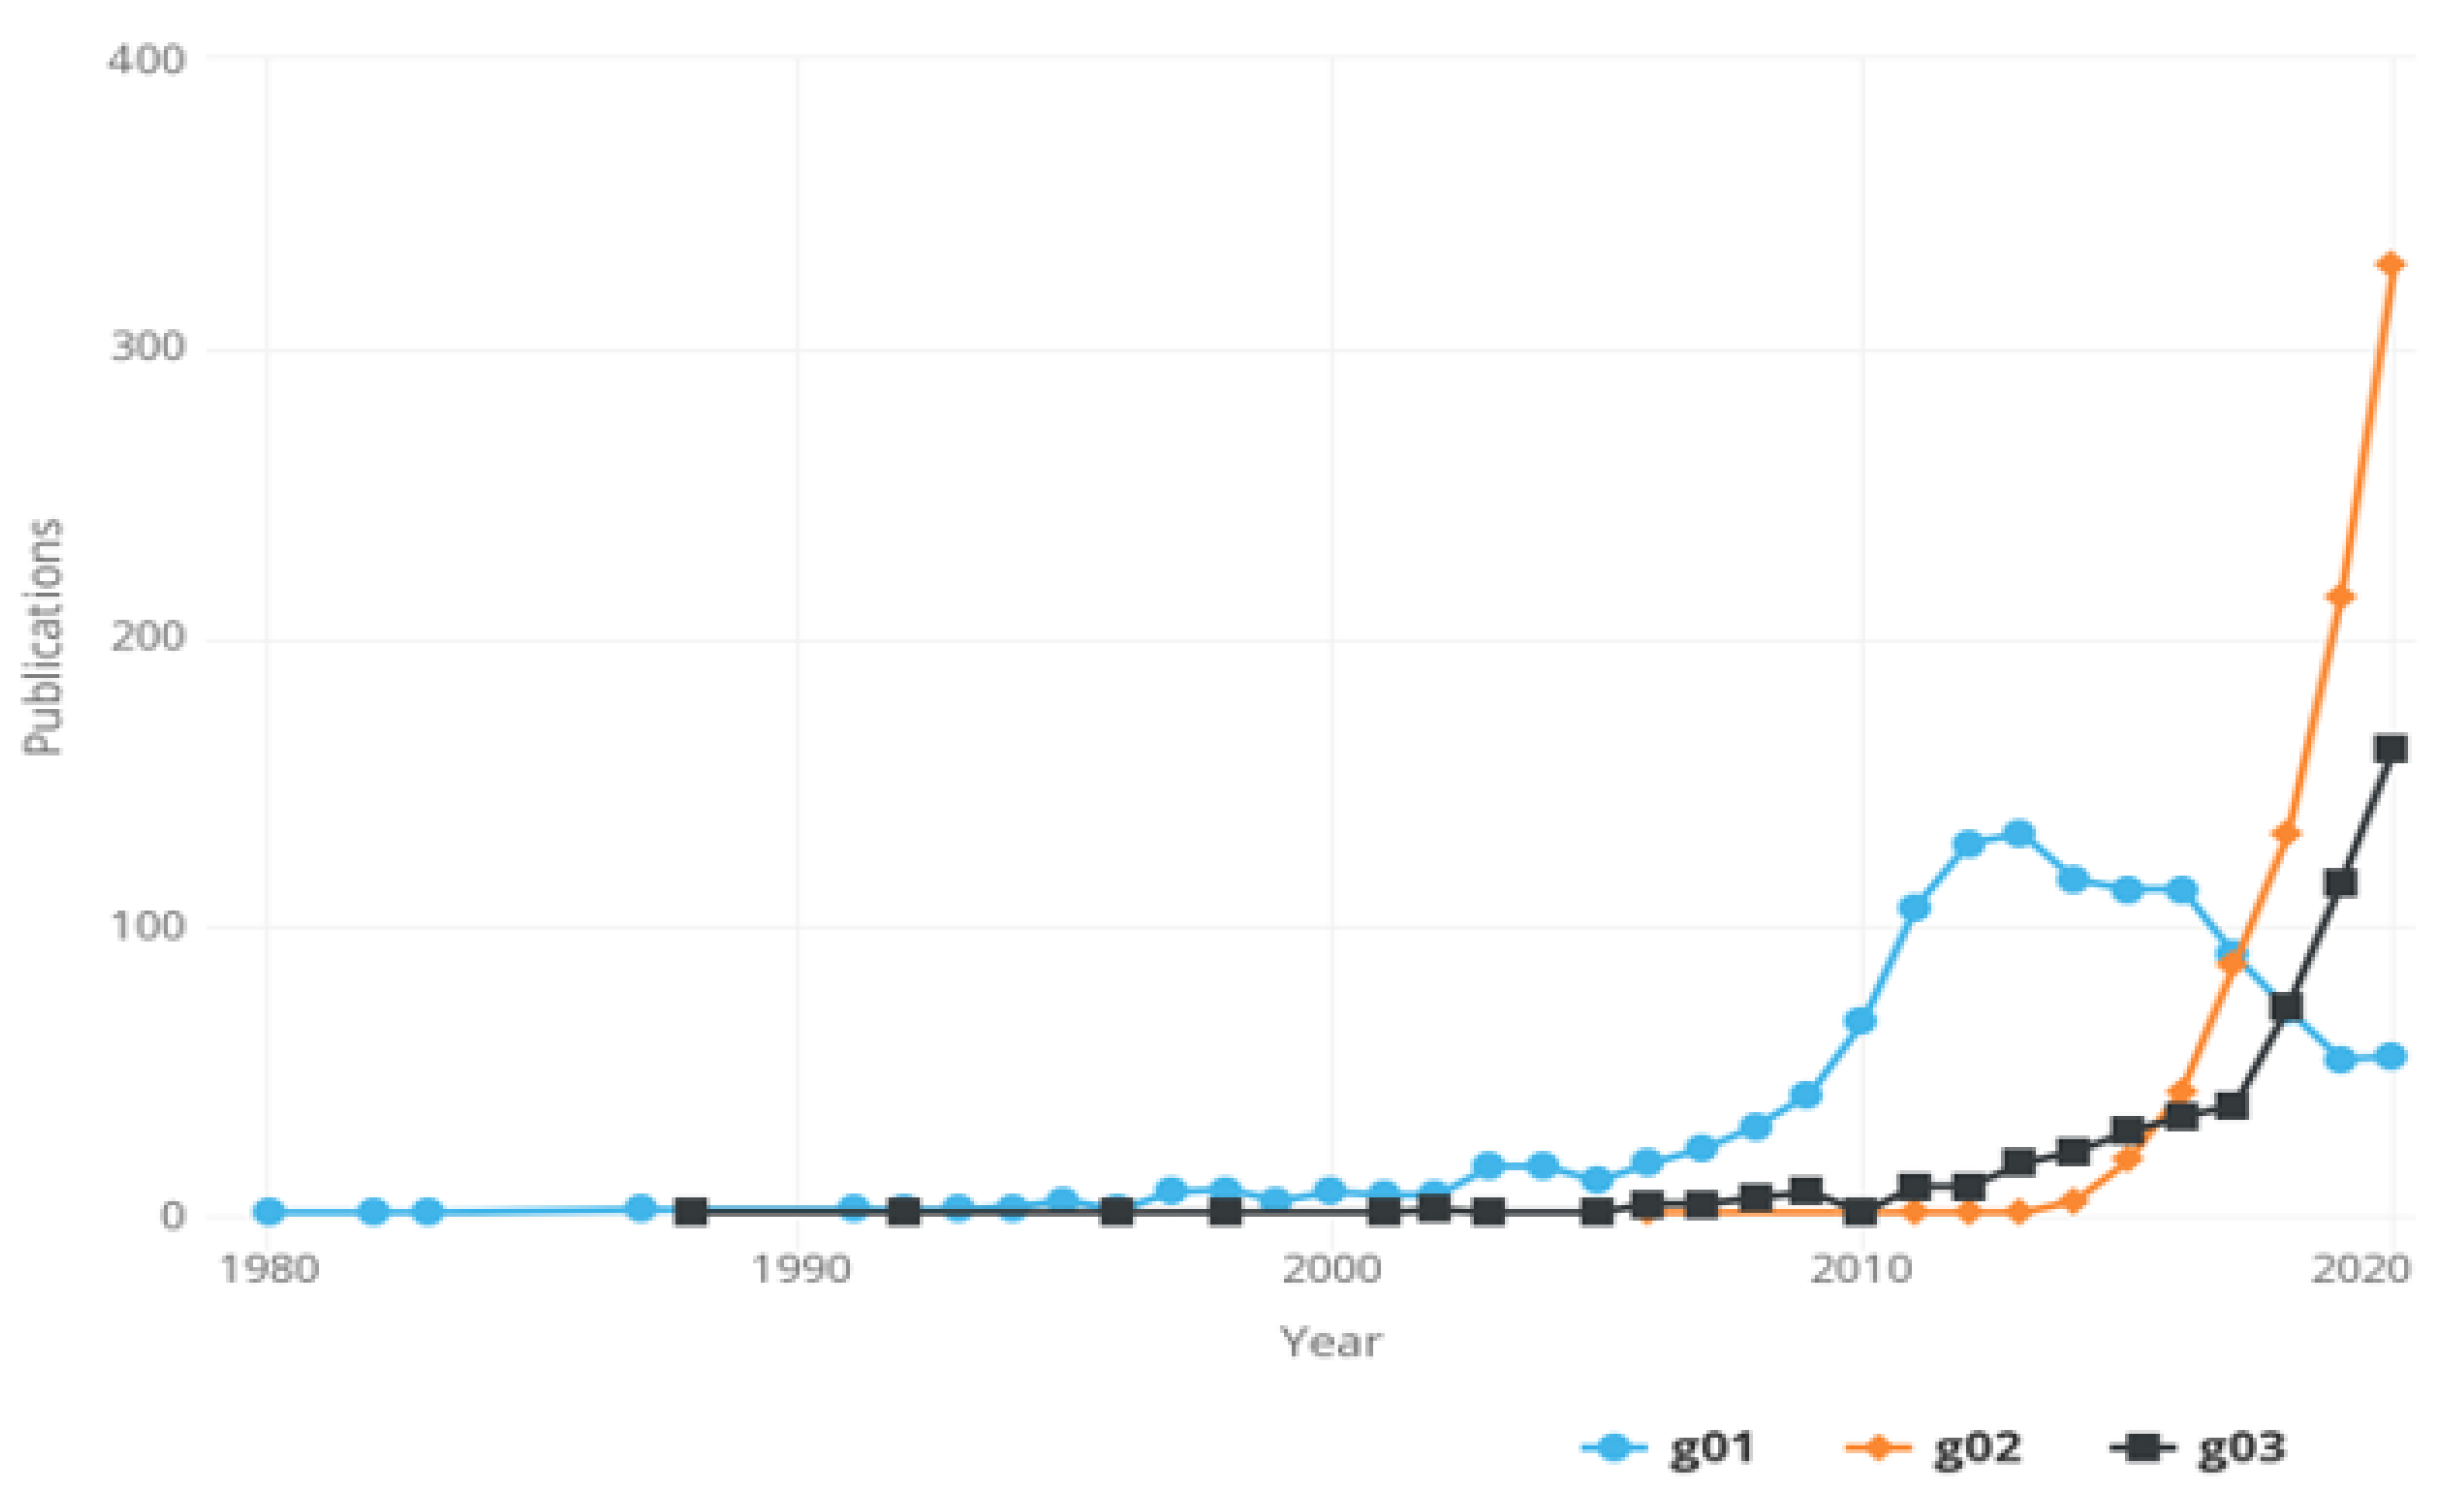
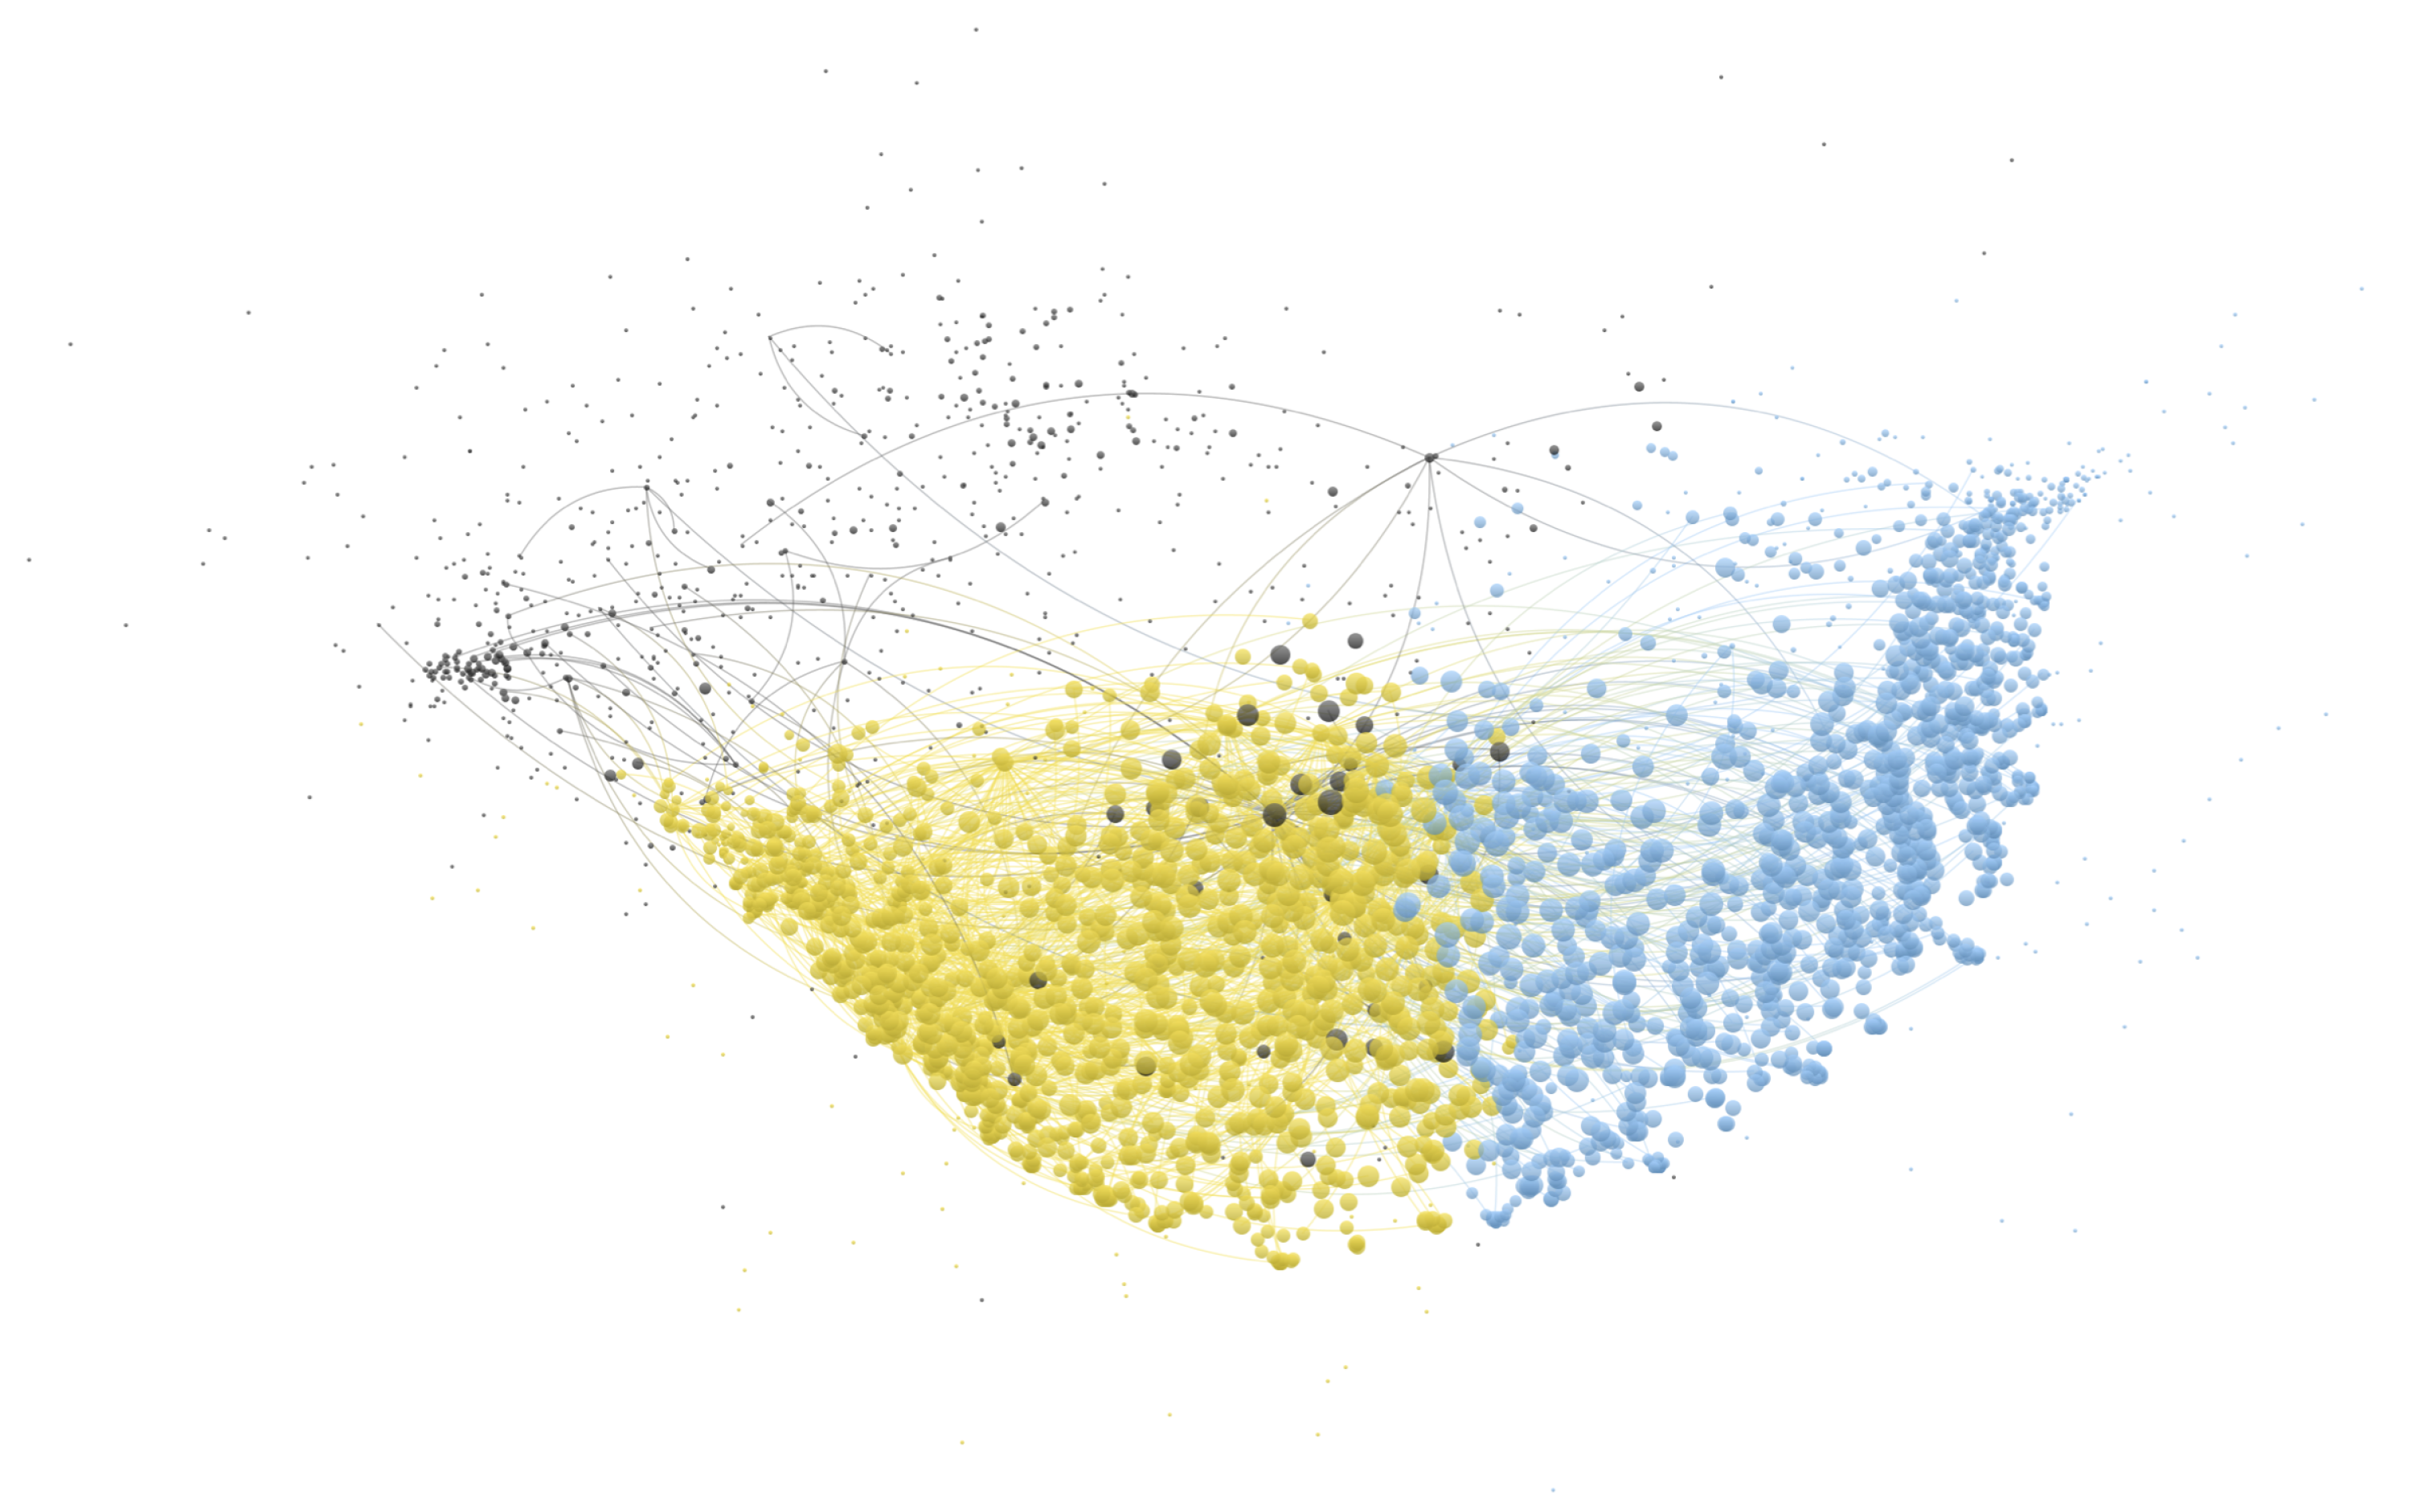
Section 3 was applied to identify the potential emergence of groups in the sample, composed of all the papers and reviews indexed in Scopus until 2020. Three groups were found through similarity, as described previously In other words, if two documents reference a common third document, they are coupled. Three groups emerged through clustering: Group
g1 (blue), Group
g2 (orange), Group
g3 (black), as illustrated in
Figure 3, which also shows the evolution of each group. The plotted network is provided in
Figure 4.
Table 2 presents the number of articles, average article age, and growth rate of each group. Two groups have demonstrated significant recent growth: Group g2 from 2013 and Group g3 from 2012. The sharp decline of g1 from 2013 is also noteworthy. After seven years of expansion, g1 began demonstrating a strong negative trend. The number of articles in each group and their maturity also differ considerably. G1 is a more mature group whose average article was published between 2012 and 2013, meaning that it includes fewer recently published articles. In contrast, G2 is a newer group whose average article was published in 2019 and has demonstrated an impressive volume of recent publications (329 articles just in 2020). G3 appears to have potential but is still under development regarding its number of papers, its average article age, and its strong growth rate.
Table 2 also presents the resulting hub analysis. The more mature group (g1) contains the majority of influential articles, followed, respectively, by g2 and g3. The following subsections will explicate these results in terms of influential topics within each group.
5.1. Group 01
Interestingly, in g1, presented in
Table 3, the most frequent topic (represented by gamma) is also the most prestigious, which can not necessarily be true. Topic g1T4, “mitigation and adaptation global climate finance/funds to developing countries”, is the most prestigious topic in the group and contains almost all of the hub articles. Other, more specific topics, such as “climate finance and energy investments in developing countries” (g1T5) and “social and environmental risks in finance projects” (g1T9), are also influential topics in this group.
As an established and mature group, g1 plays an important role in the network, comprising half of the most prestigious network hubs. Accordingly, g1 influences the other existing groups and themes. For instance, the “mitigation and adaptation” topic also appears in the other groups, albeit at a lower scale, from different perspectives. Despite the decline of new papers, this group continues to play a substantial role in the green finance field.
5.1.1. Mitigation and Adaptation Finance to the Developing World (g1T4)
The presence of political proposition papers relevant to the Kyoto Protocol and the strong interdisciplinarity of the field characterise this topic. The rich presence of political journals, such as
Climate Policy and
Global Environmental Policy reinforces this normative aspect. Since the Kyoto Protocol, the funding of climate-sensitive policies in developing countries has been central in international conferences and negotiations. A demonstrative of this significance is the deliberation of a specific “loss and damages” fund to developing countries in the United Nations’ 27th Conference of the Parties (COP27), after more than 20 years of back-and-forths [
73]. The hub articles of this group analyse numerous aspects of this topic. For a more explicit representation of these characteristics, we subdivided the g1T4 topic into the following subtopics:
Based on results from survey-embedded conjoint experiments from the United States and Germany, Gampfer et al. [
58] explore which institutional design features are likely to accumulate more public support for climate funding among citizens in crucial developed countries. They found that the recipient countries do not play a significant role in shaping the public support of potential donors in the analysed countries and that the most influential factor seems to be the freedom of the donors in the decisions on funding allocation. Furthermore, the study shows that recipients that favour compensation mechanisms without contributing to mitigating the global public good are unlikely to attract meaningful support. Analysing the “private climate finance” deeply, Stadelmann et al. [
69] proposes an explicit definition of what can be considered climate-related private resources flowing from industrialised countries to the developing world. Mainly from the Copenhagen Accord and Cancun’s Agreement, it became crucial to trace and report the increasing amount of resources to guide policies and provide transparency in the international negotiations, as well as to guarantee that the developing world is receiving the finance required to promote climate resilience and low-carbon transition. Halimanjaya [
68] analyses, for instance, what characteristics from the receivers influence the most the allocation of mitigation finance. The author concludes that developing countries tend to be selected as recipients of climate mitigation finance and to receive more if they have higher CO
2 intensity, a larger carbon sink, lower per capita gross domestic product (GDP), and good governance
Regarding aspects of fairness, Pickering et al. [
62] investigate, through quantitative scenarios, how different degrees of international coordination influence the fairness and adequacy of the global financing effort. The authors conclude that a mix of a top–down and bottom–up approach, combining nationally determined financing pledges with robust international review mechanisms and international measures, is the most effective coordination design. Pittel and Rübbelke [
60] consider the potential role of current international support of mitigation and adaptation projects in developing countries in raising fairness perception. They analyse how induced fairness effects might influence international negotiations on climate change mitigation. The authors conclude that developing countries are more prone to adopt an agreement with adaptation support that seeks to correct perceived unfairness associated with the unequal distribution of individual countries’ past contributions to global warming. Additionally, Grasso [
66] points out that raising adaptation funds should be carried out according to the responsibility for climate impacts.
Finance flows allocation characteristics and climate justice
The hubs from this subtopic rely primarily on the characteristics of resources allocated in developing countries and their effects on climate justice.
In the international arena, Abadie et al. [
56] investigate the leading preference of mitigation over adaptation flows in the international climate finance after Cancun’s Agreement, identifying many rationales for decision-making in the private and public sectors. According to the authors, one explanation of the mitigation bias is the lack of standardised outputs of adaptation projects, which negatively affects the measurement of public disbursement of funds in the public sector. Stadelmann et al. [
63] attempt to examine what the term “new and additional climate finance”, stated by Kyoto Protocol, properly means. The authors conclude that a meaningful and effective baseline must meet the following criteria: originality, additionality, equity, acceptability, transparency, and compatibility with existing regimes. This conclusion is based on texts on climate negotiations and academic literature.
Barrett [
61,
64,
70] analysis climate justice from a local perspective, exploring the allocation of climate finance by an interdisciplinary approach. Barrett [
64] identifies distribution paths to the most vulnerable states, districts, and communities. The author identifies that international adaptation finance transfers reveal whether the most climate-vulnerable states are receiving assistance indicating that the distribution of the most climate-vulnerable regions will indicate the continuation of climate justice as a multi-scalar process. Barrett [
70], analysing informal practices from Malawi, shows a tangible impact of adaptation finance relative to these practices across southern and eastern regions of the country. Moreover, the author reveals that adaptation finance villages address more climate risks and consistently elicit more outstanding agency, security, and a more sustainable lessening climate vulnerability. Incrementally, Barrett [
61] discovered that, at the time of implementation, adaptation financing was effective in lowering climate risk. However, for adaptation funding to be adequate, it must be available in risky areas. This article further evidences that the neediest regions receive disproportionately less adaptation financing.
5.1.2. Climate Finance and Energy Investments in Developing Countries (g1T5)
The second topic containing hubs, identified by the methodology (g1T5), is characterised by analysing the use of climate finance for energy investments in developing countries and its importance for adaptation measures and social development of the most vulnerable areas. Its representative hub, Chirambo [
71], provides insights into how to enhance energy infrastructure on the African continent. The author points out the importance of improving energy services in Africa as a way to reduce poverty and achieve Sustainable Development Goals (SDGs) in the region. The energy sector in the continent can be a crucial channel to support job creation and economic growth, as well as provide affordable, accessible, and reliable domestic and industrial energy. Furthermore, the author highlights the vital role of foreign direct investment, primarily through climate finance routes, and likewise the need for formal institutions and instruments, mentioning the Clean Development Mechanism (CDM) as a possible path.
5.1.3. Social and Environmental Risks in Finance Projects (g1T9)
The third topic identified (g1T9), the representative study, Scholtens [
72], examine the social responsibility policies, the conduct, their main firm characteristics, and the financial market performance of the banks that adopted the Equator Principles (EP). The EP were initially adopted in 2003 by 10 financial institutions and currently comprises 138 institutions in 38 countries. They consist of banks’ policy frameworks to guide meaningful project finance lending decisions. The (EP) are intended to serve as a common baseline and risk management framework for financial institutions to identify, assess and manage environmental and social risks when financing projects. The banks use these guidelines to evaluate how a project will impact society and natural resources. Despite the critics around the EP, analysing 50 financial institutions, the authors found a significant difference between the social, ethical, and environmental policies of adopters and non-adopters, highlighting that EP has served as a signal of responsible conduct.
5.2. Group 02
Group g2, presented in
Table 4, is more diverse than g1. It has demonstrated strong growth, especially since 2010, and its most influential topic is the “assessment of mitigation and adaptation of global climate finance to developing countries”, reflecting an evolution of a similar theme of g1. This topic concerns assessing global climate policies and funds oriented to developing countries to enforce mitigation and adaptation projects, including the advances in international cooperation from the Paris Agreement.
Another influential and very recent emerging theme is “climate change policies and related risks to the financial system”, which focuses on the potential destabilisation risks posed by climate and transition policies to financial systems and the real economy.
Other influential topics appear in the sample and are represented by one hub each. “financial development and carbon emissions” and “green bond market”. The last two topics containing one hub each are “Financial development and carbon emissions” and “Green bond market”.
5.2.1. Assessment of Mitigation and Adaptation Finance/Funds to Developing Countries (g2T4)
This topic is a continuation of the g1T4, with a deepening of the g1’s topic, including new studies making assessment analysis of previous policies and agreements and examination including new perspectives from the Paris Agreement. Weiler et al. [
74] analyse how developed countries assign adaptation resources to developing countries. Their findings indicate that a country’s physical vulnerability significantly impacts the amount and type of adaptation aid it receives. The other aspect of vulnerability, the adaptable capacity, seems not to be a significant factor in adaptation aid distribution. The authors also underline that poorer countries are more inclined to receive adaptation funds and that good governance and donor trade interests also play a role in determining who receives it and the amount of resources. In previous work, Betzold and Weiler [
75] also found, analysing OECD bilateral adaptation aid data from 2011 to 2014, that physical vulnerability matters and points out that countries that are more exposed and vulnerable typically receive more adaptation aid from all donors combined.
Samuwai and Hills [
78], from another point of view, examined the “readiness” of climate finance receivers. Readiness is commonly considered to be the process of increasing developing nations’ capacities to accept and use climate financing wisely, as well as report its implications. Since it is viewed as a requirement for access to reliable and high-quality climate finance, readiness has become, according to the authors, a widely used term in the global discourse on climate finance. Focusing on Asia-Pacific countries’ Climate Public Expenditure data, they highlight that readiness affects how much climate financing is accessible in a predictable but minor way. They also show that more than increasing readiness alone is required to unlock climate funding since other measures tend to impact significantly.
In the Paris Agreement, countries committed themselves to setting a route towards low greenhouse gas emissions and climate-resilient development. Roberts and Weikmans [
76] emphasises that no globally accepted accounting standards so far allow comprehensive evaluations of this goal or any relevant comparisons of country performance. Instead, the authors recommend that distinct definitions and measures be defined for the various forms of climate funding. They suggest two accounting approaches: (i) monitoring if commitments are being fulfilled and (ii) if there is a global reallocation of resources from fossil fuels to renewable energy. Within the same standpoint, Donner et al. [
77] uses the historical database of overseas development assistance projects from Oceania to test the effect of different accounting assumptions on the delivery of adaptation finance to the developing countries of the continent. Their findings indicate that by 2008–2012, explicit adaptation finance had increased in Oceania to a 3–4% level. However, this amount can significantly vary depending on assumptions about what constitutes adaptation. The authors also conclude that better metadata and accounting methods are crucial to track climate finance properly.
5.2.2. Climate Change Policies and Related Risks on the Financial System and Real Economy (g2T7)
This topic represents an early and more substantial presence of economics and finance in the green finance field until recently, characterised by the massive analysis of international climate finance for developing countries. The oldest hub corresponding to this topic dates from 2016 [
79].
Dietz et al. [
79] show how an Integrated Assessment Model (IAM) can be used to estimate the impact of 21st-century climate change on the present market value of global financial assets. Using an extended version of the DICE-2010 model from Nordhaus [
87], the authors show that the expected ’climate value at risk’ (climate VaR) of global financial assets is currently around 1.8% in business-as-usual scenarios. Nevertheless, much of this risk is on the tail of the distribution, which means that the climate VaR can be much worst than the representative estimation. Cutting emissions is related to diminishing this risk, which is even more critical to the higher percentiles of the climate VaR distribution.
Battiston et al. [
80] analyse how climate-policy risk may spread through the financial system by a “climate stress test” conducted on the major financial institutions of Europe. Through stock share data of five sectors sensitive to climate policies (fossil fuels, electricity, energy-intensive industry, real estate, and transport), they measure how exposed European financial institutions are to these policies. The author’s conclusions imply that adopting climate mitigation policies matters in terms of time and expectations. The capacity of market players to anticipate climate policy initiatives determines how much financial exposure may result in economic shocks. In a situation where the implementation of climate policies is unclear, slow, and abrupt, market players would not be able to foresee the effects of policies completely, elevating the probability of systemic destabilisation. This occurs mainly because of fossil fuel and electricity shares’ massive devaluation. However, the overall impact would be constrained if the initial shock is restricted to most emitters’ sectors. Complementing these conclusions, Krueger et al. [
81] shows that institutional investors already face climate concerns in their decision-making strategies and view them as significant investment risks. Despite this, many investors still do not use basic instruments to recognise and manage climate risks.
Campiglio et al. [
83] focuses on the need to build a complex and pluralistic approach that accounts for the challenges and trade-offs of transition. Methodologically, it focuses on developing and improving models that consider the relationships between the government, financial, and productive sectors. The authors also highlight the demand for a pluralist approach using a set of instruments—such as Agent-Based, Stock Flow, Integrated Assessment, and DSGE models—that enable a forward-looking assessment of climate-related risks and their social and macroeconomic repercussions. From a political perspective, Christophers [
84] underscores that while financial regulators remain wedded to approaches to financial stability debunked by the global financial crisis, it becomes ever harder to expect a future in which the financial system responds safely and smoothly to the materialisation of the climate risks.
Monasterolo et al. [
82] emphasise that standard market-based solutions proposed by financial actors and policy-makers in the context of climate change rely on two main caveats: incomplete knowledge of portfolio exposure to climate-related risks and a lack of standard exposure measurements. Instead, the authors propose two indices: (i) “greenhouse gas exposure, which measures how exposed a portfolio is to risks associated with the energy transition, and (ii) ”greenhouse gas holding,” which measures an actor’s share of GHG emissions. Furthermore, they employ a dataset of portfolios from Europe to demonstrate how these indexes might be used and how climate policies affect businesses, investment funds, governments, and other actors. In conclusion, the authors discover that industrial companies and institutional funds emerge as critical stakeholders for being at the same time vulnerable—for having the largest market share in several carbon-intense sectors—but also relevant because of their potential effects on the real economy.
5.2.3. Financial Development and Carbon Emissions (g2T3)
The analysis of the causal relationship between financial development and carbon emissions symbolises the topic g2T3. In the representative hub, Acheampong [
85] employs the system-generalised methods of moments (GMM) to examine the direct and indirect effects of financial development on carbon emissions for 46 sub-Saharan African nations between 2000 and 2015. As a
proxy to financial development, the authors use six indicators to analyse financial development, such as foreign direct investment and domestic credit to the private sector as a percentage of the GDP. The empirical findings show that financial development can impact carbon emissions in diverse ways depending on the choice of indicators engaged in the analysis. When financial development is measured using a variety of indicators, such as domestic credit provided by banks to the private sector, domestic credit to the private sector measured using broad money, and domestic credit to the private sector, there is an increase in carbon emissions. However, when foreign direct investment, liquid liabilities, and domestic credit provided by the financial sector to the private sector are applied, financial development does not affect carbon emissions.
5.2.4. Green Bond Market (g2T1)
The analysis of green bond market first appears in the network with relevance in group 2 and is identified as the g2T1. Green bonds (GB) are seen as a crucial tool for releasing climate funds and have been appointed as a hot topic in the field [
33,
34]. The representative g2T1 hub, Karpf and Mandel [
86], looks at how green and conventional bonds in the US municipal bond market differ regarding their yield term structures. Using the Oaxaca-Blinder decomposition, the authors show that GB have historically been penalised on the municipal market, trading at lower prices and yields than predicted by their credit profiles. However, municipal green bonds’ credit quality has recently improved, and the premium has changed positively. As a result, GB are growing in popularity as an investment and have the potential to close the financing gap for climate change mitigation and adaptation. The authors additionally emphasise the importance of multilateral development banks, such as the World Bank, in providing financial and fiduciary guarantees on the green usage of the proceeds. Furthermore, they underline that precise information regarding investors’ social and environmental investment effects is a crucial component of GB.
5.3. Group 03
Group g3, presented in
Table 5, is the most recent and diverse group, with many well-defined topics despite only two topics containing hubs—another indicator that this group is still under construction. The most influential topic in this group is “energy-economics-emissions (EEE) models combined with financial development”, an evolution of the popular EEE models that established causalities among energy consumption, energy-related emissions, and economic growth. This approach commonly considers how financial development relates to these three other variables in this group, adding to the topic g2T3 the role of energy. The number of articles regarding developing countries’ study cases is unprecedented. Group 3 is the first to present more influential hubs from and about these countries, additional support to previous studies that have already spotlighted this trend [
34,
35].
Another influential topic in this group, “green stocks risk measurement”, is represented by one hub, strengthening the trend begun by g2.
5.3.1. Energy-Economics-Emissions
Models Combined to Financial
Development (g3T9)
In the topic g3T9, various influential documents deeply explore the causal relationship between financial development, energy, economy, and emissions. The majority of these hubs also examine the validity of the Environmental Kuznets Curve (EKC) for countries, especially developing ones. To some of these hubs is added the analysis of trade openness—also called ’globalisation’. A different set of indicators are used as a proxy to financial development being the most common domestic credit as a percentage of the GDP.
Cetin et al. [
88], for instance, analyse, through a VECM Granger causality, the impact of economic growth, energy consumption, trade openness and financial development on carbon emissions in Turkey. Using annual time series data for the period 1960–2013, the authors conclude that a long-run relationship exists between the variables analysed, highlighting the validity of the EKC for the Turkish economy. The EKC’s existence implies that economic growth leads to environmental degradation in the initial stages and, after a certain level of growth, it causes an improvement in the environmental quality of the economy. The authors recommend the application of environmental-sensitive trade subsidies, to critical industries, as a policy implication to enhance the development of alternative energy technologies. Turkey is also present in two other hub articles, Pata [
91] and Ozturk [
92], reaffirming EKC’s existence for the country. Similar results are demonstrated by Salahuddin et al. [
89], which investigates the long-run relationship between the same variables in Gulf Cooperation Council Countries from 1980 to 2012.
Dogan and Seker [
93] employs economic growth, energy consumption, trade openness, and financial development to analyse their relationships for the top countries listed in the Renewable Energy Country Attractiveness Index; however, discriminating energy consumption by renewable and non-renewable energy. The study revealed, employing heterogeneous panel estimation techniques with cross-section dependence, that additions in renewable energy consumption, trade openness, and financial development decrease carbon emissions. In contrast, increases in non-renewable energy consumption contribute to the level of emissions. The EKC hypothesis is equally verified for the top renewable energy countries. Continuing in the thematic of globalisation, Zaidi et al. [
90] explore the relationship between this variable, financial development, and carbon emissions in Asia-Pacific Economic Cooperation (APEC) countries in the presence of energy intensity and economic growth and under the framework of EKC. From a panel data analysis from 1990 to 2016, the authors involved a set of methods to test cointegration and elasticities between the variables. The outcomes of cointegration demonstrate that the variables have an equilibrium relationship over the long term. Additionally, globalisation significantly lowers CO
2 emissions and energy intensity in APEC countries, while financial development contributes to a decline in CO
2 emissions. However, economic growth and increased energy intensity increase CO
2 emissions.
Shahzad et al. [
96] examine the non-linear relationship between carbon emission and energy consumption in Pakistan using data from 1971 to 2011. The short-run and long-run estimates show that energy consumption has a non-linear (inverted U-shape) effect on carbon emissions. The Granger causality results show a bi-directional causation between energy consumption and financial development, as well as a unidirectional causality from trade openness, financial development, and energy consumption to carbon emission. Shahbaz et al. [
94] focus on the impact of foreign direct investment on CO
2 emissions in France, incorporating financial development and public expenditure on energy sector research and development from 1955 to 2016. They conclude that foreign direct investment in the country aggravates the environmental quality by raising emissions. Likewise, they also find evidence of an EKC in France. Another significant outcome of this study is discovering an essential dimension of financial and ecological stability for the environment, as financial development leads to a decline in carbon emissions and environmental degradation.
Boutabba [
95] and Charfeddine and Kahia [
97] have similar goals analysing particularly the relationship between financial development, economic growth, and energy consumption in India and Mena Region, respectively.
5.3.2. Green Stocks Risk Measuring (g3T10)
The topic g3T10 reinforces the topic g2T1 but with a stronger presence of the relationship between green bonds (GB) and the energy market. The topic’s hub, Reboredo [
98], represents this feature well. The authors investigated the structure of dependence between GB and financial markets, given the practical implications for investors in terms of (a) the diversification benefits of GB in investor portfolios and (b) how financial market price oscillations could influence GB prices. Through empirical data, they find that the GB and fixed-income markets are highly dependent. As a result, they provide no diversification benefits to investors in the corporate and treasury bond markets while they are subject to significant price spillovers from the corporate and treasury fixed-income markets. Furthermore, GB prices exhibit time-varying dependency, weak symmetric tail dependence with the stock market, and tail independence with the energy commodities market. Additionally, the authors demonstrate that they provide great diversification benefits in the stock and energy markets.
6. Discussion of Results
The results presented in this study corroborate with the recent literature that aims to analyse the green finance fields. The three groups that emerged from the methodology and their most influential topics have covered many themes in the area in recent decades. Aligned with recent studies that endeavour to find thematic clusters in the green finance field and understand the significant contribution to policy-making decisions [
33,
34], this study attempts, with a novel combination of methodologies borrowed from the biology and computational science fields, to shed light on the evolution of an emerging field with significant implications to the climate crises.
This study reveals a clear movement of the literature that goes from an international discussion on climate agreements on how and when allocating climate finance from developed countries to developing ones to a debate on the critical instruments to promote the green transition nationally. However, this movement has not overcome the importance of international negotiation; on the contrary, it is still a robust background in the literature [
74,
75,
76,
77,
78]. Notwithstanding, new and relevant topics have been added to the literature. Some examples are the relationship between climate policies and financial stability, and the role of Central Banks and financial regulators in dealing with climate-policy risks presented or enhancing the greening of the financial system [
79,
80,
81,
82,
83,
84]. Additionally, the debate on financial instruments, such as green bonds, fosters the green transition and shows increasing relevance which may improve in the following years [
86,
98]. The present study also reaffirms the trend highlighted by Desalegn and Tangl [
35] and Bhatnagar and Sharma [
34] on the growing contemporary participation of authors from the Global South in the literature, despite the presence of developed world authors remain dominant as affirmed initially by Zhang et al. [
32].
The main limitations of this study rely on its focus on the most influential articles in the field of networks, with no space to deal with less meaningful or marginalised topics that appeared on the sample, many of them systematised on the
Table 3,
Table 4 and
Table 5 and excluded for not having hub documents as for methodological option. However, further exploration of topics can be relevant as many of them can turn out to be influential topics in the following years. Additionally, as the primary purpose was to explore the field’s evolution with a focus on the most influential articles from each group and their general contribution, a deeper exploration of some specific topics, and their political implications still needs to be included in the following research. Despite its limitations, we consider that the present study can help researchers and policy-makers to recognise current research challenges and make better decisions with the help of the central research topics and emerging trends identified from STM.
From the topological methodology of hubs proposed by [
22], we suggest that further research can deeply explore the different degrees of influence of the hubs. In addition, the STM methodology is beginning its application in social sciences and humanities. Recent studies have shown that it can be used in an extensive scope of thematics [
49,
50,
51,
52]. Furthermore, using computational-based methods in front of the increasing information is a promising instrument to complement the expert-based approach of the literature.
Lastly, but importantly, the present study used the Scopus database. The use of different databases can produce different results.
7. Concluding Remarks
The main goal of this paper was to examine the literature on green finance, deepening the previous efforts regarding the definition and organisation of themes within this field. To accomplish this goal, a general field analysis was conducted first to map the growth and trajectory of the entire green finance literature and compare its trends to those in science overall. The second stage involved group analysis to understand possible emerging groups, as well as their characteristics and influential topics. A hub approach was applied to the group analysis as formalised by Guimerà and Amaral [
22]. In this phase, the most important documents in each group (hubs) were associated with STM, which identified the most significant topics of each group.
The three main groups that emerged illustrated a variety of themes within the green finance literature. The most mature and consolidated group (g1) comprises the political proposition papers related to the financing of mitigation and adaptation climate projects in developing countries, an issue that continues to have vast importance given the critical responsibility of the developed world in global climate change and its duty to financially aid the developing world in facing global warming. This topic is the most important in g1 and exerts a strong influence on the entire network because financial political propositions and their assessments continue to form the centre of international negotiations and are also often a locus of discrepancies among countries.
The second group (g2) draws attention for its heavy growth, especially from 2015, which coincides with the year of the Paris Agreement. This group offers a broader view of green finance and more heterogeneous topics that are related not only to the transference of financial flows to developing countries—still included as an influential topic—but also to technical change, infrastructural transformation, financial and macroeconomic risks related to climate policy and the green bond market. The recent but growing presence of finance and economics articles and journals in the sample in g2 illustrates the criticism of the low participation of finance and economics journals in the green finance literature [
32]. Despite this growing interest, the majority of the green finance articles are still published in interdisciplinary journals.
Finally, the third group is still nascent, demonstrating a wide range of topics but only a few influential ones. This nascence notwithstanding, two topics exert influence on the network: energy-economics-emissions models associated with financial development and green stock risk measurement, reinforcing the trend—also present in g2—of the hot topic of green bonds [
33].
Contributions of this study are presented in the “Discussions of Results” Section, as well as some limitations of the article’s goal and methodology approach.


