Article

Determination of Uranium Concentrations and 234U/238U Isotopic Ratios in Plants and the Groundwater Used in Their Cultivation in an Area with High Background Radiation

by
Othman Fallatah
1,* and
Mahmoud R. Khattab
2
1
Department of Nuclear Engineering, Faculty of Engineering, King Abdelaziz University, P.O. Box 80204, Jeddah 21589, Saudi Arabia
2
Geochemical Exploration Department, Nuclear Materials Authority, El-Maadi, Cairo P.O. Box 530, Egypt
*
Author to whom correspondence should be addressed.
Sustainability 2023, 15(2), 1590; https://doi.org/10.3390/su15021590
Submission received: 9 November 2022 / Revised: 27 December 2022 / Accepted: 9 January 2023 / Published: 13 January 2023

Abstract

:
The weathering of rocks and soil causes uranium to collect in groundwater. In this article, we attempted to assess the activity concentrations of uranium and 234U/238U isotopic ratios in various groundwater samples and plants obtained from the Ha’il region, Saudi Arabia. The results showed that the concentrations of 238U ranged between 0.08 ± 0.04 and 1.11 ± 0.06 Bq L−1, with an average of 0.67 ± 0.05 Bq L−1. Activity concentrations of 234U ranged between 0.12 ± 0.01 and 2.2 ± 0.8 Bq L−1, with an average of 1.26 ± 0.11 Bq L−1. The international permissible limit of uranium in groundwater is 0.372 Bq L−1. The 234U/238U activity ratios in the collected groundwater samples ranged between 1.5 ± 0.09 and 2.49 ± 1.27 Bq L−1, with an average of 1.95 ± 0.52 Bq L−1. In fruit-bearing trees, the 234U/238U activity ratios were 1.57 ± 0.84, 2.58 ± 1.01, and 2.69 ± 0.95 Bq L−1 for lemon, fig, and narenj. In fruit-bearing shrubs, the 234U/238U activity ratios were 2.37± 0.69 and 2.68 ± 0.69 Bq L−1 for green pepper and eggplant. Our goal is to increase the understanding of the factors that govern uranium’s activity and isotopic composition to better understand its prospective utilization as a tracer in groundwater chemistry and hydrology, as well as the possibility of exploiting this area for irrigation. In this investigation area, the groundwater and plants were unfit for human consumption.

1. Introduction

The Saq formation, the oldest sedimentary rock formation in the Kingdom of Saudi Arabia, is exposed in parts of the Ha’il region, although its eastern and northeastern portions are located within the Arab shelf. The Saq formation excavation spans 1200 km along the Arabian Shield from inside Jordan to Qurna in the Dawadmi Governorate in the Riyadh region. In the exposed areas of the Al-Saq reservoir, the water level is below the earth’s surface. Water once flowed to the surface of the earth after drilling wells. It is expected that because the water in the stem tanks is ancient and nonrenewable, the groundwater level will continue to drop since the area used for agriculture in the Ha’il region has grown significantly over the past three decades. In particular, the cultivation of wheat and fodder are dependent on pumping large amounts of stem water. Although this reservoir is a crucial supply of water for the area, it is a resource that is vulnerable to exhaustion. According to the Ministry of Agriculture and Water, the aquifer’s entire supply of water originates from water that has been held there for thousands of years. As a result, in places where groundwater has been heavily extracted, the water level is falling and will continue to fall [1].
Studies of various physicochemical processes in coastal water, saltwater, continental surface water, and groundwater have all shown the value of the U isotopic composition [1,2,3]. For a wide range of hydrological and geological processes, U isotopes in continental water can be used as a tracing or dating technique [4,5,6]. Another source of uranium in groundwater is the use of mineral fertilizers [6].
Uranium often exists in two oxidation states, UIV and UVI. U is extremely immobile and resides in the UIV oxidation state under reducing circumstances, mostly as insoluble complexes with hydroxides. However, complexation with fluoride at low pH or with hydroxyl ions can make UIV more soluble. In oxygenated surface water, the uranyl ion UO22+ is the predominant form of uranium. In near-neutral circumstances, it frequently forms complexes with carbonate and phosphate. At pH < 4, it frequently does the same with sulfate, chloride, and fluoride. U is very soluble and mobile in the UVI oxidation state [6,7].
The concentration of uranium in aqueous solutions is governed by traditional thermodynamic factors, such temperature, pressure, solution composition, pH, redox potential, ionic strength, the presence of complex-forming ligands, and the kinetics of mineral sorption and dissolution processes. Using the 234U/238U activity ratio as a tracer in hydrogeological research requires knowledge of the origin of the 234U/238U fractionation.
Enriched uranium in aquifer rocks and their mineral makeup, path lengths and contact times between the aquifer matrix and flowing water, interactions between water and rocks, and mixing of waters with various isotopic signatures are all physical and chemical factors that affect the concentration and mobility of uranium isotopes [8].
The weathering of rocks and soil causes uranium to collect in groundwater. Groundwater uranium concentrations are influenced by lithology, geomorphology, and other local geological factors [9]. In order to analyze the radiological effects of various anthropogenic activities and ensure the higher standard of living of contemporary society, awareness of uranium concentrations in groundwater is crucial. The total uranium content is adequate for assessing chemical toxicity and also for calculating the possible risk from its radioactivity. Additionally, the 234U/238U ratio is a natural tracer for locating the source of uranium exposure [10]. Uranium isotopes are transported by groundwater flow according to their solubility and geochemical behavior in relation with temperature, pH, and redox potential, as well as with other parameters characteristic of water [11].
We attempted to evaluate the activity concentrations of uranium and the 234U/238U isotopic ratios in various groundwater and plant samples collected from the Ha’il region, Saudi Arabia. Our goal is to increase the understanding of the processes that govern uranium’s behavior and isotopic composition so that we can use this water resource for irrigation and also potentially employ uranium as a tracer in groundwater chemistry and hydrology.

2. Materials and Methods

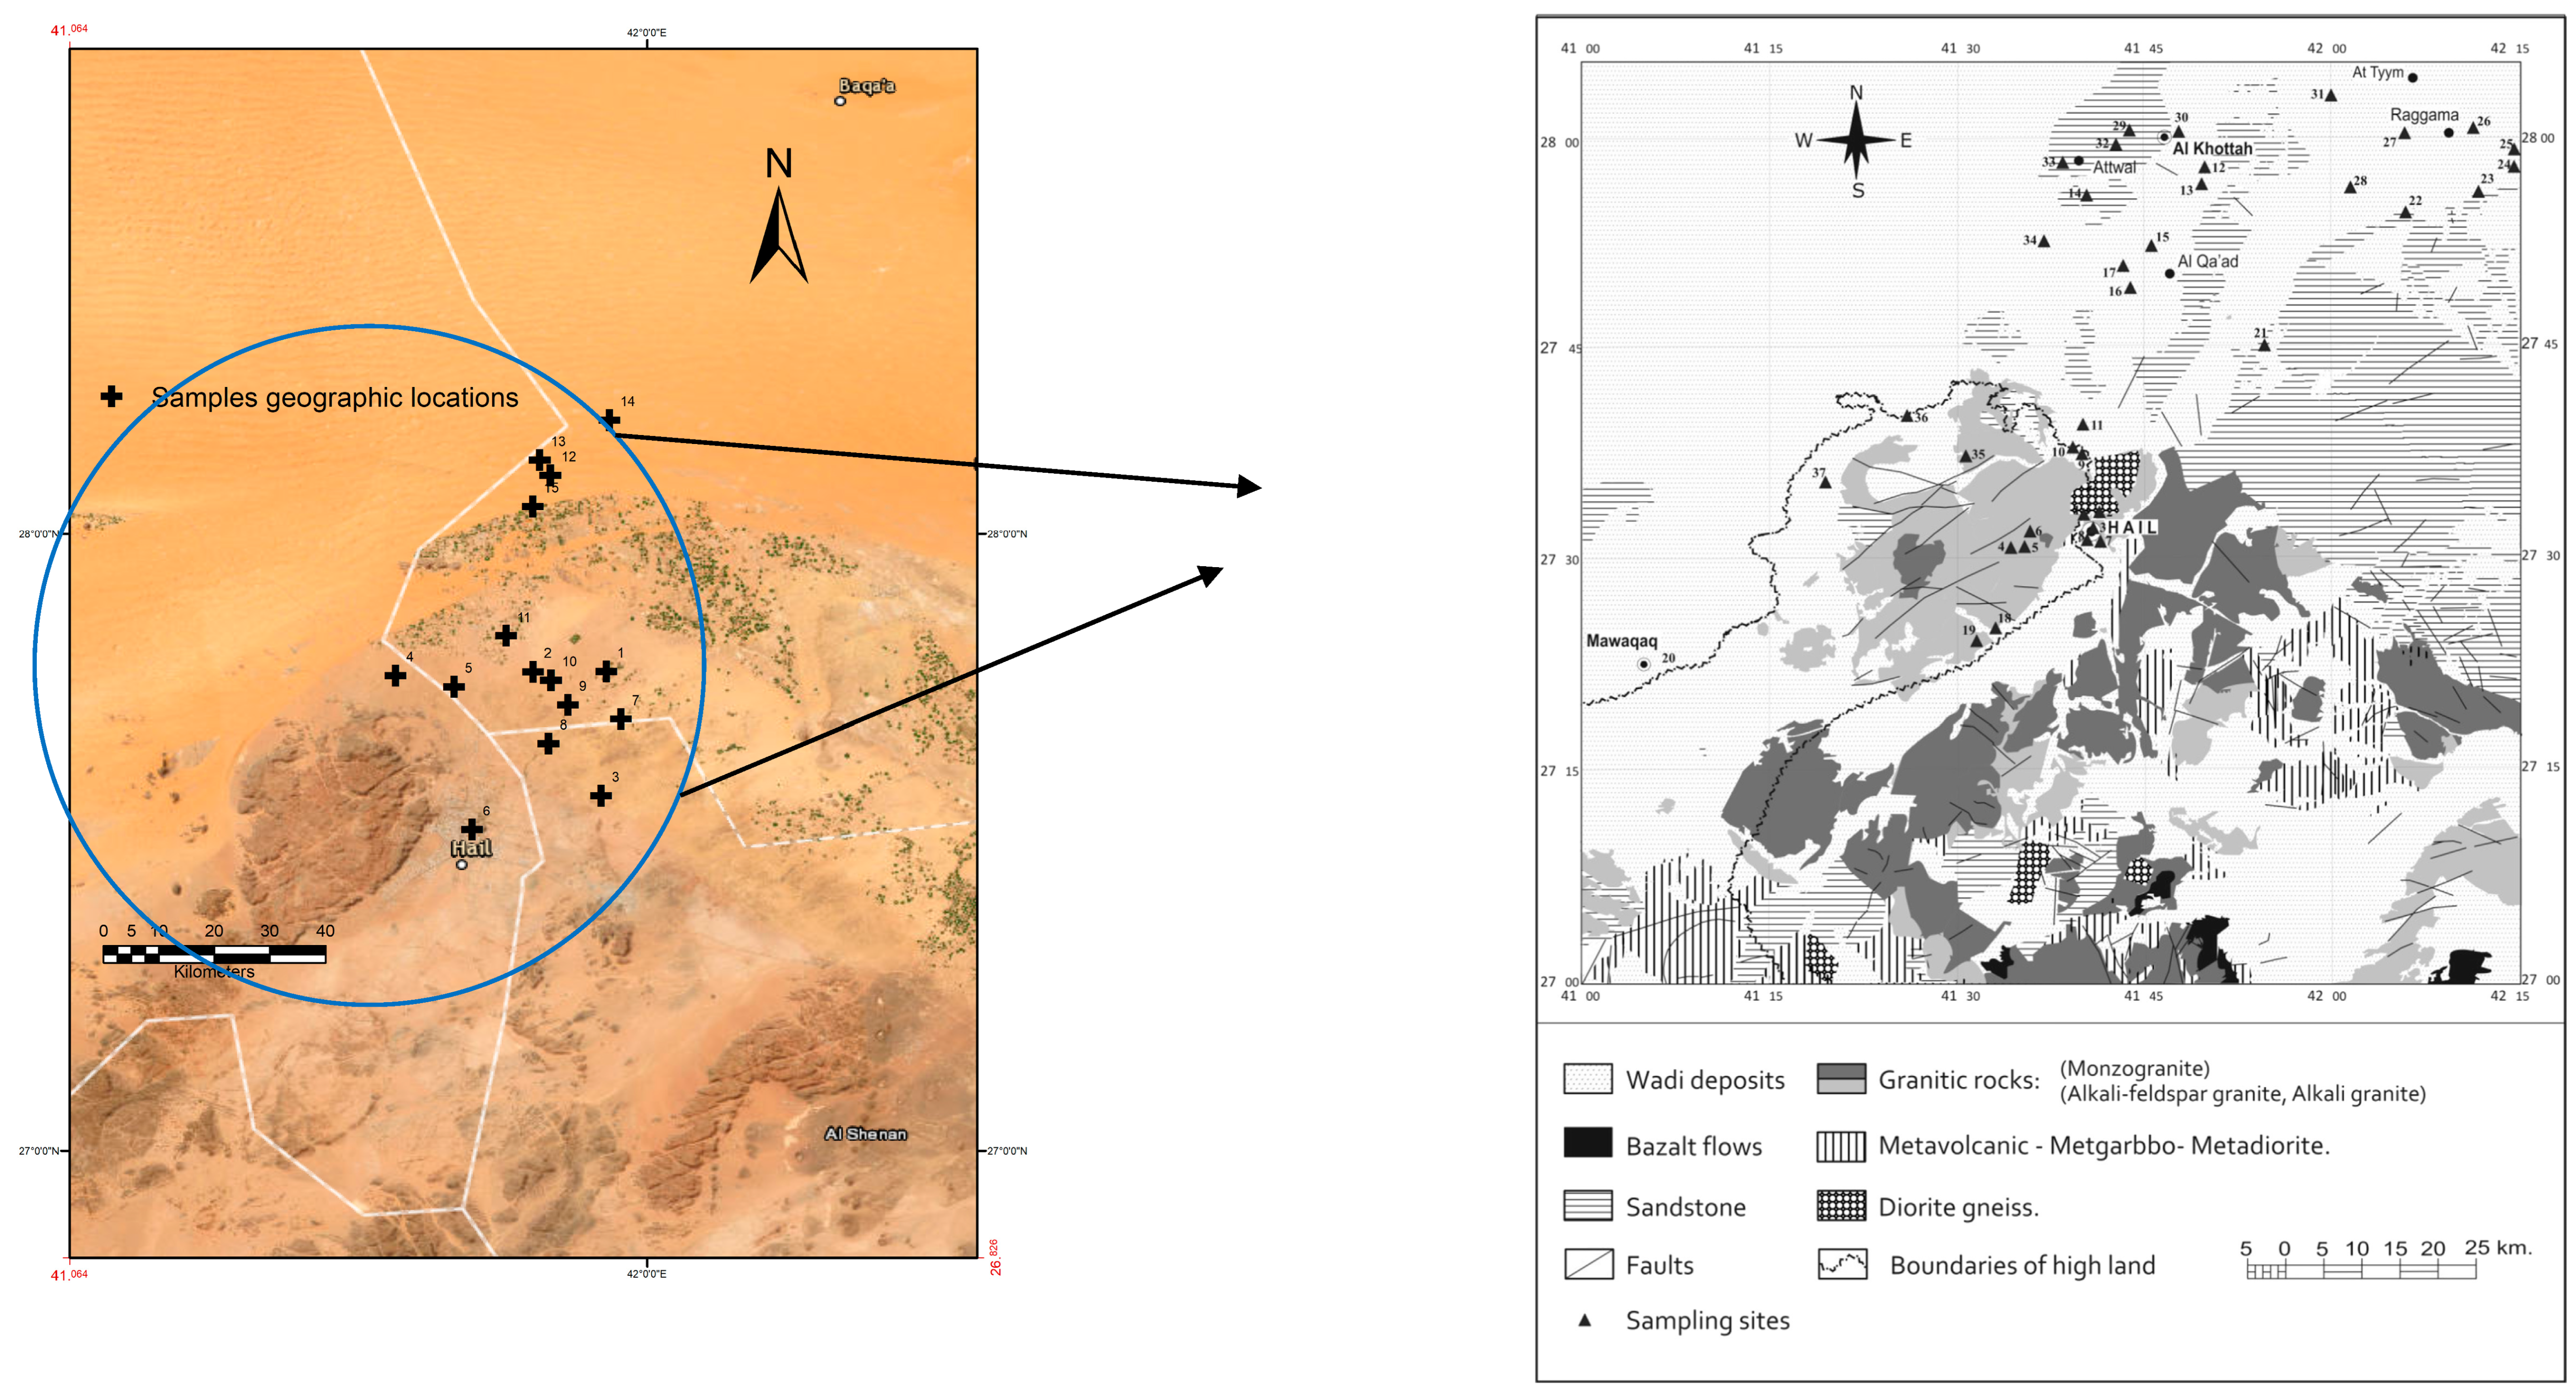
2.1. Geological Settings

Approximately 16,500 km2 of the Arabian Peninsula’s northern region is covered by the Ha’il region, which is defined between latitudes 27° 00’ and 28° 00’ N and longitudes 40° 00’ and 42° 00’ E (Figure 1). Desert-like and dry conditions prevail. Most of the year’s rainfall, which amounts to a few tens of centimeters annually and falls between November and March, creates short-lived lakes that evaporate to leave behind little sabkhahs. Wintertime temperatures are below 10 °C during the day and can occasionally drop to approximately 0 °C at night. The predominant winds come from the north. Daytime highs of over 40 °C are frequent from April to October, and the season is characterized by southerly and southwesterly winds.
The Ha’il region, which is part of the vast An-Nafud and Arabian Shield and connected to it by the Rub’ al Khali in the south of Saudi Arabia, is distinguished by its varied topography and geomorphology. The vast An-Nafud, which makes up a significant portion of the Ha’il region, is a sand-filled depression that extends over roughly 64,000 km2. The limestone sand and steep wadis of the Arabian Shield, which rises to hills, are its distinguishing features. However, the sand found in sand dunes and sand sheets appears to have secondary or typically tertiary beginnings in sandstones from the Paleozoic and Mesozoic periods [11]. The maximum elevation in Hail occurs at the extreme southwest corner of the province, approaching more than 1900 m above the mean sea level (ASL), while the minimum level of land is in the range of 600–700 m. Figure 1 shows the major cultivated lands, which occur at the east of Hail and extend to Al-Qasim at elevations ranging from 700 to 900 m ASL, where the crops are cultivated under controlled center pivot irrigation [12]. The plains, sand dunes, mountains, and cultivated lands represent 55,270, 40,650, 18,380, and 1390 km2 of the Hail region, respectively [12]. Most water-supply wells are located within the irrigated areas. The main aquifers of the study area are Saq, Kahfah, and Sarah quwara, although wadi alluviums also serve as source of groundwater in places. The Hanadir and Raan formations are also act as an aquitard. The Saq, Kahfah, and Sarah-Quwara have average hydraulic conductivities of 5, 10, and 1 m/d, respectively [13].
The study area covers 30 × 20 km2 and consists of several rings of peralkaline granite, quartz syenite, and biotite syenogranite, which envelop a core of granophyre. The whole complex cuts a series of rhyolites, mostly peralkaline. Cryogenian to Ediacaran (720–538.8 Ma) sedimentary and volcaniclastic materials are pink. A large, post-orogenic peralkaline body forms an elliptical intrusion of c. 80 × 20 km2. There is an outer ring of peralkaline granite with a complex core of granophyre and micrographic granite, within which is a 5 km long xenolith of comenditic rhyolites, and peralkaline rhyolites partially cap the complex. It includes highly mineralized pink pegmatites, rich in Nb, Ta, Y, Zr, Hf, U, and REE, including Th. In addition to the REE-rich minerals, Gahlan et al. (2021) [13] describe a pyroxenoid rich in Sc, Y, etc. from these pegmatites. The bustamite from this pegmatite is also vacancy-rich and has excess SiVI. Cambrian to Ordovician sedimentary materials (538.8–443.8 Ma) are green and Cenozoic volcanic materials (66–0 Ma) are gold-colored. Holocene aeolian sediments (0.0117–0 Ma) are salmon-colored. The presence of alkaline plutonic materials is an important factor when discussing radioisotope contents in groundwater.

2.2. Sample Collection

Fifteen groundwater samples were collected for this investigation from 15 wells at various depths in the Ha’il region by drawing water from a broken subterranean aquifer (Figure 1). From June to December of that year, samples were obtained from the KSA Ministry of Environment, Water, and Resources. Prior to sampling, each well was left running for 10 to 15 min to collect representative groundwater samples and ensure the flow of groundwater from the wells. A volume of 2 L of water was sampled from each well and stored in plastic containers after adding 5 mL HNO3 to store the collected groundwater at pH 2. A fraction of each sample (approximately 100–150 mL) was kept in a separate polyethylene bottle without acidification for pH, CO32−, and HCO3 determinations. From the examined area, samples of different varieties of fruit-bearing shrubs (green pepper and eggplant) and fruit-bearing trees (lemon, fig, and narenj) were also collected. The different dry plant portions were ashed at 550 °C for 20 h. The temperature was raised from room temperature to 550 °C within approximately 8 h to avoid burning the sample within the temperature range 250–350 °C, using a programmable muffle furnace. The ashes were spiked with the suitable radiotracer and treated with mixture of conc. HNO3 + H2O2 to complete the oxidation of organic matter. Sample solutions contained the undissolved fraction. They were filtered and the samples were ashed again using a thinner sample layer in the crucible and longer ashing time. The solutions were evaporated to dryness and the salts were dissolved in the appropriate acid and submitted to a radiochemical procedure.

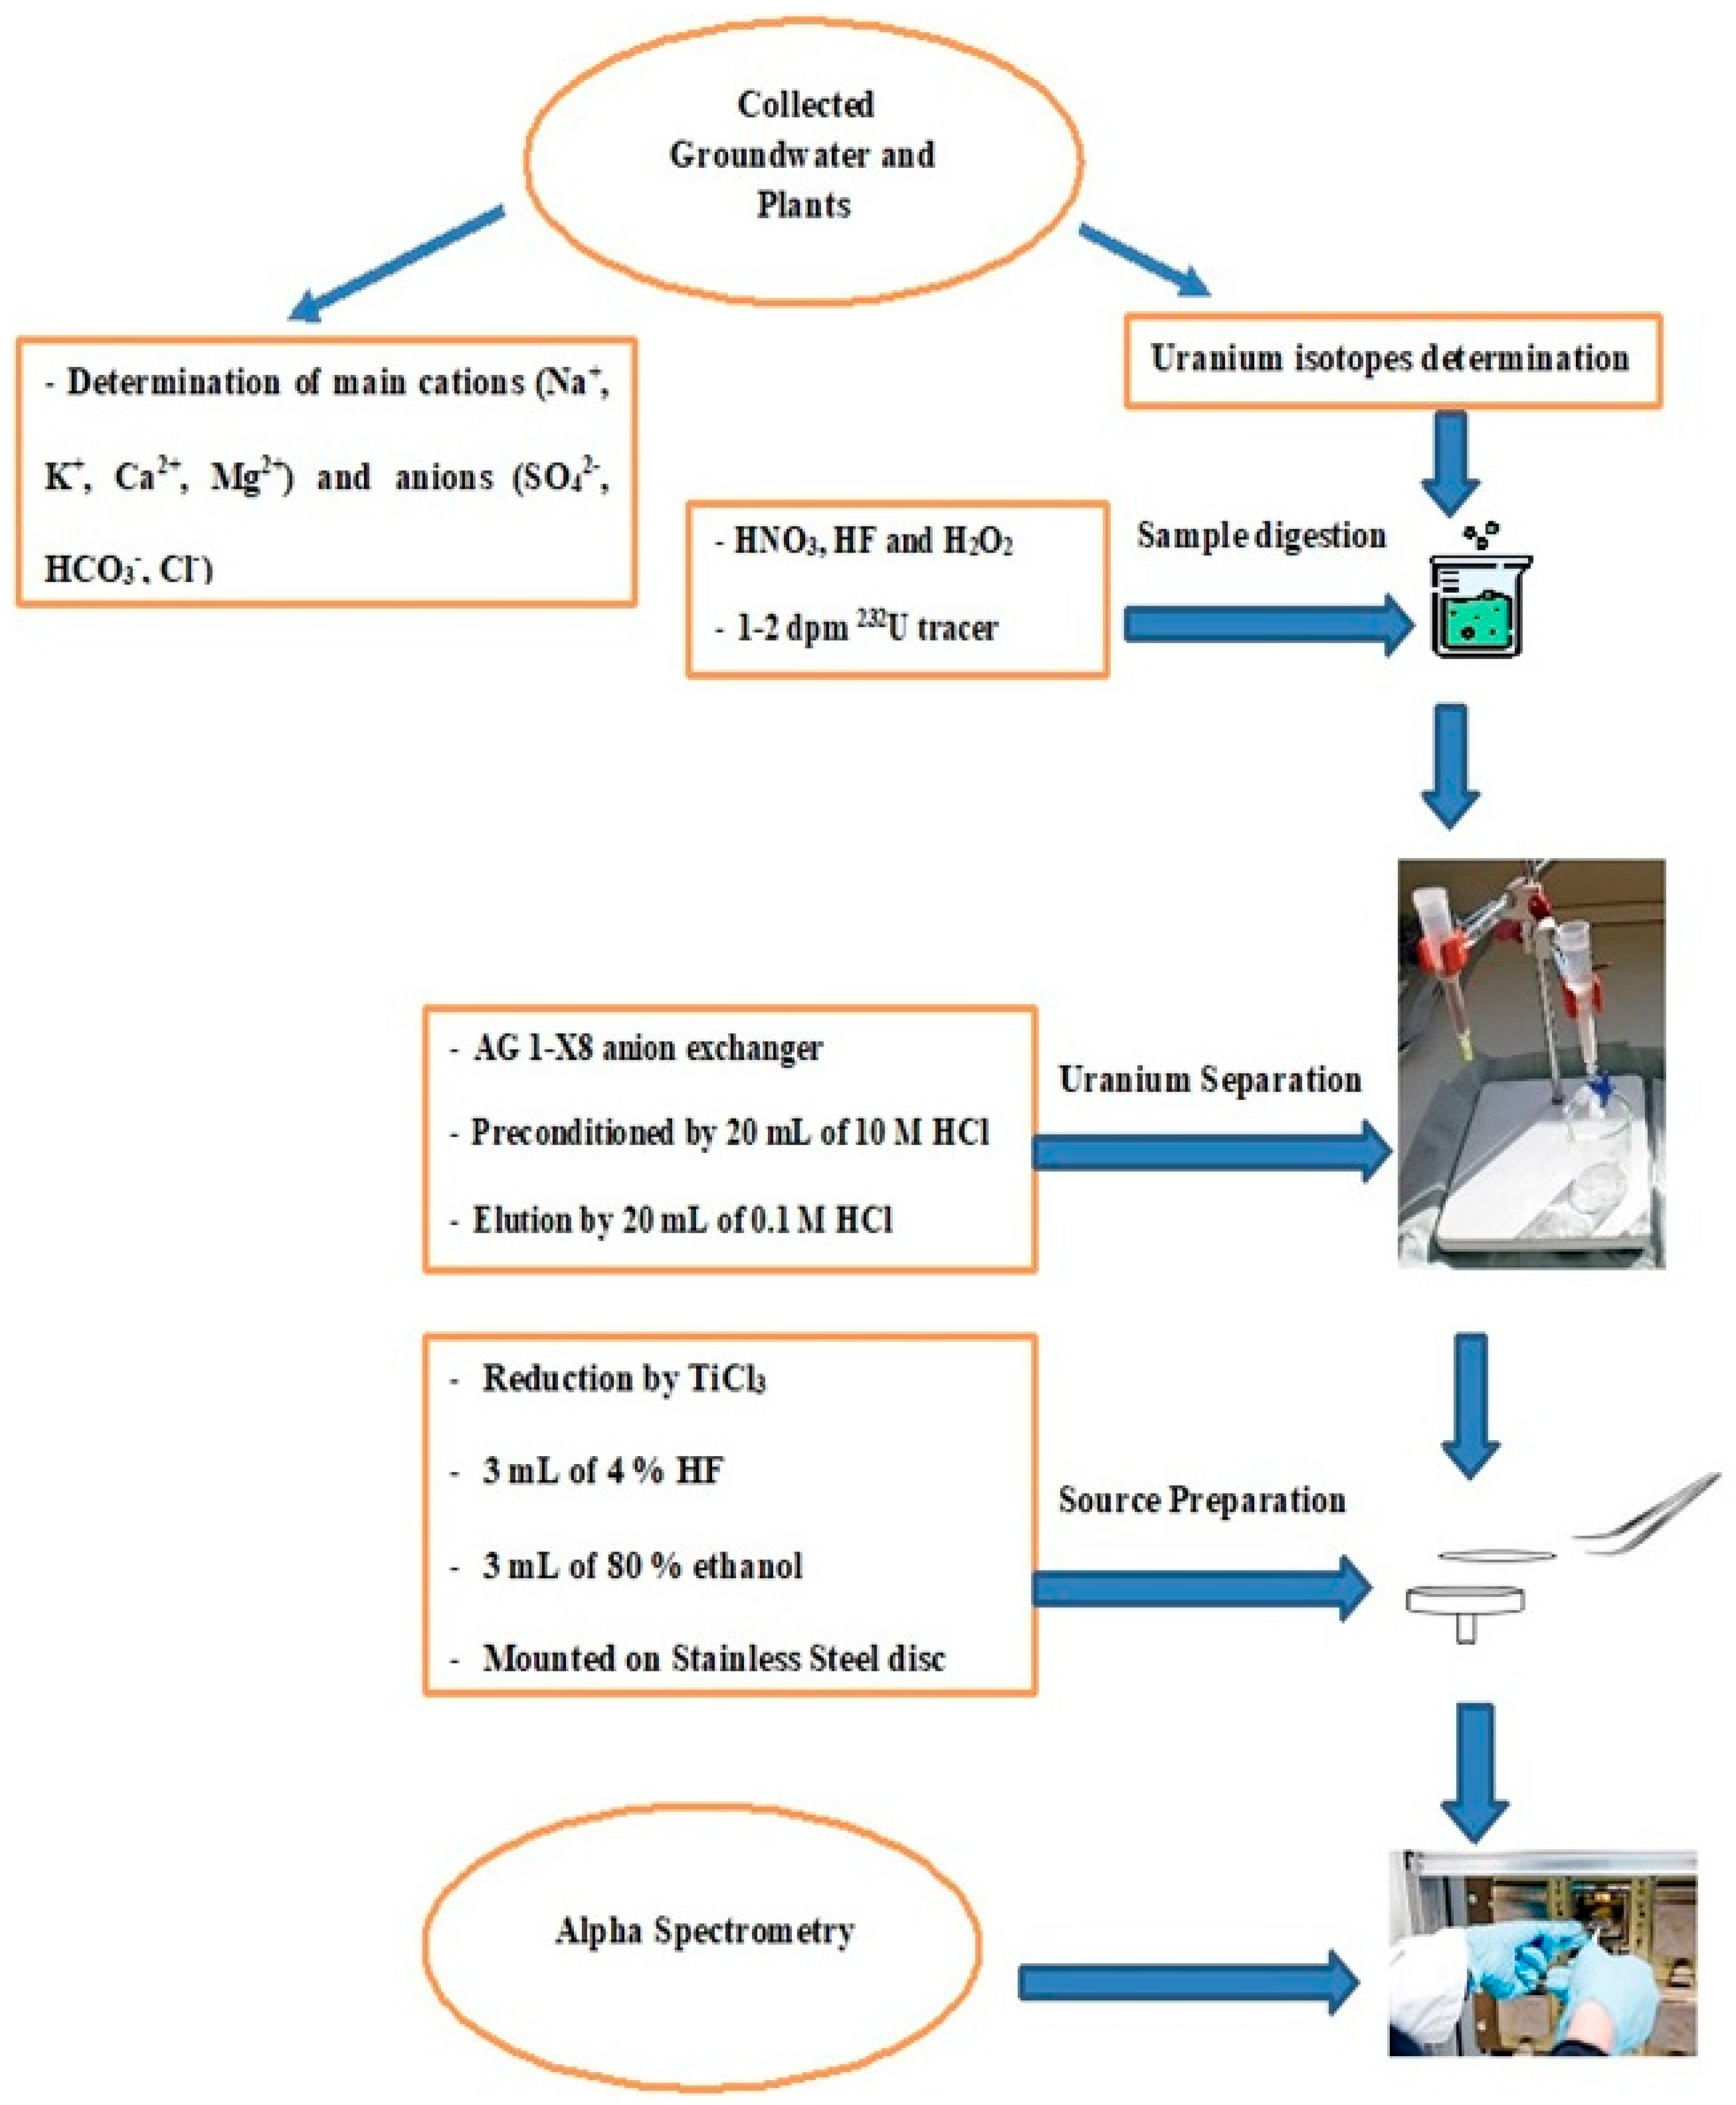
2.3. Chemical Parameter Analysis

A small field instrument (Hanna, George Washington Hwy Smithfield, Washington, DC, USA) was used to quickly measure the pH and total dissolved solids (TDS) of water samples at the site. The Solar M-5 (Thermo Elemental, London, UK) Atomic Absorption Spectrometer was used to perform flame atomic absorption spectrophotometry for the analysis of Na+ and K+. A standard solution with known concentrations was used to calibrate the instrument. The statistical error was within 8%. The wet analyses were completed utilizing standard techniques. Ca2+ and Mg2+ were analyzed using titrimetric method No. 2340C-EDTA, whereas CO32− and HCO3 were analyzed using titrimetric method No. 2320B. Analyses of Cl and SO42− were performed using argentometric method No. 4500B and turbidimetric method No. 4500E, respectively. The analyses were performed in duplicate and the standard deviation was within ±10%.

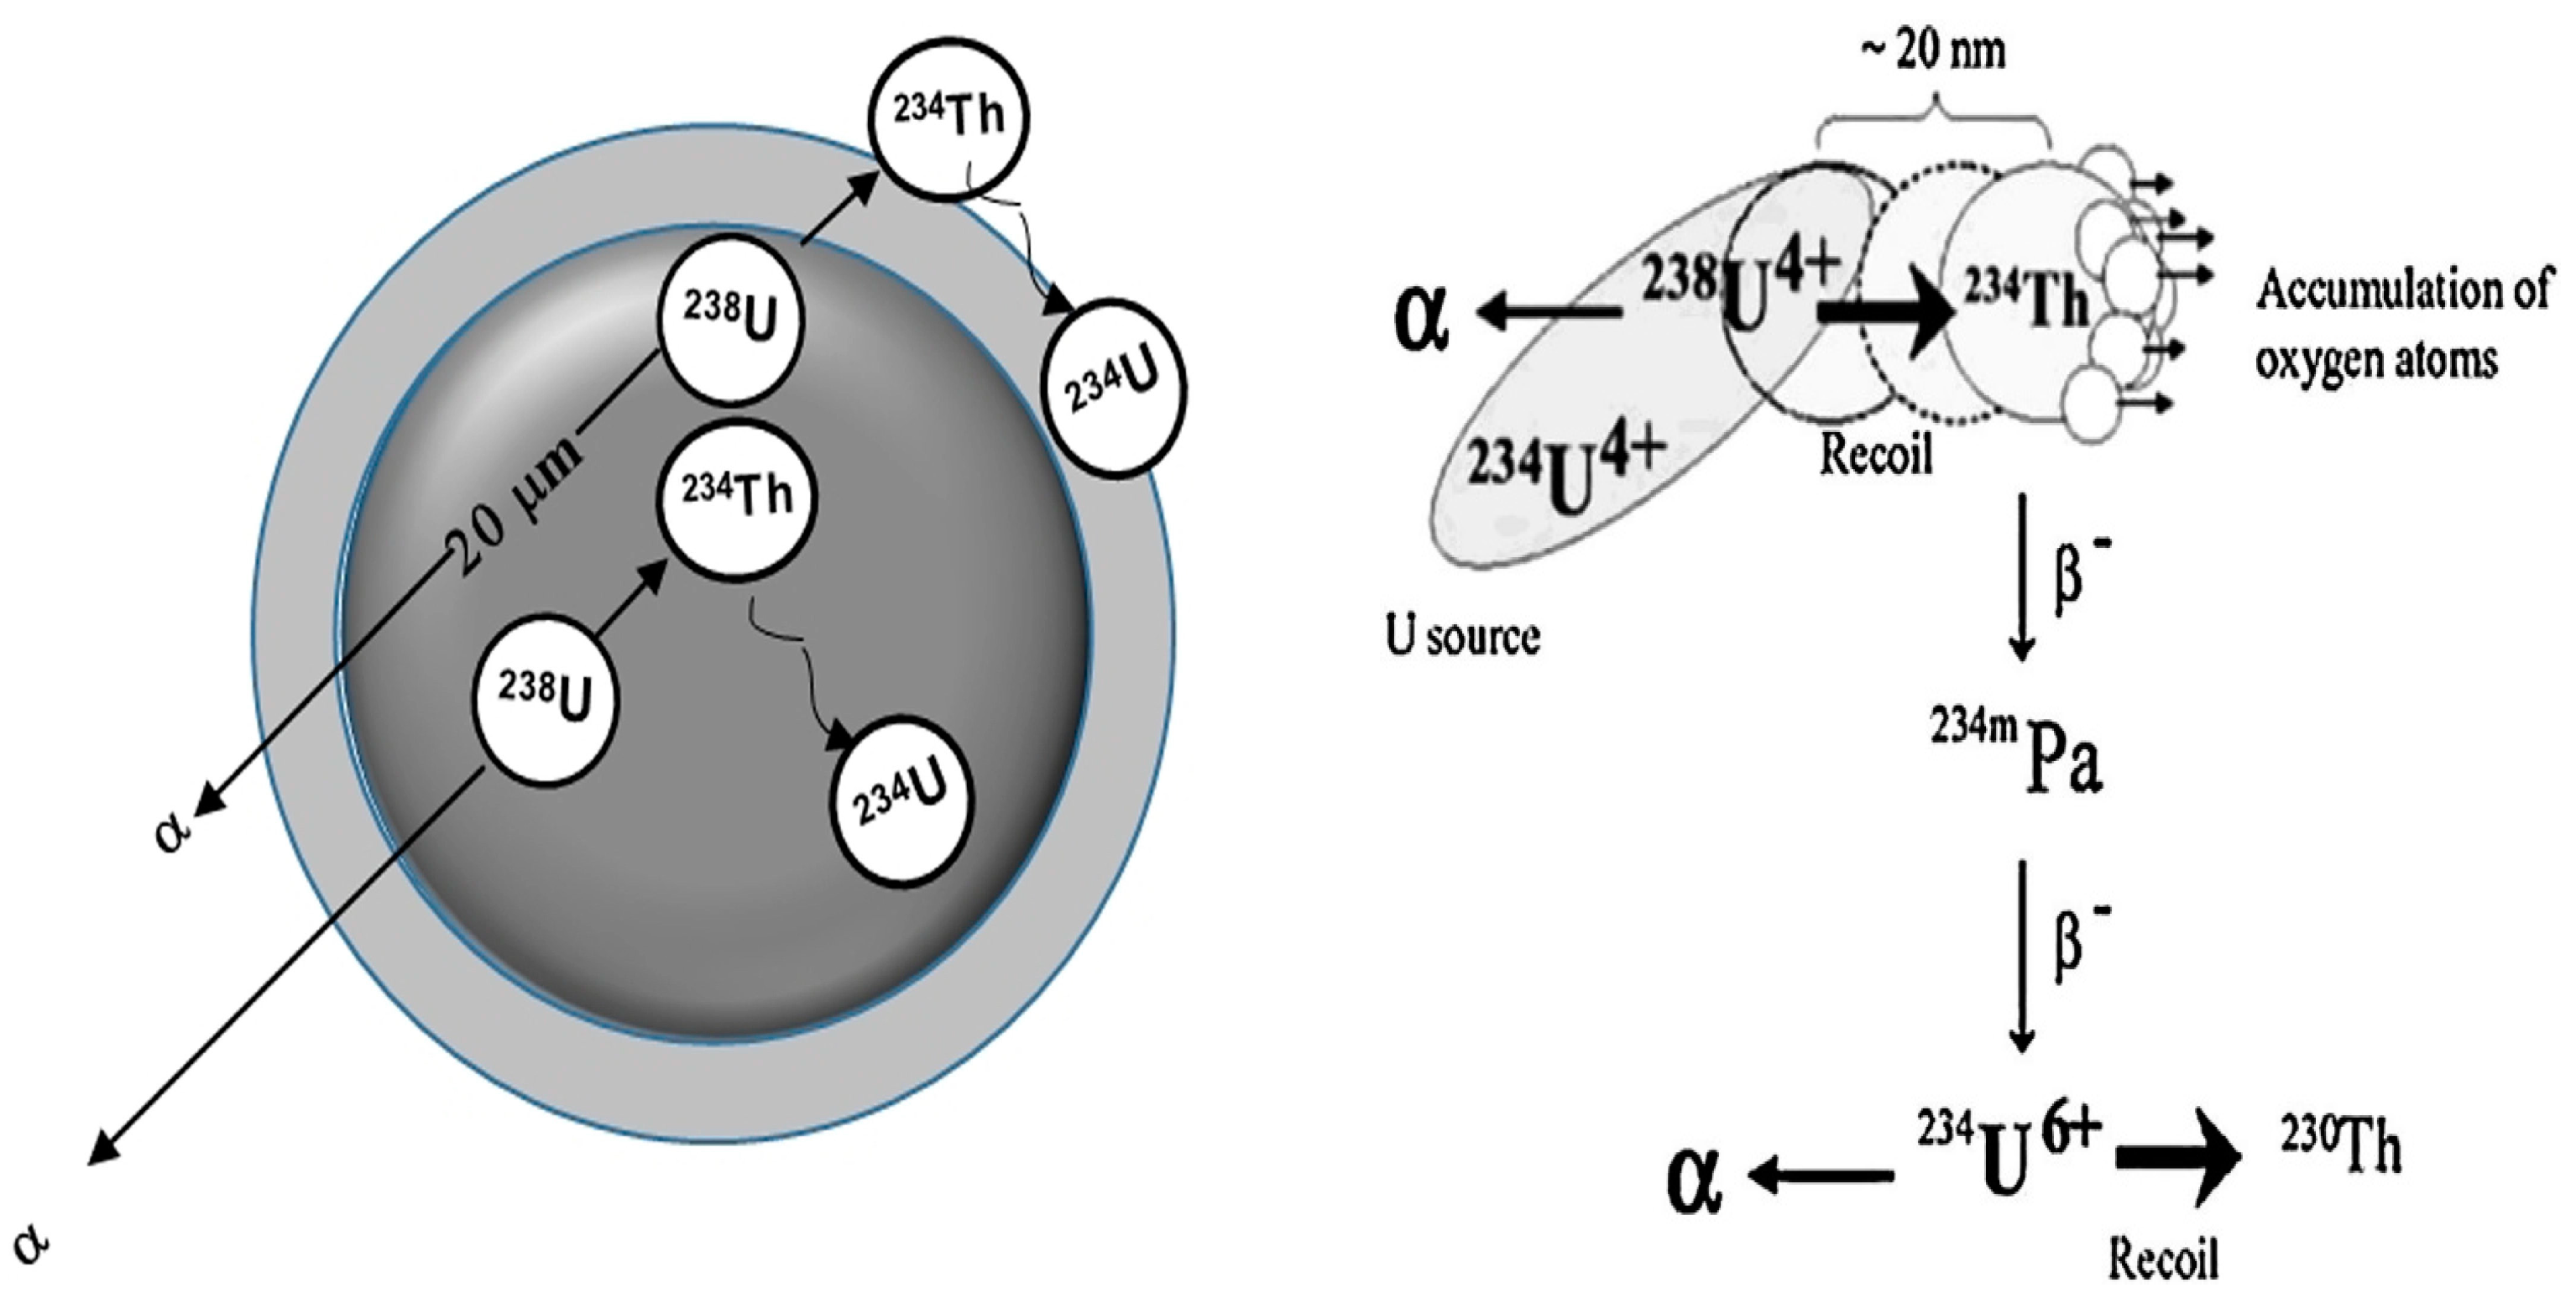
2.4. Uranium Isotopic Measurement

After filtering, samples were transferred in 2 L plastic bottles and acidified with 10 mL HNO3 (37%). The major cations (Na+, K+, Ca2+, and Mg2+) and anions in the groundwater samples were determined chemically (SO42−, HCO3, and Cl). A flame atomic absorption spectrophotometric method was used to measure the concentrations of Na+, K+, Ca2+, and Mg2+. By using ion chromatography, SO42− and Cl concentrations were determined, and the HCO3 concentration was measured by alkalinity titration. The concentrations of uranium isotopes 238U, 235U, and 234U were measured utilizing alpha spectrometry (Figure 2). The groundwater and plant samples underwent this radiochemical process. HNO3, HF, and H2O2 were used to leach the uranium from the samples before adding 1–2 dpm of uranium tracer 232U to the samples in order to calculate the chemical production and activity (Figure 2).
Ion exchange resin was used to remove the uranium from the matrix components. The sample residue was dissolved in 20 mL of 10 M HCl solution and added to a 10 mL separation column that contained AG 1-X8 anion exchange resin. Next, 20 mL of 10 M HCl was passed through the column as a preconditioning step. Another 20 mL of 10 M HCl was used to wash the trapped uranium before 20 mL of 0.1 M HCl was used to elute it from the column. The separated uranium was reduced by an amount of TiCl3 (15%), and 50 mL of Nd3+ solution (1 mg Nd3+/mL) was added drop by drop to turn the solution purple. Then, 1 mL was then added to keep the uranium in the tetravalent state. The sample was mixed with 5 mL of 40% HF solution and left for 30 min before being filtered through a 0.1 mm polypropylene membrane filter. Subsequently, 3 mL each of 4% HF solution and 80% ethanol solution were used to wash the precipitate. The sample was adhered on a stainless-steel disc after drying at 50 °C for 5 min. The uranium isotope content of the electroplated samples was measured in a four chamber α-spectrometer (ORTEC Octete Plus high resolution α-spectrometer) using a passivated implanted planar silicon detector with an efficiency ranging from 20% to 21.5% (Figure 2).

3. Results and Discussion

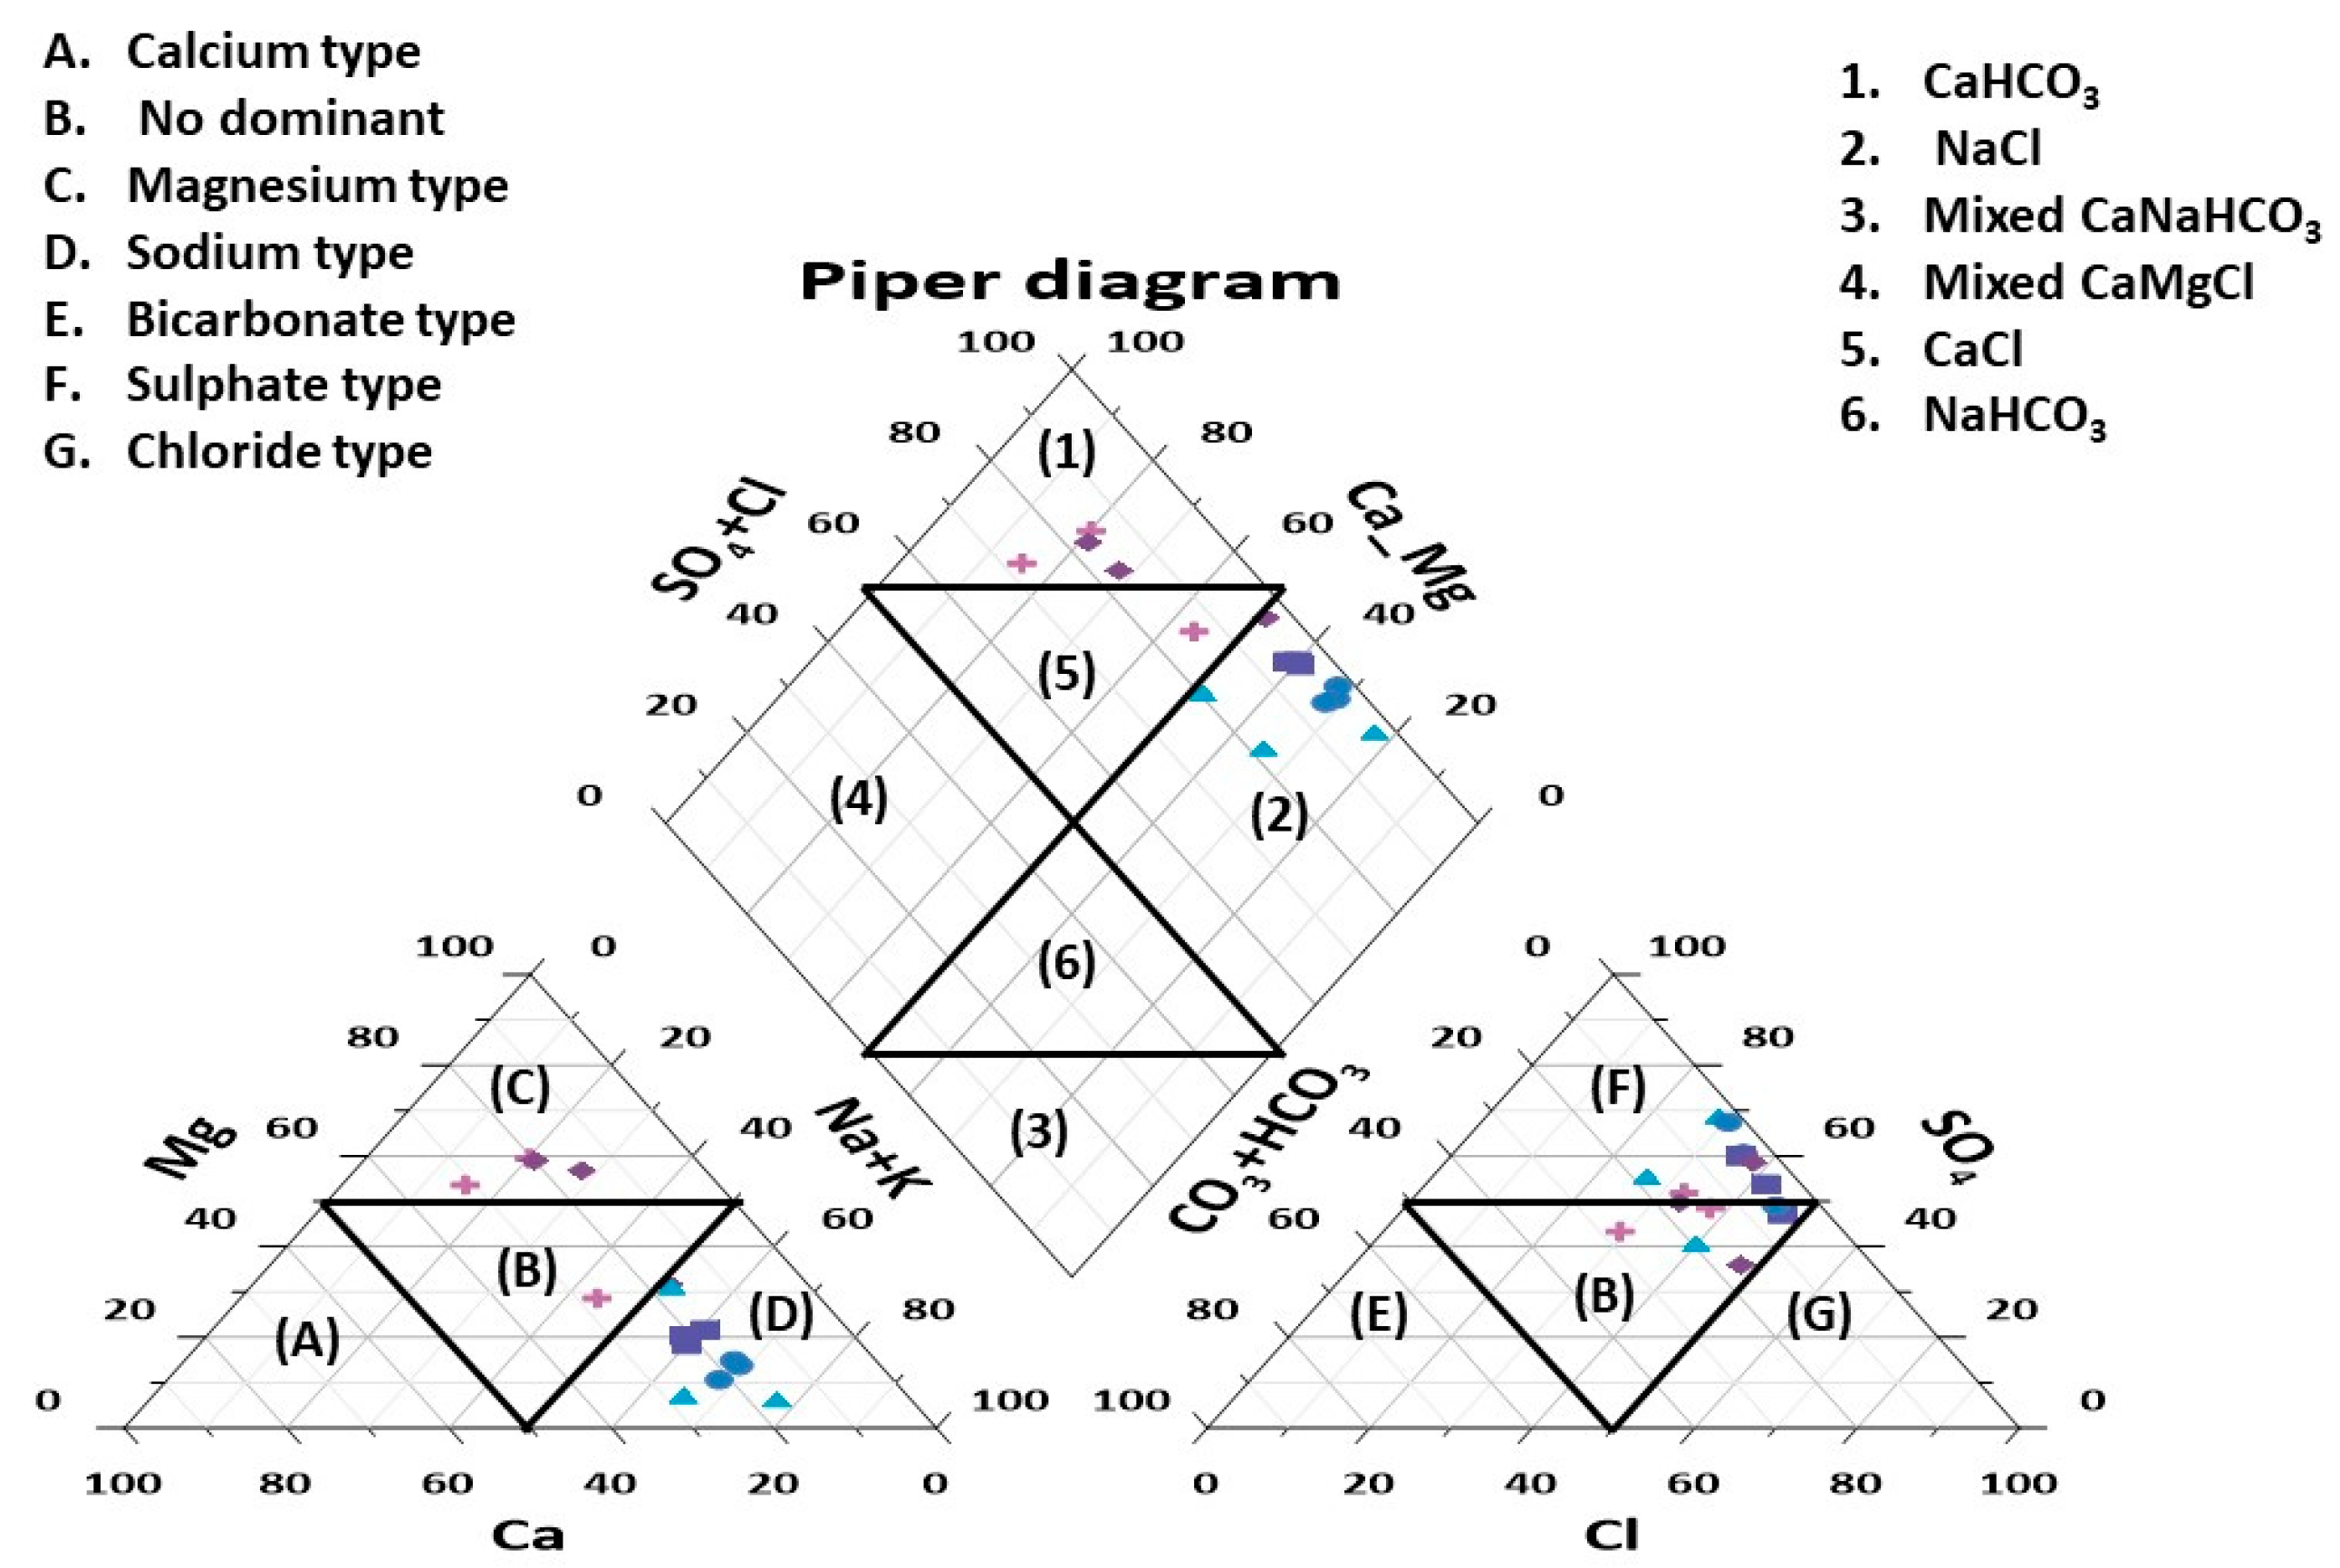
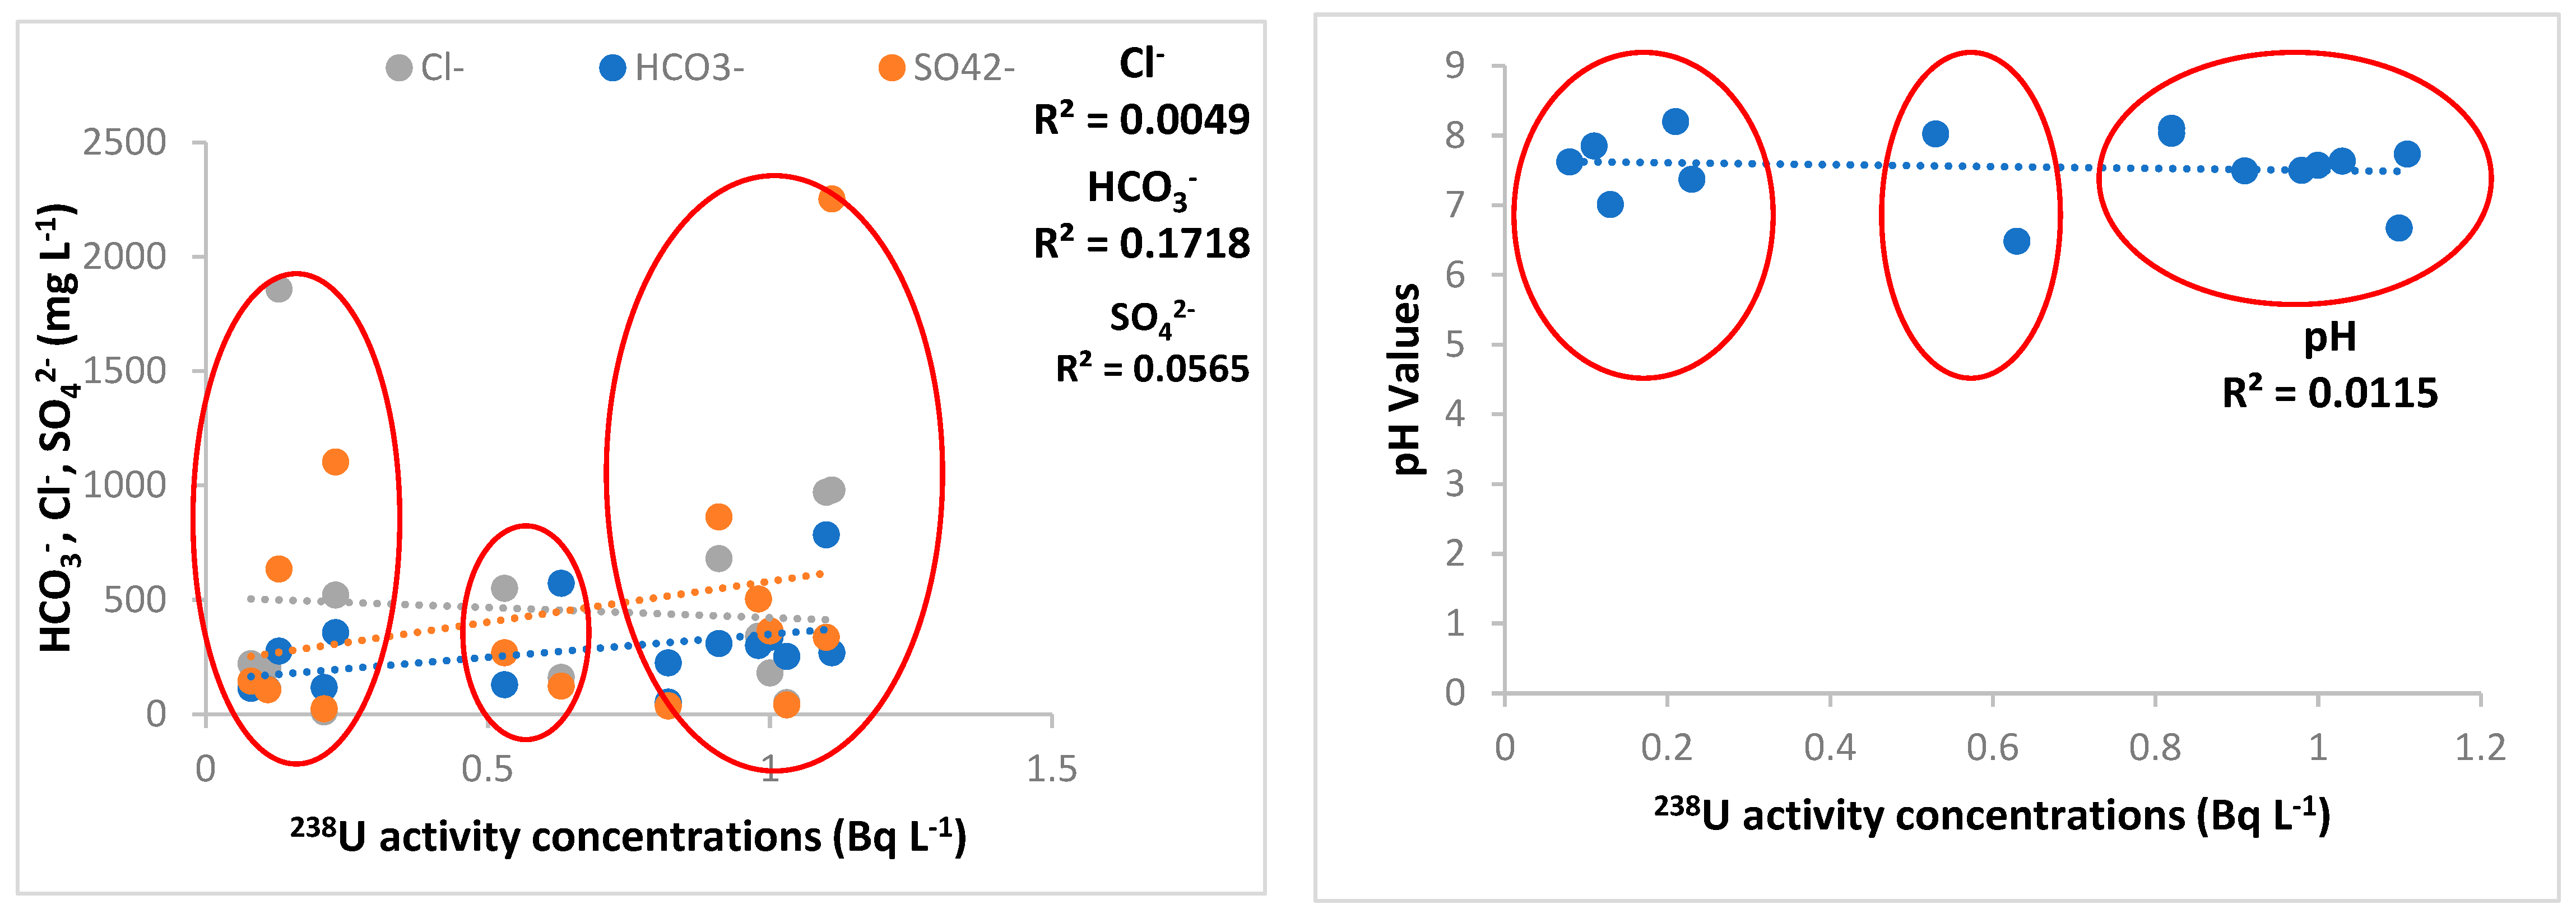
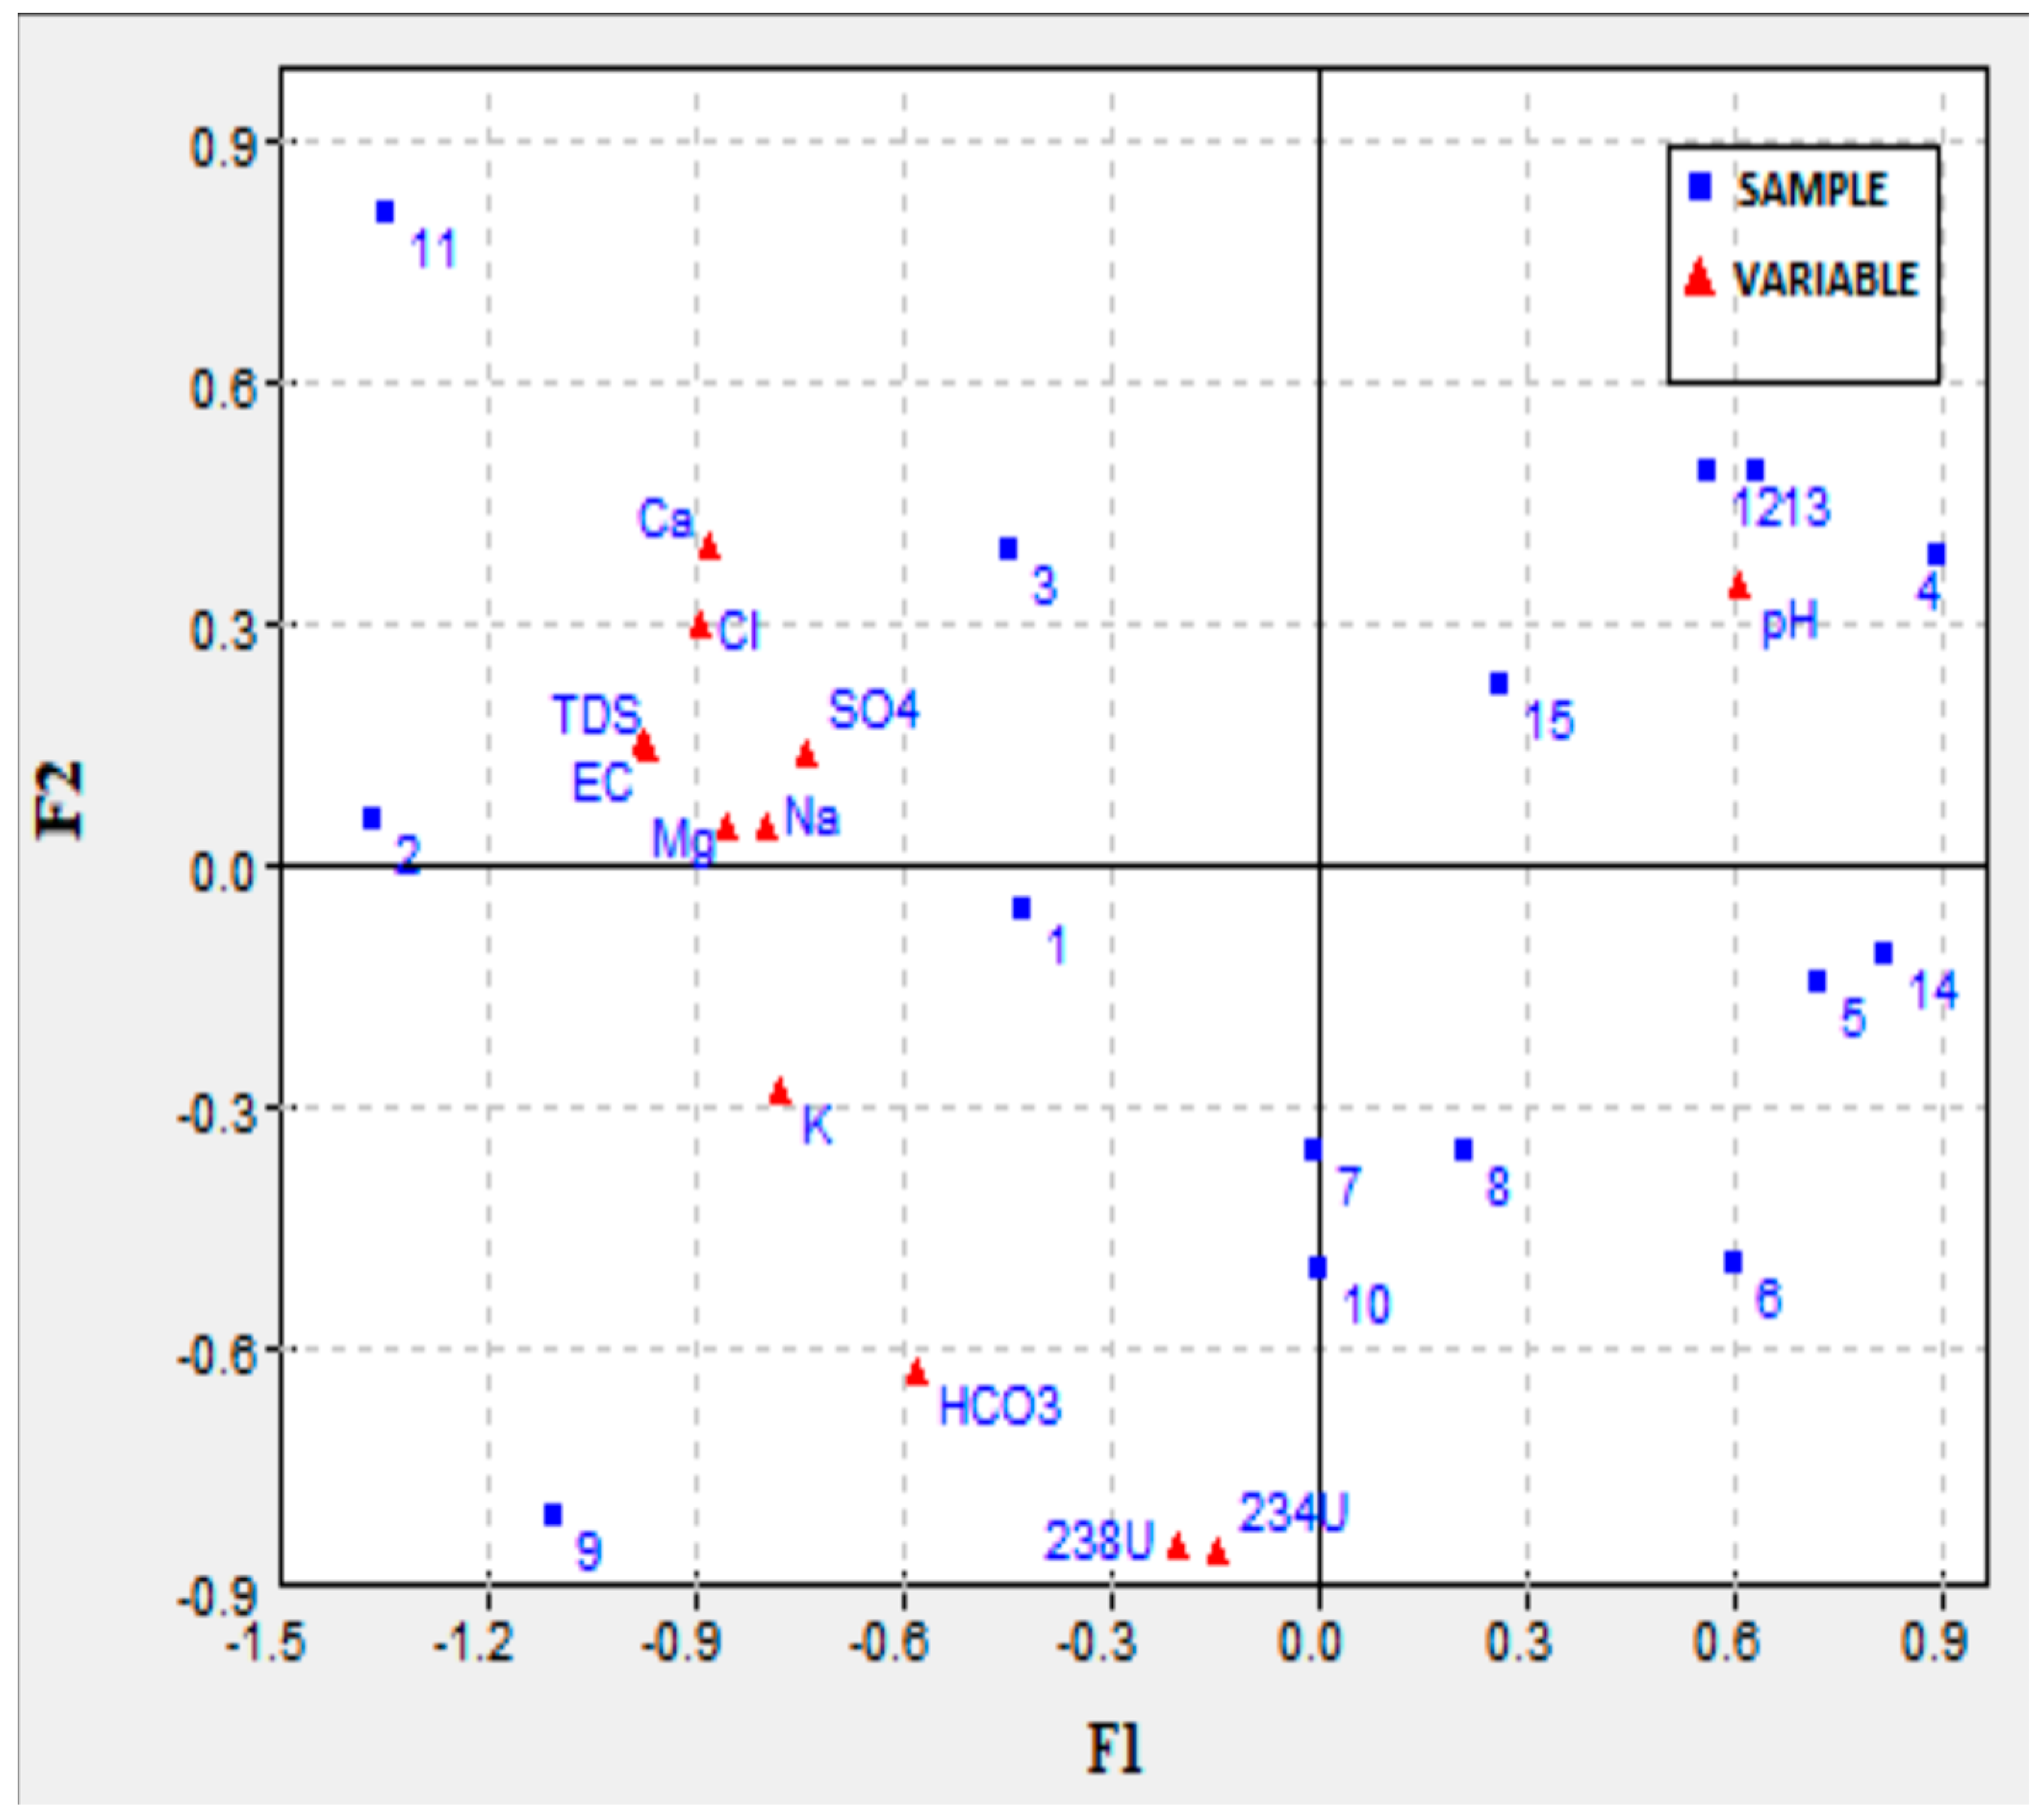
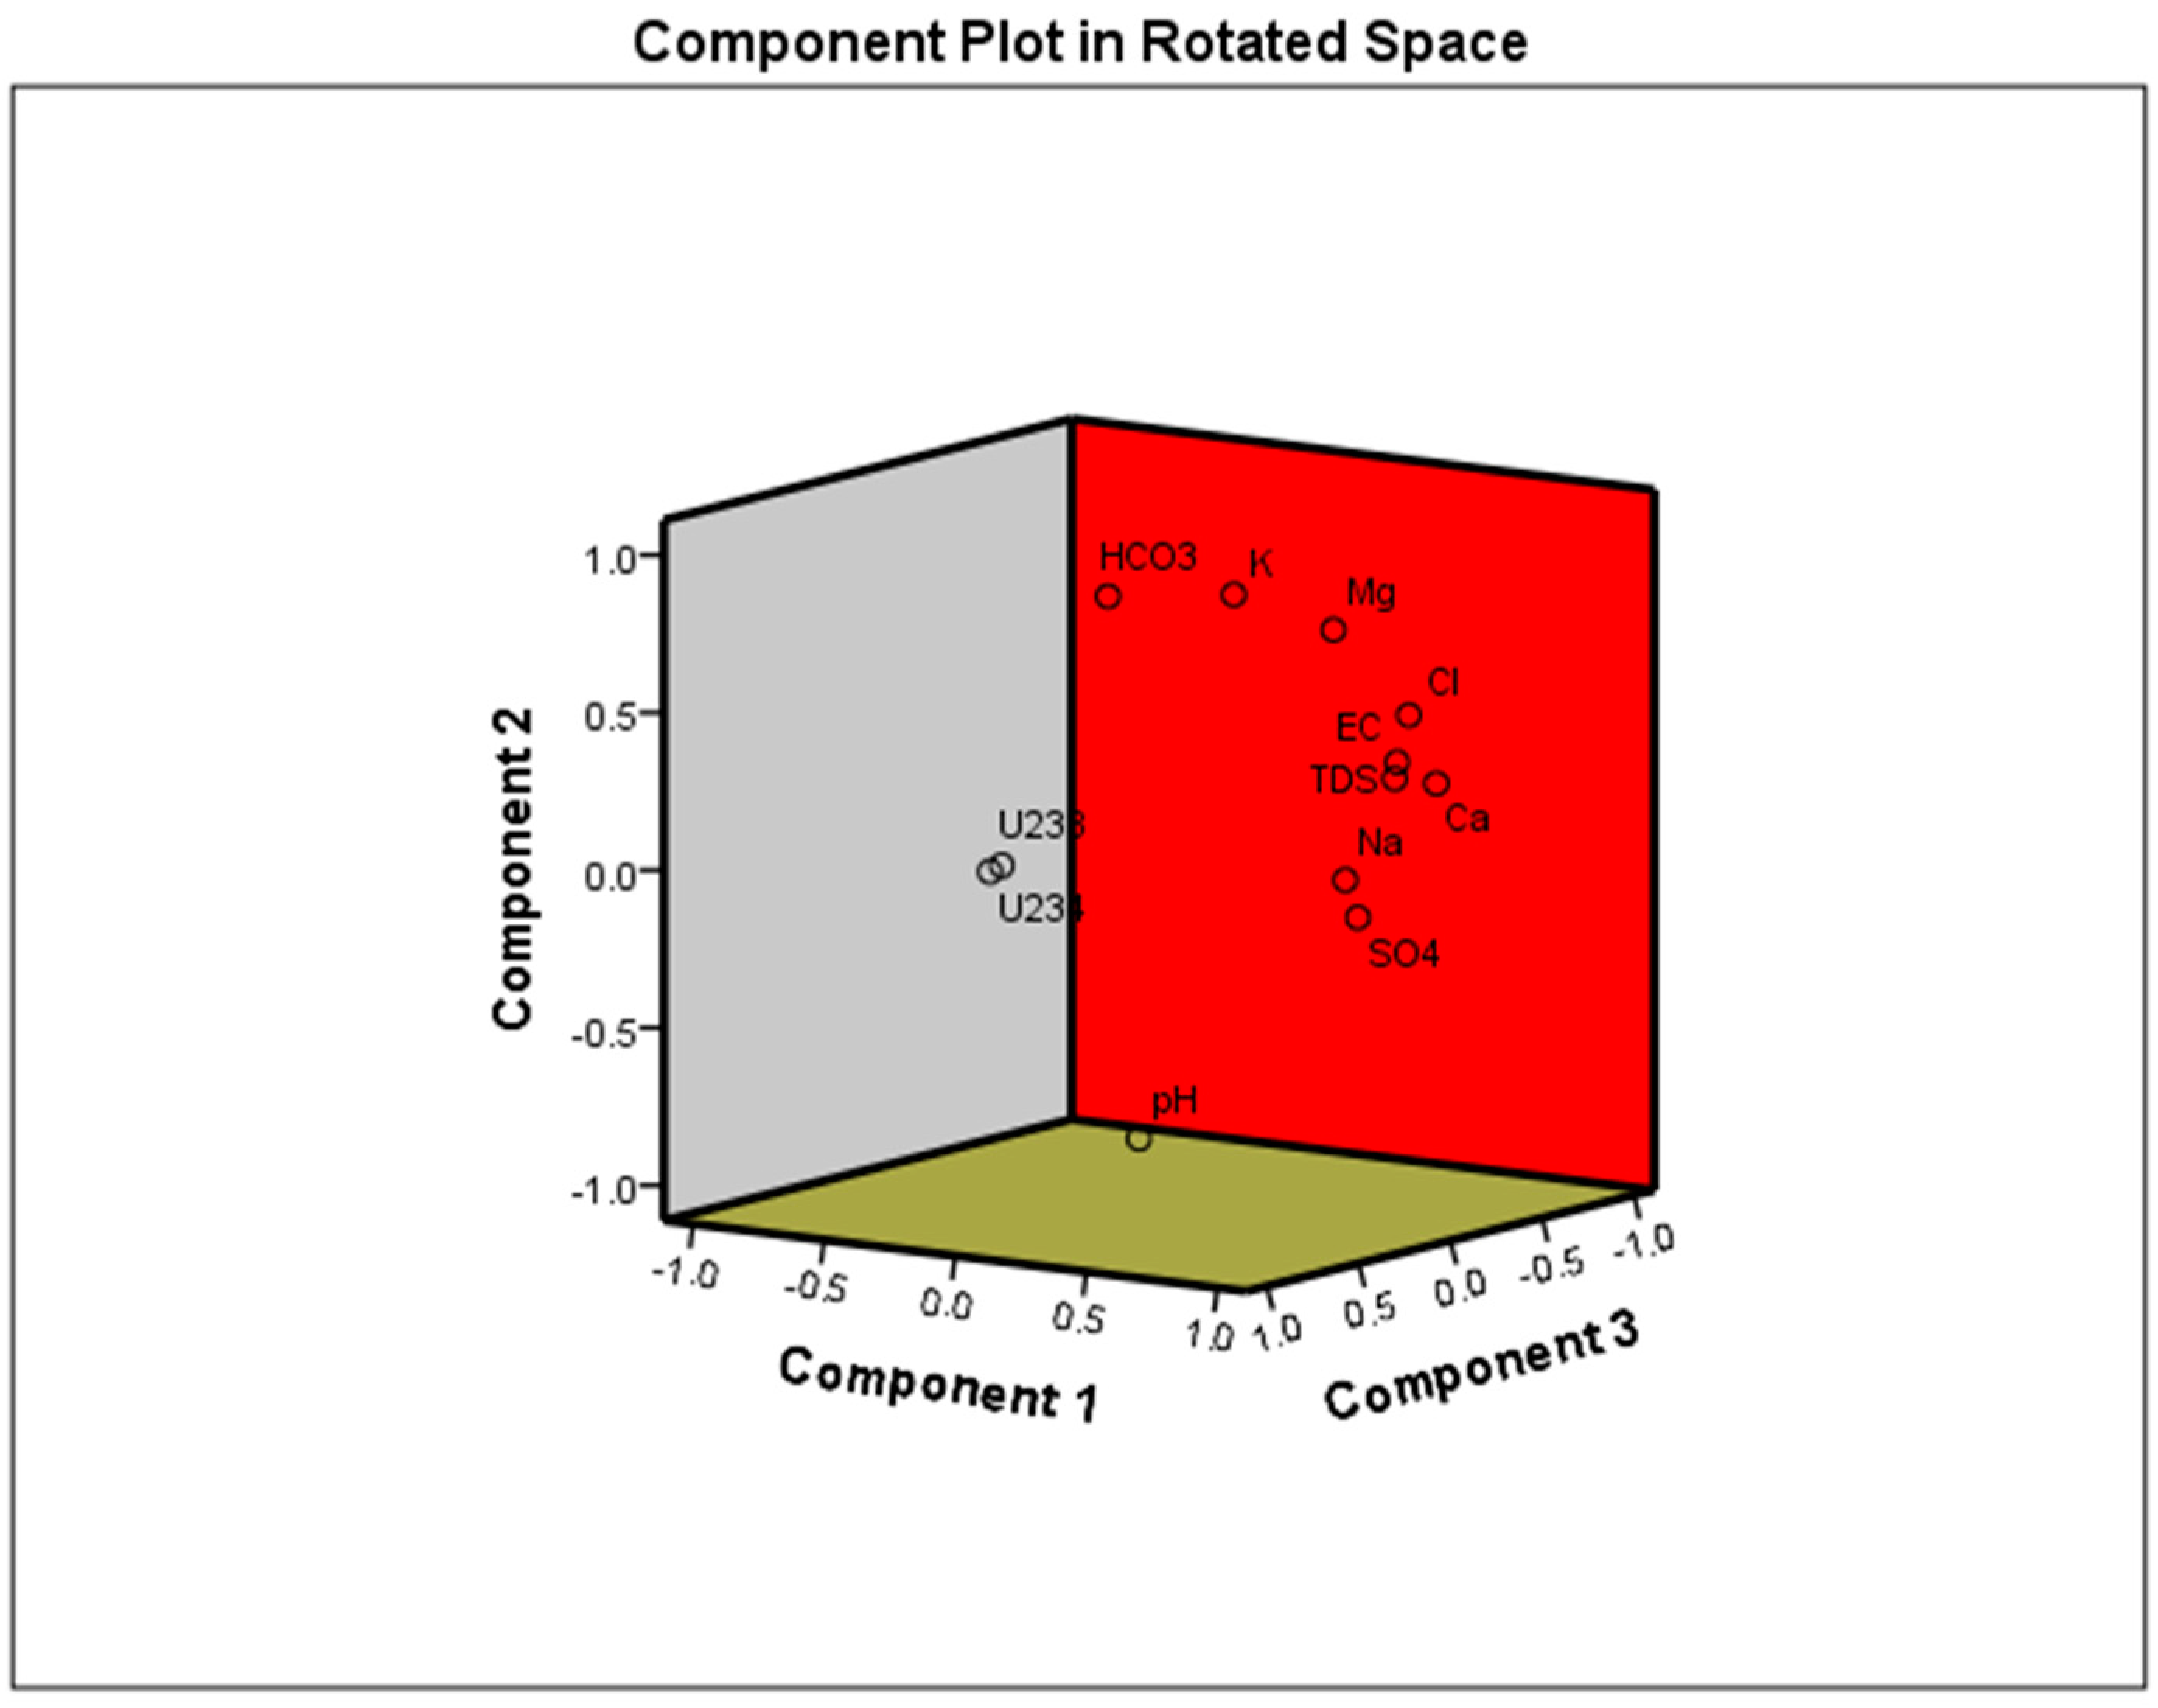
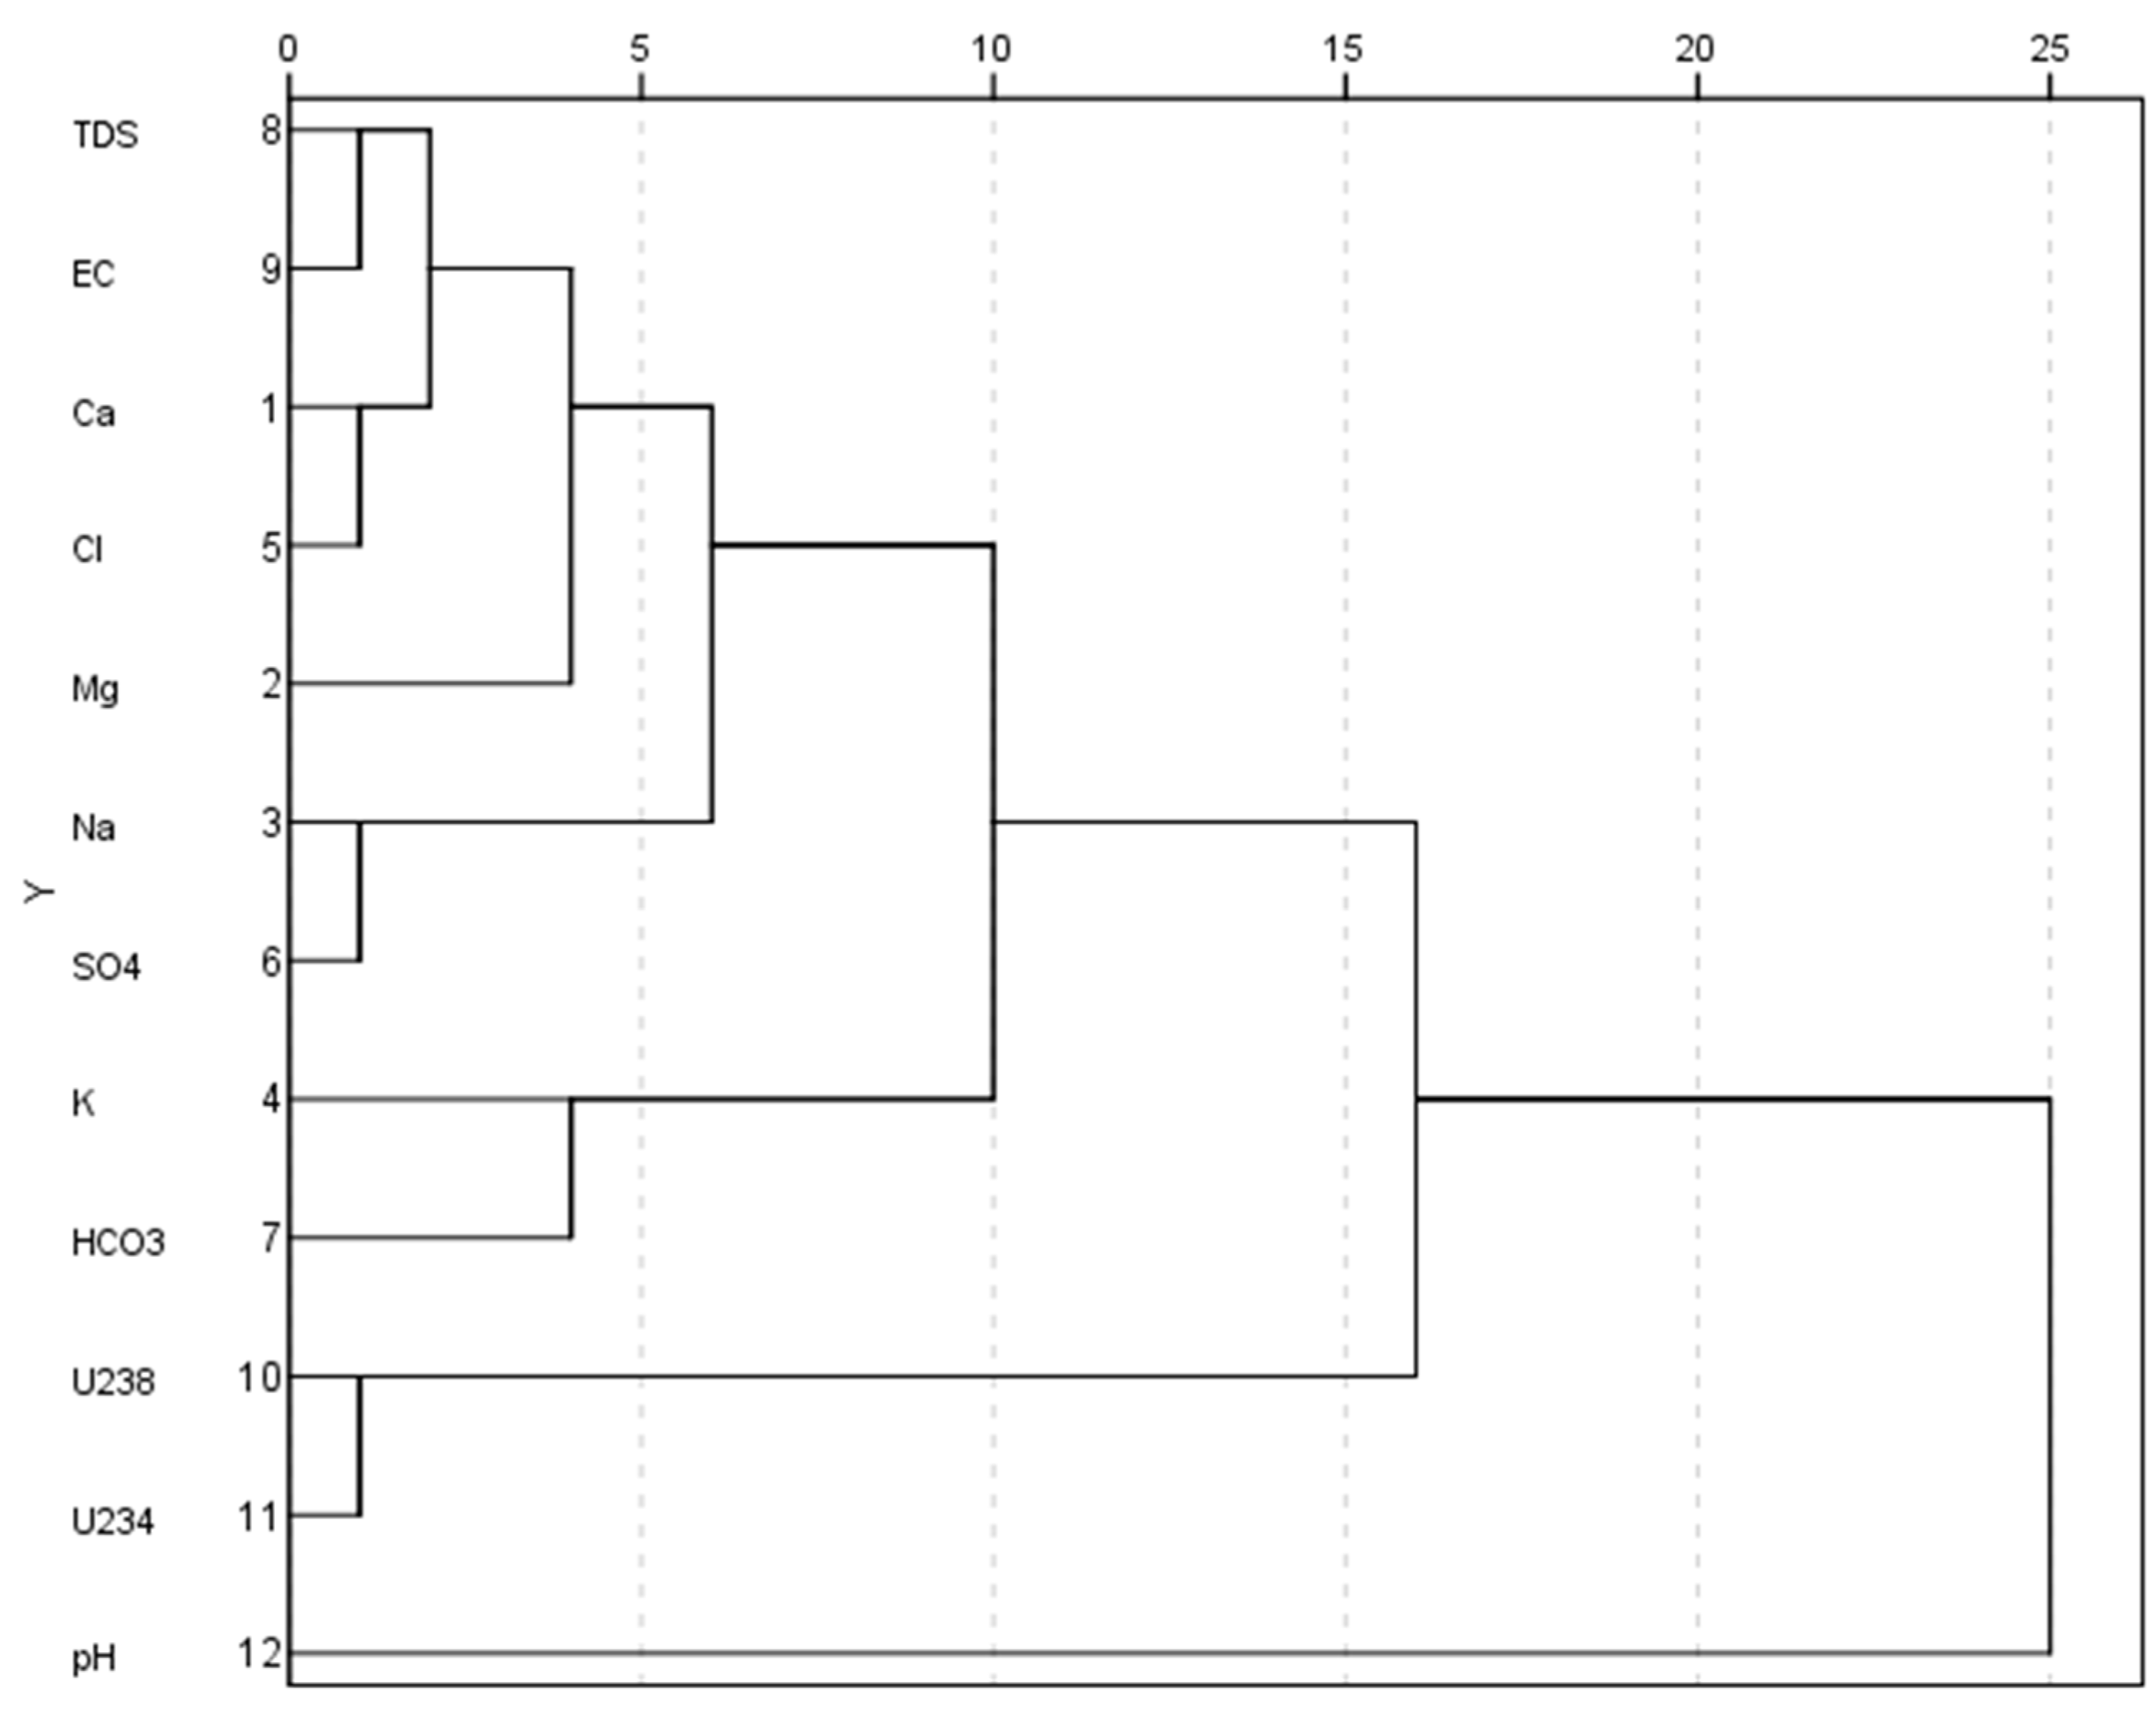
3.1. Groundwater Characteristics

The average groundwater pH in the study area ranged between 6.48 ± 0.7 and 8.2 ± 0.7, with an average of 7.6 ± 0.5, which indicated that the groundwater was slightly acidic to neutral in nature. The pH values of the groundwater well samples were within the acceptable range of 6.5–8.5 [14]. The collected groundwater wells had sodium (Na+) values ranging between 14 and 929 mg L−1, with an average of 250.6 mg L−1 (Table 1). In some of the collected samples, these values were below the allowed limit; in others, they were over it. According to the WHO 2011 guidelines [14], the upper limit is 200 mg L−1. The amount of sodium is higher in igneous rocks. While sodium concentrations are considerably lower in resituates and hydrolytes, very trace levels are found in carbonate rocks. In general, when sodium is leached from rocks, it prefers to stay in solution because nearly all sodium compounds are very soluble.
The studied groundwater samples had potassium (K+) values ranging between 1.5 and 15.4 mg L−1, with an average of 5 mg L−1 (Table 1); The permissible value of potassium according to the WHO 2011 guidelines [14] is 12 mg L−1. This indicated that none of the groundwater samples that were collected were above the permitted limit for potassium. In igneous and metamorphic rocks, silicate minerals, orthoclase microcline, hornblende, muscovite, and biotite are likely the source of potassium. As gypsum and sulfate deposits evaporate, significant amounts of potassium are released into the groundwater [15,16,17]. A tool for calculating water salinity is EC. Table 1 shows that the electrical conductivity (EC) values ranged between 333 and 6520 µS cm−1, with an average of 2578.1 µS cm−1. Since the permissible limit of EC is 1000 µS cm−1 [13], the results indicated that some of the collected groundwater samples should be classified as brines with extremely high salt concentrations [15,16].
Nearly half of the groundwater samples that were collected were above the acceptable limit for calcium, which is 75 mg L−1 [14]. The calcium concentrations ranged between 40 and 840 mg L−1, with an average of 283.1 mg L−1 (Table 1). Calcium is found in many surface and groundwater bodies of water due to its ubiquitous occurrence and solubility. In addition to calcium, magnesium also contributes significantly to groundwater hardness. It can be found in large amounts in several common minerals, including magnetite and dolomite. According to Table 1 and the WHO (2011) [14], the acceptable limit for magnesium is 50 mg L−1, yet the amounts of magnesium in the groundwater samples that were collected ranged between 10 and 207.4 mg L−1, with an average of 50.7 mg L−1 [14].
The collected groundwater samples had HCO3 and Cl values that ranged between 52 and 784 mg L−1, with an average of 279.5 mg L−1, and between 10 and 1859 mgL−1, with an average of 453.9 mg L−1, respectively (Table 1). The acceptable levels of HCO3 and Cl were are 500 and 250 mg L−1, respectively [14]. The dissolving of minerals such as silicate and sedimentary rocks in groundwater, carbonate precipitates, and the dissolution of atmospheric CO2 in groundwater can be blamed for the high concentration of HCO3 and Cl [16]. Between 23 and 2253 mg L−1 of SO42− were present in the collected groundwater samples. The permissible limit of SO42− according to the WHO 2011 guidelines [14] is 250 mg L−1 (Table 1). One of the main anions found in groundwater is sulfate (SO42−). Sulfur is primarily found in water in the oxidizing form (S6+) or as sulfate (SO42−), while it can also be found in some reducing situations as sulfide (S2−). The primary ions were contributed by calcium, sodium, chloride, sulfate, magnesium, potassium, and bicarbonate, in that order. Ion exchange, mineral dissolution, and water/rock interactions regulate the geochemistry of groundwater [17].
The two most common types of groundwater are dominated by Ca2+ (Mg2+)-HCO3 (SO42−) and Mg2+ (Ca2+)-SO42− (HCO3). A permissible error of 2% up to 4% can occur if there is a conductivity value > 2000 μS cm−1 and this error % is calculated using the anion and cation equation as follows:
E r r o r   % = C a t i o n a n i o n s C a t i o n s + a n i o n s
The Piper diagram was applied to the collected groundwater samples for evaluation and exploration of the type of collected groundwater. There were two triangles. One represented the anion, and the other the cation. Using the concept of the hydrochemical plane, the areas of the cation and anion fields were combined to represent a single point in the rhombus field. Compared to previous graphical methods, these three-line plots were successful in illuminating the specific chemical correlations between groundwater samples. The chemical information obtained from the collected groundwater samples was displayed as a three-line plotted, as shown in Figure 3.
In the cation plot field, the collected groundwater samples fell in the Na-Mg and magnesium type, while in the anion field, the collected groundwater samples fell in the SO4-HCO3 and no dominant type. The majority of the collected groundwater samples were found inside the CaHCO3 and NaCl subareas of the diamond-shaped region, reflecting the groundwater type and indicating that the recharge came from irrigation canals and surface water. As a result, the findings demonstrated that weak acids, such as HCO3 and SO42−, and alkaline earth metals, such as Ca2+ and Mg2+, dominated the hydrochemistry of the groundwater.
Higher uranium concentrations were found in collected groundwater samples with lower pH values (6.25–8) and higher HCO3 content (Figure 4) since the HCO3 anion is stable in this pH range. It is obvious that the quantity of uranium and HCO3 showed a weak correlation (R2 = 0.172). At pH levels greater than 4, HCO3 plays a well-known function in uranium leaching by creating stable soluble complexes that stop uranium from precipitating. Samples with low concentrations of HCO3, SO42−, TDS, and uranium were obtained from shallow water wells where the water table was protected by a nonporous stony layer, thus preserving the rock-water interaction (Figure 4).

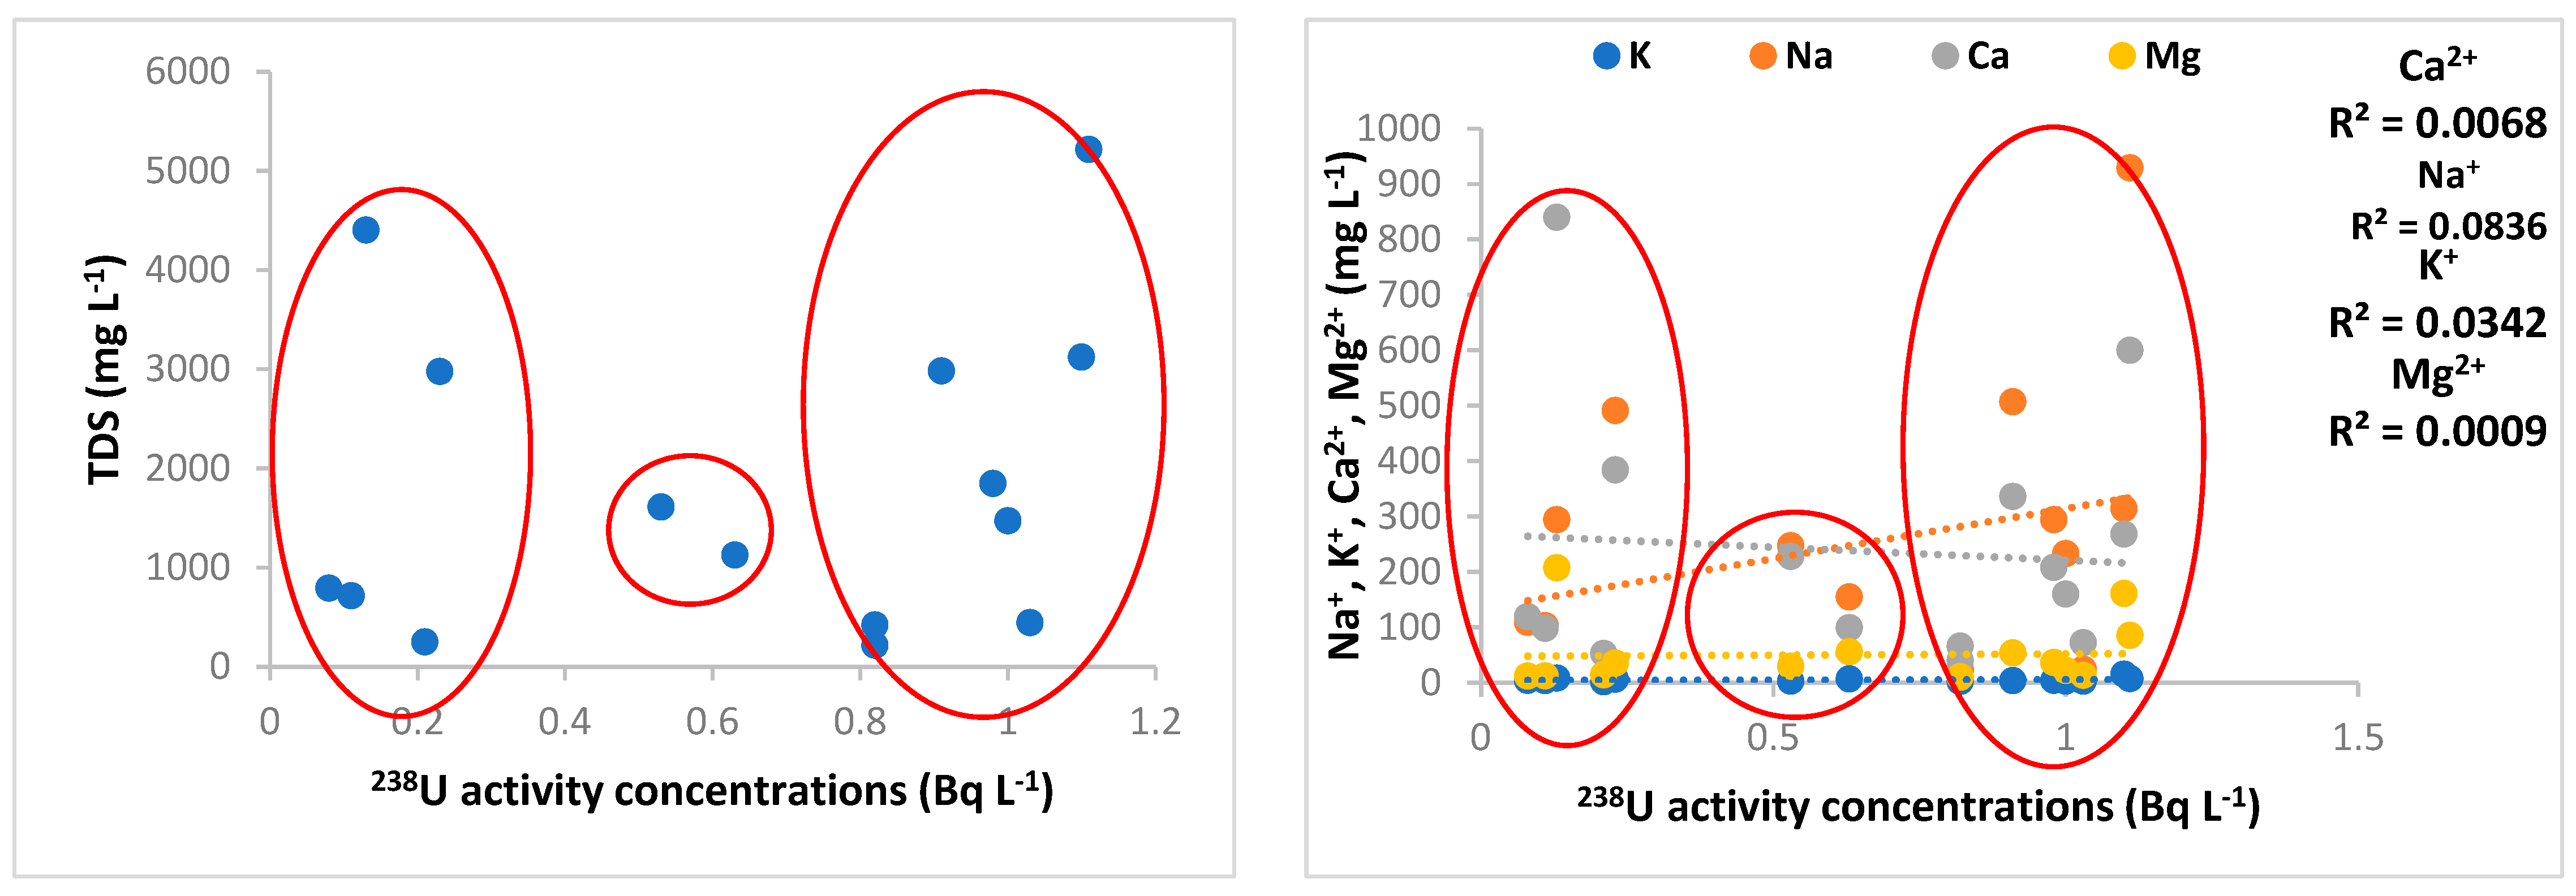
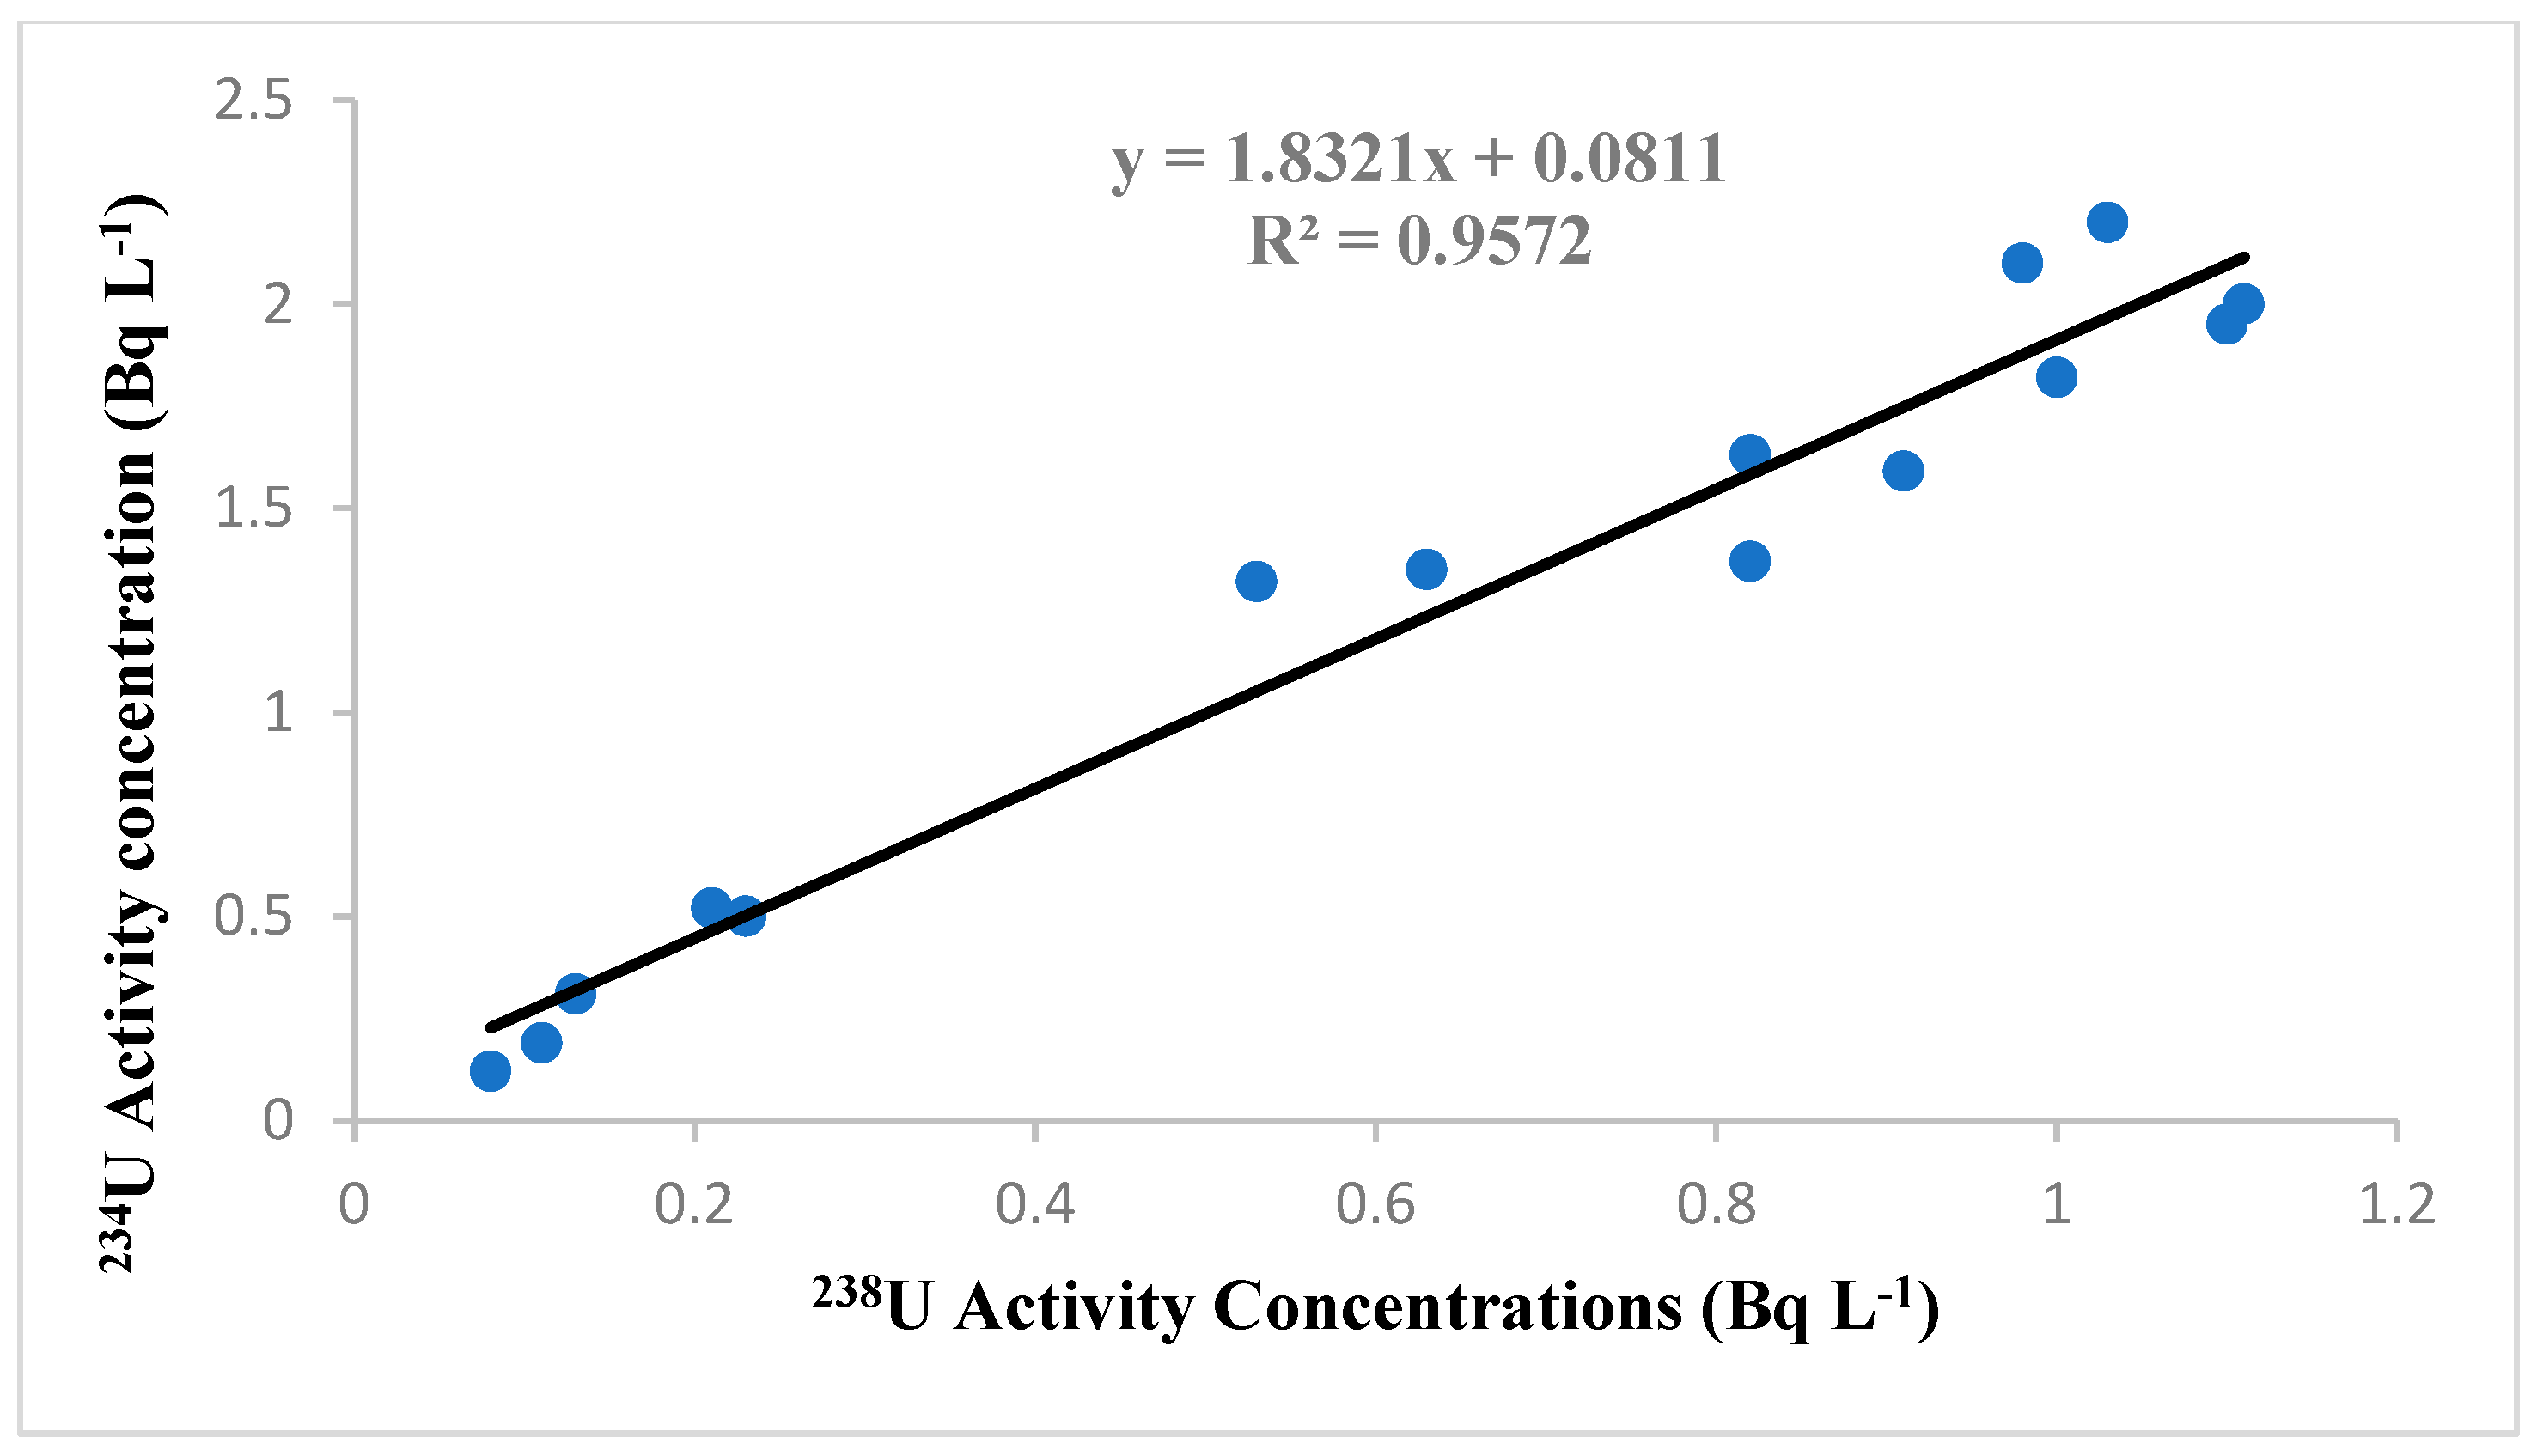
3.2. Uranium Activity Concentrations

Table 1 shows the concentration of uranium in groundwater samples collected from the Ha’il region. The activity concentrations of 238U ranged between 0.08 ± 0.04 and 1.11 ± 0.06 Bq L−1, with an average of 0.67 ± 0.05 Bq L−1. The average of 234U activity concentration was 1.26 Bq L−1, with values ranging between 0.12 and 2.2 Bq L−1 (Table 1 and Figure 5).
The WHO 2011 guidelines [14] report the acceptable 238U activity concentration to be 0.372 Bq L−1. Different groundwater sources can also influence variations in activity concentrations in addition to geologic formations [18,19]. There is no doubt that the concentration of 238U positively correlated with that of 234U (R2 = 0.957) (Figure 5). The plants that were collected from the study area were divided into two groups: fruit-bearing trees (lemon, fig and narenj) and fruit-bearing shrubs (green pepper and eggplant). For lemon, fig, and narenj, the activity concentrations of 238U were 1.69 ± 0.5, 0.76 ± 0.18, and 0.61 ± 0.13 Bq kg−1, respectively (Table 2). Additionally, the activity concentrations of 234U were 2.66 ± 0.64, 1.96 ± 0.3, and 1.65 ± 0.23 Bq kg−1 for lemon, fig, and narenj, respectively (Table 2). It was evident that the 238U concentration correlated positively with that of 234U. In fruit-bearing shrubs, green pepper and eggplant had 238U activity concentrations of 25.52 ± 3.89 and 9.21 ± 1.33 Bq kg−1, respectively, (Table 2), while they had 234U activity values of 60.42 ± 8.4 and 24.65 ± 2.78 Bq kg−1, respectively (Table 2).
Some samples had low uranium and TDS concentrations. These samples were collected from shallow water wells where the water table was underlain by a nonporous rocky-layer that kept the rock-water interaction to minimum. Higher uranium concentrations were found in water samples with relatively lower pH and higher HCO3 content. CO32− and HCO3 have a well-known role in uranium leaching and the formation of stable soluble complexes that prevent uranium precipitation at pH > 4 [20].
Well depth usually used to improve the discussion of results because it is a measure of the distance the water at land surface would have to travel to reach the well reservoir. The well depths ranged from 25 to 650 m, where the depth of 68% of wells was <150 m and that of 10% was >250 m (Table 1). The wells belonged to different water tables. No correlation was observed between well depth and uranium concentration in the groundwater. Higher uranium concentrations in groundwater were found in samples obtained from granitic aquifers where the water had relatively lower pH and higher HCO3 content.
The absence of very clear correlations may be related to the complexity of the aquifer-water system, in which more than one factor may influence the dissolution or precipitation processes of uranium in this study.

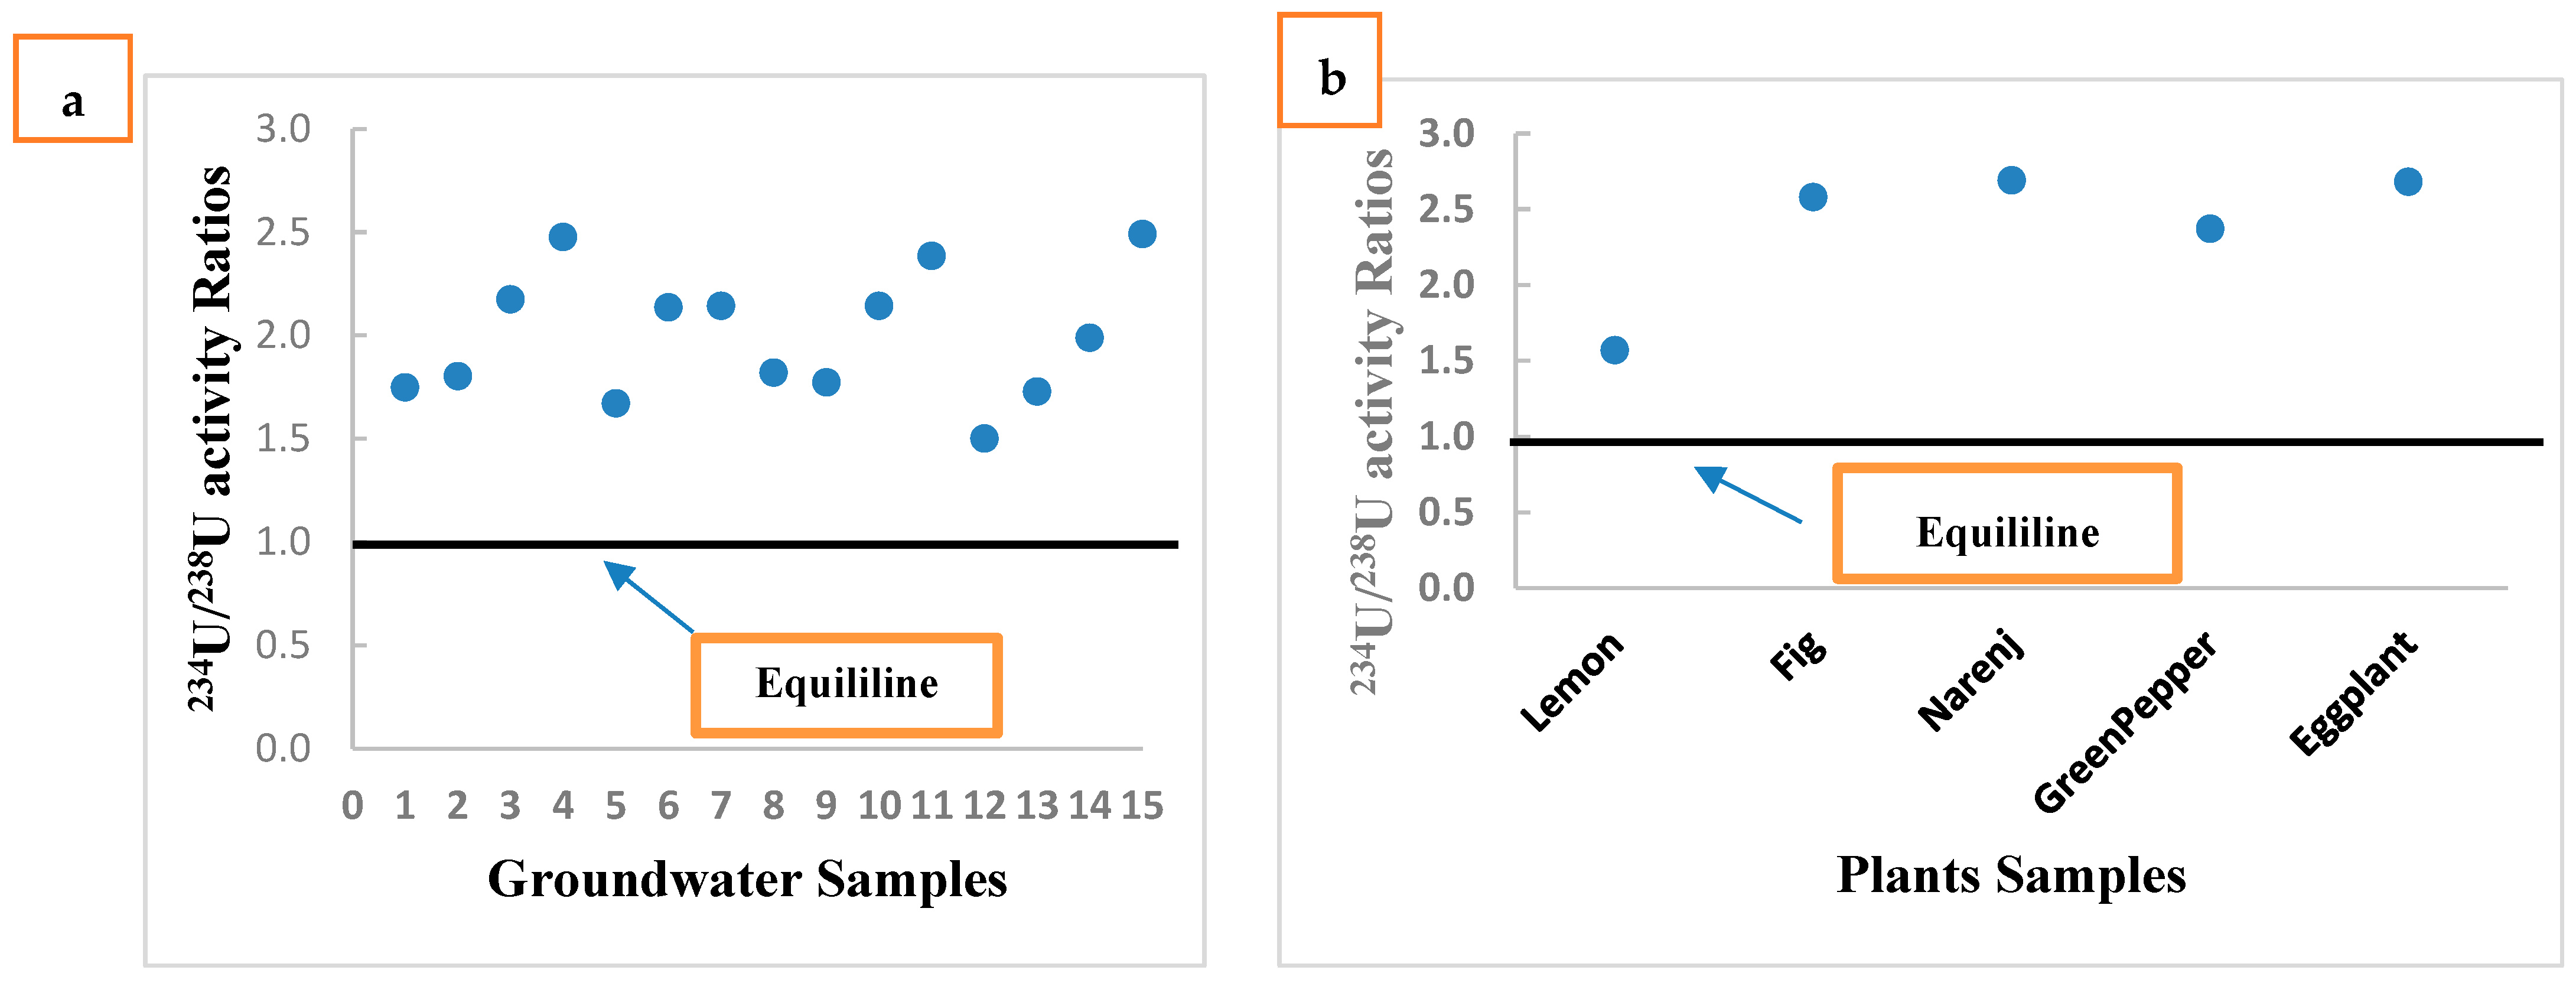
3.3. 234U/238U Activity Ratio

In the groundwater samples that were collected, the activity ratios of the uranium isotopes 234U/238U ranged from 1.5 ± 0.09 to 2.49 ± 1.27, with 1.95 ± 0.52 being the average (Table 1). It is clear from Table 1 that the 234U/238U activity ratios in the collected groundwater samples were higher than 1 (Figure 6a).
Vegetation samples were collected from two field sites within the study area in summer. The rainy season is spring, in which the groundwater level usually increases. Each site depended on a separate drilled well for water supply. The scientific names of the collected plants from fruit-bearing trees and shrubs are listed in Table 2.
Fruit-bearing shrubs provide delicious edible fruit without the excessive space requirement of a tree. These shrubs are a versatile addition to the landscape by not only producing fruit but also acting as a hedge, fence, or barrier. When choosing which shrub to grow, the needs of the garden must be considered as well as the planting requirements of the shrub. A fruit-bearing tree is a tree which bears fruit that is consumed or used by animals and humans. All trees that are flowering plants produce fruit, which are the ripened ovaries of flowers containing one or more seeds. The results from the plant samples were considered as the only plants present in the study area. In addition, the process that governs the uptake of radionuclides by roots is very complex, involving many interacting soil and plant factors. Even when transfer factors are species specific, there is often poor correlation between total soil radioactivity concentration and plant radionuclide activity concentration, which requires more research and studies.
The 234U/238U activity ratios for lemon, fig, and narenj fruit-bearing trees were 1.57 ± 0.84, 2.58 ± 1.01, and 2.69 ± 0.95, respectively (Table 2). The activity ratios of 234U/238U for green pepper and eggplant fruit-bearing shrubs were 2.37 ± 0.69 and 2.68 ± 0.69, respectively (Table 2). In general, it is evident that the 234U/238U activity ratios in the collected plants were higher than unity in the fruit-bearing trees and shrubs (Figure 6b). The activity ratio of 234U to 238U is unity in the bulk of such materials. However, when such rocks and minerals interact with groundwater, the ratio may deviate from unity. Variation in the 234U/238U activity ratio results from preferential leaching of 234U from the rock matrix, which is due to crystal defects from alpha particle recoil [20].
To provide a more thorough explanation of oxidation-based fractionation, Adloff and Rossler (1991) [21] established a conceptual model. Their concept states that the 234Th atom that results from disintegration is forced by recoil into regions of the rock matrix where oxygen atoms gather around the 234Th atom [21]. Thus, there may be an increase in the oxidation potential at the conclusion of the 234Th recoil trajectory. As a result, the more mobile hexavalent state in which 234U, the daughter nuclide of 234Th, is produced may cause it to have a different valence from 238U. Of course, significant 234U/238U fractionation resulting from valence differences requires that total uranium be in the tetravalent state for a long enough period of time for 234U to accumulate in the increasing hexavalent state (Figure 7). The positive correlation between 238U and 234U in groundwater samples, fruit-bearing trees, and fruit-bearing shrubs is related to the high rate of leaching of uranium isotopes into the groundwater flowing through the faults and fissures between the grains of reservoir rocks [22].
Two different ways for evaluating the increased activity ratios of 234U/238U have been presented. One is the direct release of 234Th nucleus from a recoiling mineral grain into the aquatic system. Another has to do with the recoiling atom’s chemically unstable condition, which is more likely to be oxidized and leachable due to its peculiar lattice position in the material, i.e., valence change or chemical state change model. As a result, 234U in such a site is likely to dissolve in water, especially if the unstable site causes the oxidation of U4+ to U6+ (UO22+). An intermediate mechanism has also been proposed, which considers the removal of implanted recoil nuclei in the alpha-recoil track produced in an adjacent grain due to subsequent etching by chemical solution [23].
According to Kronfeld et al. (2004) [24], nuclear transformation results in chemical bonds breaking and crystal structures shifting, the creation of microchannels that let water molecules enter mineral grains, and auto-oxidation of the daughter nuclide due to the loss of two beta particles to the more soluble U6+ oxidation state. This mechanism makes the 234U isotope preferentially leach over rock boundaries, making it more prone to groundwater than the parent nuclide [24].
Root uptake is assumed to be only affected by the radionuclides in irrigation water and the exchangeable fraction of radionuclides in soil. Therefore, it is important to quantify the fraction of soil radionuclides available for root uptake. Such information is important for predictive models and environmental assessments where the soil-plant pathway is a key contributor to potentially harmful effects to plants, animals, and human. Because uranium tends to adsorb on cell wall components, its mobility in plant tissues is restricted. As a result, concentrations are often higher in tissues situated lower on the plant and are highest on the root surfaces. Compared to how these radionuclides are transported from the soil to grass roots, 234U and 238U are both more readily absorbed. In order to evaluate the bioavailability of uranium isotopes in terrestrial ecosystems, soil to plant transfer prediction is crucial. One possible reason why concentrations of uranium isotopes change noticeably between different plants may be due to soil characteristics and variations in how well-suited different plants are to assimilating uranium isotopes [25].
As a measure of how far water at the land surface would have to travel to reach the well reservoir, well depth is commonly used to improve the discussion of results. Most wells ranged in depth from 25 to 650 m, with approximately 68% of wells having a depth of <150 m and approximately 10% of wells being deeper than 250 m. Different water tables were accessed by the wells. The depth of the wells did not correlate with the amount of uranium and radium in the groundwater. As shown in Table 1, uranium concentrations were found to be higher in groundwater in granitic aquifers, where the pH and HCO3 content were relatively low. In contrast, higher radium concentrations were found in the water of sandstone aquifers, where SO4−2 and HCO3 concentrations were relatively low. In other words, the results indicated that no specific parameter had a predominant effect on uranium leaching in the study area. The geological and groundwater flow characteristics of aquifers are essential parameters that influence radionuclide dissolution, chemical species, and some physical parameters.
The statistical analysis of the collected groundwater samples was achieved using SPSS statistical software. Figure 8 shows that there were some typical data for sulphate, chloride, and bicarbonate anions, as well as for magnesium, calcium, and sodium cations. This was due to the agriculture practices and geology of the study area in the Ha’il region. Carbonate anions were not detected in all samples. The predominant cations were Na+ and Ca2+, whereas the predominant anions were Cl and SO42−.
The principal component analysis (PCA), as shown in Figure 9, indicted that factor 1 was controlled by the pH compared to the rest of the variables analyzed. In the case of axis 2, the hydrochemical correlation was K+-HCO3 together with 238U and 234U, compared to the rest of the elements.
Component loading values above 0.5 are significant and useful, while factor loading values above 0.75 are categorized as strong, 0.75–0.50 are moderate, and 0.50–0.30 are weak [26]. PC1 was the most significant in the results, as shown in Table 3. It also exhibited positive loading with EC, TDS, Cl, Mg2+, Ca2+, Cl, Na+, SO42−, K+, and HCO3 (Figure 10 and Figure 11; Table 3). Naturally, due to water-rock interaction, these groupings could have their origin in the aquifer matrix. Cl and SO42− ions are frequently associated with sedimentary rocks and are common markers of pollution, while Na+, Mg2+, and Ca2+ are naturally occurring in groundwater because they are leached from rocks, and also exist in landfill leachate. Additionally, the ions Ca2+, Na+, and SO42− may come from fertilizers [27].
PC2 showed high positive loading with 238U, 234U, and HCO3; weak positive loading with Ca2+ and K+, and negative loading with EC, TDS, Cl, SO42−, and pH. PC3 showed high positive loading with Na+, SO42−, pH, 238U, and 234U; and weak positive loading with EC and TDS; negative loading with Cl, Mg2+, and K+. CO32− and HCO3 have a well-known role in uranium leaching [28] and form stable soluble complexes that prevent uranium precipitation at pH > 4. Some samples had low uranium content although they had low SO42− and HCO3 concentrations (Table 1). The same samples also had low uranium and TDS concentrations. These samples were collected from shallow water wells where the water table was underlain by a nonporous rocky-layer, which kept the rock-water interaction to a minimum (Figure 11).

4. Conclusions

The Ha’il region, bounded by latitudes 27°00′ and 28°00′ N and longitudes 40°30′ and 42°00′ E, occupies an area of approximately 16,500 km2 in the northern part of the Arabian Peninsula. For this study, 15 groundwater samples were collected from 15 wells in the Ha’il region by tapping the fractured underground aquifer. In this paper, we attempted to evaluate the activity concentrations of uranium and 234U/238U isotopic ratios in some collected groundwater and plant samples from the Ha’il region. The pH and TDS of the water at the site were immediately measured using a portable field device. Elemental analysis for Na+ and K+ was performed by flame atomic absorption spectrophotometry. Titrimetric methods were used to analyze Ca2+, Mg2+, CO32−, HCO3, Cl, and SO42−. Uranium isotopes, 238U and 234U, and the 234U/238U isotopic ratio were measured using alpha spectrometry. Activity concentrations of 238U ranged between 0.08 ± 0.04 and 1.11 ± 0.06 Bq L−1, with an average of 0.67 ± 0.05 Bq L−1. Activity concentrations of 234U ranged between 0.12 ± 0.01 and 2.2 ± 0.8 Bq L−1, with an average of 1.26 ± 0.11 Bq L−1. The international guideline according to the WHO (2011) [14] is 0.372 Bq L−1. The 234U/238U activity ratios in the collected groundwater samples ranged between 1.5 ± 0.09 and 2.49 ± 1.27, with an average of 1.95 ± 0.52. In fruit-bearing trees, the 234U/238U activity ratios were 1.57 ± 0.84, 2.58 ± 1.01, and 2.69 ± 0.95 for lemon, fig, and narenj, respectively. In fruit-bearing shrubs, the 234U/238U activity ratios were 2.37 ± 0.69 and 2.68 ± 0.69 for green pepper and eggplant, respectively.
In general, it is clear that the 234U/238U activity ratios in the collected plants (fruit-bearing trees and shrubs) were higher than unity. The ratio may deviate from unity because of the interaction of groundwater with rocks and the α-recoil phenomenon. It is clear that the groundwater and plants in the area are unfit for food and water consumption.
The wells belonged to different water tables. No correlation was observed between well depth and uranium concentration in the groundwater. Higher uranium concentrations in groundwater were found in granitic aquifers where the water had relatively lower pH and higher HCO3 content. The results indicated that no specific parameter had a predominant effect on uranium leaching in the study area. Many factors can change the concentration of U in the environment. The obtained activities were not extremely high, but it should be mentioned that uranium is a heavy metal that could accumulate in the human body, e.g., in the kidneys.

Author Contributions

Conceptualization, O.F. and M.R.K.; methodology, M.R.K.; software, O.F.; validation, O.F. and M.R.K.; formal analysis, O.F.; investigation, M.R.K. and O.F.; resources, O.F. and M.R.K.; data curation, O.F. and M.R.K.; writing-original draft preparation, O.F. and M.R.K.; writing-review and editing, O.F. and M.R.K.; visualization, M.R.K.; supervision, O.F. and M.R.K.; project administration, O.F. and M.R.K.; funding acquisition, O.F. All authors have read and agreed to the published version of the manuscript.

Funding

The authors extend their appreciation to the Deanship of Scientific Research (DSR), King Abdulaziz University, Jeddah under grant number IFPRC-194-135-2020.

Institutional Review Board Statement

Not applicable.

Informed Consent Statement

Not applicable.

Data Availability Statement

Not applicable.

Acknowledgments

This research was funded by the Deanship of Scientific Research (DSR), King Abdulaziz University, Jeddah under grant number IFPRC-194-135-2020. The authors acknowledge the technical and financial support provided by the Ministry of Education and King Abdulaziz University, Jeddah, Saudi Arabia, in the preparation of this paper.

Conflicts of Interest

The authors declare no conflict of interest.

References

  1. Kellogg, K.S.; Soeser, D.B. Sheet 27/41 B, Kingdom of Saudi Arabia; Open File Report USGS-OF-04-2; Saudi Arabian Deputy Ministry for Mineral Resources: Jeddah, Saudi Arabia, 1985; p. 35. [Google Scholar]
  2. Porcelli, D.; Swarzenski, P.W. The behavior of U- and Th-series nuclides in the estuarine environment. Rev. Mineral. Geochem. 2003, 52, 577–606. [Google Scholar] [CrossRef]
  3. Tissot, F.L.H.; Dauphas, N. Uranium isotopic compositions of the crust and ocean: Age corrections, U budget and global extent of modern anoxia. Geochim. Cosmochim. Acta 2015, 167, 113–143. [Google Scholar] [CrossRef] [Green Version]
  4. Chabaux, F.; Riotte, J.; Dequincey, O. U-Th-Ra fractionation during weathering and river transport. Rev. Mineral. Geochem. 2003, 52, 533–576. [Google Scholar] [CrossRef]
  5. Andersen, M.B.; Stirling, C.H.; Weyer, S. Uranium isotope fractionation. Rev. Mineral. Geochem. 2017, 82, 799–850. [Google Scholar] [CrossRef]
  6. Fallatah, O.A.; Ahmed, M.; Cardace, D.; Boving, T.; Akanda, A.S. Assessment of modern recharge to arid region aquifers using an integrated geophysical, geochemical, and remote sensing approach. J. Hydrol. 2019, 569, 600–611. [Google Scholar] [CrossRef]
  7. Liesch, T.; Hinrichsen, S.; Goldscheider, N. Uranium in groundwater-Fertilizers versus geogenic sources. Sci. Total Environ. 2015, 536, 981–995. [Google Scholar] [CrossRef]
  8. Elliot, T.; Bonotto, D.M.; Andrews, J.N. Dissolved uranium, radium and radon evolution in the Continental Intercalaire aquifer, Algeria and Tunisia. J. Environ. Radioact. 2014, 137, 150–162. [Google Scholar] [CrossRef] [Green Version]
  9. Nisi, B.; Bucciant, A.; Vaselli, O.; Perini, G.; Tassi, F.; Minissale, A.; Montegrossi, G. Hydrogeochemistry and strontium isotopes in the Arno-river basin (Tuscany, Italy): Constraints on natural controls by statistical modeling. J. Hydrol. 2008, 360, 166–183. [Google Scholar] [CrossRef]
  10. Karpas, Z.; Paz-Tal, O.; Lorber, A.; Salonen, L.; Komulainen, H.; Auvinen, A.; Saha, H.; Kurttio, P. Urine, hair and nails as indicators for digestion of uranium in drinking water. Health Phys. 2005, 88, 229–242. [Google Scholar] [CrossRef]
  11. El-Ghanim, W.M.; Hassan, L.M.; Tarek, M.; Galal, T.M.; Badr, A. Floristic composition and vegetation analysis in Ha’il region north of central Saudi Arabia. Saudi J. Biol. Sci. 2010, 17, 119–128. [Google Scholar] [CrossRef]
  12. Hereher, M.E.; Al-Shammari, A.M.; Abd Allah, S.E. Land cover classification of Ha’il-Saudi Arabia using remote sensing. Int. J. Geosci. 2012, 3, 349–356. [Google Scholar] [CrossRef] [Green Version]
  13. Gahlan, H.A.; Asimow, P.D.; Azer, M.K.; Ma, C.; Al-khatany, K.M.; Hakeem, A.Y. Geochemistry and mineralogy of the Jebel Aja Igneous Intrusion and the associated exotic pegmatites, Arabian Shield, Saudi Arabia. Lithos 2021, 106395, 400–401. [Google Scholar] [CrossRef]
  14. WHO. World Health Organization Guidelines for Drinking Water Quality, 4th ed; WHO: Geneva, Switzerland, 2011; pp. 430–431. [Google Scholar]
  15. Razowska-Jaworek, L. (Ed.) Calcium and Magnesium in Groundwater: Occurrence and Significance for Human Health; CRC Press/Balkema: Leiden, The Netherlands, 2014. [Google Scholar]
  16. Todd, D.K. Groundwater Hydrogeology, 2nd ed.; John Wiley & Sons: New York, NY, USA, 1980. [Google Scholar]
  17. Kumar, M.; Puri, A. A review of permissible limits of drinking water. Indian J. Occup. Environ. Med. 2012, 16, 40–44. [Google Scholar] [PubMed] [Green Version]
  18. Hadj Ammar, F.; Chkir, N.; Zouari, K.; Hamelin, B.; Deschamps, P.; Aigoun, A. Hydro-geochemical processes in the Complex Terminal aquifer of southern Tunisia: An integrated investigation based on geochemical and multivariate statistical methods. J. Afr. Earth Sci. 2014, 100, 81–95. [Google Scholar] [CrossRef]
  19. Ammara, F.H.; Chkir, N.; Zouari, K.; Azzouz-Berriche, Z. Uranium isotopes in groundwater from the Jeffara coastal aquifer, Southeastern Tunisia. J. Environ. Radioact. 2010, 101, 681–691. [Google Scholar] [CrossRef] [PubMed]
  20. Ivanovich, M. Uranium series disequilibrium: Concepts and applications. Radiochim. Acta 1994, 64, 81–94. [Google Scholar] [CrossRef]
  21. Adloff, J.P.; Rossler, K. Recoil and transmutation effects in the migration behavior of actinides. Radiochim. Acta 1991, 52, 269–274. [Google Scholar] [CrossRef]
  22. Ioannidou, A.; Samaropoulos, I.; Efstathiou, M.; Pashalidis, I. Uranium in ground water samples of Northern Greece. J. Radioanal. Nucl. Chem. 2011, 289, 551–555. [Google Scholar] [CrossRef]
  23. Kozlowska, B.; Walencik, A.; Dorda, J.; Przylibski, T.A. Uranium, radium and 40K isotopes in bottled mineral waters from Outer Carpathians, Poland. Radiat. Meas. 2007, 42, 1380–1386. [Google Scholar] [CrossRef]
  24. Kronfeld, J.; Godfrey-Smith, D.I.; Johannessen, D.; Zentilli, M. Uranium series isotopes in Avon Valley, Nova Scotia. J. Environ. Radioact. 2004, 73, 335–352. [Google Scholar] [CrossRef]
  25. Willey, N.J. Soil to plant transfer of radionuclides: Predicting the fate of multiple radioisotopes in plants. J. Environ. Radioact. 2014, 133, 31–34. [Google Scholar] [CrossRef] [PubMed]
  26. Wu, J.; Li, P.; Wang, D.; Ren, X.; Wei, M. Statistical and multivariate statistical techniques to trace the sources and affecting factors of groundwater pollution in a rapidly growing city on the Chinese Loess Plateau. Hum. Ecol. Risk Assess 2020, 26, 1603–1621. [Google Scholar] [CrossRef]
  27. Battistel, M.; Hurwitz, S.; Evans, W.C.; Barbieri, M. The chemistry and isotopic composition of waters in the lowenthalpy geothermal system of Cimino-Vico Volcanic District, Italy. J. Volcanol. Geotherm. Res. 2016, 328, 22–229. [Google Scholar] [CrossRef] [Green Version]
  28. Bonotto, D.M. Hydro (radio) chemical relationships in the giant Gurani aquifer. Braz. J. Hydrol. 2006, 323, 353–386. [Google Scholar] [CrossRef]
Figure 1. Aerial photograph and geological map of the studied area with sample locations after Hereher, et al., 2012 [12].
Sustainability 15 01590 g001
Figure 2. Flowchart of uranium isotope radiochemical procedure for α-spectrometry.
Sustainability 15 01590 g002
Figure 3. Piper diagram for hydrochemical facies of the collected groundwater samples.
Sustainability 15 01590 g003
Figure 4. pH and major ion contents (mg L−1) versus 238U activity concentration (Bq L−1).
Sustainability 15 01590 g004aSustainability 15 01590 g004b
Figure 5. Relation between 238U and 234U activity concentration in the collected groundwater samples.
Sustainability 15 01590 g005
Figure 6. 234U/238U activity ratios in (a) groundwater samples (b) collected plant samples of fruit-bearing trees and shrubs.
Sustainability 15 01590 g006
Figure 7. Alpha recoil; a conceptual model of physical and chemical events when 238U decays to 234U [21,22].
Sustainability 15 01590 g007
Figure 8. Boxplot of the collected groundwater samples.
Sustainability 15 01590 g008
Figure 9. Multivariate analyses of the collected groundwater samples.
Sustainability 15 01590 g009
Figure 10. Plots of the groundwater’s PC1, PC2, and PC3 from principal component analysis.
Sustainability 15 01590 g010
Figure 11. Dendrogram illustrating the clustering of the collected groundwater qualities.
Sustainability 15 01590 g011
Table 1. Chemical parameters, physical parameters, activity concentration, and isotopic ratios in the collected groundwater samples.
SamplesSample CoordinatesWell Depth (m)pHEC (µS cm−1)TDS (mg L−1)Cation Concentration (mg L−1)Anion Concentration (mg L−1)Error (%)Activity Concentration (Bq L−1)Isotopic Ratio
Na+K+Ca2+Mg2+HCO3ClSO42−---238U234U234U/238U
1N 27° 33.815′ E 41° 43.781′257.49 ± 0.54260 ± 442982 ± 23507 ± 163.7 ± 0.6336 ± 2454 ± 0.8308 ± 25680 ± 15863 ± 232.790.91 ± 0.051.59 ± 0.081.75 ± 0.18
2N 27° 33.814′ E 41° 44.295′1307.73 ± 0.56520 ± 545216 ± 39929 ± 187.4 ± 1.2600 ± 2485 ± 0.7268 ± 14980 ± 222253 ± 44−1.661.11 ± 0.052 ± 0.11.8 ± 0.09
3N 27° 32.154′ E 41° 43.750′6507.37 ± 0.64250 ± 382975 ± 24491 ± 156.2 ± 1.1384 ± 1635 ± 0.8356 ± 30520 ± 131102 ± 240.40.23 ± 0.060.5 ± 0.072.17 ± 0.87
4N 27° 30.971′ E 41° 35.032′4408.20 ± 0.7355 ± 4249 ± 314 ± 0.61.5 ± 0.953 ± 315 ± 0.3116 ± 810 ± 0.323 ± 0.851.390.21 ± 0.060.52 ± 0.072.48 ± 1.04
5N 27° 30.907′ E 41° 35.374′1108.10 ± 0.7603 ± 6422 ± 420 ± 0.92.8 ± 0.0866 ± 511 ± 0.2224 ± 1240 ± 0.836 ± 0.9−7.930.82 ± 0.051.37 ± 0.071.67 ± 0.19
6N 27° 31.015′ E 41° 36.419′1207.63 ± 0.7633 ± 7443 ± 524 ± 12.8 ± 0.0872 ± 714 ± 0.4252 ± 1550 ± 0.940 ± 1.1−8.61.03 ± 0.052.20 ± 0.112.14 ± 0.21
7N 27° 31.658′ E 41° 42.927′907.50 ± 0.72640 ± 551848 ± 18294 ± 74.5 ± 1.1208 ± 1437 ± 0.4300 ± 21340 ± 11503 ± 195.250.98 ± 0.052.10 ± 0.122.14 ± 0.23
8N 27° 31.515′ E 41° 42.505′1057.57 ± 0.82100 ± 451470 ± 17233 ± 72.9 ± 0.08160 ± 1022 ± 0.3336 ± 21180 ± 10364 ± 229.751± 0.051.82 ± 0.091.82 ± 0.18
9N 27° 37.381′ E 41° 41.677′1406.67 ± 0.54460 ± 433122 ± 26314 ± 915.4 ± 1.9268 ± 13161 ± 1784 ± 43970 ± 14336 ± 21−14.611.1 ± 0.051.95 ± 0.101.77 ± 0.17
10N 27° 37.524′ E 41° 41.579′1306.48 ± 0.71608 ± 331126 ± 17155 ± 67 ± 1.599 ± 856 ± 0.7572 ± 33160 ± 8122 ± 0.80.230.63 ± 0.051.35 ± 0.072.14 ± 0.28
11N 27° 37.784′ E 41° 42.259′907.01 ± 0.96290 ± 454403 ± 32294 ± 88.3 ± 1.6840 ± 51207 ± 1.3276 ± 241859 ± 30635 ± 212.830.13 ± 0.040.31 ± 0.072.38 ± 1.27
12N 27° 54.701′ E41° 46.275′907.62 ± 0.81220 ± 28793 ± 10109 ± 44.2 ± 1.1119 ± 1312 ± 0.4112 ± 10220 ± 9145 ± 0.96.220.08 ± 0.040.12 ± 0.041.5 ± 1.25
13N 27° 55.730′ E 41° 46.214′657.85 ± 0.61100 ± 26715 ± 15103 ± 33.7 ± 0.998 ± 813 ± 0.3108 ± 8205 ± 8107 ± 0.87.370.11 ± 0.040.19 ± 0.041.7 ± 0.99
14N 27° 57.845′ E 41° 43.800′808.03 ± 0.8333 ± 15216 ± 325 ± 12.3 ± 0.440 ± 410 ± 0.252 ± 345 ± 0.335 ± 0.332.930.82 ± 0.051.63 ± 0.082 ± 0.10
15N 27° 47.940′ E 41° 44.294′858.02 ± 0.62300 ± 341610 ± 21247 ± 82.6 ± 0.2228 ± 1030 ± 0.4128 ± 8550 ± 13268 ± 236.320.53 ± 0.061.32 ± 0.072.5 ± 0.41
Min---256.48 ± 0.7333 ± 15216 ± 314 ± 0.61.5 ± 0.940 ± 410 ± 0.252 ± 210 ± 0.323 ± 0.80.08 ± 0.040.12 ± 0.011.5 ± 0.09
Max---6508.20 ± 0.76520 ± 545216 ± 36929 ± 1815.4 ± 1.9840 ± 51207 ± 1.3784 ± 431859 ± 302253 ± 441.11 ± 0.062.20 ± 0.82.49 ± 1.27
Average---1517.6 ± 0.52578 ± 371839 ± 28250 ± 7.65 ± 0.85238 ± 1451 ± 0.55280 ± 18454 ± 15456 ± 140.67 ± 0.051.26 ± 0.111.95 ± 0.52
Permissible Limi [14] 6.5–8.5100015002001275505002502500.3721
Table 2. Uranium activity concentrations and 234U/238U activity ratios in some fruit-bearing shrubs and trees.
Plant Sample TypeScientific NameUranium Activity Concentrations Bq kg−1234U/238U Isotopic Ratio
238U234U
Fruit-bearing trees
LemonCitrus Limon1.69 ± 0.52.66 ± 0.641.57 ± 0.84
FigFicus Carice0.76 ± 0.181.96 ± 0.302.58 ± 1.01
NarenjCitrus Aurantium0.61 ± 0.131.64 ± 0.232.69 ± 0.95
Fruit-bearing shrubs
Green pepperCapsicum Annuum25.52 ± 3.8960.42 ± 8.42.37 ± 0.69
EggplantSolanum Melongena9.21 ± 1.3324.65 ± 2.782.68 ± 0.69
Table 3. Principal components extracted from the collected groundwater samples.
ParametersPC1PC2PC3
EC0.974−0.1560.138
TDS0.968−0.1440.201
Cl0.891−0.300−0.132
Ca2+0.8820.395--
Mg2+0.856---−0.383
Na+0.799---0.517
K+0.7770.281−0.446
SO42−0.737−0.141−0.591
pH−0.608−0.3480.602
234U0.1490.8490.422
238U0.2040.8470.439
HCO30.5780.629−0.431
Disclaimer/Publisher’s Note: The statements, opinions and data contained in all publications are solely those of the individual author(s) and contributor(s) and not of MDPI and/or the editor(s). MDPI and/or the editor(s) disclaim responsibility for any injury to people or property resulting from any ideas, methods, instructions or products referred to in the content.

