Article

Construction and Demolition Waste as Substrate Component Improved the Growth of Container-Grown Duranta repens

1
School of Ecological Technique and Engineering, Shanghai Institute of Technology, Shanghai 201418, China
2
Department of Ecology, Changbai Mountain Academy of Sciences, Baihe 133633, China
*
Author to whom correspondence should be addressed.
Sustainability 2023, 15(2), 1585; https://doi.org/10.3390/su15021585
Submission received: 21 November 2022 / Revised: 7 January 2023 / Accepted: 10 January 2023 / Published: 13 January 2023
(This article belongs to the Special Issue Waste Recycling and Circular Economy: From Trash to Treasure)

Abstract

:
Small size construction and demolition waste (CDW) is rarely reused and consequently causes environmental problems. CDW can increase aeration porosity of soil due to the big surface area and water absorption. In order to investigate the feasibility and function of CDW as a component of container substrate, we mixed four small sizes CDW (<10 mm) of 0–3, 3–6, 6–8, and 0–10 mm with clay soil according to the mass ratios of 20%, 35%, and 50% to plant one-year old Duranta repens cuttings, clay soil (CS) and pure CDW (CW) as the controls. Cluster analysis and principal component analysis (PCA) were performed to screen the most suitable particle size and proportion of CDW for plant growth and physiological function. The substrate containing 50% 3–6 mm CDW (S6) had the higher aeration porosity, lower water loss, better water retention and permeability, and therefore higher PCA score. The total branch length of plants in the S6 was increased by 18% and 71%, leaf area by 116% and 444%, and net photosynthetic rate by 10% and 59% compared to CS and CW, respectively. The suitable CDW has potential to improve substrate properties and can effectively improve plant growth. Meanwhile, the reuse of CDW can partially alleviate the problem of construction waste disposal and environmental pollution, and provide reference for the research on the combination of CDW and landscaping.

1. Introduction

Construction and demolition waste (CDW) is generated when renewing or destroying buildings. China is one of the largest CDW producers in the world, generating 1130 million tons CDW in 2014 [1,2]. Effective CDW reuse and recycling is important to reduce the negative impacts of CDW on the environment [3]. CDW with large size is always used for concrete, pit backfill, gravel pavement, and roadbed filler, while CDW with small size is of little use so far [4,5,6,7,8,9]. CDW is also used as the skeleton material in tree pits or decorative particles in landscape greening [10]. CDW can effectively remove pollutants when used as a substrate in wetland [3]. In recent years, CDW has been applied as a component of container substrate to plant Chrysanthemum morifolium [11]. The addition of CDW improved the soil properties, such as increasing the saturated hydraulic conductivity and cation removal rate [11].
The main components in CDW are red bricks, concrete, stones, and mortar, which contains potassium, calcium, magnesium, iron and other mineral elements [12]. CDW has a big surface area, which can increase aeration porosity of soil [8,13]. Therefore, CDW has the potential to be a component of container substrate. Malcolm et al. (2021) reported that the germination, growth, and root mass of ryegrass, barley, and pea increased up to 80 times when adding 50% CDW into technosol. Whether there are excessive heavy metals in CDW might be a common concern. The growth of Mediterranean plants in CDW mixed substrates was not negatively affected. The release levels of heavy metals were lower compared to the laboratory test data [14].
To explore the feasibility of CDW as one component of container substrate and how to apply it, we mixed small size CDW (<10 mm) with clay soil that is sticky and poor in porosity. One-year-old Duranta repens cuttings were planted in 12 substrates mixed with different sizes CDW and clay soil in different proportions. The aim of the study was to determine if CDW could be used as an alternative component of substrate. If so, we would find out the optimal size of CDW and the ratio with clay soil. The present results would be helpful to develop a low-cost container substrate and beneficial to reuse construction waste. Small size CDW is often disposed as waste that causes environmental pollution. We explore the new application of small size CDW in landscaping which not only reduces the environmental pressure but also reduces the cost of container substrate through waste reuse and protects soil resource.

2. Materials and Methods

The experiment was conducted in the Botanical Garden of Shanghai Institute of Technology, Shanghai, China (121°30′42″ E, 30°50′42″ N). The mean annual air temperature is 6 °C, the mean annual precipitation is 1000–1200 mm, and the frost-free period is 230 days in the region [15]. The average light intensity in the research area was 800 µmol m−2 s−1 with a maximum of 1400 µmol m−2 s−1.

2.1. Experimental Materials

CDW was obtained from Xingsheng Roadbed Materials Co. in Shanghai. The concentration of seven heavy metals in the CDW was measured to evaluate its safety (Table 1). The contents of the heavy metals are significantly lower than limit values of agricultural land according to China’s Soil Environmental Quality-Risk Control Standards of Soil Contamination for Agricultural Land (GB 15618-2018). The soil used in the study was from Zaozhuang, Shandong Province. It was identified as clay soil based on international soil classification standards (Table 2). The soil was sticky and did not have much space between soil particles. The size of clay soil particles was about 2 to 3 mm. One-year-old D. repens cuttings (average 17.5 cm in height) were purchased from Quanzhou nursery and then were planted in 1-gallon black plastic pots with small holes on the bottom (17 cm in upper diameter, 13 cm in lower diameter, 16 cm in height).

2.2. Experimental Design

CDW was crushed and sieved into 0–3 mm, 3–6 mm, 6–8 mm, and 0–10 mm particles using different sieves. All CDW was rinsed with water to remove the dust on the surface and then spread out to dry. The CDW with 4 different sizes were respectively mixed with clay soil according to the mass ratios of 20%, 35%, and 50%, with two controls of clay soil and 0–10 mm CDW (Table 3). The mixed substrates were put into 1-gallon black plastic pots. The pH of all substrates was adjusted to 6.5 by adding 0.001 g/mL ferrous sulfate solution. One-year-old D. repens cuttings were planted in the above substrates on 6 June 2021. During the experimental period, all plants were watered twice a week and applied 1 g slow-release fertilizer (Osmocote, Everris) on 16 July, 22 August and 27 September 2021.

2.2.1. Physicochemical Properties of the Substrates

The pH value was measured by a pH meter (Bante 210) and EC value was measured by a conductivity meter (Hanna HI98331). The porosity of substrate was determined based on the method of Liu [16]. The dry substrate was filled into a 315 cm3 (V) cylindrical wide-mouth container. The weight of container and dry substrate is M1. The mouth of the container was wrapped tightly with gauze and then submerged the whole container into the water. The wet gauze was removed from the container after 12 h. The weight of the container and the soaked wet substrate is M2. The weight of the gauze is recorded as M3 after squeezing it dry. The container mouth was wrapped tightly with the gauze again and turned the container upside down for 8 h until no water drips. The sum of the weight of container, wet substrate after dripping for 8 h, and gauze is recorded as M4.
Aeration   porosity % = ( M 2 + M 3 M 4 ) / V × 100 %
Hold water     porosity % = ( M 4 M 1 M 3 ) / V × 100 %
Toltal   porosity % = ( M 2 M 1 ) / V × 100 %
Gas water   ration = Aeration   porosity / Hold water     porosity
Water loss rate of substrate was determined by the method of Qin et al. [17]. The substrate was put into a 1-gallon black plastic pot with a tray to collect water and soil from the small hole in the center of the bottom of the pot. Slow poured 400 mL water into the pot and weighed 6 h later. And then the pot was weighed every two days until the 8th day. There were four replicates for each treatment and the two controls. The water loss rate (RT) was calculated by the following Equation (5).
R T = W + W water W T / W + W water × 100 %
where W is the initial weight of pot; Wwater is the weight of W plus 400 mL water; WT is the weight of pot at any day.

2.2.2. Plant Growth

The root collar diameter, number of branches, branch length, leaf length, leaf width, leaf area, and specific leaf weight (SLW) were measured in the middle of July and November 2021. The branch length was measured with a tape and the root collar diameter was measured with a digital caliper. Five fresh leaves were collected from each treatment and pasted them on the 5 mm grid paper, then were scanned into pictures with HP Smart Tank 519. The photos of the leaves were input into Computer Aided Design software (AutoCAD 2014) for the measurement of leaf length, width, and leaf area. The first matured leaf from the top, which turned out to be the third one was used to measure SLW. Two discs on each side of the leaf along the midrib were drilled with a 0.5 cm diameter puncher [18,19].
SLWmg · cm 2 = LW / LA
where LW is the fresh weight and LA is the area of the 4 small circular pieces.

2.2.3. Gas Exchange Measurements

Gas exchange measurements were made using a LI-6400 XT portable analyzer (LI-Cor, Lincoln, NE, USA). Four plants were randomly selected from each treatment for the measurements of gas exchange. The first matured leaf from the top was used for the measurement of gas exchange, which turned out to be the third one. During the period of measurement, CO2 concentration was maintained at 400 µmol mol−1, relative humidity at 60%, and leaf chamber temperature at 27 °C in July. The relative humidity was maintained at 40% and the leaf chamber temperature was set to 17 °C in November, which was close to ambient environment. Light intensities were adjusted to 0 for the measurement of respiration rate and 1400 µmol m−2 s−1 for the saturated photosynthetic rate (Pn). Water use efficiency (WUE) was calculated as the ratio of Pn to transpiration rate (E).

2.2.4. Pigments and Carbohydrates

Leaf enclosed in leaf chamber was removed after photosynthesis and was drilled along midrib with 5 mm puncher. The discs were quickly cut into small pieces and then soaked in 5 mL 95% ethanol. After 24 h in the dark, the extract was measured at 470 nm, 646 nm, and 663 nm with a UV4800 spectrophotometer (Unocal, Shanghai, China). Chlorophyll a, chlorophyll b, total chlorophyll, and carotenoid contents were calculated according to the method of Brito, et al. [20].
The leaves were randomly selected from each treatment for the measurement of carbohydrates. They were dried at 70 °C to a constant mass in the oven and then were ground to fine powder using a ball mill (FW-80). Extraction and determination of soluble sugars and starch were based on the Anthrone method [21].

2.2.5. Principal Component Analysis

KMO and Bartlett’s test were performed for the above 19 parameters to determine their suitability for principal component analysis [22]. To ensure the validity of PCA, it is necessary to extract feature roots greater than 1 [23,24]. According to the factor score, the principal component score (Fi) is calculated by Equation (7) [24]:
F i = b i × C , i = 1 , 2 , 3
where bi is the factor score of the principal component i. C is the arithmetic square root of the eigenvalues corresponding to principal components.
According to the principal component scores in Equation (7), the comprehensive scores of each substrate (Fs) is calculated:
F S = i = 1 m V i × F i , i = 1 , 2 , 3
where m is the number of principal components. Vi is the contribution rate of eigenvalues corresponding to principal component i.

2.3. Statistical Analysis

The analyses were performed using the Statistical Package for the Social Sciences (SPSS version 26.0). One-way ANOVA was used to compare the differences in substrate properties and physiological parameters of plant between treatments and the controls. The effects of CDW size, proportion, and treatment time on physiological parameters were examined by a three-way ANOVA. Duncan’s multiple comparisons were used to analyze the significance within group. Principal component analysis (PCA) was used to compared the contribution of the measured physiological parameters and identify the principal component scores. The range of initial variables was standardized before the analysis. 14 substrates were classified into categories by cluster analysis according to the physiochemical properties of substrates and physiological parameters of plants.

3. Results

3.1. The Properties of Substrates

The pH and EC values were the highest in the CW and the lowest in the CS (Table 4). The higher the proportion of CDW was, the higher the pH and EC values were. CDW increased the pH of the substrate, positively correlating with CDW content. The pH values of substrates ranged from 6.48 to 7.39. The EC of the substrates with smaller CDW particle sizes (0–6 mm) had higher EC, while the substrates with larger sizes (6–8 mm) had lower EC.
There were significant differences in the aeration porosity and gas-water ratio between the controls and treatments (Table 4). The aeration porosity and gas-water ratio in the CW were 5.0 and 7.5 times higher than in the CS. The average aeration porosity in the 3–6 mm group was 10.5% higher than the other groups. The aeration porosity increased with CDW proportion under the same size. The gas-water ratio in the 3–6 mm group ranged from 0.33 to 0.44.
Only the gas-water ratios in the 3–6 mm group were within the appropriate range. Compared to the controls, 0–3 mm group had higher water loss rate, while 0–10 mm group had lower water loss rate. 3–6 mm substrates had lower water loss rate.

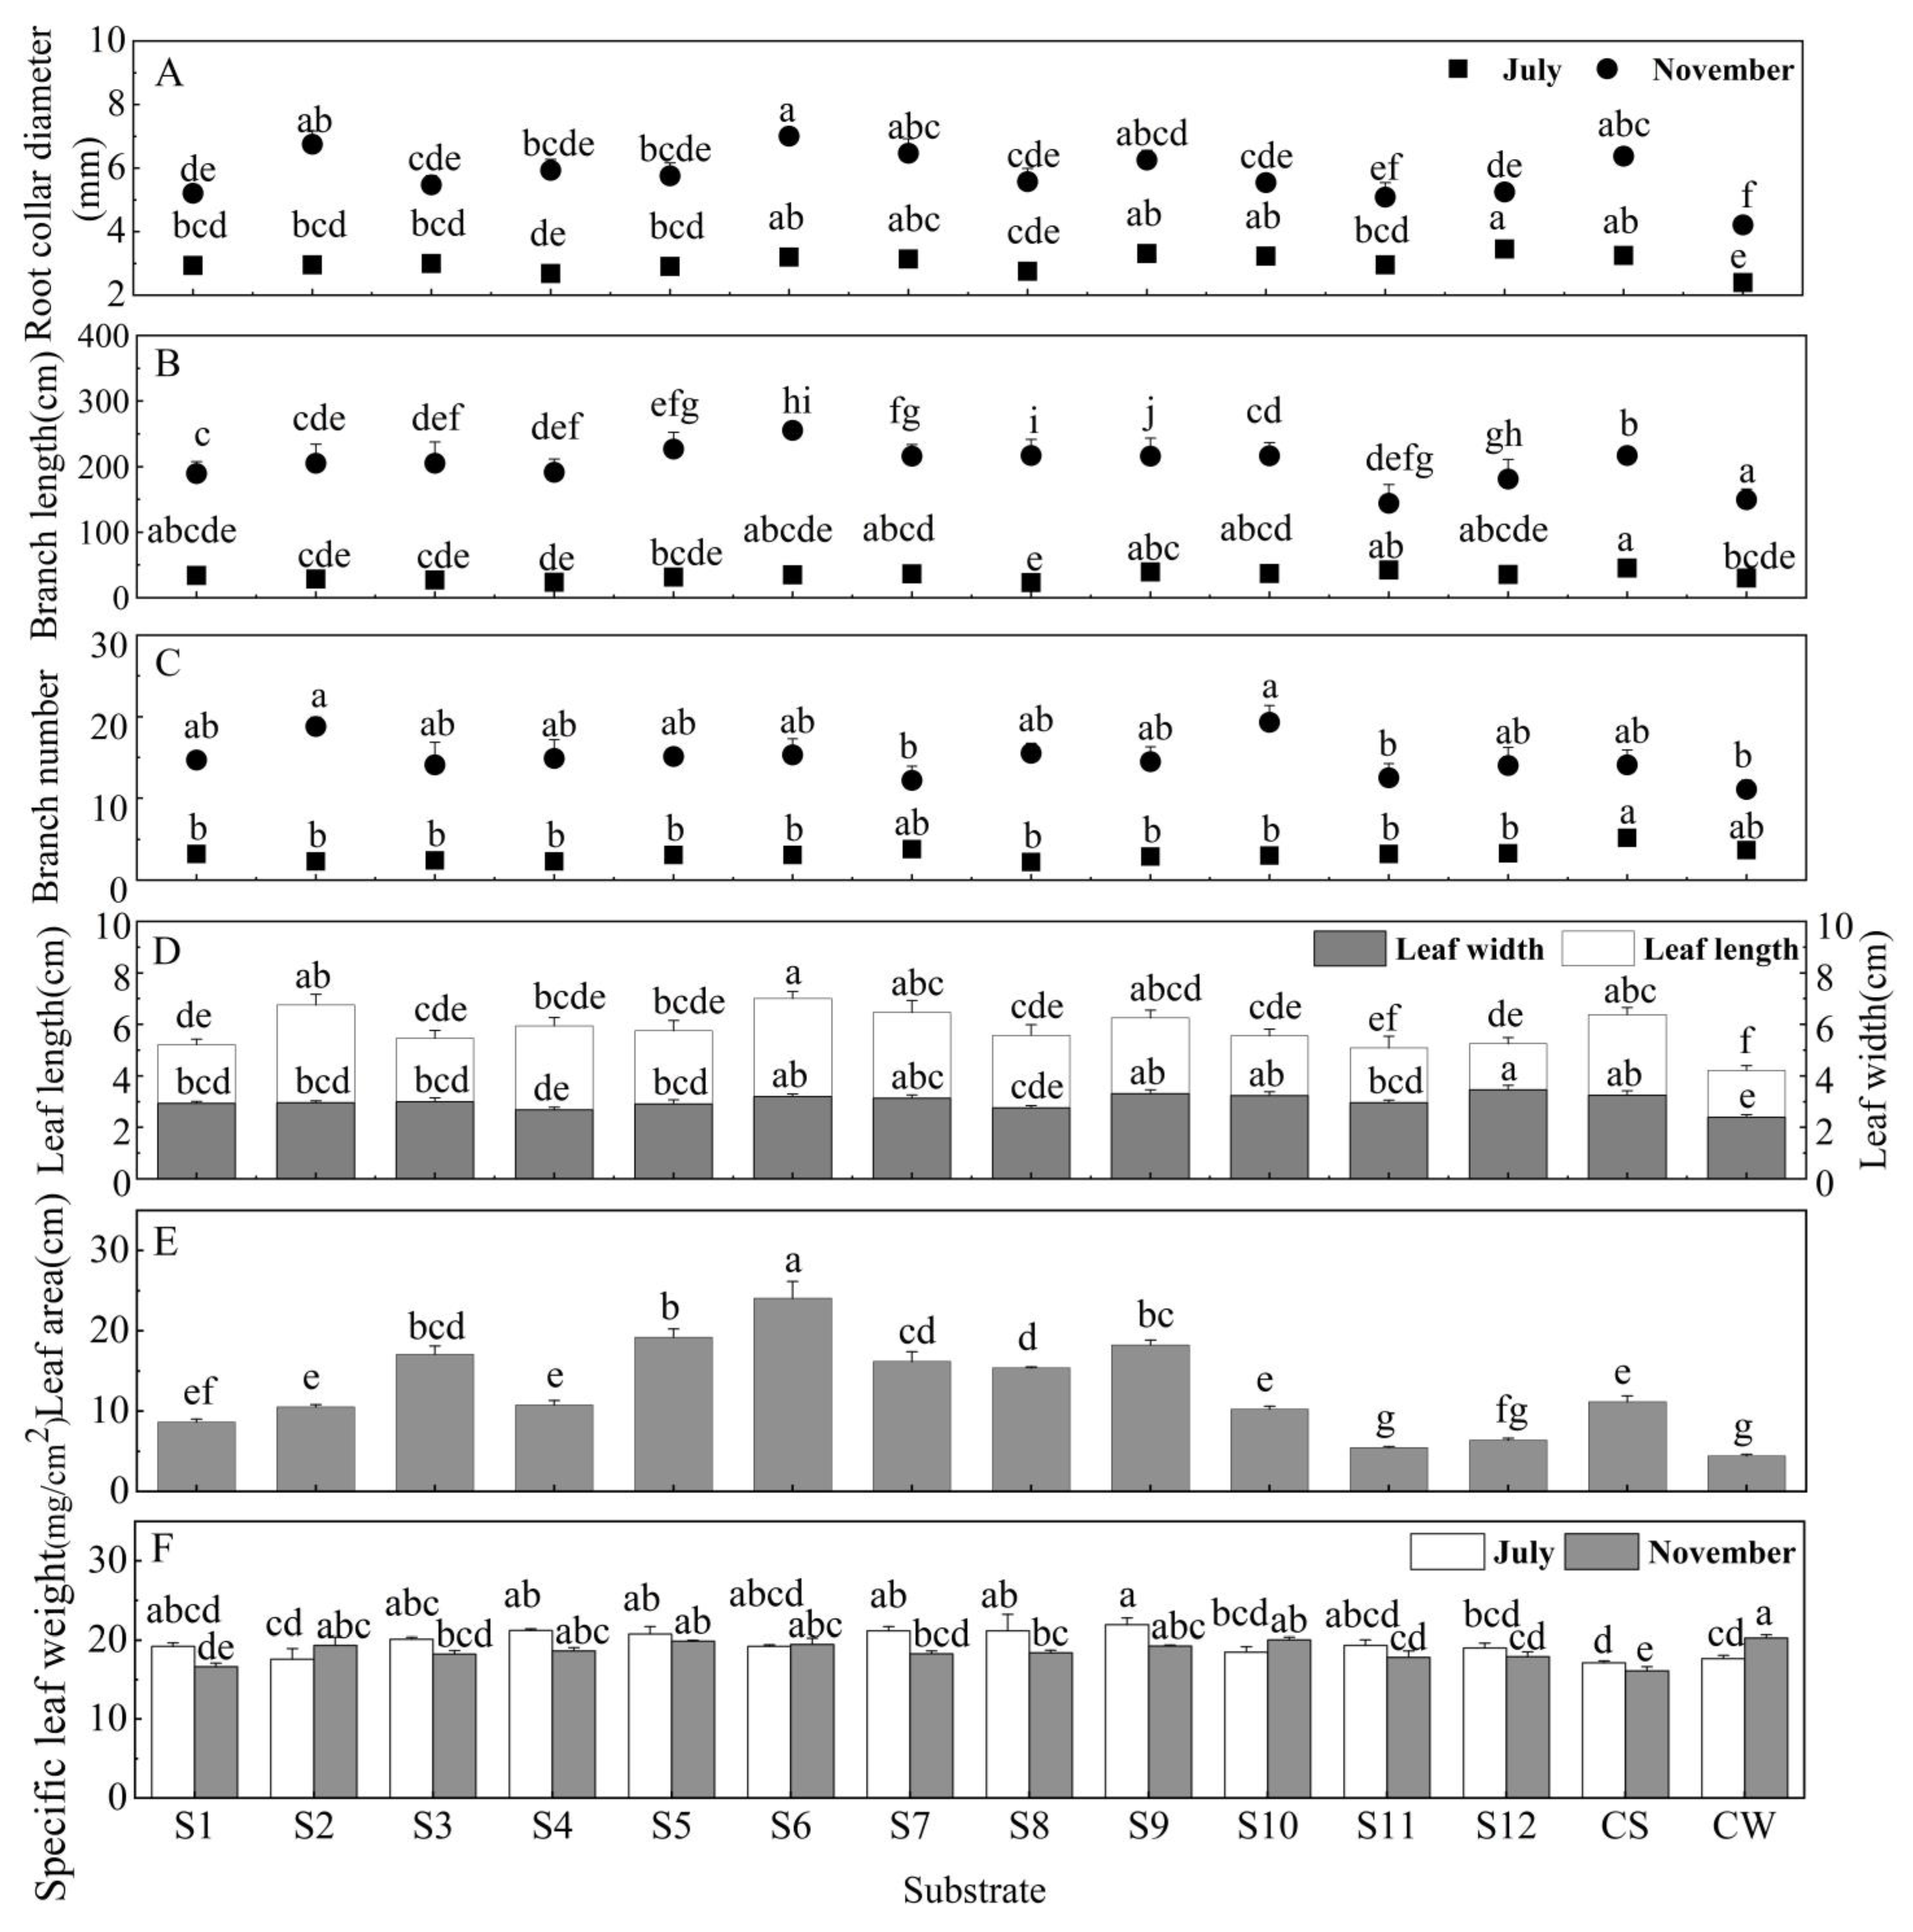
3.2. Growth and Leaf Morphology
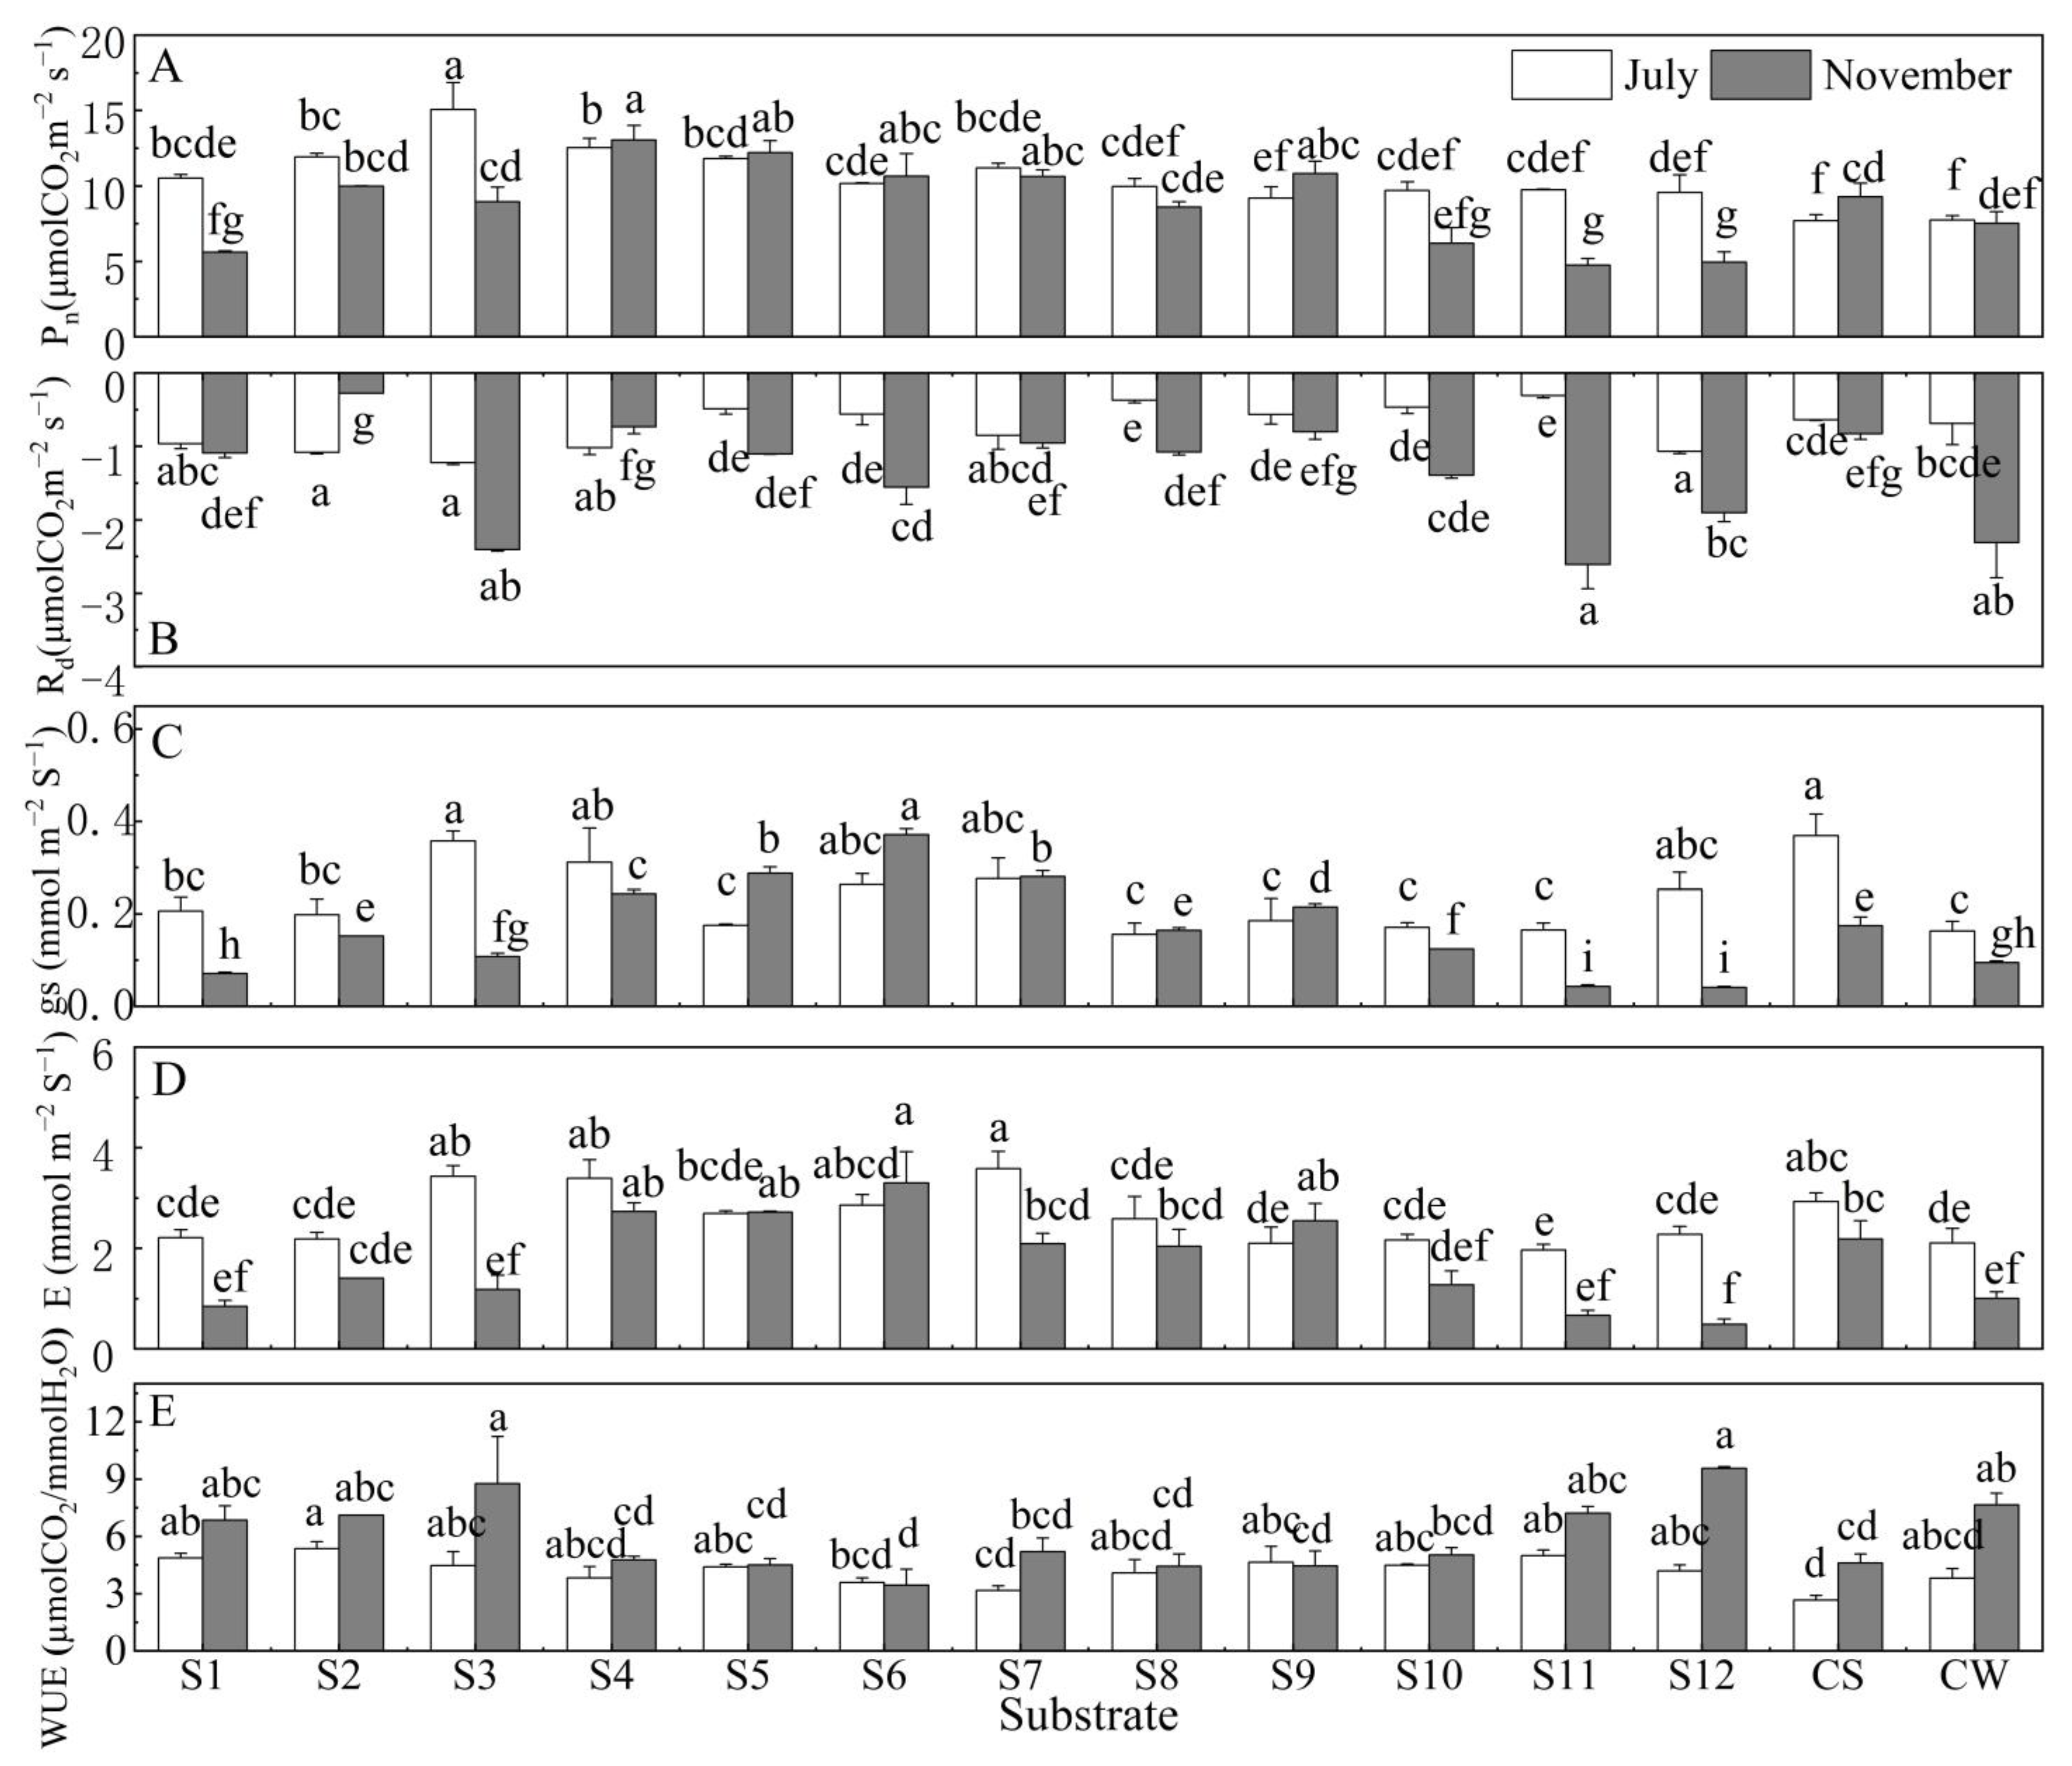
The root collar diameter was significantly affected by proportion and treatment time (Table 5). It was the lowest in the CW and the highest in the 3–6 mm group (Figure 1A). The root collar diameter in the 3–6 mm group was 48% higher than CW. The higher the proportion of CDW was, the larger the root collar diameter was in the 3–6 mm groups, while opposite in the 6–8 mm and 0–10 mm groups. In addition, there was 10% death rate in the S2, S3, S9, and S11 (data now shown). When compared at the same proportion, root collar diameter increased with CDW size in the 0–3 mm and 3–6 mm groups, while decreased in the 6–8 mm and 0–10 mm groups.
The total branch length and branch number increased with treatment time but only total branch length was significantly affected by CDW size (Table 5). The branch number was 2–5 in July and increased to 11–19 in November across all treatments. The total branch length was 4% and 50% higher in the 3–6 mm group, while 17% lower in the 0–10 mm group than the CS and CW (Figure 1B,C).
CDW size and proportion significantly affected leaf length, width, and area D. repens (Table 5). 3–6 mm group had the highest leaf size, especially in the S6 (Figure 1D,E). The leaf length, width, and area in the 0–10 mm group were significantly lower than other groups but there was no differences with the controls. In the same CDW size group, the leaf length, leaf width, and leaf area in 50% proportion were higher than in 20% and 35% proportion. The leaf area in the 0–3 mm and 3–6 mm groups were significantly higher than others, while they were lower in the 0–10 mm group and CW (Figure 1E). CDW size and treatment time significantly affected SLW and there was significant interactions (Table 5). On average, the SLW in November was 6% lower than in July across all treatments. In November, the SLW in 0–3 mm, 3–6 mm, 6–8 mm, and 0–10 mm groups was 10%, 7%, 10%, and 8% lower than that in CW, while 16%, 20%, 16%, and 18% higher than that in CS. The SLW in 3–6 mm and 6–8 mm groups was higher than that in 0–3 mm group (Figure 1F).

3.3. Gas Exchange

CDW size and treatment time significantly affected Pn and there were significant interactions (Table 5). Only the Pn in the 3–6 mm group substantially increased with treatment time, on average 4%. In November, the Pn in the 3–6 mm group was 29% and 59% higher than CS and CW, while Pn in the 0–10 mm group decreased by 43% and 30% compared to the CS and CW (Figure 2A). CDW size, proportion, and treatment time significantly affect Rd, and there were significant interactions on Rd (Table 5). On average, the Rd in November was 85% higher than that in July across all treatments. The Rd in the treatment groups was higher than the CS, while lower than the CW (Figure 2B). When compared at the same CDW size, the Rd in 50% proportion was higher than in 20% and 35% proportion in the 0–3 mm and 3–6 mm groups, while 35% proportion had higher Rd in the 6–8 mm and 0–10 mm groups.
CDW size, proportion, and treatment time significantly affected gs and there were significant interactions on gs (Table 5). gs in the 3–6 mm and 6–8 mm groups increased with treatment time, while others showed opposite trend (Figure 2C). In November, the gs in the 3–6 mm groups was 72% and 216% higher than in the CS and CW, while gs in the 0–10 mm group was 60% and 27% lower than the controls. E was significantly affected by CDW size but not by proportion, and it changed with treatment time (Table 5). The E in the 3–6 mm group was the highest, 34% and 192% higher than in the CS and CW (Figure 2D). The WUE in 0–3 mm and 0–10 mm groups was higher than other groups and controls (Figure 2E).

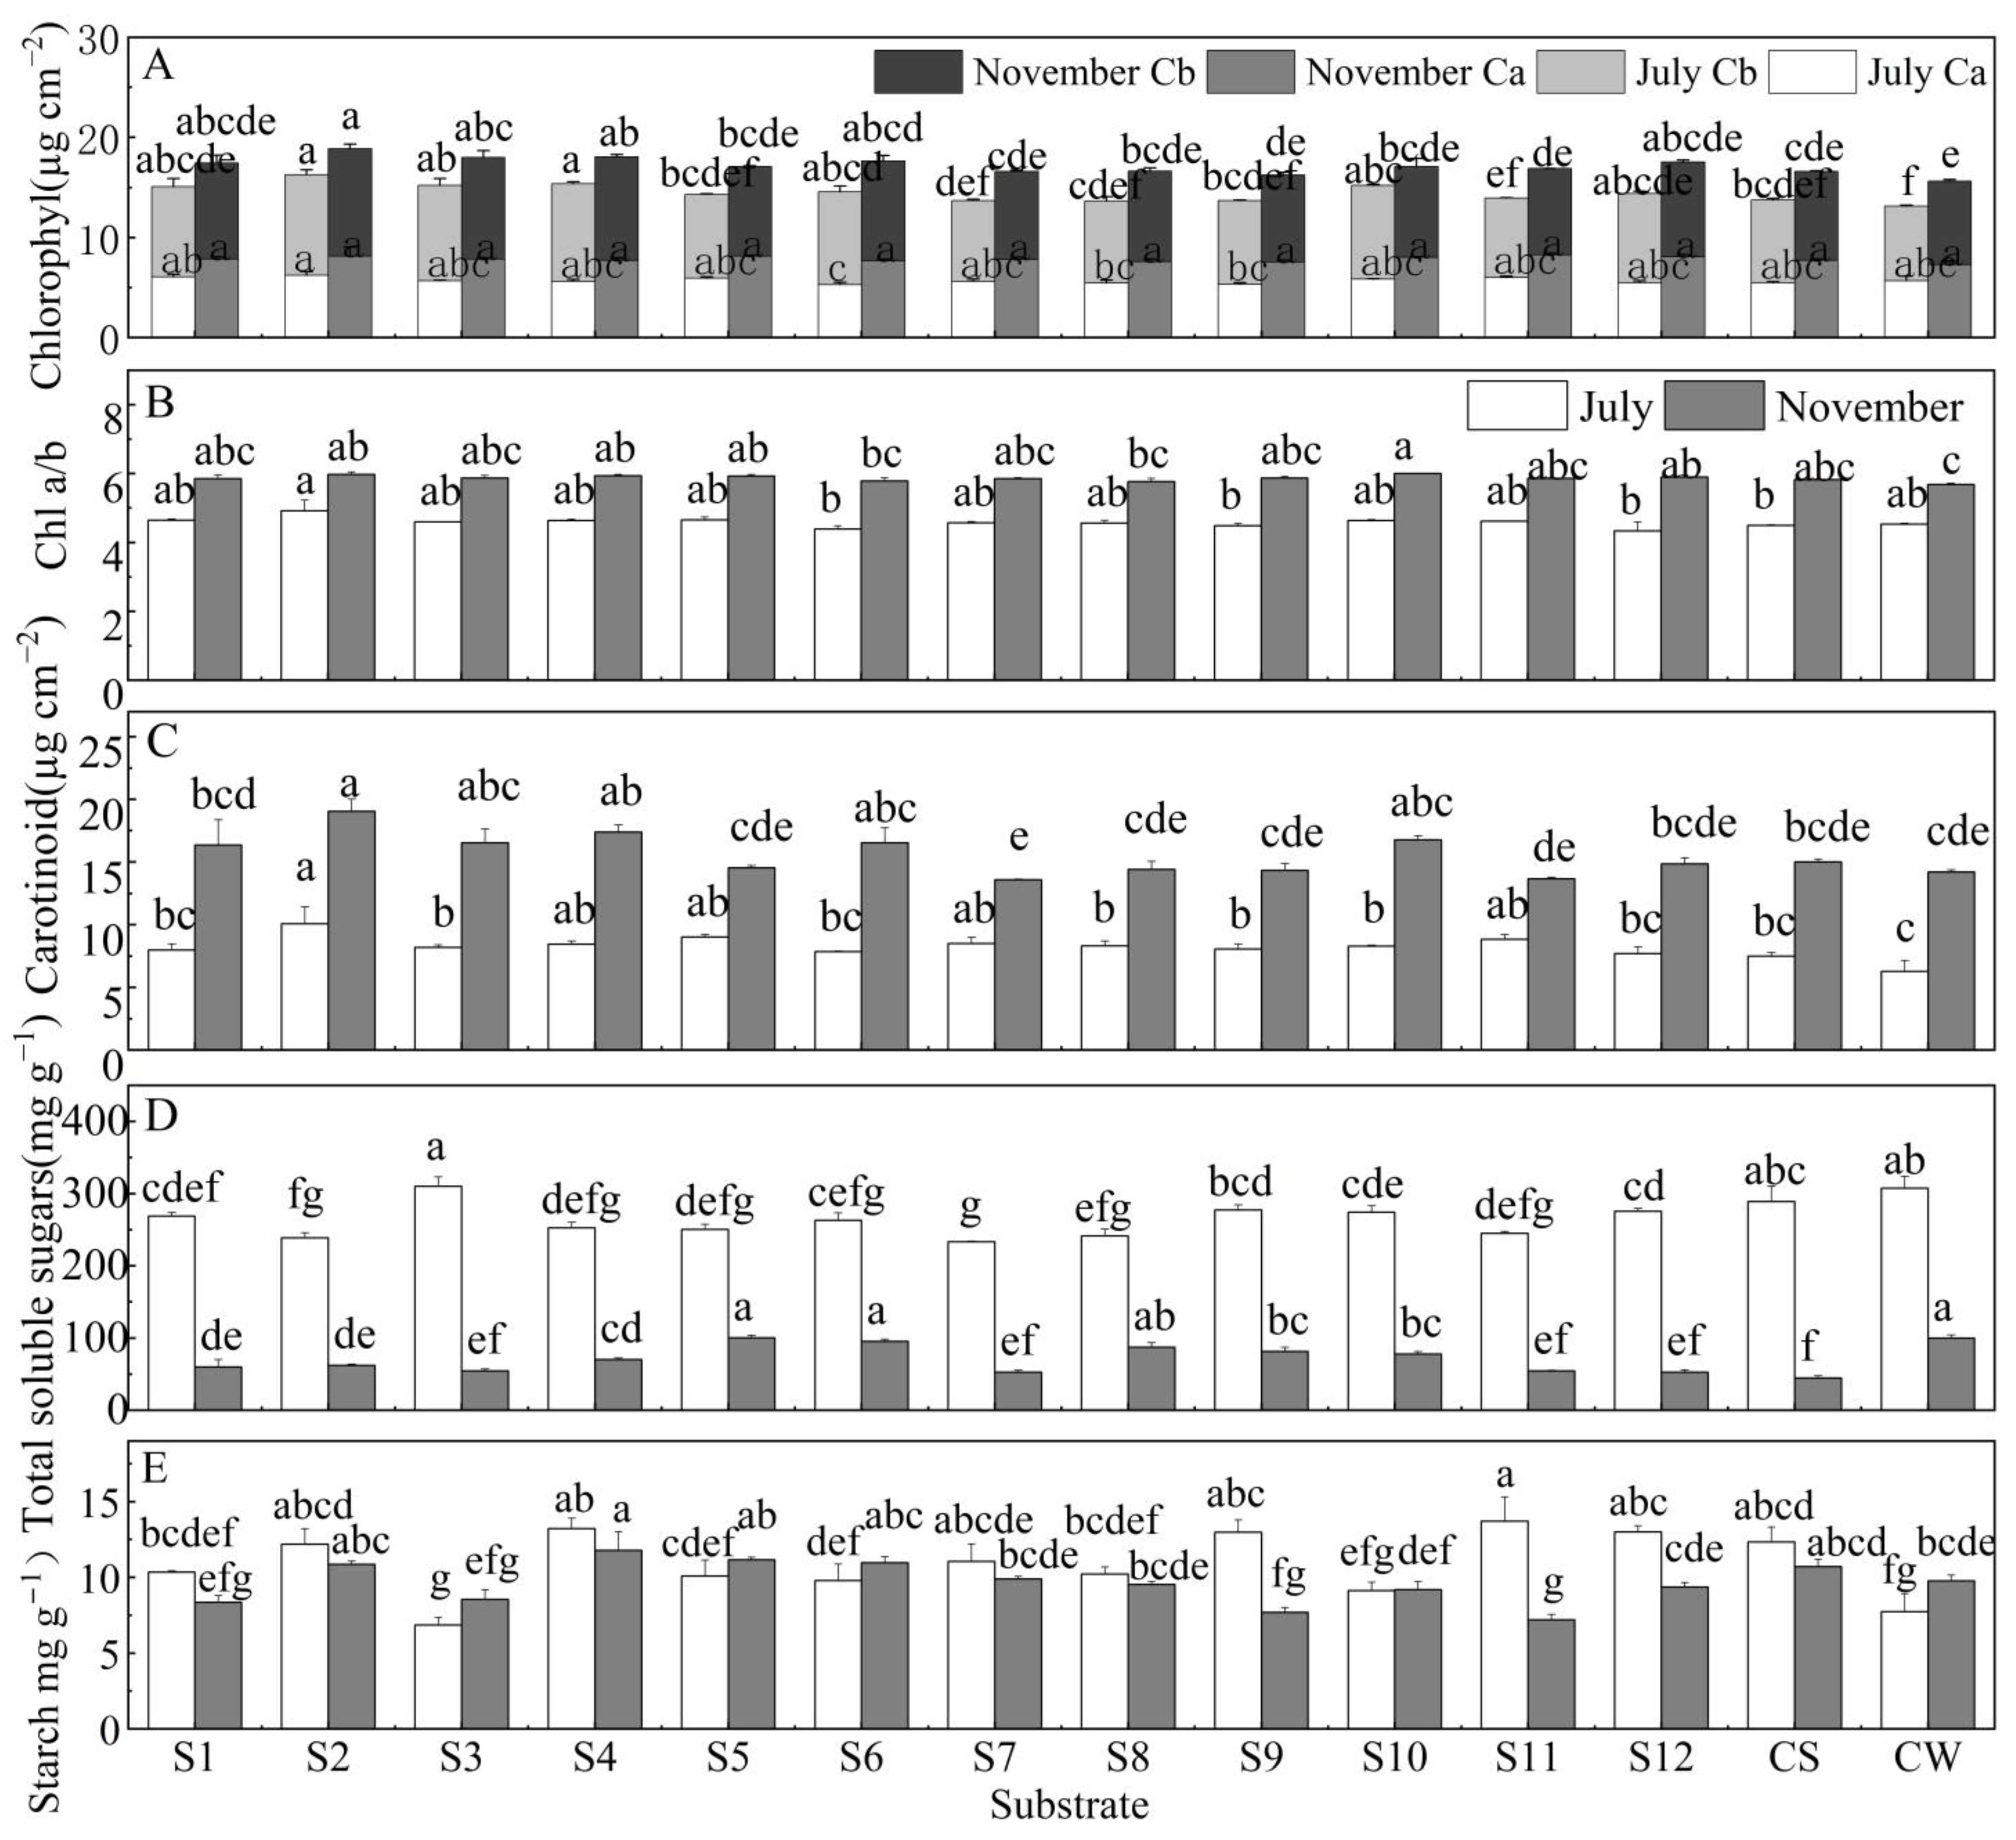
3.4. Pigments and Carbohydrates

Chlorophyll contents were significantly affected by CDW size, proportion, and treatment time, while the carotinoid content was affected by CDW size and treatment time (Table 5). The contents of chlorophyll and carotinoid in November were higher than in July (Figure 3A,C). The total chlorophyll content in the 3–6 mm group was 7% and 18% higher than the CS and CW. The ratio of chlorophyll a/b in the 20% proportion was higher than that in the 35% and 50% proportion when compared at the same CDW size (Figure 3B). The carotinoid in the 0–3 mm group was the highest, 15% and 22% higher than the CS and CW (Figure 3C).
The content of total soluble sugars was significantly affected by proportion and treatment time but not by CDW size (Table 5). On average, the content of total soluble sugars in July was 3.8 times higher than that in November across all treatments (Figure 3D). The starch content differed significantly among CDW sizes and changed with treatment (Table 5). The starch content in the 3–6 mm group was 6% and 16% higher than that in the CS and CW. The starch content in the S4 was the highest, 24% and 35% higher than the CS and CW (Figure 3E).

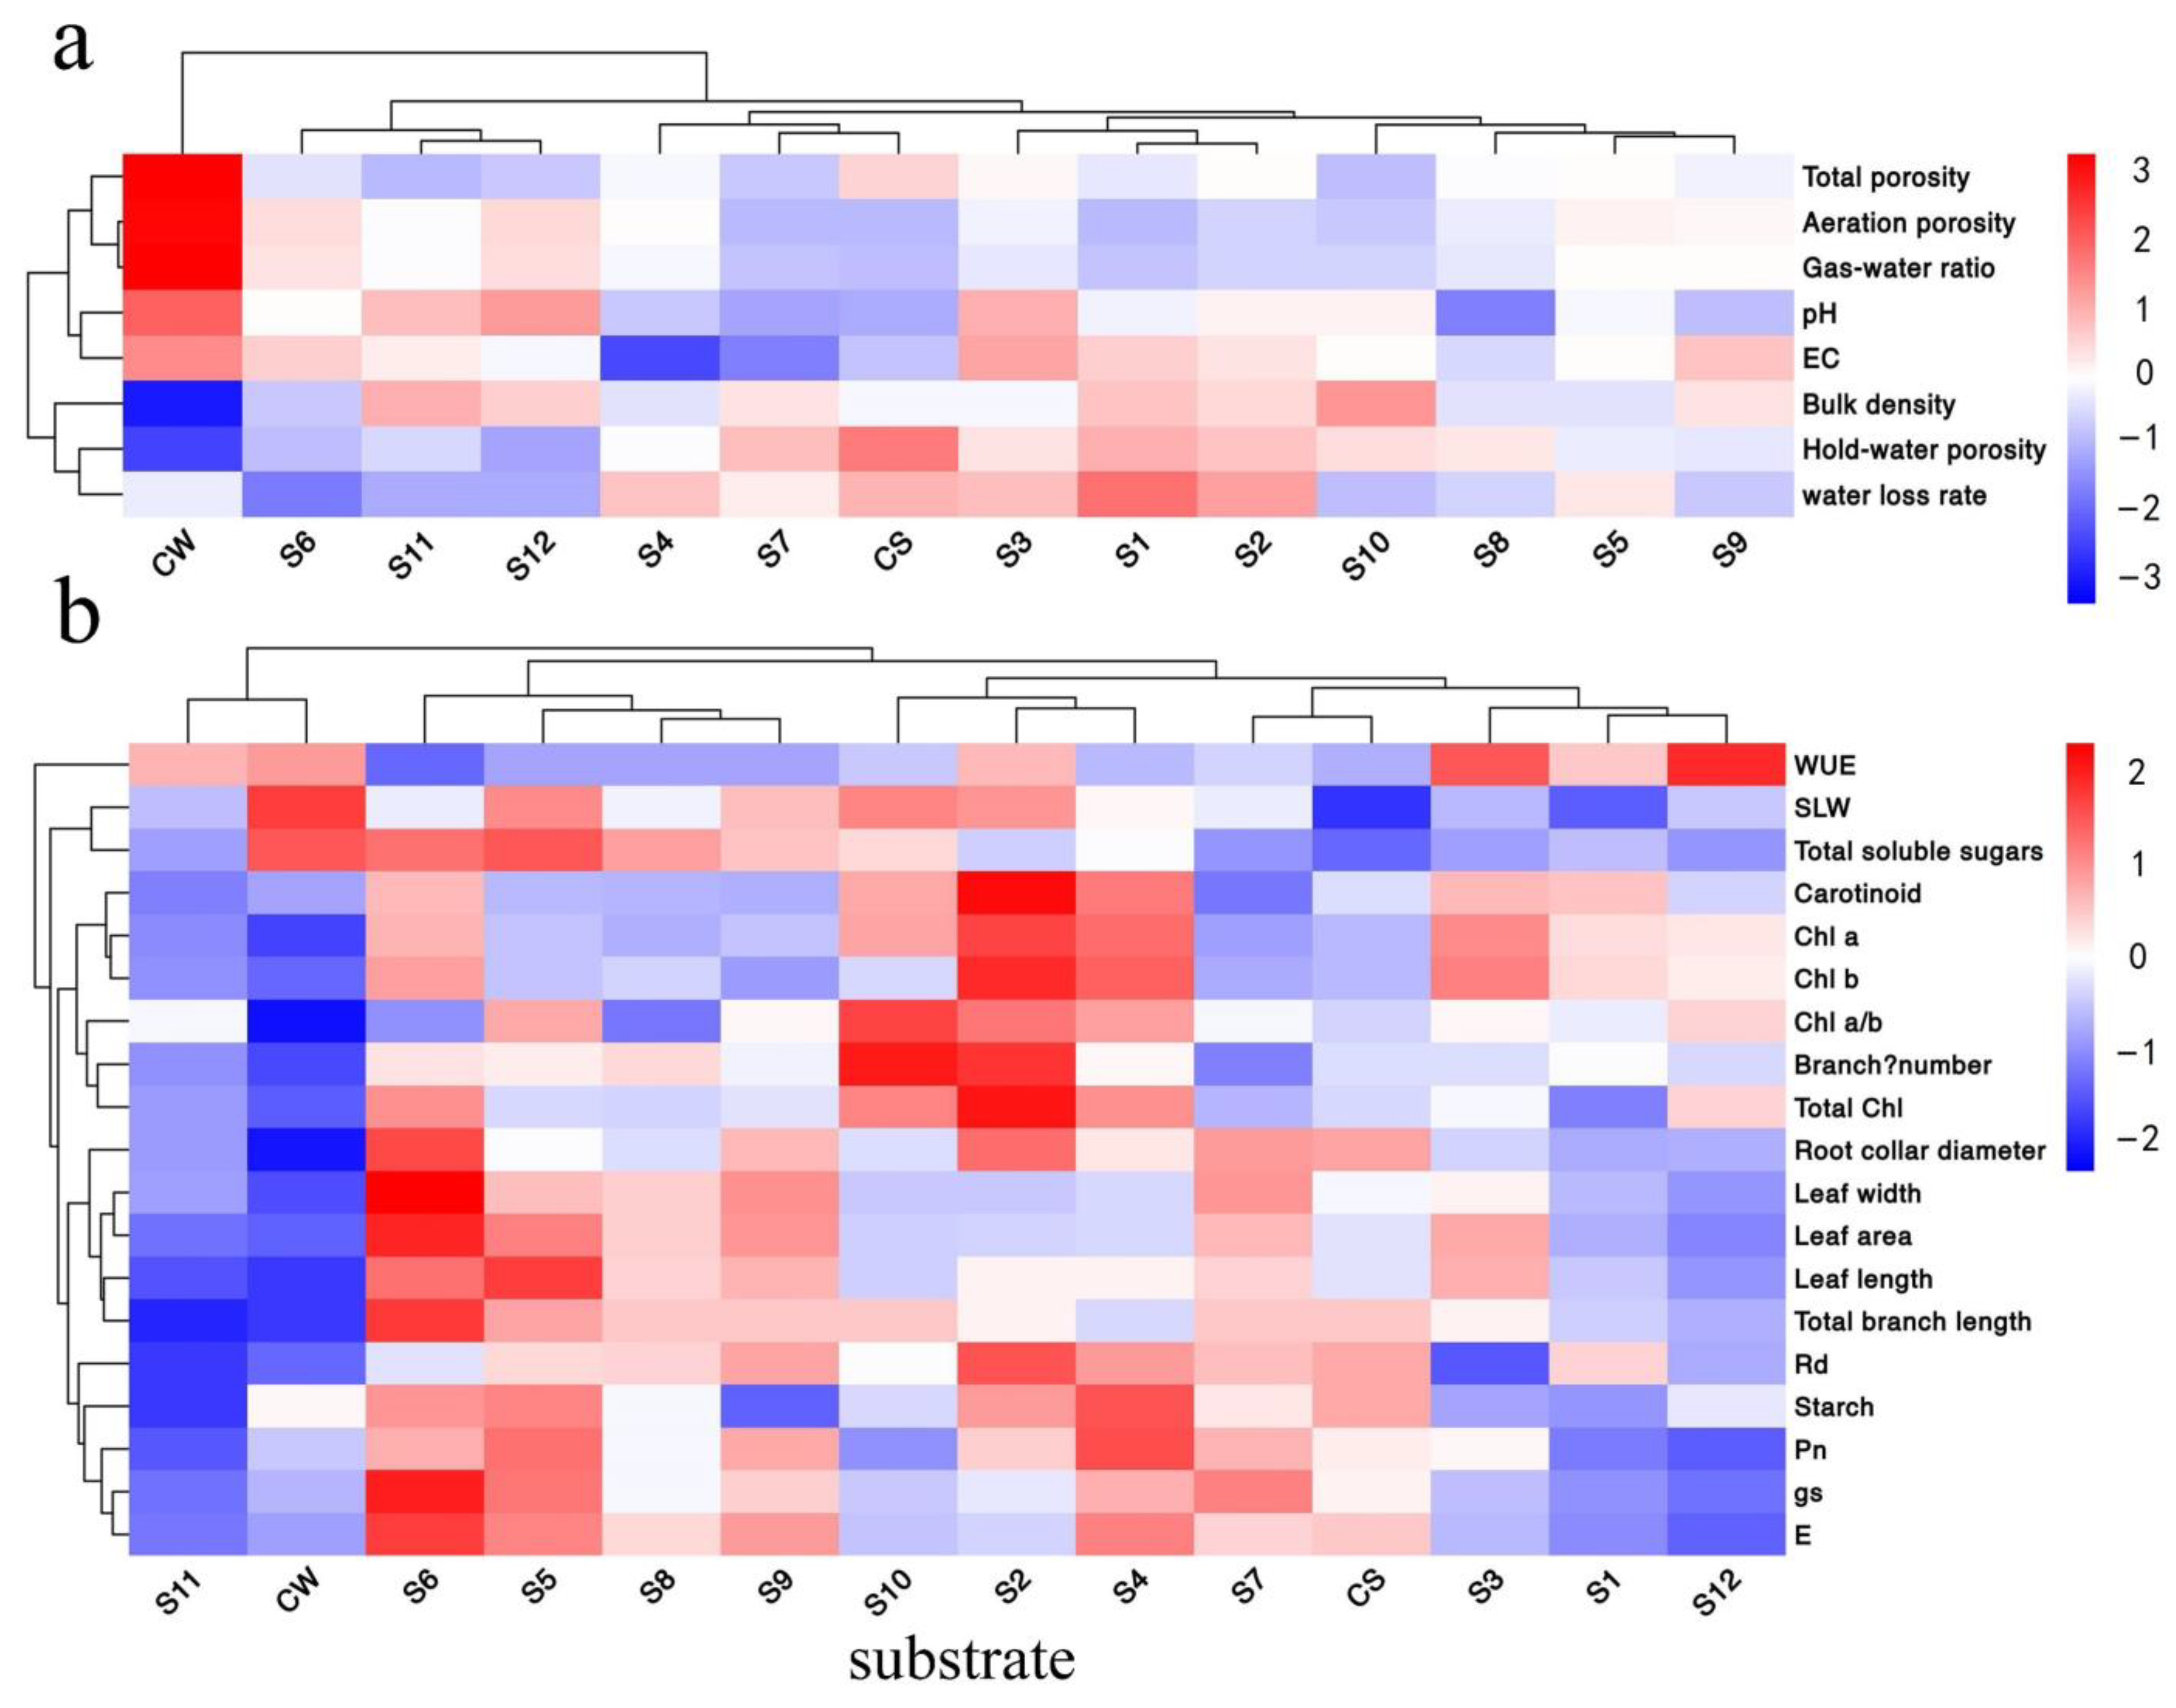
3.5. Cluster Analysis

The hierarchical cluster analysis heatmap directly shows the classification of substrates and plant growth status. 14 groups of substrates were clustered into five categories according to the eight physicochemical parameters of substrates (Figure 4a). Category CW had high total porosity, aeration porosity, air-water ratio, pH, EC, but low air-water ratio; Category S6, S11, and S12 had high aeration porosity, air-water ratio, pH, and EC; Category S4, S7, and CS had high water-holding porosity but low pH, EC, aeration porosity; Category S1, S2, and S3 had high water loss, water-holding porosity, and EC; Category S5, S8, S9, and S10 had high EC, bulk density, and water-holding porosity and low physiological parameters and. 14 groups of substrates were clustered into five categories based on nineteen physiological and growth parameters (Figure 4b). Category CW and S11 had high pH and aeration porosity; Category S6, S5, S8, and S9 had good apparent growth and high gas exchange rate; Category S10, S2, and S4 had high photosynthetic pigments; Category S7 had low pigments and CS, but good apparent growth and high gas exchange rate; Category S3, S1, and S12 had poor apparent growth and low gas exchange rate.

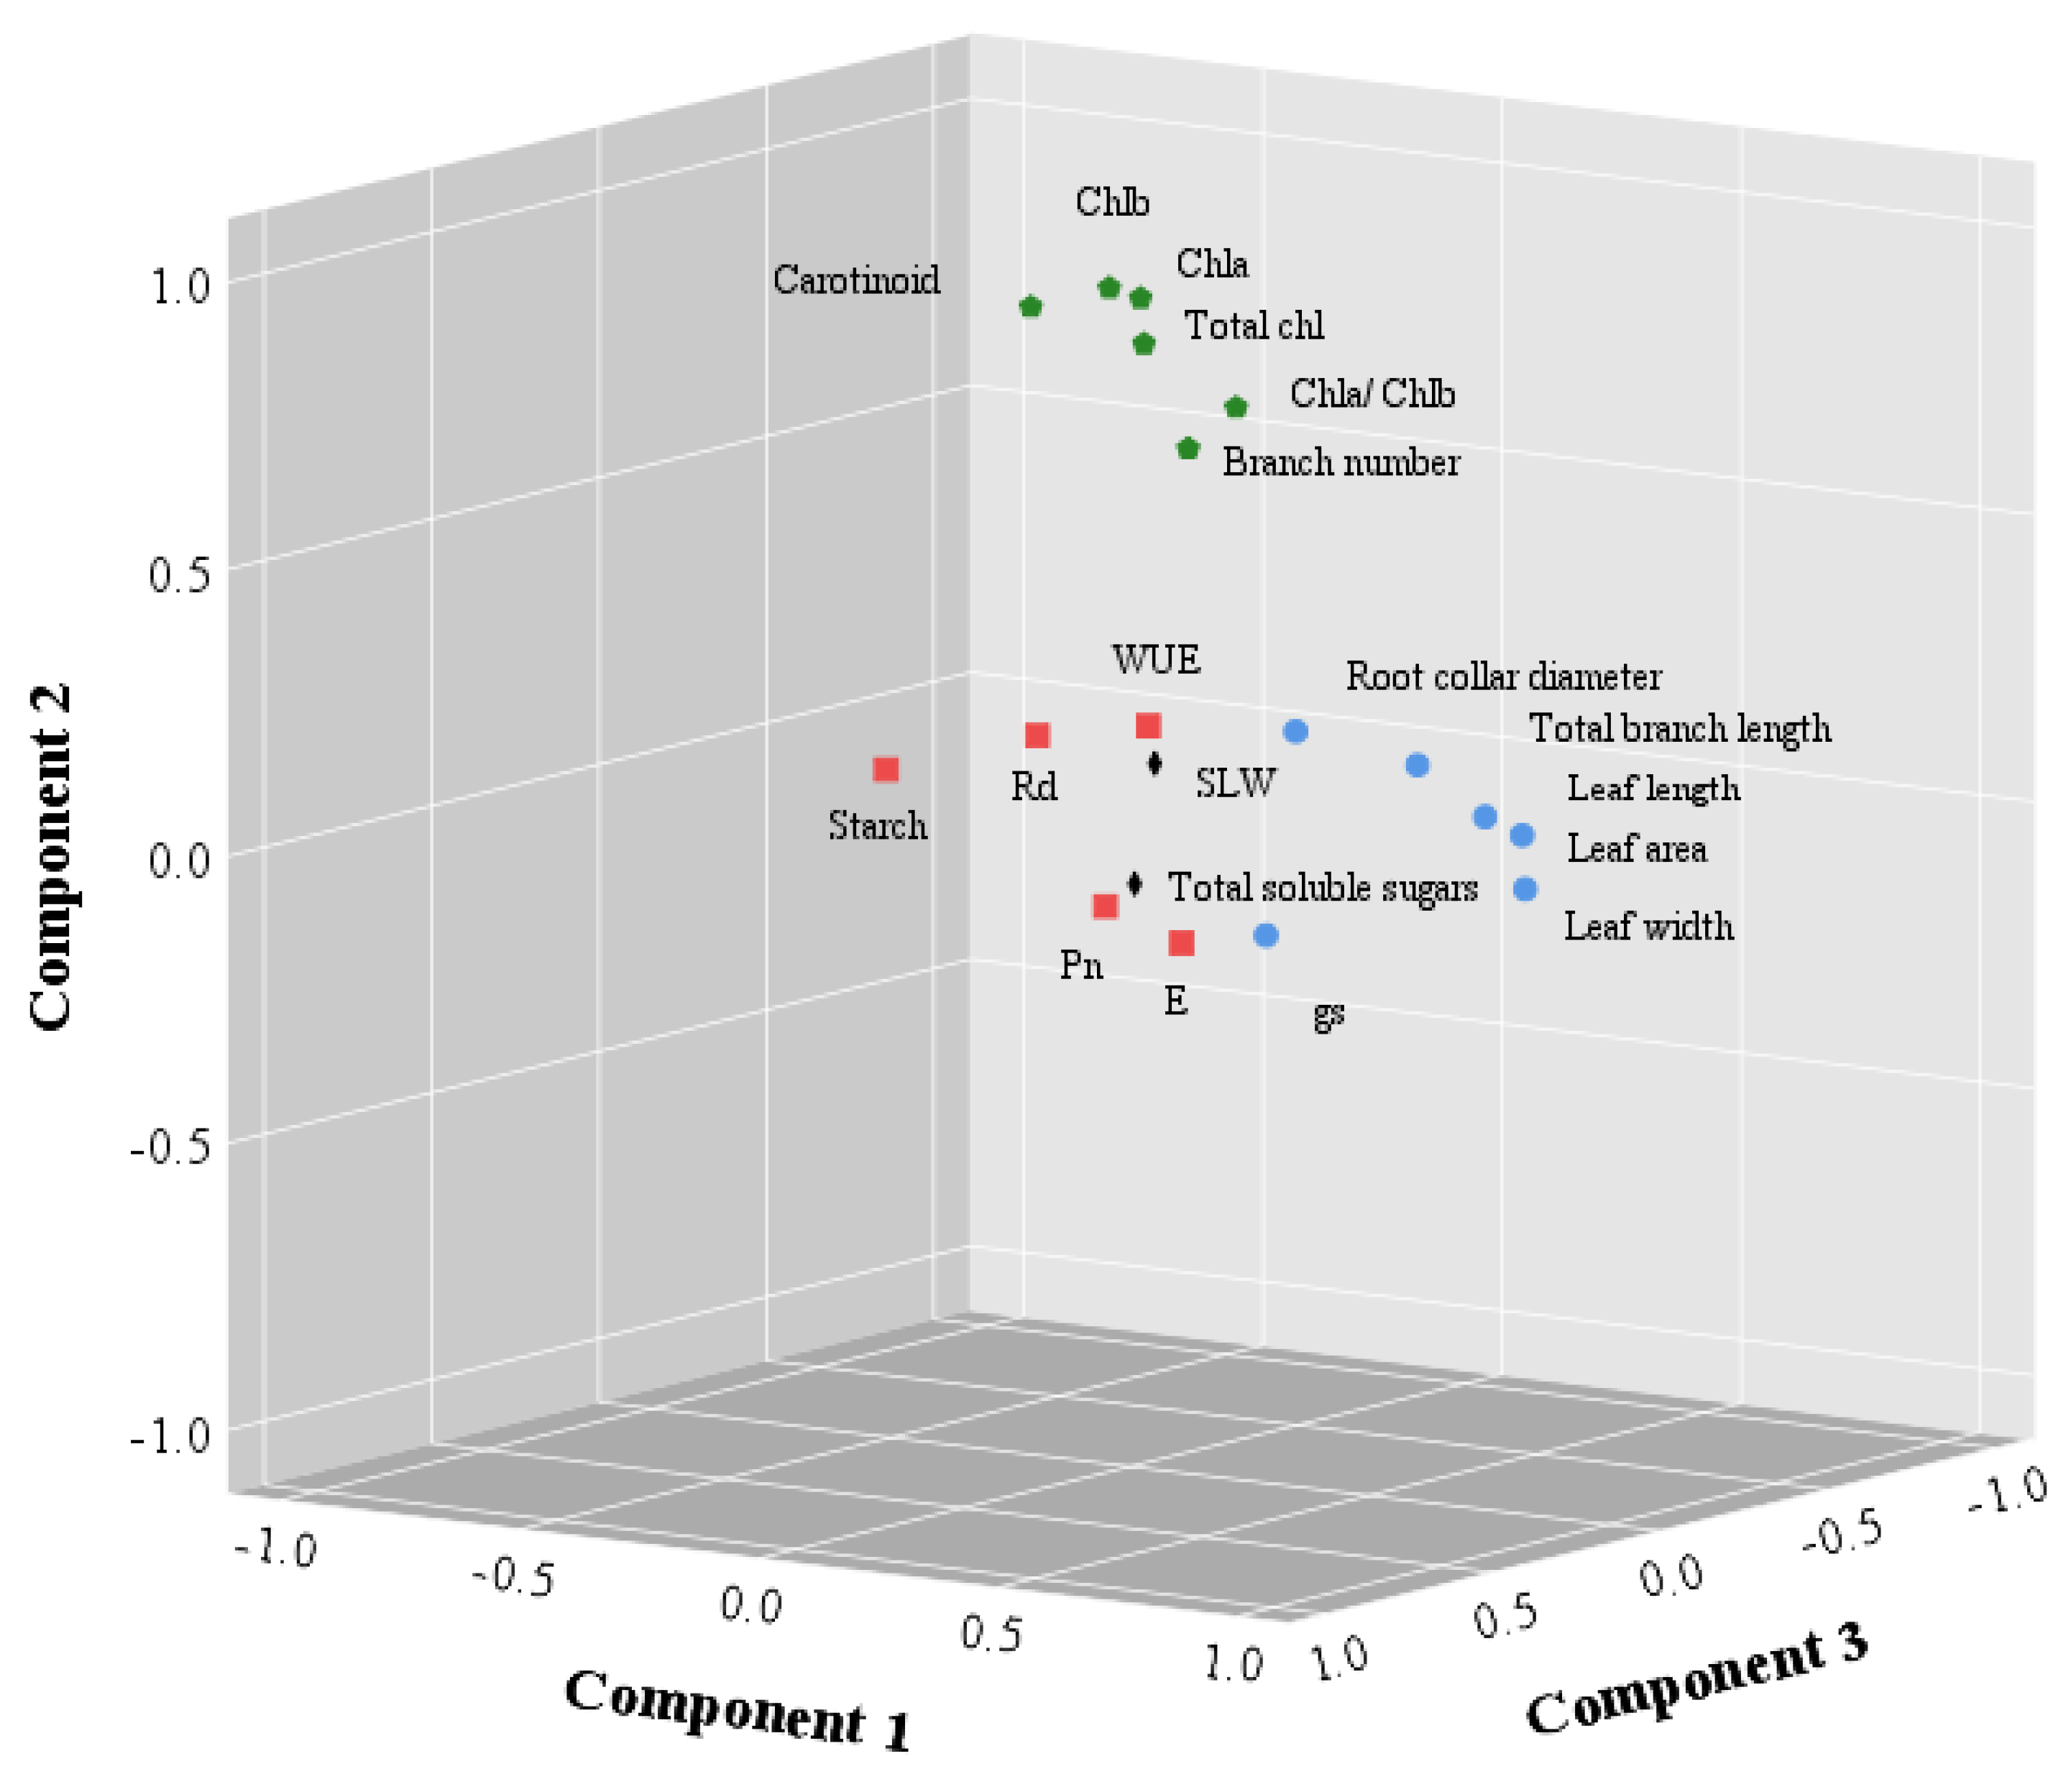
3.6. Principal Component Analysis

The KMO and Bartlett’s test for the above 19 parameters showed that the KMO value was 0.775 and the Bartlett’s value was less than 0.05, which was qualified for principal component analysis. Four principal components were extracted, accounting for 80.18% of all variables (Table 6). According to the rotating component matrix of the four principal components, PC1 has a large load coefficient on growth parameters, such as leaf size, root collar diameter, gs, and branching, and the contribution rate of PC1 is 41.46%. PC2 has a large load coefficient on pigments and branch number, the contribution rate of PC2 is 21.90%. PC3 has a large load coefficient on gas exchange and starch content, the contribution rate of PC3 is 9.90%. Total soluble sugars and SLW have large load coefficient in PC4, the contribution rate of PC4 is 6.92% (Table 6 and Table 7, Figure 5).
The total score (Fs) was calculated based on the score of each principal component. The higher the total score was, the better the ranking was. Therefore, the descending order of substrates was: S6, S5, S2, S9, S4, S10, S3, S8, S7, CS, S1, S12, CW, S11. S6 was the best substrate (Table 8).

4. Discussion

CDW increased the pH of the substrates, positively correlating with CDW content. Shin and Kang [25] reported that the pH of CDW leachate from roadbed was above 9.0. Neutral or slightly acidic soil is suitable for the growth of most plants [26]. The pH values of all substrates in the present study were within the appropriate range for plant growth. Substrates with smaller size had higher EC between 0.50 and 1.25 mS cm−1, under which plants grew better [26]. Smaller particles have larger surface area and stronger adsorption capacity. The adsorption contribution rate of soil has been proved to be particle size dependent and specific [27,28].
Appropriate aeration porosity and gas-water ratio are important for plant growth and development [29,30,31,32]. Clay soil is heavy and dense, lacking porosity to allow plants to grow well in it [33]. When clay soil is very wet, it swells to retain water, which further results in low porosity [34]. The addition of CDW with appropriate size efficiently improved the porosity of clay soil, especially 3–6 mm size. El-Shakweer et al. also found that the application of conditioners increased the porosity, pH, and EC of heavy clay [35,36]. The air-water ratio for plant growth obtained in this study is in the ideal range 0.25 to 0.50, reflecting the air permeability and water content of the substrate [37]. Too much water in soil will result in poor aeration because of its high water holding capacity [38] Adding CDW with appropriate sizes could improve soil aeration and soil structure. 3–8 mm substrates had lower water loss rate and better water retention. Water retention of substrate is affected by pore structure [39]. The 3–6 mm substrates has better air permeability and water retention. Good substrates can retain water as much as possible on the premise of ensuring air permeability, studies show that the application of biochar with moderate pore size can increase the water retention of growth substrate [40].
The addition of CDW increased root collar diameter, branch length, and leaf size of D. repens compared to the CS and CW. For example, S6 had the best aeration porosity and lower water loss, in which the total branch length, leaf size, and root collar diameter were the best. 3–6 mm was the best size for plant growth. In contrast, the growth of D. repens in smaller size CDW of 0–3 mm (with small pore space, air permeability, and high water loss rate) and bigger size CDW of 6–8 mm (with poor gas-water ratio) was worse. The increased growth was directly resulted from the improvement of substrate properties. Plants grow best in substrates with good water holding capacity, total porosity and aeration porosity [41]. It was reported that the substrate formed by 5–7 mm CDW and clay with 1:1 mass ratio was the most suitable for pepper growth [42]. Pure CDW led to smaller leaves because CDW had the smallest hold-water capacity and the highest water loss rate [43].
When compared at the same proportion, leaf size increased with CDW size in the 0–3 mm and 3–6 mm groups, while decreased in 6–8 mm and 0–10 mm groups. Larger leaf area helps to intercept more sunlight to produce photosynthate [44]. The Pn and SLW of 3–6 mm substrates were higher, which was consistent with the results of crops reported by Sowers et al. [45]. Photosynthesis provides more than 95% of the dry matter for plant growth and is the basis for plant biomass formation [46]. We found that the plants in 0–10 mm and CW substrates had lower Pn and higher Rd, indicating less matter was used for biomass accumulation and growth. Enhanced respiration reduced the carbohydrate content in leaves [47]. The lower root diameter and branching also proved it. 3–6 mm group had higher SLW and Pn, while lower Rd, which favored carbohydrate accumulation [48].
The higher the proportion of CDW was, the higher the gs was in the 0–6 mm groups. Only the E in the 3–6 mm group was relatively higher. Stomata regulate two opposite process, photosynthetic CO2 uptake and water transpiration. In generally, high gs can increase CO2 uptake and subsequently increase photosynthesis if no water deficiency [49,50]. Similar to Pn, the gs, and E in the 3–6 mm group were higher than other treatments. Nigmatullayevich, et al. [51] reported that the gs and E of pepper had positive correlation with Pn. However, WUE is generally opposite to gs [50].
Pn, total chlorophyll contents, and carbohydrates (total soluble sugars and starch) in the 3–6 mm group were higher than other treatments and the controls. During photosynthesis, chlorophyll molecules absorb light energy to make sugars and starch, while respiration burns the sugars produced by photosynthesis to provide energy for plant growth and metabolism. Excess sugars produced by photosynthesis that are not needed for respiration and growth are stored as starch [52,53,54,55]. Increased soluble sugars in plants was often accompanied by an increase in leaf area [56], which was also found in the 3–6 mm group.
The growth in the CW was the worst, which might be caused by the high porosity of the substrate [36]. The growth in the S11 was also poor due to the lower total porosity and higher bulk weight and pH [26]. In contrast, S6 had appropriate aeration porosity, lower water loss, better air and water retention, and consequently the best growth. The water loss was higher and the aeration porosity was lower in the S1 and S3, in which the growth, photosynthetic rate, and carbohydrate contents were lower. Water holding capacity and aeration porosity of the substrate significantly affect the physiological function and growth of plants [56,57,58].

5. Conclusions

Mixing CDW and clay improved the aeration porosity and air-water ratio and reduced water loss of the substrates, which is beneficial to plant growth. Plants in the 3–6 mm group grew best with higher root collar diameter, branch length, branching rate, and physiological function than other groups. In addition, the mortality was zero in the 3–6 mm group, among which 50% proportion (S6) was the best. The reuse of CDW not only greatly reduces the cost of container substrate but also protects soil resources and environment. We suggest that 3–6 mm CDW with 50% proportion to clay was suitable for container-grown D. repens. However, we admit the results have some limitations. 80–90% of the CDW used in the study are red bricks. Our conclusions may not be applicable if the concrete proportion of CDW is higher. D. repens is subtropical evergreen shrub. We cannot confirm that the optimal size and proportion also promote the growth of different types of plants. Clay soil is very sticky and can hold more water. CDW can effectively increase its porosity. Therefore, the addition proportion of CDW should be changed according to the soil type. Future application on different plants and soil types can base on our results with some modification on size or proportion. We suggest that the mixed substrate composed of CDW and soil is used for soil improvement in contaminated areas such as mining areas, or container seedling cultivation to reduce the substrate cost and save the consumption of non-renewable peat.

Author Contributions

J.J.: Writing—Original Draft, Methodology, Experiment, Date Curation; Z.Z.: Conceptualization, Funding acquisition; Y.Z.: Supervision, Conceptualization, Review & Editing, Funding acquisition; Z.T.: Investigation; M.Y.: Experiment, Date Curation; Y.L.: Experiment; Z.Y.: Experiment. All authors have read and agreed to the published version of the manuscript.

Funding

This research was funded by Greening and City Appearance Bureau of Fengxian District, Shanghai (21LYFX0186-L01). The APC was funded by the same project.

Data Availability Statement

The data that support the findings of this study are available from the corresponding author upon reasonable request.

Acknowledgments

The research was supported by the program of Soil Improvement and Greening Technique of Zhelintang Ecological Corridor.

Conflicts of Interest

The authors declare that they have no known competing financial interests or personal relationships that could have appeared to influence the work reported in this paper.

References

  1. Mohammed, M.S.; ElKady, H.M.; Abdel-Gawwad, H.A. Utilization of construction and demolition waste and synthetic aggregates. J. Build. Eng. 2021, 43, 103207. [Google Scholar] [CrossRef]
  2. Aslam, M.S.; Huang, B.; Cui, L. Review of construction and demolition waste management in China and USA. J. Environ. Manag. 2020, 264, 110445. [Google Scholar] [CrossRef] [PubMed]
  3. Haiyan, L.; Yihui, Z.; Liyuan, W.; Yi, J.; Yongwei, G.; Angzhen, L.; Jinxi, L.; Fei, L. Recycled aggregates from construction and demolition waste as wetland substrates for pollutant removal. J. Clean. Prod. 2021, 311, 127766. [Google Scholar] [CrossRef]
  4. Weber, W.J.; Jang, Y.-C.; Townsend, T.G.; Laux, S. Leachate from Land Disposed Residential Construction Waste. J. Environ. Eng. 2002, 128, 237–245. [Google Scholar] [CrossRef]
  5. Fatta, D.; Papadopoulos, A.; Avramikos, E.; Sgourou, E.; Moustakas, K.; Kourmoussis, F.; Mentzis, A.; Loizidou, M. Generation and management of construction and demolition waste in Greece—An existing challenge. Resour. Conserv. Recycl. 2003, 40, 81–91. [Google Scholar] [CrossRef]
  6. Hameed, A.M.; Hamza, M.T. Characteristics of polymer concrete produced from wasted construction materials. Energy Procedia 2019, 157, 43–50. [Google Scholar] [CrossRef]
  7. Kralj, D. Innovative systemic approach for promoting sustainable innovation for zero construction waste. Kybernetes 2011, 40, 275–289. [Google Scholar] [CrossRef]
  8. Zhe, L.; Liu, L.; Yan, S.; Zhang, M.; Xie, Y. Properties of microscopic particle morphology and particle contact of renewable construction waste mixtures. Constr. Build. Mater. 2019, 207, 190–205. [Google Scholar] [CrossRef]
  9. Sormunen, P.; Kärki, T. Recycled construction and demolition waste as a possible source of materials for composite manufacturing. J. Build. Eng. 2019, 24, 100742. [Google Scholar] [CrossRef]
  10. Mifang, L. Multifunctional use of sintered brick and tile waste in landscaping and terrestrial landscaping projects. Brick-Tile 2007, 237, 139–144. [Google Scholar] [CrossRef]
  11. Yun, S.; Ryu, D.; Khim, J. Evaluation of the recyclability of construction and demolition waste fines as a garden substrate and soil amendment agent: A case study from the Republic of Korea. J. Mater. Cycles Waste Manag. 2020, 22, 479–487. [Google Scholar] [CrossRef]
  12. Guansheng, L.; Zhan, X. A new way of recycling construction waste. Brick-Tile 2004, 2004, 68–74. [Google Scholar] [CrossRef]
  13. Zhou, W. Study on the Effects of Reclaimed Materials to the Physical and Chemical Properties of Garden Soil and Its Application; Shanghai Institute of Technology: Shanghai, China, 2021. [Google Scholar]
  14. López-Uceda, A.; Galvín Adela, P.; Jesús, A.; Ramón, J.J.; Tom, V.; Adolfo, P. Risk assessment by percolation leaching tests of extensive green roofs with fine fraction of mixed recycled aggregates from construction and demolition waste. Environ. Sci. Pollut. Res. Int. 2018, 25, 36024–36034. [Google Scholar] [CrossRef]
  15. Ji, Z.; Chen, C. Chinese Geography; Higher Education Press: Beijing, China, 1999. [Google Scholar]
  16. Liu, S. Modern Soilless Cultivation Techniques; China Agriculture Press: Beijing, China, 2001. [Google Scholar]
  17. Qin, J.; Hu, Y.; Wang, L. Study of economic-water soil for space greening on ecology building. Chin. Agric. Sci. Bull. 2007, 2007, 216–220. [Google Scholar] [CrossRef]
  18. Koch, G.W.; Sillett Stephen, C.; Jennings, G.M.; Davis, S.D. The limits to tree height. Nature 2004, 428, 851–854. [Google Scholar] [CrossRef] [PubMed]
  19. Jumrani, K.; Bhatia, V.S. Influence of different light intensities on specific leaf weight, stomatal density photosynthesis and seed yield in soybean. Plant Physiol. Rep. 2020, 25, 277–283. [Google Scholar] [CrossRef]
  20. Brito, G.G.; Sofiatti, V.; Brandão, Z.N.; Silva, V.N.B. Non-destructive analysis of photosynthetic pigments in cotton plants. Acta Scientiarum. Agron. 2011, 33, 671–687. [Google Scholar] [CrossRef]
  21. Hesheng, L. Principles and Techniques of Plant Physiological Biochemical Experiment; Higher Education Press: Beijing, China, 2000. [Google Scholar]
  22. Kuswardhani, N.; Sari, F.N.; Wibowo, Y. Identification of potential locations and factors for coffee agro-industry development in Argopuro mountain, Jember. IOP Conf. Ser. Earth Environ. Sci. 2019, 250, 012065. [Google Scholar] [CrossRef]
  23. Kang, K.; Wang, P.; Jin, J.; Liang, J. Effects of organic waste substrates on growth of potted Jasminum sambac. Chin. Agric. Sci. Bull. 2020, 36, 49–53. [Google Scholar] [CrossRef]
  24. Wang, Y.; Zhang, Y.; Wang, R.; Liang, P.; Liu, F.; Wu, L. Reasearch on comprehensive evaluation of Camellia oil quality based on principal component analysis. J. Cent. South Univ. For. Technol. 2019, 39, 45–51. [Google Scholar] [CrossRef]
  25. Shin, E.; Kang, J. Migration of calcium hydroxide compounds in construction waste soil. Adv. Environ. Res. 2015, 4, 183–196. [Google Scholar] [CrossRef]
  26. Guo, S. Research progress, current exploitations and developing trends of solid cultivation medium. Trans. Chin. Soc. Agric. Eng. 2005, 21, 4. [Google Scholar] [CrossRef]
  27. Wang, W.; Wang, W.; Xu, Z.; Wang, T. Influence of specific surface area and particle size distribution of superfine slag particles on strength of cement. China Powder Sci. Technol. 2011, 17, 80–82. [Google Scholar] [CrossRef]
  28. Huang, Y.; Liu, Z.; Wei, L.; Li, Y.; Huang, L.; Huang, Q.; XU, G. Effect of soil organo-inorganic compounds different in particle size on butachlor sorption. Acta Pedol. Sin. 2017, 54, 400–409. [Google Scholar] [CrossRef]
  29. Ruixue, C.; Qiuyue, G.; Pramod, P.; Yanming, L.; Qing, C.; Ying, S. Pretreatment by composting increased the utilization proportion of pig manure biogas digestate and improved the seedling substrate quality. Waste Manag. 2021, 129, 47–53. [Google Scholar] [CrossRef]
  30. Nkongolo, N.V.; Caron, J.; Gauthier, F.; Yamada, M. Organic Wastes for Improving Soil Physical Properties and Enhancing Plant Growth in Container Substrates. J. Crop Prod. 2001, 3, 97–112. [Google Scholar] [CrossRef]
  31. Duchesne, I.; Rioux, J.A.; Caron, J.; Parent, L.É.; Allaire, S.E. Air-filled Porosity, Gas Relative Diffusivity, and Tortuosity: Indices of Prunus ×cistena sp. Growth in Peat Substrates. J. Am. Soc. Hortic. Sci. 1996, 121, 236–242. [Google Scholar] [CrossRef]
  32. Meng, G.-L.; Luan, D.-T.; Tai, Z.-J.; Deng, J.-F.; Han, J.-Q.; Zhou, Y.-M. Effects of Different Substrate Ratios on the Growth and Physiology of Sequoia sempervirens Container Seedlings. Compost. Sci. Util. 2019, 27, 169–177. [Google Scholar] [CrossRef]
  33. Sahu, S.S.; Das, S.C. Study of Electrochemical and PhysicoChemical Properties of Clay Minerals and their Mixtures and of Some Soil Clays to Characterise their Clay Mineralogy. Proc. Indian Natl. Sci. Acad. 2013, 40, 235–248. [Google Scholar] [CrossRef]
  34. Yan, X.; Lijie, P.; Runsen, Z.; Ming, Z.; Meng, Z.; Xinguo, B.; Xuefeng, X.; Yuan, W. Effects of Agricultural Reclamation on Soil Physicochemical Properties in the Mid-Eastern Coastal Area of China. Land 2021, 10, 142. [Google Scholar] [CrossRef]
  35. El-Shakweer, M.H.A.; El-Sayad, E.A.; Ewees, M.S.A. Soil and plant analysis as a guide for interpretation of the improvement efficiency of organic conditioners added to different soils in Egypt. Commun. Soil Sci. Plant Anal. 1998, 29, 2067–2088. [Google Scholar] [CrossRef]
  36. Xu, C.; Yuan, Q.; Zhao, S.; He, T.; Song, N. Effects of pretreatments on physical and chemical characteristics of wheat straw used as a maintenance-free compressed green roof substrate material. J. Clean. Prod. 2020, 277, 123381. [Google Scholar] [CrossRef]
  37. Gong, B.; Zhao, F.; Wang, N.; Wu, X.; Li, J.; Lv, G.; Gao, H. Effects of air-water ratio and water content of substrate on the growth of tomato seedlings. J. Hebei Agric. Univ. 2020, 43, 45–49. [Google Scholar] [CrossRef]
  38. Wei, W.; Cheng, Z.; Hu, J.; Yang, J.; Jiang, X.; Ge, Y.; Sun, L.; Miao, Y.; Tao, Z. A review on formation and lon attached form of cosstal Saline-alkali soil. Chin. J. Soil Sci. 2017, 48, 1003–1007. [Google Scholar] [CrossRef]
  39. Sekucia, F.; Dlapa, P.; Kollár, J.; Cerdá, A.; Hrabovský, A.; Svobodová, L. Land-use impact on porosity and water retention of soils rich in rock fragments. Catena 2020, 195, 104807. [Google Scholar] [CrossRef]
  40. Turunen, M.; Hyväluoma, J.; Heikkinen, J.; Keskinen, R.; Kaseva, J.; Hannula, M.; Rasa, K. Quantifying the pore structure of different biochars and their impacts on the water retention properties of Sphagnum moss growing media. Biosyst. Eng. 2020, 191, 96–106. [Google Scholar] [CrossRef]
  41. Alberto, O.P.J.; Pedro, P.G.; Elias, A.K.; Fatima, M.R.; Javier, E.O.F. SWITCHGRASS BIOMASS AS A SUBSTRATE FOR Camellia AND Cuphea production in container. Environ. Eng. Manag. J. 2020, 19, 37–42. [Google Scholar] [CrossRef]
  42. Wei, Y.; Li, J.; Sun, J. Research on the effect of construction waste as alternative soil material. Land Dev. Eng. Res. 2019, 4, 32–36. [Google Scholar]
  43. Zhang, X.; Wang, Z.; Lu, J.; Yang, M.; Yang, H. Responses of leaf traits to drought at different growth stsges of alfafa. Acta Ecol. Sin. 2016, 36, 2669–2676. [Google Scholar] [CrossRef]
  44. Cuiju, L.; Xiao, G.; Ling, W.K.; Chao, L.Q.; Kun, S.Y.; Qiang, J.X.; Hua, L.Q. Ecophysiological responses of Camellia japonica (Naidong) to different light and water conditions. Ying Yong Sheng Tai Xue Bao J. Appl. Ecol. 2018, 29, 1125–1132. [Google Scholar] [CrossRef]
  45. Sowers, D.L.; Marini, R.P. Net Photosynthesis, Specific Leaf Weight, and Flowering of Peach as Influenced by Shade. HortScience 1990, 25, 331–334. [Google Scholar] [CrossRef]
  46. Rodermel, S. Redesigning Rice Photosynthesis to Increase Yield. Crop Sci. 2002, 42, 2227–2228. [Google Scholar] [CrossRef] [Green Version]
  47. Tombesi, S.; Cincera, I.; Frioni, T.; Ughini, V.; Gatti, M.; Palliotti, A.; Poni, S. Relationship among night temperature, carbohydrate translocation and inhibition of grapevine leaf photosynthesis. Environ. Exp. Bot. 2019, 157, 293–298. [Google Scholar] [CrossRef]
  48. Souden, S.; Ennajeh, M.; Ouledali, S.; Massoudi, N.; Cochard, H.; Khemira, H. Water relations, photosynthesis, xylem embolism and accumulation of carbohydrates and cyclitols in two Eucalyptus species (E. camaldulensis and E. torquata) subjected to dehydration–rehydration cycle. Trees 2020, 34, 1439–1452. [Google Scholar] [CrossRef]
  49. Kensuke, K.; Shoko, H.; Toshiharu, K.; Koh, I. Increased leaf photosynthesis caused by elevated stomatal conductance in a rice mutant deficient in SLAC1, a guard cell anion channel protein. J. Exp. Bot. 2012, 63, 5635–5644. [Google Scholar] [CrossRef] [Green Version]
  50. Li, Y.; Li, H.; Li, Y.; Zhang, S. Improving water-use efficiency by decreasing stomatal conductance and transpiration rate to maintain higher ear photosynthetic rate in drought-resistant wheat. Crop J. 2017, 5, 231–239. [Google Scholar] [CrossRef]
  51. Nigmatullayevich, R.S.; Young, Y.E.; Cheoul, C.M.; Young, C.S.; Bong, J.H.; Byoung, C.W. Heat-tolerant hot pepper exhibits constant photosynthesis via increased transpiration rate, high proline content and fast recovery in heat stress condition. Sci. Rep. 2021, 11, 14328. [Google Scholar] [CrossRef]
  52. Westcott, M.; Marais, G.; Potgieter, G.P.; Berner, J.M.; Ferreira, K. Effects of two plant growth promotors on photosynthetic capacity in Citrus spp. S. Afr. J. Bot. 2016, 103, 354. [Google Scholar] [CrossRef]
  53. French, C.S. The distribution and action in photosynthesis of several forms of chlorophyll. Proc. Natl. Acad. Sci. USA 1971, 68, 2893–2897. [Google Scholar] [CrossRef] [Green Version]
  54. Karin, A.; Jaan, K.; Katri, O.; Aljona, L. Effect of wood ash on leaf and shoot anatomy, photosynthesis and carbohydrate concentrations in birch on a cutaway peatland. Environ. Monit. Assess. 2015, 187, 02–13. [Google Scholar] [CrossRef]
  55. Qin, Y.; Shen, Y.; Wang, Q.; Wang, X.; Fan, L.; Wang, Y.; Zhang, S.; Liu, Z.; Zhang, M. Light deficiency and waterlogging affect chlorophyll metabolism and photosynthesis in Magnolia sinostellata. Trees 2019, 33, 11–22. [Google Scholar] [CrossRef]
  56. Hajihashemi, S.; Noedoost, F.; Geuns, J.M.C.; Djalovic, I.; Siddique, K.H.M. Effect of Cold Stress on Photosynthetic Traits, Carbohydrates, Morphology, and Anatomy in Nine Cultivars of Stevia rebaudiana. Front. Plant Sci. 2018, 9, 1430. [Google Scholar] [CrossRef] [PubMed] [Green Version]
  57. MacAlister, D.; Muasya, A.M.; Crespo, O.; Chimphango, S.B.M. High temperature effects on photosynthesis, carbohydrate partitioning and phenolics in field grown Aspalathus linearis. S. Afr. J. Bot. 2018, 115, 293–294. [Google Scholar] [CrossRef]
  58. Duan, R.; Ma, Y.; Yang, L. Effects of Shading on Photosynthetic Pigments and Photosynthetic Parameters of Lespedeza Buergeri Seedlings. IOP Conf. Ser. Mater. Sci. Eng. 2018, 452, 022158. [Google Scholar] [CrossRef]
Figure 1. The root collar diameter (A), branch length (B), branch number (C), leaf length and width (D), leaf area (E), and specific leaf weight (SLW) (F) of Duranta repens grown in different substrates mixed with clay soil and four sizes of construction and demolition waste based on three mass ratios in July and November 2021 (Mean ± SE, n = 4). The different lower-case letters indicated significant difference among treatments in the same month. The abbreviation of substrates was shown in Table 3.
Sustainability 15 01585 g001
Figure 2. The net photosynthetic rate (Pn) (A), respiration rate (Rd) (B), stomatal conductance (gs) (C), transpiration rate (D,E), and water use efficiency (WUE) (E) of Duranta repens grown in different substrates mixed with clay soil and four sizes of construction and demolition waste based on three mass ratios in July and November 2021 (Mean ± SE, n = 4). Different lowercase letters indicated significant difference in the same month. The abbreviation of substrates was shown in Table 3.
Sustainability 15 01585 g002
Figure 3. The contents of chlorophyll (A), Chl a/b ratio (B), carotinoid (C), total soluble sugars (D), and starch (E) of Duranta repens leaves in different substrates mixed with clay soil and four sizes of construction and demolition waste based on three mass ratios in July and November 2021 (Mean ± SE, n = 3). Different lower-case letters indicated significant difference in the same month. The abbreviation of substrates was shown in Table 3.
Sustainability 15 01585 g003
Figure 4. The hierarchical cluster analysis heatmap of the substrates. The columns represented the substrates and the rows represented substrate properties (a) and plant physiological properties (b).
Sustainability 15 01585 g004
Figure 5. Component plot in rotated space.
Sustainability 15 01585 g005
Table 1. The concentrations of seven heavy metals in 0–10 mm construction and demolition waste (mg/kg).
PbAsCdHgCrCuNi
21.47.10.1320.0425321.930
Table 2. The percentage of sand, silt, and clay in the clay soil.
Sand %
(2.0–0.02 mm)
Silt %
(0.02–0.002 mm)
Clay %
(<0.002 mm)
34.735.230.1
Table 3. Substrates mixed with construction and demolition waste (CDW) of four sizes and clay soil according to three mass ratios and two controls of clay soil (CS) and 0–10 mm CDW (CW).
SubstrateCDW Size (mm)CDW Proportion (%)Clay Soil Proportion (%)
S10–32080
S20–33565
S30–35050
S43–62080
S53–63565
S63–65050
S76–82080
S86–83565
S96–85050
S100–102080
S110–103565
S120–105050
CS/0100
CW0–101000
“/” indicates that no CDW has been added to CS.
Table 4. The basic properties of substrates mixed with clay soil and four sizes of construction and demolition waste based on three mass ratios (Mean ± SE, n = 3).
SubstratepHEC (ms·cm−1)Bulk Density
g cm−3
Total Porosity (%)Aeration Porosity (%)Hold-Water Porosity (%)Gas-Water Ratio (%)Water Loss Rate (%)
S16.84 ± 0.09 cde0.52 ± 0.04 abc1.36 ± 0 bc38.37 ± 0.65 bcd5.24 ± 0.17 g33.13 ± 0.75 b0.16 ± 0.01 g17.96 ± 1.00 a
S26.92 ± 0.08 c0.50 ± 0.06 abc1.34 ± 0.02 c39.06 ± 0.33 bcd6.81 ± 1.26 f32.25 ± 0.94 bc0.21 ± 0.04 efg17.10 ± 0.92 ab
S37.13 ± 0.07 b0.56 ± 0.08 ab1.30 ± 0.02 d39.33 ± 0.66 bc8.58 ± 0.49 de30.75 ± 1.05 cde0.28 ± 0.03 cde16.55 ± 0.96 abc
S46.71 ± 0.03 def0.31 ± 0.03 e1.28 ± 0.02 de38.85 ± 0.68 bcd9.53 ± 0.35 cd29.32 ± 1.03 def0.33 ± 0.02 cd16.44 ± 0.76 abc
S56.86 ± 0.07 cd0.48 ± 0.06 abcd1.28 ± 0.02 de39.08 ± 0.26 bcd10.24 ± 0.21 c28.84 ± 0.47 ef0.36 ± 0.01 c15.75 ± 0.94 bcd
S66.89 ± 0.05 c0.52 ± 0.04 abc1.26 ± 0.01 e38.27 ± 0.43 cd11.68 ± 0.50 b26.59 ± 0.9 gh0.44 ± 0.03 b12.76 ± 0.53 e
S76.59 ± 0.15 fg0.36 ± 0.02 de1.33 ± 0.01 c37.51 ± 0.65 cd5.12 ± 0.48 g32.39 ± 0.96 bc0.16 ± 0.02 g15.60 ± 0.65 bcd
S86.48 ± 0.10 g0.44 ± 0.10 bcd1.28 ± 0.01 de39.02 ± 0.82 bcd8.37 ± 0.17 e30.65 ± 0.99 cde0.27 ± 0.01 def14.49 ± 0.43 cde
S96.68 ± 0.12 ef0.53 ± 0.08 abc1.33 ± 0.03 c38.68 ± 1.91 bcd10.17 ± 0.36 c28.51 ± 1.79 fg0.36 ± 0.02 c14.21 ± 0.25 de
S106.92 ± 0.18 c0.48 ± 0.05 abcd1.40 ± 0.01 a37.15 ± 0.07 d6.09 ± 0.48 fg31.06 ± 0.49 cd0.20 ± 0.02 fg14.07 ± 0.43 de
S117.09 ± 0.07 b0.49 ± 0.13 abc1.38 ± 0.01 ab37.11 ± 0.54 d9.33 ± 0.48 cde27.78 ± 0.36 fg0.34 ± 0.02 cd13.70 ± 0.25 de
S127.21 ± 0.08 b0.47 ± 0.02 abcd1.35 ± 0.01 c37.55 ± 2.02 cd11.92 ± 0.82 b25.63 ± 1.57 h0.47 ± 0.03 b13.64 ± 0.42 de
CS6.60 ± 0.03 fg0.42 ± 0.04 cd1.30 ± 0.02 d40.33 ± 1.67 b5.02 ± 0.54 g35.32 ± 1.2 a0.14 ± 0.01 g16.75 ± 0.85 ab
CW7.39 ± 0.12 a0.58 ± 0.01 a1.10 ± 0.01 f46.50 ± 1.32 a25.29 ± 1.24 a21.22 ± 1.79 i1.20 ± 0.14 a14.96 ± 0.15 bcd
Different lowercase letters in each column indicated significant difference (p < 0.05). The abbreviation of substrates was shown in Table 3.
Table 5. Statistical results of construction and demolition waste size (S), proportion (P), and treatment time (T) on growth, morphology, gas exchange, and physiological parameters of Duranta repens using a three-way ANOVA.
TPST × PT × SS × PT × P × S
Root collar diameter*****nsns*nsns
Total branch length***ns*ns****
Branch number***nsnsnsns****
Leaf length/******//***/
Leaf width/******//***/
Leaf area/******//***/
SLW**ns***ns*ns*
Pn**ns**********ns
Rd***************
gs*******************
E***ns***ns******
WUE***ns***ns**ns*
Chl a********nsnsnsns
Chl b*****nsnsns*
Total Chl******nsns****
Chl a/b****ns*nsnsns
Carotinoid***ns***ns***ns
Total soluble sugars******ns**********
Starch**ns************
*, p < 0.05; **, p < 0.01; ***, p < 0.001; ns, non-significant difference. /: indicates no three-way ANOVA for leaf length, leaf width and leaf area due to the lack of data in July.
Table 6. Eigenvalues and cumulative contribution of the principal components in all substrates.
IndexInitial EigenvaluesExtraction of the Sum of Squares of Loads
TotalPercentage of VarianceAccumulation %TotalPercentage of VarianceAccumulation %
17.87741.45841.4587.87741.45841.458
24.1621.89663.3554.1621.89663.355
31.8829.90473.2581.8829.90473.258
41.3156.92280.181.3156.92280.18
50.8524.48484.664
60.6583.46188.125
70.5322.79790.923
80.4152.18493.107
90.3541.86594.972
100.2861.50696.477
110.2231.17297.649
120.1130.59598.244
130.0920.48498.729
146.30 × 10−23.34 × 10−199.062
155.60 × 10−22.94 × 10−199.356
164.60 × 10−22.42 × 10−199.598
173.40 × 10−21.82 × 10−199.78
182.60 × 10−21.35 × 10−199.915
191.60 × 10−28.50 × 10−2100
Table 7. Rotating component matrix of the four principal components.
ParameterPC1PC2PC3PC4
Leaf width0.940.0140.1620.052
Leaf area0.9390.1080.170.167
Leaf length0.9090.1470.2380.019
Total branch length0.8380.2450.34−0.013
gs0.706−0.0270.6020.229
Root collar diameter0.6650.3030.456−0.269
Chl b0.0220.9580.0940.008
Chl a0.0760.9440.078−0.044
Carotinoid content−0.1050.920.1470.096
Total chl0.1220.8770.1330.097
Chl a/b0.1480.734−0.105−0.066
Branch number0.1960.6980.107−0.011
Starch0.0490.2240.7990.151
Pn0.4390.0110.7010.082
WUE0.593−0.0390.6930.151
Rd0.270.2860.663−0.248
E−0.4160.044−0.648−0.072
Total soluble sugars0.117−0.0620.1540.916
SLW0.0540.120.0040.897
Accumulation41.46%21.90%9.90%6.92%
Bold values (absolute value > 0.6) indicated that loading values were valid for the component.
Table 8. Each principal component score and total score (Fs) of substrates, and the rank of substrates based on the Fs.
SubstrateF1F2F3F4FSRank
S1−0.1844220.077688−0.428626−0.895793−16.3904911
S2−0.1520250.8516810.436033−0.27543714.757633
S30.268280.368478−1.105075−0.2508856.5092717
S4−0.2888660.4107491.2442990.0526529.7059695
S50.331499−0.1706060.3898621.02609220.97152
S60.6743990.1420340.2475820.78927838.984641
S70.253801−0.4617180.428692−0.6486060.1684429
S80.161114−0.2296380.070323−0.0125572.2608478
S90.399871−0.303137−0.1040730.19900110.287114
S10−0.0832850.516747−0.3556030.5459528.1190676
S11−0.286777−0.411357−1.051081−0.409856−34.1431914
S12−0.3138470.145911−0.755834−0.431701−20.2906112
CS−0.102836−0.2658540.881858−1.456798−11.4345410
CW−0.676907−0.6709790.1016431.768658−29.5056413
Disclaimer/Publisher’s Note: The statements, opinions and data contained in all publications are solely those of the individual author(s) and contributor(s) and not of MDPI and/or the editor(s). MDPI and/or the editor(s) disclaim responsibility for any injury to people or property resulting from any ideas, methods, instructions or products referred to in the content.

