Article

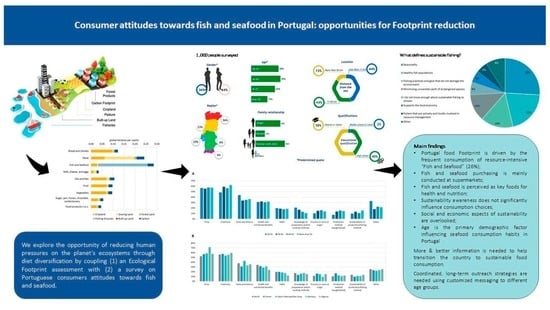
Consumer Attitudes towards Fish and Seafood in Portugal: Opportunities for Footprint Reduction

1
Global Footprint Network, 1528 Webster Street, Suite 11, Oakland, CA 94612, USA
2
Global Footprint Network, Avenue Louis-Casaï, 18, 1209 Geneva, Switzerland
3
GOVCOPP (Research Unit on Governance, Competitiveness and Public Policies), Department of Social, Political and Territorial Sciences, University of Aveiro, Campus Universitário de Santiago, 3810-193 Aveiro, Portugal
*
Author to whom correspondence should be addressed.
Sustainability 2023, 15(2), 1363; https://doi.org/10.3390/su15021363
Submission received: 21 October 2022 / Revised: 19 December 2022 / Accepted: 6 January 2023 / Published: 11 January 2023

Abstract

:
Fish and seafood are central to the Portuguese diet, comprising a significant portion of Portugal’s Ecological Footprint. Diversifying dietary preferences is important because it has the potential to reduce pressure on marine ecosystems. We explored this opportunity by coupling (1) an Ecological Footprint assessment of Portugal to quantify the environmental impacts of Portugal’s food consumption choices (particularly fish and seafood), with (2) a consumer survey to assess attitudes towards fish and seafood of Portuguese residents and their willingness to modify their preferences, thus shedding light on the potential for sustainable dietary choices in Portugal and the best strategies by which to achieve them. Ecological Footprint results confirm that Portugal is unique in the Mediterranean region in that its food Footprint is driven by fish and seafood consumption, while, for most other countries, the main driver is meat. Results from the consumer survey show that Portuguese fish and seafood preferences are characterized by a high frequency of consumption and a preference for high trophic level species. Age was the primary demographic factor influencing consumption habits in Portugal. Moreover, Portuguese consumers lack knowledge on sustainable fishing practices. Actions and strategies to increase sustainable dietary choices in Portugal will need to consider these factors. We recommend targeted outreach messaging for different age groups, more and better information on sustainable options, together with efforts to protect marine biodiversity. Future research needs to better understand the whole value chain and all relevant stakeholders of the fish and seafood sector for more effective incentives for Footprint reduction.

Graphical Abstract

1. Introduction

Sustainable resource management is critical to ensuring the long-term viability of the biodiversity and ecosystems on which human societies depend. Key to effective resource management is accurate measurement of the supply and demand of natural resources. The Ecological Footprint is a resource accounting tool that assesses two criteria necessary for a sustainable society; one that the rate of humanity’s demand on renewable resources does not exceed the Earth’s ability to generate those resources, and the other that the rate at which humanity produces waste does not exceed the Earth’s capacity to assimilate that waste [1,2].
Decision-makers must rely on the best available information to shape sustainable development outcomes, as set forth in the Sustainable Development Goals (SDGs). However, trade-offs exist between different indicators that measure progress towards SDGs [3]. For example, the desire to increase gross domestic product (GDP), one of the indicators for SDG 8 (“Decent Work and Economic Growth”), further increases the consumption of natural resources on a planet with finite resources, negatively impacting SDGs 12 (“Responsible Consumption and Production”), 14 (“Life Below Water”), and 15 (“Life on Land”) [3,4].
Other indicators must thus be considered in conjunction with popular economic indicators (i.e., GDP), covering areas of wellbeing, environment, and society, in order to achieve sustainable development that does not compromise “the ability of future generations to meet their own needs” [5,6]. On the environmental side, such indicators include, among others, Footprint-types of indicators [7] such as Carbon Footprint, Water Footprint, and Ecological Footprint, each measuring different environmental externalities and impacts associated with human activities [6]. Here, we focus on the Ecological Footprint, the environmental metric that quantifies the human appropriation of the regenerative capacity of the biosphere [8,9], due to its ability in framing and measuring both the human-demand and the earth-supply sides of the sustainability equation.
The Ecological Footprint can be measured across various scales (e.g., individual, local, regional, national, or global), and includes the actual provision of natural resources, the biologically productive space required to accommodate human settlement, and the biological productivity needed to absorb waste in the form of carbon dioxide emissions [1,10]. It is paired with biocapacity, which measures the amount of biological resources and services ecosystems are capable of producing each year [1,11].
With the dual climate and biodiversity crises coming to a head in recent years, there is a need to understand how localized actions and consumptive behaviors impact global environmental systems as fundamental as climate and nutrient cycling [12]. This “global” perspective has given rise to an increased interest in natural resource accounting to inform local sustainable consumption policies and to connect local actions and policies to global sustainability objectives and agendas (e.g., [13,14]).
In Portugal, national and municipality-level EFAs have shown that food consumption is a main driver of Portugal’s Ecological Footprint [15], comprising nearly 30% of its Ecological Footprint, with fish and seafood contributing to the greatest portion (closely followed by meat) [15]. In fact, in 2019, Portugal was the highest per capita fish consumer in the European Union (59.9 kg per capita), and one of the highest in the world [16,17].
Despite the long maritime heritage of Portugal and an Exclusive Economic Zone (EEZ) of 1.7 million km2 (almost 50% of the EU’s EEZ), Portugal does not depend on national fish catches as much as it has in the past. The fishing sector was the primary means of subsistence in coastal communities, which depended almost exclusively on fisheries and related activities, but today, it represents less than 1% of the national GDP and 0.6% of total employment in Portugal [18]. The total fish catch in Portugal in 2010 was about 222 thousand tons live weight from the marine areas covered by EU statistics, corresponding to about 4.5% of EU fish catches [19]. In 2019, the Portuguese fish catch was reduced by 21% to about 185 thousand tons [19]. This is in line with the gradual decrease in total fish production in Europe since the late 1980s (although recovering slightly in the last few years), and opposite to the global increase in fish production from 101.8 million tons in the 1986–1995 decade to 178.5 million tons in 2018 [20]. Despite such a decreasing EU trend, [15] concluded that, in Portugal, fish and seafood represent the single highest import of biocapacity from abroad, amounting to 1.6 million global hectares in total. The Portuguese population relies on biocapacity from abroad for approximately 60% of its fish and seafood Footprint. The highest pressures are placed on ecosystems in Spain (33.2%), Norway (6.7%), Senegal (2.6%), and other Western African countries (2.7%), as well as Sweden (1.4%) [15].
The habits of fish and seafood consumption have been described as substantially varying from country to country, mainly related to socio-demographic characteristics, as well as regional and traditional factors [21,22,23,24]. Some explanations in Portugal relate to tradition and cultural roots (e.g., fisheries and processing industries heritage, culinary traditions, the influence of religion), politics (e.g., governmental fish campaigns and the influence of the European Union Fisheries Policy), as well as the dynamics of the fish market system and the Portuguese geography (e.g., proximity to marine resources through a large coastal area, a vast Exclusive Economic Zones, and more than 76% of the population living in coastal areas), which makes fisheries and the consumption of seafood products extremely valuable [25,26,27]. In addition to high fish and seafood consumption, Portuguese consumption is characterized by a wide diversity of species and preparation modes.
Sea surface temperature rises and increased ocean acidification due to climate change, when coupled with Europe’s already depleted fish stocks [28], places Portugal’s dietary and cultural habits at risk (e.g., [29]). Lowering Portugal’s high Footprint of consumption of fish and seafood could reduce fishing pressure on marine species and Portugal’s reliance on scarce resources. Therefore, the aim of this study is to: (1) quantify the environmental impacts of Portugal’s food consumption choices, particularly regarding fish and seafood; (2) investigate consumer attitudes towards fish and seafood—via a 26-question survey distributed via a computer-assisted web interview (CAWI) methodology—to understand the dietary preferences of Portuguese residents; and (3) assess whether a willingness exists to modify fish and seafood choices, thus shedding light on the potential for more sustainable dietary choices in Portugal and the best transition strategies for favoring it.

2. Materials and Methods

2.1. Ecological Footprint Assessment

To calculate the Ecological Footprint of fish and seafood consumption in Portugal, a top-down environmentally-extended multi-regional input-output (EE-MRIO) Ecological Footprint Assessment was used [30,31]. EE-MRIO allows for the calculation of the Ecological Footprint of the final demand for goods and services within various economic sectors grouped by the standard Classification of Individual Consumption According to Purpose (COICOP) (UN Statistics Division). EE-MRIO analyses shed light on the degree of different pressure consumption activities within a population’s economy exerted on the planet’s biocapacity.
Although the Ecological Footprint of fish and seafood consumption in Portugal has previously been calculated by [15,32], this study recalculates the value, using updated data from the 2020 Edition of the National Footprint and Biocapacity Accounts (NFBA) [33] and version 10 of the Global Trade Analysis Project (GTAP) MRIO model [34,35]. The latest data year in the NFBA 2020 edition is 2017, while in GTAP 10 is 2014 (to account for the difference in data years, economic sectors were scaled in GTAP, standardized to the COICOP household expenditure classification system [36], to the national Footprint in NFBA data year 2017. Although such scaling allows for understanding consumption patterns across time, the Ecological Footprint of each food sub-category was only calculated for the latest GTAP data year (2014) to limit methodological assumptions).
The two NFBA’s output metrics, Ecological Footprint and biocapacity, are measured in global hectares (gha), a unit of area proportionally adjusted to world-average bioproductivity, which accounts for the varying productivity of different ecosystems and allows the metrics to be comparable across space and time [1,10]. Six land types are considered: cropland, grazing land, fishing grounds, forest land, built-up land, and the area needed to sequester CO2 emissions [1,10].
GTAP is an input-output database of monetary flows between 65 economic sectors in 141 countries and regions, aggregated into three final consumer types: households, government, and fixed capital [34].
EE-MRIO analysis was used, following the methodology in [32], to combine Portugal’s national Footprint of production with GTAP monetary flows, allocating the country’s Ecological Footprint to specific consumption categories (see Figure 1).
The resulting output is a matrix showing the resource requirements by each sector in the Portuguese economy, and final consumer types (household, government, and fixed capital) across the six Ecological Footprint land types—including both food-related and food-unrelated sectors. To derive Ecological Footprint values by specific consumption categories, including fish and seafood, a sector-to-household concordance table was used to allocate the Ecological Footprint in each of the 65 GTAP sectors to the COICOP categories, resulting in a COICOP Land Use Matrix (CoLUM) for household consumption in Portugal.
The category of focus for this study is COICOP category CP011 “Food and non-alcoholic beverages”, which has 10 sub-categories, of which CP011.3 is “Fish and Seafood”. In line with [37], the fish and seafood Footprint is thus defined as the demand for all six Footprint land types connected to the individual consumption of the products listed within the COICOP category CP011.3 Fish and Seafood.

2.2. Consumer Survey

A consumer survey was distributed in Portuguese language and developed following the methodology in [37]—which applied a similar survey in three Mediterranean countries (Croatia, Italy, and Turkey)—to understand: (1) fish and seafood purchasing habits of Portuguese residents; (2) whether or not a willingness to change their preferences exists; (3) consumers’ perception of key aspects of fish and seafood sustainability; and (4) subjective knowledge about small-scale fisheries and their sustainability compared to large-scale fisheries.
The survey consisted of 26 closed-ended questions and took approximately 10 min to complete. Only fish and seafood products were included in this survey, not aquaculture or freshwater fish products. The survey aimed to holistically capture the social, economic, demographic, and environmental drivers of consumer behaviors and preferences.
A market research company distributed the survey to 1000 Portuguese residents using the computer-assisted web interview (CAWI) methodology. Surveys were distributed across Portugal’s five continental NUTS II regions to ensure adequate geographical representation of consumer habits and perceptions throughout the country. Interviewees were recruited through an online panel, which was defined by the market research company, taking into consideration quotas for gender, age group, and geographic areas representatives of the country’s socio-demographic factors, to ensure representativeness of the sample (Figure 2). Interviews were conducted in February 2020 and lasted two weeks. Survey results were analyzed with a chi-squared test of independence, using an alpha level of 0.05.

3. Results

3.1. Portugal’s Ecological Footprint and the Contribution of Fish and Seafood

The per capita Ecological Footprint of Portugal from 2011 to 2017 ranged from 3.7 to 4.1 global hectares per person [33] (Figure 3). During this time period, Portugal’s biocapacity ranged from 1.2 to 1.3 global hectares per person, indicating that Portugal was experiencing a biocapacity deficit. Demand for ecosystems’ carbon sequestration capacity (i.e., carbon Footprint) contributed the most (56%) to Portugal’s Ecological Footprint in 2017, followed by cropland (20%) and fishing grounds (9%) Footprints in 2017 (Figure 3).
EE-MRIO analysis, which combined Portugal’s Ecological Footprint with GTAP monetary flows, showed that the “Food and non-alcoholic beverages” consumption category consistently contributed the most to Portugal’s Ecological Footprint, comprising 29% of the country’s Ecological Footprint in 2017, followed by “Transportation” at 17%, and “Gross Fixed Capital Formation” at 12% (Figure 4).
CoLUM analysis, which derived Footprint values for more specific consumption categories, shows that the “Fish and Seafood” sub-category contributed the most to Portugal’s food Footprint, comprising 26% of the Ecological Footprint of “Food and non-alcoholic beverages” in 2014, followed by “Meat” at 23%, and “Bread and Cereals” at 11% (Figure 5). Further analyzing the contribution of each Footprint type to the “Fish and Seafood” consumption sub-category showed that the fishing grounds Footprint contributed the most at 79%, followed by the carbon Footprint at 10%, and the cropland Footprint at 9% (Figure 5).

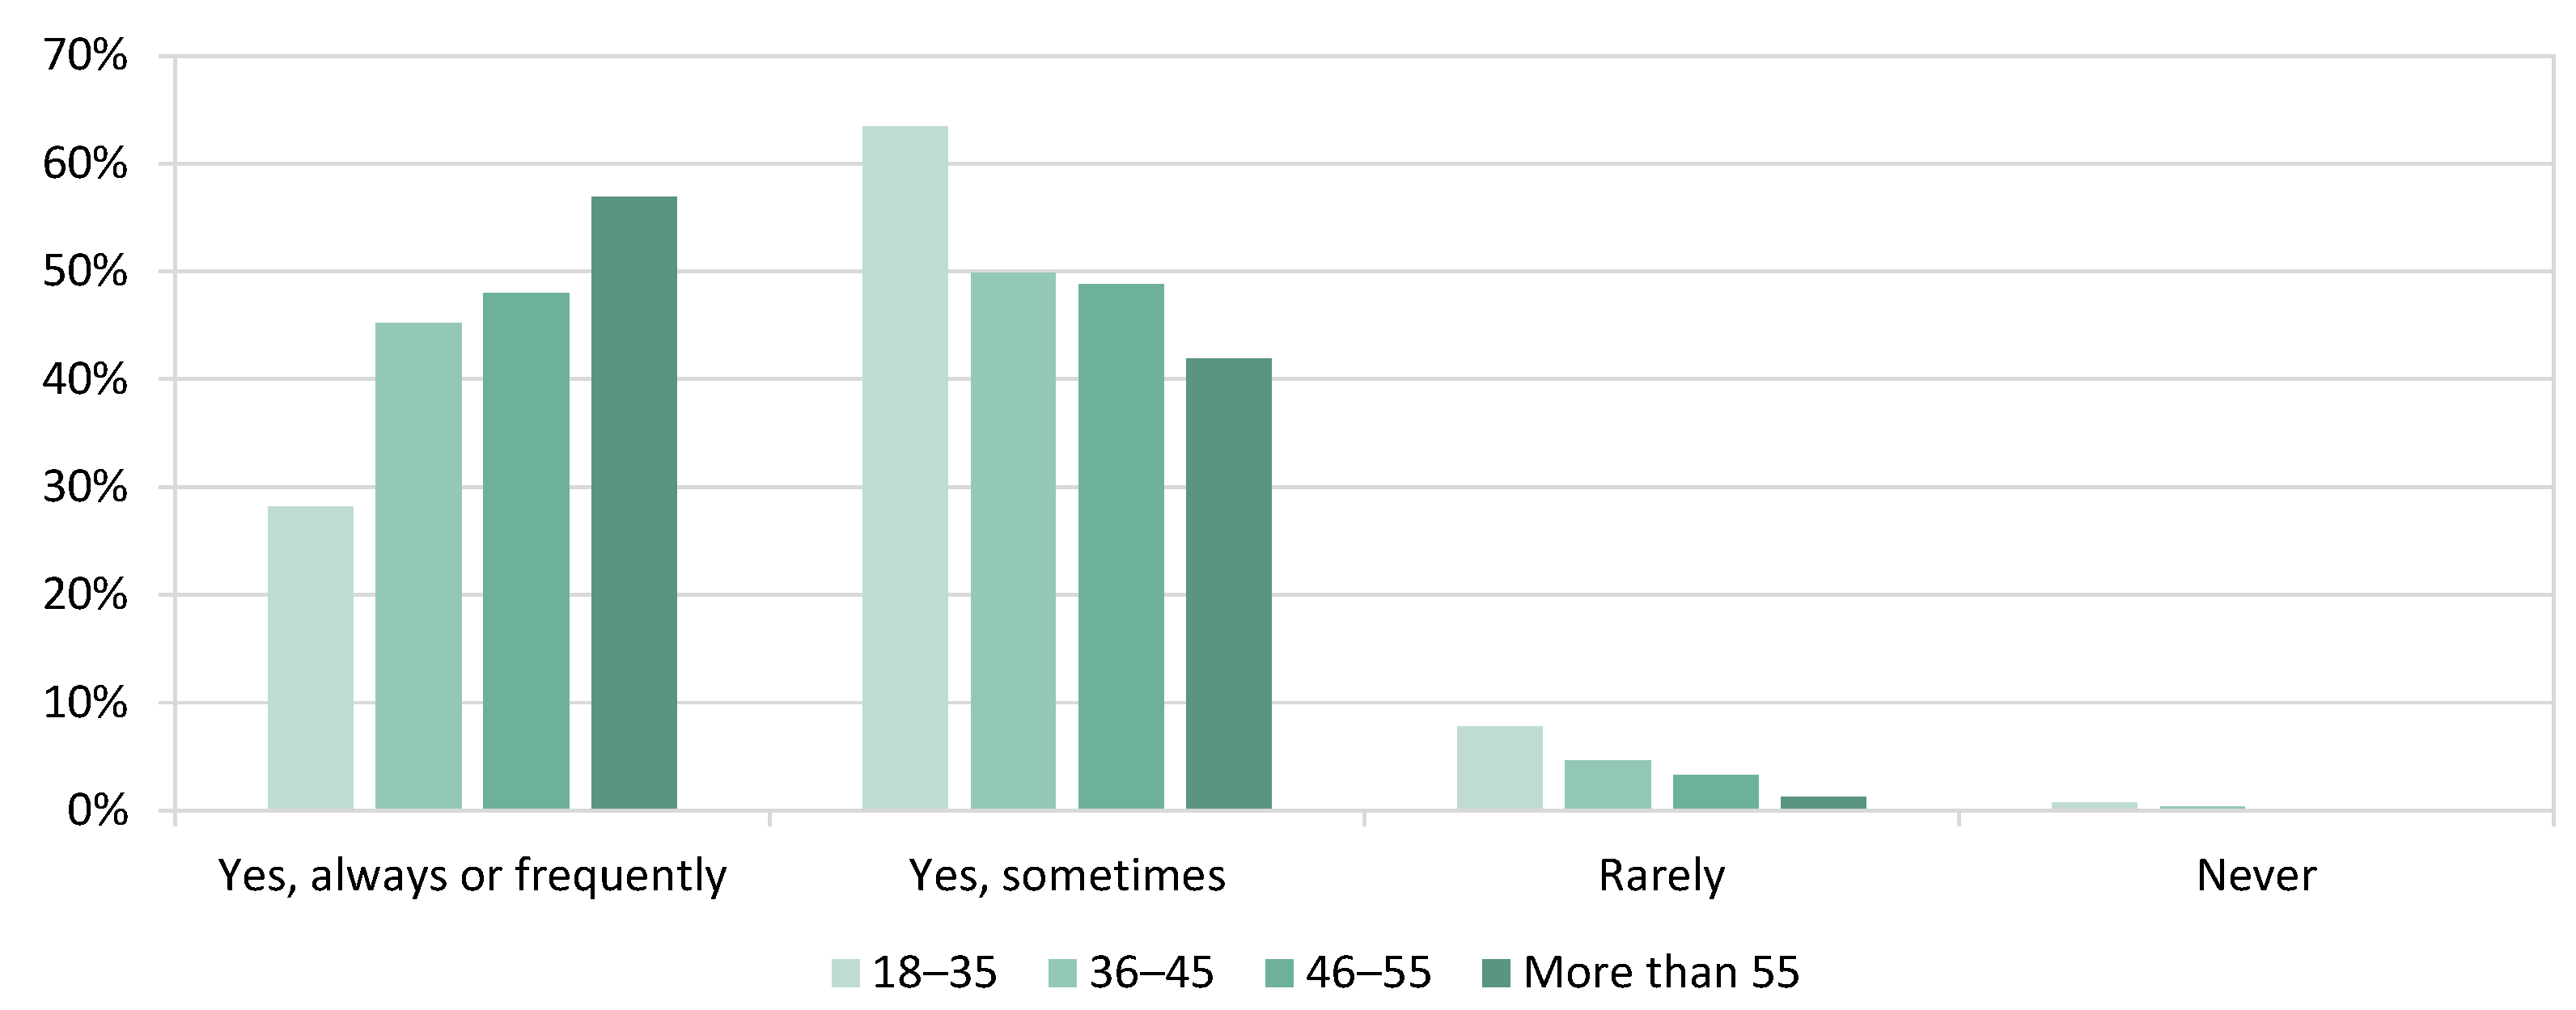
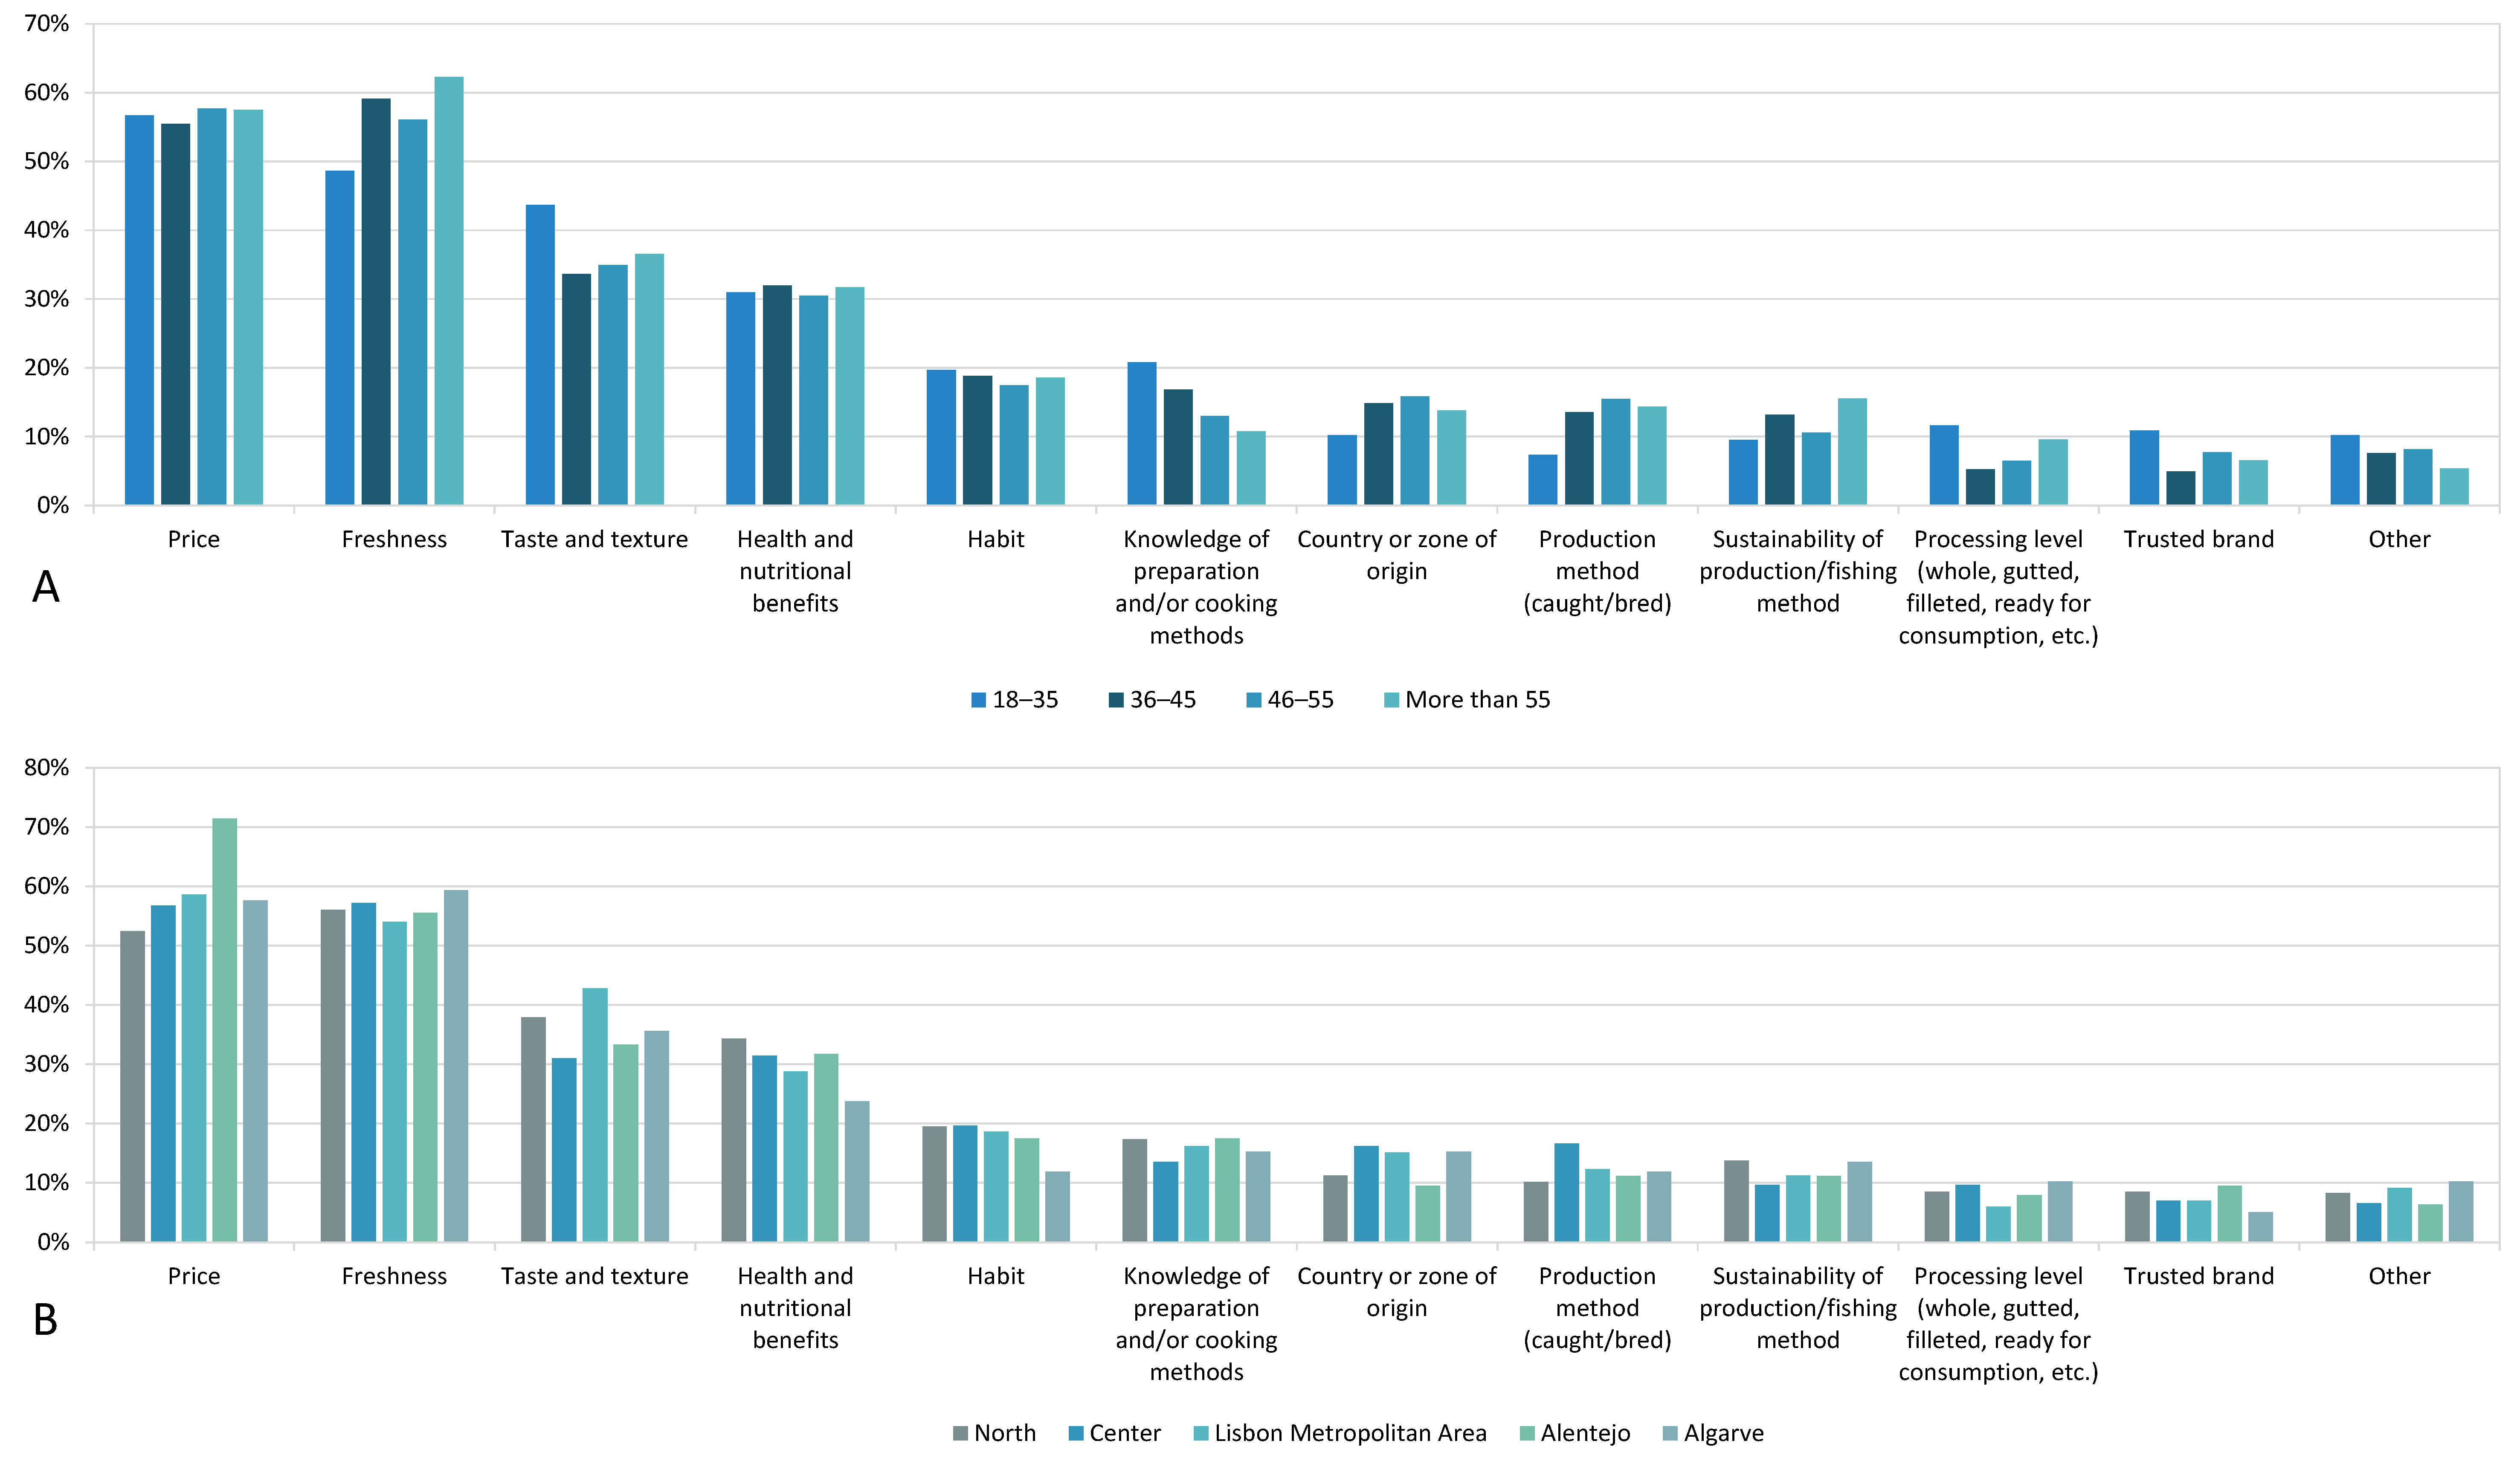
3.2. Consumer Survey Results

Results from the 1000 surveys (see Supplementary Materials for full details) show that age, and, to a lesser extent, NUTS II region of residence, were the primary factors influencing the consumption of fish and seafood, and associated behaviors and preferences. Overall, this food is strongly present in the Portuguese diet, with 89% of survey respondents eating fish and seafood at least once per week. We found a significant relationship between age and the frequency of fish and seafood consumption in Portugal (p = 0.004), with gender (p = 0.56), NUTS II region of residence (p = 0.93), distance from the coast (p = 0.54), education (p = 0.18), and family structure (p = 0.06) having no significant relationship. Survey respondents aged 55 and over reported that they ate fish and seafood “almost every day” at nearly double the rate than the other age groups in the survey.
Survey respondents had a strong preference for purchasing fish and seafood at the supermarket, with 77% selecting this option as the main place they purchase it (Figure 6). We found a significant relationship between region of residence and place of purchase of fish and seafood (p < 0.001), with survey respondents from the North region purchasing more fish and seafood at specialized markets than expected from the chi-square test, and respondents from the Algarve region purchasing more fish and seafood at local markets than expected (Figure 6).
When asked about the assortment of fresh fish and seafood available at the store where survey participants buy their food most often, the majority thought the assortment was “quite broad” (69%), followed by “very reduced” (19%), and “very broad” (9%). We found a significant relationship between age and perception of fish and seafood assortment (p = 0.002), with more survey respondents aged 55 and over finding the assortment to be “quite broad”, and more respondents aged 18–35 selecting “very reduced”.
Survey respondents consumed a wide variety of fish and seafood, with 59% selecting “sea bass, sea bream, cod, and snapper” as the main species they purchase, followed by “tuna, swordfish, and salmon” (22%), “sardine, anchovies, and herrings” (8%), “squid, cuttlefish, and octopus” (7%), “lobster, crabs, and prawns” (2%), and “scallops, mussels, and clams” (0.4%), with 3% responding “other”. We found significant relationships between the types of fish and seafood purchased and age (p = 0.035) and geographic area (p = 0.013) (Figure 7). Survey respondents aged 55 and over bought more “sea bass, sea bream, cod, and snapper” than any other age group, while respondents aged 18–35 bought more “tuna, swordfish, and salmon” than any other age group (Figure 7a). There were also regional differences in the types of fish and seafood purchased, with Algarve purchasing less “tuna, swordfish, and salmon” than the other regions, and Algarve and the North regions purchasing more “sardines, anchovies, and herring” than the other regions (Figure 7b).
Survey respondents preferred purchasing fresh fish and seafood (84%), with 15% preferring to purchase these products frozen, and 1% preferring canned. There were no significant relationships between any of the demographic factors and preference for fresh, frozen, or canned fish and seafood.
Survey participants displayed a curiosity toward different types of fish and seafood than what they typically consume, but this did not always result in a purchase of unfamiliar food. A total of 43% of survey respondents reported that they “always or frequently” look if there are different types of fish from those they usually buy when purchasing seafood, with 52% responding “sometimes”, 6% responding “rarely”, and only 0.3% selecting “never”. However, only 7% of survey respondents indicated that they “frequently” try fish and seafood that is new or unfamiliar to them, with 47% responding “sometimes”, 44% responding “rarely”, and 3% selecting “never”. There was a very significant relationship between age and curiosity towards different types of fish (p < 0.001), with older people showing a higher degree of curiosity than younger people (Figure 8), and a significant relationship between age and frequency of consumption of unfamiliar fish and seafood (p = 0.04), with the youngest age group purchasing unfamiliar food less frequently than all other age groups.
When asked why survey respondents do not taste new or unfamiliar fish and seafood, 56% selected “high price”, 43% selected “unknown flavor”, 40% said it was because they did not know how to cook or prepare that type of food, 25% selected “uninviting and/or unappetizing aspect”, 16% did not try the unfamiliar product due to the origin of the food, 9% had no interest in tasting new products, 9% did not want to try new fish and seafood due to the production method (e.g., wild caught, farm-raised), and 7% selected “I do not use that type of fish in my culture/community”, with 1% having other reasons for not trying unfamiliar fish and seafood. Interestingly, younger people were more concerned about unknown flavor and unappetizing aspects, while older survey respondents were more concerned about origin and production method (Figure 9).
More than half of survey respondents indicated that price (57%) and freshness (56%) were important factors when shopping for fish and seafood, followed by taste and texture (37%), health and nutritional benefits (31%), habit (19%), knowledge of preparation and/or cooking methods (16%), country or zone of origin (14%), production method (12%), sustainability of production and/or fishing method (12%), level of processing of fish upon purchase (e.g., whole, gutted, filleted, ready for consumption) (8%), and purchasing a trusted brand (8%), with 8% selecting other reasons (Figure 10). A greater percent of survey respondents aged 55 and over selected “freshness” relative to other age groups, while a greater percentage of respondents aged 18–35 selected “taste and texture” and “knowledge of preparation and/or cooking methods” compared to other age groups. While survey respondents from all regions in Portugal generally shared similar perceptions about important factors when shopping for fish and seafood, a much greater percentage of survey respondents from the Alentejo region selected price as an important factor (71%) compared to other regions.
Survey participants had mixed responses as to what they believe to be the primary element that defines sustainable fishing practices, with 26% selecting “seasonality”, followed by 20% selecting “healthy fish populations”, 15% selecting “fishing practices and gear that do not damage the environment”, 13% selecting “minimizing unwanted catch of endangered species”, 6% selecting “supports the local economy”, 5% selecting “fishers that are actively and locally involved in resource management”, 9% selecting other reasons, and 6% stating that they did not know enough about sustainable fishing to answer the question (Figure 11). There were no significant relationships between demographic factors and perceptions about what defines sustainable fishing.
The majority of survey respondents (67%) stated they would like to be informed while shopping for sustainable fish and seafood through information on the label, packaging, or tag of the food. Only 2% of survey respondents indicated that they do not want to be informed about sustainable fish and seafood products. There was a significant relationship between age and medium of sustainability information (p = 0.02), with 33% more respondents aged 18–35 stating they would like to be informed via an “app downloadable on the phone with which you can calculate the sustainability of the products” than expected, with 20% less respondents aged 55 and over selecting this option than expected. Interestingly, 30% more survey respondents aged 55 and over selected a “QR code on the label or tag that leads to information on sustainability” than expected.
When asked about awareness of different fishing methods, the majority of survey respondents (71%) had heard of small-scale fisheries, but few (7%) felt like they were very informed about them. Survey participants aged 55 and over were the most aware of small-scale fisheries, with 86% indicating they had heard of small-scale fisheries, while survey participants aged 18–35 were the least aware, with 50% indicating they had heard of small-scale fisheries. Most survey respondents (61%) perceived small-scale fisheries to be more sustainable than large-scale fisheries. After being shown the definition of “small-scale fisheries”, (definition provided in survey: “Small-scale fisheries (SSFs) are fishing households, as opposed to commercial companies, who are self-employed fishers engaged in directly providing food for their household and communities using smaller vessels and relatively low-tech gear”) 91% of survey respondents indicated that they would consider purchasing a different type of fish if they knew that it was caught by artisanal small-scale fisheries rather than industrial large-scale fisheries, with survey respondents aged 55 and over selecting “very likely” more than any other age group (47%), and survey respondents aged 18–35 selecting that option the least (28%), though selecting “quite likely” more than any other age group (60%). Few survey participants selected “little likely” (8%) and “not likely” (2%).

4. Discussion

Compared to other countries in the Mediterranean region for which the main driver of the food Footprint is meat [32,37], our results confirm that Portugal is unique in that its food Footprint is driven by fish and seafood consumption (26%), motivating the urgent need to focus on alternative fish and seafood consumption behaviors and attitudes in Portugal, particularly given Portugal’s biocapacity deficit.
While the overall Ecological Footprint of Portugal has changed over time from 2011 to 2017, ranging from 3.67 to 4.10 gha per person (with an average of 3.93 gha per person), the country’s food Footprint has remained quite stable, ranging from 1.09 to 1.17 gha per person (with an average of 1.14 gha per person). This is unsurprising given that food is a basic human need and its consumption, and thus associated Footprint, is not that variable.
In addition, food consumption in Portugal, particularly fish and seafood, is deeply tied to history and culture. During the time of the Portuguese discoveries in the 15th and 16th Centuries, religion was one of the main drivers of fish consumption; the Catholic Church forbade meat meals for 170 days of the year [27]. The clergy associated fish consumption with the purification of the body and soul, a belief that endures to this day [27]. The religious influence, together with other important social and cultural drivers (e.g., culinary traditions, coastal communities’ relevance) [25], justifies the fact that, indeed, fish and seafood consumption is a widespread practice in Portugal. A total of 89% of survey respondents reported eating these foods at least once per week, with residents 55 and over eating them “almost every day” at nearly double the rate than other age groups. A 2012 Portuguese fish and seafood consumer study with similar demographics showed similar results: the frequency of fish and seafood consumption was on average three times per week [38].
In general, preferred species for consumption were in alignment with past studies ([25,27,38]). Cod (salted and dried) is one of the most consumed species (38% of the national fish demand), although it does not exist in Portuguese waters [38]. Preference for high trophic level fish species (e.g., Atlantic cod or skipjack tuna) contributes to Portugal’s high food Footprint [15,25,39], since the consumption of high trophic level fish species, alongside that of red meat, requires more energy, land displacement, and CO2 emissions than lower trophic level or plant-based foods [40]. Our study showed that the main species consumed in Portugal were “sea bass, sea bream, cod, and snapper”, followed by “tuna, swordfish and salmon”, with older residents showing a preference for the former, and younger residents favoring the latter. In line with past studies, our results also show that Portuguese consumers primarily eat high-trophic level fish species. The combination of frequent fish and seafood consumption and preference for Footprint-intensive, high trophic level species, such as tuna and cod, plays a role in making fish and seafood the primary driver of Portugal’s food Footprint.
Perceptions of health and nutrition have also played a role in fish and seafood consumption choices in Portugal. Between 2007 and 2015, several campaigns across EU Member States, including Portugal, were conducted to promote the consumption of fish products by raising awareness about the health and nutritional benefits [41]. Indeed, several studies show the benefits of fish, especially fatty fish, which contain numerous nutrients and vitamin D [26,42,43,44,45,46]. Health and nutritional benefits were selected among the most important factors when shopping for fish and seafood, with nearly one-third of survey respondents deeming this to be important. A study by [38] also concluded that Portuguese consumers seek healthy diets and perceive fish and seafood as a fundamental part of that, although recent studies have brought issues related to microplastics and heavy metals in fish and their impact on human health to the forefront [47,48,49,50].
Moreover, 91% of the assessed fish stocks in the Mediterranean Sea are beyond safe biological limits [28]. Although the situation is better in the North-East Atlantic Ocean, where Portuguese consumers do source much of their fish and seafood, consumer campaigns that promote the consumption of these food products without careful consideration of environmental factors, such as high stock depletion, are problematic for ecosystem health and biodiversity conservation.
Past consumer campaigns in Portugal also sought to bolster local fishery products by encouraging the consumption of “underutilized” regional species to stimulate regional economic development [41]. This is important to diversify the basket of fish and seafood products, but consideration of local stock depletion is key, as even a local mid-trophic level species like sardines, which is integral to the Portuguese diet and culture, has seen its population plummet in recent years [51]. Our study showed that one in seven Portuguese indicated that country or zone of origin is an important factor when shopping for fish and seafood, with one in six refusing to purchase unfamiliar products due to the origin of the fish and seafood, particularly among residents aged 55 and over. Moreover, nine in ten residents indicated that they would consider purchasing different types of fish and seafood if they knew that they were caught by a local small-scale fishery rather than by an industrial large-scale fishery.
However, consumer campaigns still have a way to go to promote sustainable fish and seafood consumption habits. Similarly to past studies, sustainability awareness did not significantly influence consumption choices. “Sustainability” was only selected by one in ten Portuguese as a factor influencing fish and seafood consumption. Indeed, in Portugal, consumer choices are not often related to environmentally friendly actions. Portuguese consumers have the lowest purchase percentage of eco-labelled products within Europe [52,53]. Despite the efforts of some supermarket chains and restaurants to commit to offering more sustainable fish and seafood, indicated through eco-labels, the impacts of these practices are low due to the poor level of awareness of consumers possibly due to the poor communication of information they receive [54,55,56]. Furthermore, [25] highlighted that the Portuguese are either not enough informed about fishery impacts on the ecosystems or have not connected ecosystem impacts to their purchase choices.
In addition to the low influence of “sustainability” on consumer choices, our study showed that the social and economic aspects of sustainability, such as fishers’ livelihoods and local economic development, scored the lowest when survey respondents were asked about the primary factors that define sustainable fish and seafood and fishing practices. This sheds light on the need to increase sustainable food system awareness beyond the environmental pillar of sustainability. For instance, [57], argued that fish and seafood consumption campaigns developed in Portugal over the last decade by different types of organizations (public, private for-profit and non-governmental) and pursuing different aims (e.g., some of them encouraging people to eat more fish as a way to improve health) may have confused consumers, since they use different messages, language, duration, and communication tools, and have short-lived effects.
Ref. [25] showed that Portuguese consumers are very interested in learning more about fish and seafood products, although catch method garnered the lowest amount of interest. Similar to [25], our study showed that the majority of Portuguese (67%) would like to be informed while shopping for fish and seafood through sustainability-related information on the food label, packaging, or tag. This aligns with previous studies pointing out that education and awareness can effectively be increased through outreach campaigns [27,41]. Moreover, only about 2% of respondents indicated that they do not want to be informed about sustainable fish and seafood products, suggesting the existence of a gap between stated behavior and actual behavior, a tendency that has been shown in past studies [58,59,60].
Altogether, results point to the critical need to target coordinated and long-term outreach strategies using customized messaging to different age groups, as this was the primary demographic factor influencing fish and seafood consumption habits in Portugal (Table 1).
For example, campaigns targeting older residents, who eat fish and seafood almost every day, could emphasize the health and nutritional benefits of diets that rely on plant-based cereals, legumes, and unprocessed fruits and vegetables. Conversely, younger residents with limited knowledge on how to prepare fish and seafood could be taught preparation techniques for low-trophic level species with healthy wild populations. Since survey respondents showed a preference for purchasing products from artisanal small-scaled fisheries, outreach could also focus on the origin of fish and seafood products, with education to younger residents about the origin and various production methods of such products.
Lastly, outreach should include the dissemination of information in supermarkets (e.g., certification schemes, labels), since that is where the majority of consumers source their fish and seafood, with some outreach in specialized markets in the North region and local markets in Algarve. Similar results were found in [27], where Portuguese consumers prefer to purchase fish and seafood at supermarkets than local markets. In 2010, legislation was passed in Portugal to grant more flexible hours of operation for retail stores. After this change, supermarkets became the primary point of purchase of fish and seafood in Portugal [41].
Our study showed no significant relationships between level of education and any of the consumer habits and preferences. Proximity to the coast also had no significant impact on consumer choices. One shortcoming of our research approach was the lack of options for “family structure”, making it not possible to measure if living with children had any impact on consumer choices. Other limitations of this study are related to the fact that the sample does not accurately represent the Portuguese population structure. Furthermore, online surveys can bring some limitations from the fact persons who are literate or who have access to the internet are more prone to be part of the sample than others, as well as those who are sufficiently biased to be interested in the subject [61]. A hybrid data collection approach to a representative sample of the Portuguese population could further refine results.

5. Conclusions

The main findings of this study define a situation in which: (1) Portugal food Footprint is driven by the consumption of “Fish and Seafood” (26%), which is in turn due to a high frequency of consumption and a preference for high trophic level species; (2) fish and seafood purchasing is mainly conducted at supermarkets; (3) fish and seafood are perceived as key foods for health and nutrition; (4) sustainability awareness does not significantly influence consumption choices; (5) social and economic aspects of sustainability, such as fisher livelihoods and local economic development, score poorly among the key factors for sustainable fish and seafood and fishing practices; and (6) most respondents would appreciate being informed while shopping for fish and seafood through sustainability-related information on the food label, packaging, or tags.
By switching to a diet with a lower Footprint intensity (i.e., lower consumption of animal-based proteins, diversification of the basket of fish and seafood products consumed with an increased share of low trophic level species, and more reliance on cereals, legumes, and unprocessed fruits and vegetables), Portugal could reduce its food Footprint by more than half [32], while also reducing its exposure to resource shortages or trade-related shocks. However, for this to happen, increased awareness campaigns and further incentives to change consumptions habit are needed.
Information campaigns, educational programs, or dietary guidelines for Portuguese citizens, marketing, media, or social media campaigns could be relevant, alongside fiscal measures and legislation innovation to change food consumption habits, with proper incentives and control, or better governance structures (e.g., national commission or working groups for the promotion of fish and seafood sustainability) for a long-term systemic change, as suggested by previous studies [57,62].
These actions could reduce the Ecological Footprint of food in Portugal, while also creating a resilient national food system that is less exposed to resource shortages and trade-related shocks. However, care must be taken to ensure that efforts to reduce food Footprints in Portugal are compatible with efforts to protect ecosystem health and biodiversity conservation by, for example, ensuring that campaigns do not favor lower trophic-level species that are overfished or in danger of being overfished, but rather foster the search for eco-labels and fish and seafood from sustainable, assessed, and well-managed stocks. Our results also call for the need to increase sustainable food system awareness beyond the sole environmental pillar of sustainability, and enforce the social and economic conditions of small-scale fisheries.
Finally, to address a more sustainable fish and seafood system in Portugal, policies and future research must address not only consumers, but also the whole chain of relevant stakeholders, from fishermen and their associations, to industry and producers’ organizations, from importers, retailers, markets to consumers’ organizations, or from scientists and NGOs to decision-makers. They must involve different sectors, from fish and seafood itself to the health, tourism, education, and environment sectors.

Supplementary Materials

Full survey answers, consisting of 29 Excel tables, can be downloaded at: https://www.mdpi.com/article/10.3390/su15021363/s1.

Author Contributions

Conceptualization, A.M., A.G. and S.M.P.; methodology, A.M., A.G. and S.M.P.; validation, A.G. and S.M.P.; formal analysis, A.M. and C.M.; investigation, A.M., A.G., C.M. and S.M.P.; resources, A.M., A.G., C.M. and S.M.P.; data curation, A.M., and A.G.; writing—original draft preparation, A.M., A.G. and S.M.P.; writing—review and editing, A.G. and S.M.P.; visualization, A.G. and S.M.P.; supervision, A.G. and S.M.P.; project administration, A.G.; funding acquisition, A.G. All authors have read and agreed to the published version of the manuscript.

Funding

This research was funded by MAVA Foundation pour la Nature, grant number 17077. This work was also supported by the Research Unit on Governance, Competitiveness and Public Policies (UIDB/ 04058/2020) + (UIDP/ 04058/2020) of the national funds through the Foundation for Science and Technology, IP through the Foundation for Science and Technology, IP.

Informed Consent Statement

Not applicable.

Data Availability Statement

Detailed Footprint data is available upon request to the authors.

Acknowledgments

We would like to acknowledge MAVA Foundation pour la Nature (Grant No. 17077) for its support to Global Footprint Network’s project “Application and incorporation of Ecological Footprint to support sustainable artisanal seafood commodity markets”. Thanks are also due to Katsunori Iha and Maria Serena Mancini, for their help with the Footprint assessment, and to Selen Altiok for her help with the consumer survey development. We would like to also thank Paulo Magalhães from ZERO—Associação Sistema Terreste Sustentável, for his support to the project.

Conflicts of Interest

The authors declare no conflict of interest.

References

  1. Borucke, M.; Moore, D.; Cranston, G.; Gracey, K.; Iha, K.; Larson, J.; Lazarus, E.; Morales, J.C.; Wackernagel, M.; Galli, A. Accounting for demand and supply of the biosphere’s regenerative capacity: The National Footprint Accounts’ underlying methodology and framework. Ecol. Indic. 2012, 24, 518–533. [Google Scholar] [CrossRef]
  2. Daly, H.E. Toward some operational principles of sustainable development. In The Economics of Sustainability; Routledge: London, UK, 2017; pp. 97–102. [Google Scholar] [CrossRef]
  3. Coscieme, L.; Mortensen, L.F.; Anderson, S.; Ward, J.; Donohue, I.; Sutton, P. Going beyond Gross Domestic Product as an indicator to bring coherence to the Sustainable Development Goals. J. Clean. Prod. 2019, 248, 119232. [Google Scholar] [CrossRef]
  4. Hickel, J. The contradiction of the sustainable development goals: Growth versus ecology on a finite planet. Sustain. Dev. 2019, 27, 873–884. [Google Scholar] [CrossRef]
  5. Brundtland, G.H. Report of the World Commission on Environment and Development: Our Common Future; UN: New York, NY, USA, 1987. [Google Scholar]
  6. Ewing, B.R.; Hawkins, T.R.; Wiedmann, T.O.; Galli, A.; Ercin, A.E.; Weinzettel, J.; Steen-Olsen, K. Integrating ecological and water footprint accounting in a multi-regional input–output framework. Ecol. Indic. 2012, 23, 1–8. [Google Scholar] [CrossRef] [Green Version]
  7. Galli, A. Footprints. In Oxford Bibliographies; Environmental Science Oxford University Press: New York, NY, USA, 2015. [Google Scholar]
  8. Rees, W.E. Ecological footprints and appropriated carrying capacity: What urban economics leaves out. Environ. Urban. 1992, 4, 121–130. [Google Scholar] [CrossRef]
  9. Wackernagel, M.; Rees, W. Our Ecological Footprint: Reducing Human Impact on the Earth; New Society Publishers: Gabriola Island, BC, Canada, 1998; Volume 9. [Google Scholar]
  10. Lin, D.; Hanscom, L.; Murthy, A.; Galli, A.; Evans, M.; Neill, E.; Mancini, M.S.; Martindill, J.; Medouar, F.-Z.; Huang, S.; et al. Ecological Footprint Accounting for Countries: Updates and Results of the National Footprint Accounts, 2012–2018. Resources 2018, 7, 58. [Google Scholar] [CrossRef] [Green Version]
  11. Mancini, M.S.; Galli, A.; Coscieme, L.; Niccolucci, V.; Lin, D.; Pulselli, F.M.; Bastianoni, S.; Marchettini, N. Exploring ecosystem services assessment through Ecological Footprint accounting. Ecosyst. Serv. 2018, 30, 228–235. [Google Scholar] [CrossRef]
  12. Sterner, T.; Barbier, E.B.; Bateman, I.; Bijgaart, I.V.D.; Crépin, A.-S.; Edenhofer, O.; Fischer, C.; Habla, W.; Hassler, J.; Johansson-Stenman, O.; et al. Policy design for the Anthropocene. Nat. Sustain. 2019, 2, 14–21. [Google Scholar] [CrossRef]
  13. Collins, A.; Flynn, A. The Ecological Footprint: New Developments in Policy and Practice; Edward Elgar Publishing: Cheltenham, UK, 2015. [Google Scholar]
  14. Pearson, L.J. In search of resilient and sustainable cities: Prefatory remarks. Ecol. Econ. 2013, 86, 222–223. [Google Scholar] [CrossRef]
  15. Galli, A.; Moreno Pires, S.; Iha, K.; Alves, A.A.; Lin, D.; Mancini, M.S.; Teles, F. Sustainable food transition in Portugal: Assessing the Footprint of dietary choices and gaps in national and local food policies. Sci. Total. Environ. 2020, 749, 141307. [Google Scholar] [CrossRef]
  16. Guillen, J.; Natale, F.; Carvalho, N.; Casey, J.; Hofherr, J.; Druon, J.N.; Fiore, G.; Gibin, M.; Zanzi, A.; Martinsohn, J.T. Global seafood consumption footprint. Ambio 2019, 48, 111–122. [Google Scholar] [CrossRef] [Green Version]
  17. European Market Observatory for Fisheries and Aquaculture Products (EUMOFA). The EU Fish Market. 2021. Available online: https://ec.europa.eu/oceans-and-fisheries/news/eu-fish-market-2021-edition-now-online-2021-11-22_en (accessed on 10 October 2022).
  18. Leitão, F.; Baptista, V.; Zeller, D.; Erzini, K. Reconstructed catches and trends for mainland Portugal fisheries between 1938 and 2009: Implications for sustainability, domestic fish supply and imports. Fish. Res. 2014, 155, 33–50. [Google Scholar] [CrossRef]
  19. EUROSTAT. Catches in All Fishing Regions; EUROSTAT: Luxembourg, 2022. [Google Scholar]
  20. Food and Agriculture Organization of the United Nations (FAO). World Fisheries and Aquaculture; FAO: Rome, Italy, 2020. [Google Scholar]
  21. Altintzoglou, T.; Vanhonacker, F.; Verbeke, W.; Luten, J. Association of health involvement and attitudes towards eating fish on farmed and wild fish consumption in Belgium, Norway and Spain. Aquac. Int. 2010, 19, 475–488. [Google Scholar] [CrossRef] [Green Version]
  22. Hicks, D.; Pivarnik, L.; McDermott, R. Consumer perceptions about seafood—An Internet survey. J. Foodserv. 2008, 19, 213–226. [Google Scholar] [CrossRef]
  23. van Dijk, H.; Fischer, A.R.H.; Honkanen, P.; Frewer, L.J. Perceptions of health risks and benefits associated with fish consumption among Russian consumers. Appetite 2011, 56, 227–234. [Google Scholar] [CrossRef]
  24. Pieniak, Z.; Verbeke, W.; Scholderer, J.; Brunsø, K.; Olsen, S.O. European consumers’ use of and trust in information sources about fish. Food Qual. Prefer. 2007, 18, 1050–1063. [Google Scholar] [CrossRef]
  25. Almeida, C.; Altintzoglou, T.; Cabral, H.; Vaz, S. Does seafood knowledge relate to more sustainable consumption? Br. Food J. 2015, 117, 894–914. [Google Scholar] [CrossRef]
  26. Cardoso, C.; Lourenço, H.; Costa, S.; Gonçalves, S.; Nunes, M.L. Survey into the seafood consumption preferences and patterns in the portuguese population. Gender and regional variability. Appetite 2013, 64, 20–31. [Google Scholar] [CrossRef]
  27. Madsen, A.O.; Chkoniya, V. Fish Consumption in the Age of the Information Society—The Evolution of the Fish Sector in Portugal. Eur. J. Soc. Sci. 2019, 2, 36. [Google Scholar] [CrossRef]
  28. European Environment Agency. Status of Marine Fish and Shellfish Stocks in European Seas (Indicator Assessment); European Environment Agency: Copenhagen, Denmark, 2021. [Google Scholar]
  29. Stiasny, M.H.; Sswat, M.; Mittermayer, F.H.; Falk-Petersen, I.; Schnell, N.K.; Puvanendran, V.; Mortensen, A.; Reusch, T.B.H.; Clemmesen, C. Divergent responses of Atlantic cod to ocean acidification and food limitation. Glob. Chang. Biol. 2018, 25, 839–849. [Google Scholar] [CrossRef] [Green Version]
  30. Turner, K.; Lenzen, M.; Wiedmann, T.; Barrett, J. Examining the global environmental impact of regional consumption activities—Part 1: A technical note on combining input–output and ecological footprint analysis. Ecol. Econ. 2007, 62, 37–44. [Google Scholar] [CrossRef]
  31. Weinzettel, J.; Steen-Olsen, K.; Hertwich, E.G.; Borucke, M.; Galli, A. Ecological footprint of nations: Comparison of process analysis, and standard and hybrid multiregional input–output analysis. Ecol. Econ. 2014, 101, 115–126. [Google Scholar] [CrossRef]
  32. Galli, A.; Iha, K.; Halle, M.; El Bilali, H.; Grunewald, N.; Eaton, D.; Capone, R.; Debs, P.; Bottalico, F. Mediterranean countries’ food consumption and sourcing patterns: An Ecological Footprint viewpoint. Sci. Total Environ. 2017, 578, 383–391. [Google Scholar] [CrossRef] [PubMed] [Green Version]
  33. Global Footprint Network YU. National Footprint and Biocapacity Accounts. 2020. Available online: http://www.footprintnetwork.org (accessed on 4 June 2020).
  34. Aguiar, A.; Chepeliev, M.; Corong, E.L.; McDougall, R.; Van Der Mensbrugghe, D. The GTAP Data Base: Version 10. J. Glob. Econ. Anal. 2019, 4, 1–27. [Google Scholar] [CrossRef] [Green Version]
  35. GTAP10. GTAP Data Bases: GTAP 10 Data Base. Available online: https://www.gtap.agecon.purdue.edu/databases/v10/index.aspx (accessed on 4 June 2020).
  36. United Nations Statistics Division. Classification of Individual Consumption According to Purpose (COICOP); Department of Economic and Social Affairs, Statistical Papers Series M No 99.: New York, NY, USA, 2018. [Google Scholar]
  37. Altiok, S.; Murthy, A.; Iha, K.; Galli, A. Reducing Mediterranean Seafood Footprints: The role of consumer attitudes. Ocean Coast. Manag. 2021, 214, 105915. [Google Scholar] [CrossRef]
  38. Almeida, C.; Karadzic, V.; Vaz, S. The seafood market in Portugal: Driving forces and consequences. Mar. Policy 2015, 61, 87–94. [Google Scholar] [CrossRef] [Green Version]
  39. Grunewald, N.; Galli, A.; Katsunori, I.; Halle, M.; Gressot, M. The Ecological Footprint of Mediterranean Diets; International Center for Advanced Mediterranean Agronomic Studies: Paris, France, 2015. [Google Scholar]
  40. Clune, S.; Crossin, E.; Verghese, K. Systematic review of greenhouse gas emissions for different fresh food categories. J. Clean. Prod. 2017, 140, 766–783. [Google Scholar] [CrossRef] [Green Version]
  41. European Commission. EU Consumer Habits Regarding Fishery and Aquaculture Products; European Commission: Luxembourg, 2017. [Google Scholar]
  42. da Silva, D.L.F.; da Costa, M.A.P.; Silva, L.O.B.; dos Santos, W.N.L. Simultaneous determination of mercury and selenium in fish by CVG AFS. Food Chem. 2019, 273, 24–30. [Google Scholar] [CrossRef]
  43. Harrison, M.T.; McFarlane, S.; Harden, R.M.; Wayne, E. Nature and Availability of Iodine in Fish. Am. J. Clin. Nutr. 1965, 17, 73–77. [Google Scholar] [CrossRef] [Green Version]
  44. ISSFAL. Recommendations for Intake of Polyunsaturated Fatty Acids in Healthy Adults. International Society for the Study of Fatty Acids and Lipids; ISSFAL: Washington, DC, USA, 2004. [Google Scholar]
  45. Shomrony, A. Fish farming in ponds and lakes to provide an important protein supplement to the food basked and connected public health problems. Ann. Ist. Super. Sanità 1978, 14, 245–250. [Google Scholar]
  46. van Hecke, T.; Goethals, S.; Vossen, E.; de Smet, S. Long-chain n-3 PUFA content and n-6/n-3 PUFA ratio in mammal, poultry, and fish muscles largely explain differential protein and lipid oxidation profiles following in vitro gastrointestinal digestion. Mol. Nutr. Food Res. 2019, 63, 1900404. [Google Scholar] [CrossRef]
  47. Carpenter, E.J.; Anderson, S.J.; Harvey, G.R.; Miklas, H.P.; Peck, B.B. Polystyrene Spherules in Coastal Waters. Science 1972, 178, 749–750. [Google Scholar] [CrossRef]
  48. Foekema, E.M.; De Gruijter, C.; Mergia, M.T.; van Franeker, J.A.; Murk, A.J.; Koelmans, A.A. Plastic in North Sea Fish. Environ. Sci. Technol. 2013, 47, 8818–8824. [Google Scholar] [CrossRef]
  49. Phillips, M.B.; Bonner, T.H. Occurrence and amount of microplastic ingested by fishes in watersheds of the Gulf of Mexico. Mar. Pollut. Bull. 2015, 100, 264–269. [Google Scholar] [CrossRef]
  50. Wang, W.; Ge, J.; Yu, X. Bioavailability and toxicity of microplastics to fish species: A review. Ecotoxicol. Environ. Saf. 2019, 189, 109913. [Google Scholar] [CrossRef]
  51. Monteiro, P.V. The purse seine fishing of sardine in Portuguese waters: A difficult compromise between fish stock sustainability and fishing effort. Rev. Fish. Sci. Aquac. 2017, 25, 218–229. [Google Scholar] [CrossRef]
  52. Finisterra do Paço, A.M.; Raposo, M.L.B. Green consumer market segmentation: Empirical findings from Portugal. Int. J. Consum. Stud. 2010, 34, 429–436. [Google Scholar] [CrossRef]
  53. Koos, S. Varieties of Environmental Labelling, Market Structures, and Sustainable Consumption Across Europe: A Comparative Analysis of Organizational and Market Supply Determinants of Environmental-Labelled Goods. J. Consum. Policy 2011, 34, 127–151. [Google Scholar] [CrossRef] [Green Version]
  54. James, R.; Archer, M.; Henderson, J.; Garrett, A. Resource Maps for Fish across Retail and Wholesale Supply Chains Project; WRAP report, WRAP: Oxon, UK, 2011. [Google Scholar]
  55. Jonell, M.; Phillips, M.; Rönnbäck, P.; Troell, M. Eco-certification of farmed seafood: Will it make a difference? Ambio 2013, 42, 659–674. [Google Scholar] [CrossRef]
  56. Mitchell, M. Increasing Fish Consumption for Better Health–Are We Being Advised to Eat More of an Inherently Unsustainable Protein? Wiley Online Library: Hoboken, NJ, USA, 2011. [Google Scholar]
  57. Trigo, M.I. How to promote sustainable seafood consumption in Portugal? An overview with campaigns as a starting point. Public Policy Port. J. 2021, 6, 56–76. [Google Scholar]
  58. Berger, S.; Kilchenmann, A.; Lenz, O.; Schlöder, F. Willingness-to-pay for carbon dioxide offsets: Field evidence on revealed preferences in the aviation industry. Glob. Environ. Chang. 2022, 73, 102470. [Google Scholar] [CrossRef]
  59. Carrington, M.J.; Neville, B.A.; Whitwell, G.J. Why Ethical Consumers Don’t Walk Their Talk: Towards a Framework for Understanding the Gap Between the Ethical Purchase Intentions and Actual Buying Behaviour of Ethically Minded Consumers. J. Bus. Ethic- 2010, 97, 139–158. [Google Scholar] [CrossRef]
  60. Carrington, M.J.; Neville, B.A.; Whitwell, G.J. Lost in translation: Exploring the ethical consumer intention–behavior gap. J. Bus. Res. 2014, 67, 2759–2767. [Google Scholar] [CrossRef]
  61. Andrade, C. The Limitations of Online Surveys. Indian J. Psychol. Med. 2020, 42, 575–576. [Google Scholar] [CrossRef]
  62. Matias, A. Shaping Portuguese choices towards more diverse, sustainable and local seafood consumption habits. Public Policy Port. J. 2021, 6, 77–94. [Google Scholar]
Figure 1. Flowchart of the top-down environmentally-extended multi-regional input-output (EE-MRIO) methodology used to calculate the Ecological Footprint of Portugal.
Sustainability 15 01363 g001
Figure 2. Socio-demographic characteristics of the Portuguese survey participants. * indicates predetermined quota.
Sustainability 15 01363 g002
Figure 3. The per capita Ecological Footprint by Footprint type (stacked columns) and biocapacity (dark green line) of Portugal from 2011 to 2017.
Sustainability 15 01363 g003
Figure 4. The per capita Ecological Footprint of Portugal by COICOP consumption category, with categories that are less than 0.10 global hectares per person (“Household furnishings, equipment and maintenance”; “Health”; “Communication”; and “Education”) and the “Miscellaneous goods and services” category grouped into “Other”.
Sustainability 15 01363 g004
Figure 5. The per capita Ecological Footprint of each subcategory of “Food and non-alcoholic beverages” by Footprint type in Portugal for the year 2014. “Food products n.e.c.” denotes food products not elsewhere classified.
Sustainability 15 01363 g005
Figure 6. Primary place of purchase of fish and seafood in each region.
Sustainability 15 01363 g006
Figure 7. Main types of fish and seafood purchased by (A) age group and (B) region of residence.
Sustainability 15 01363 g007
Figure 8. The frequency at which each age group looks for different types of fish and seafood than those they usually purchase.
Sustainability 15 01363 g008
Figure 9. Reasons for not tasting new or unfamiliar fish and seafood by age group.
Sustainability 15 01363 g009
Figure 10. Important factors when shopping for fish and seafood by (A) age and (B) region of residence.
Sustainability 15 01363 g010
Figure 11. Perceptions about what defines sustainable fishing across all survey respondents.
Sustainability 15 01363 g011
Table 1. Chi-square test results showing significant relationships between demographic factors and survey question responses, with p < 0.05 (left column of “Demographic Factors”) indicating a significant relationship and p < 0.001 (right column of “Demographic Factors”) indicating a very significant relationship.
Survey QuestionDemographic Factors
p < 0.05p < 0.001
On average, how often do you eat fish and seafood?Age
Where do you go most often to buy fish and seafood? Geographic area
How is the assortment of fresh fish in the place where you buy fish and seafood most often?Age
When you go to the place of your preference to buy fish and seafood, do you find everything you are looking for?Geographic area
Which types of fish and seafood do you buy most frequently?Age, Geographic area
When you buy fish and seafood, do you look if there are different types of fish from those you usually buy? Age
How often do you try fish and seafood that is new or unfamiliar to you?Age
How would you like to be informed while shopping for sustainable fish and seafood?Age
Have you ever heard about artisanal small-scale fisheries? Age
How informed are you about artisanal small-scale fisheries? Gender
Would you consider purchasing a different fish and seafood if you knew it was caught by artisanal small-scale fisheries rather than by industrial large-scale fisheries?Age
Disclaimer/Publisher’s Note: The statements, opinions and data contained in all publications are solely those of the individual author(s) and contributor(s) and not of MDPI and/or the editor(s). MDPI and/or the editor(s) disclaim responsibility for any injury to people or property resulting from any ideas, methods, instructions or products referred to in the content.

