
Synergistic Evolution of China’s Green Economy and Digital Economy Based on LSTM-GM and Grey Absolute Correlation

Abstract
:1. Introduction
2. Literature Review
2.1. Green Economy
2.2. Digital Economy
2.3. The Relationship between Green Economy and Digital Economy
- The impact of the digital economy on green productivity and carbon emissions: Researchers have studied the effects of the digital economy on China’s green total factor productivity (GTFP) or green total factor efficiency (GTFEE) and carbon emissions. The results show that the digital economy significantly impacts green productivity and carbon emissions in China. However, the direction and magnitude of the impact depend on the development stage of the digital economy [18,32,44].
- The impact of the digital economy on green innovation: Researchers have utilized patent data and other sources of green innovation data to examine the direct and indirect effects. These studies show that the digital economy affects green innovation through various channels, such as economic openness, industrial structure, and market potential [45,46].
- The impact of the digital economy on green growth: Studies have shown that the digital economy has a positive impact on green growth in China. However, this impact is not uniform or consistent. Studies also show that the digital economy affects green growth through various factors, such as human capital, industrial structure upgrading, energy consumption, environmental pollution, and economic growth [47,48,49].
- Impact of the digital economy on sustainability: Several studies highlight the profound impact of the digital economy on sustainability. Savchenko introduces a typology of sustainable development goals (SDGs) that provides a framework for sustainable urban development via digital solutions [53]. Alenkova delves into eco-innovations in production enterprises, demonstrating how the digital economy fosters innovative green practices [54]. Piao emphasizes the D2D effect, showcasing the synergistic benefits of addressing cross-sectoral sustainability challenges through digital solutions [55]. Nurova argues that the digital economy’s reduced energy consumption inherently contributes to sustainability [56]. These findings collectively underscore the transformative potential of the digital economy in promoting sustainability.
- Urban sustainability and the digital economy: Delitheou highlights cities’ pivotal role in enhancing citizens’ lives through technology and green growth [57]. The study emphasizes the importance of urban areas in bridging the gap between the digital and green economies. Xing discusses regional strategies for accelerating digital economy development while promoting innovation and green growth, showcasing the regional dimension of this relationship [58]. This research illuminates the urban context as a nexus for digital and green economy interactions.
- Economic transformations and sustainability: Ciuriak examines the global economic impact of the pandemic and its repercussions for traditional and digital trade, underscoring the evolving landscape of sustainability in a rapidly changing economic environment [59]. These studies underscore the dynamic nature of sustainability within evolving economic frameworks.
- Knowledge spillovers, innovation, and sustainability: Aldieri and colleagues offer valuable insights into the role of knowledge spillovers, innovation, and environmental considerations in achieving sustainability goals. Their work demonstrates the interconnectedness of knowledge sharing and sustainable development [60,61,62,63,64,65].
- Environmental considerations in trade and industry: Llop analyzes the welfare effects of taxing polluting export goods, providing insights into the trade-offs between economic growth and environmental sustainability [36]. Zafar investigates how biomass energy consumption impacts environmental quality, emphasizing education and technology as key factors [66]. These studies contribute to our understanding of the economic–environmental dynamics in specific sectors and regions.
- Carbon emissions and economic interactions: Xu explores spillover effects and correlations between carbon emissions and stock markets [67], while Zhen examines variations in carbon emissions in China’s exports [68]. These studies offer insights into the complex relationships between carbon emissions and economic activities in a carbon-intensive context.
3. Model Construction
3.1. TOPSIS Comprehensive Evaluation Model
3.2. LSTM-GM Prediction Model
3.3. Grey Absolute Correlation Model
4. Empirical Research
4.1. Indicator Construction
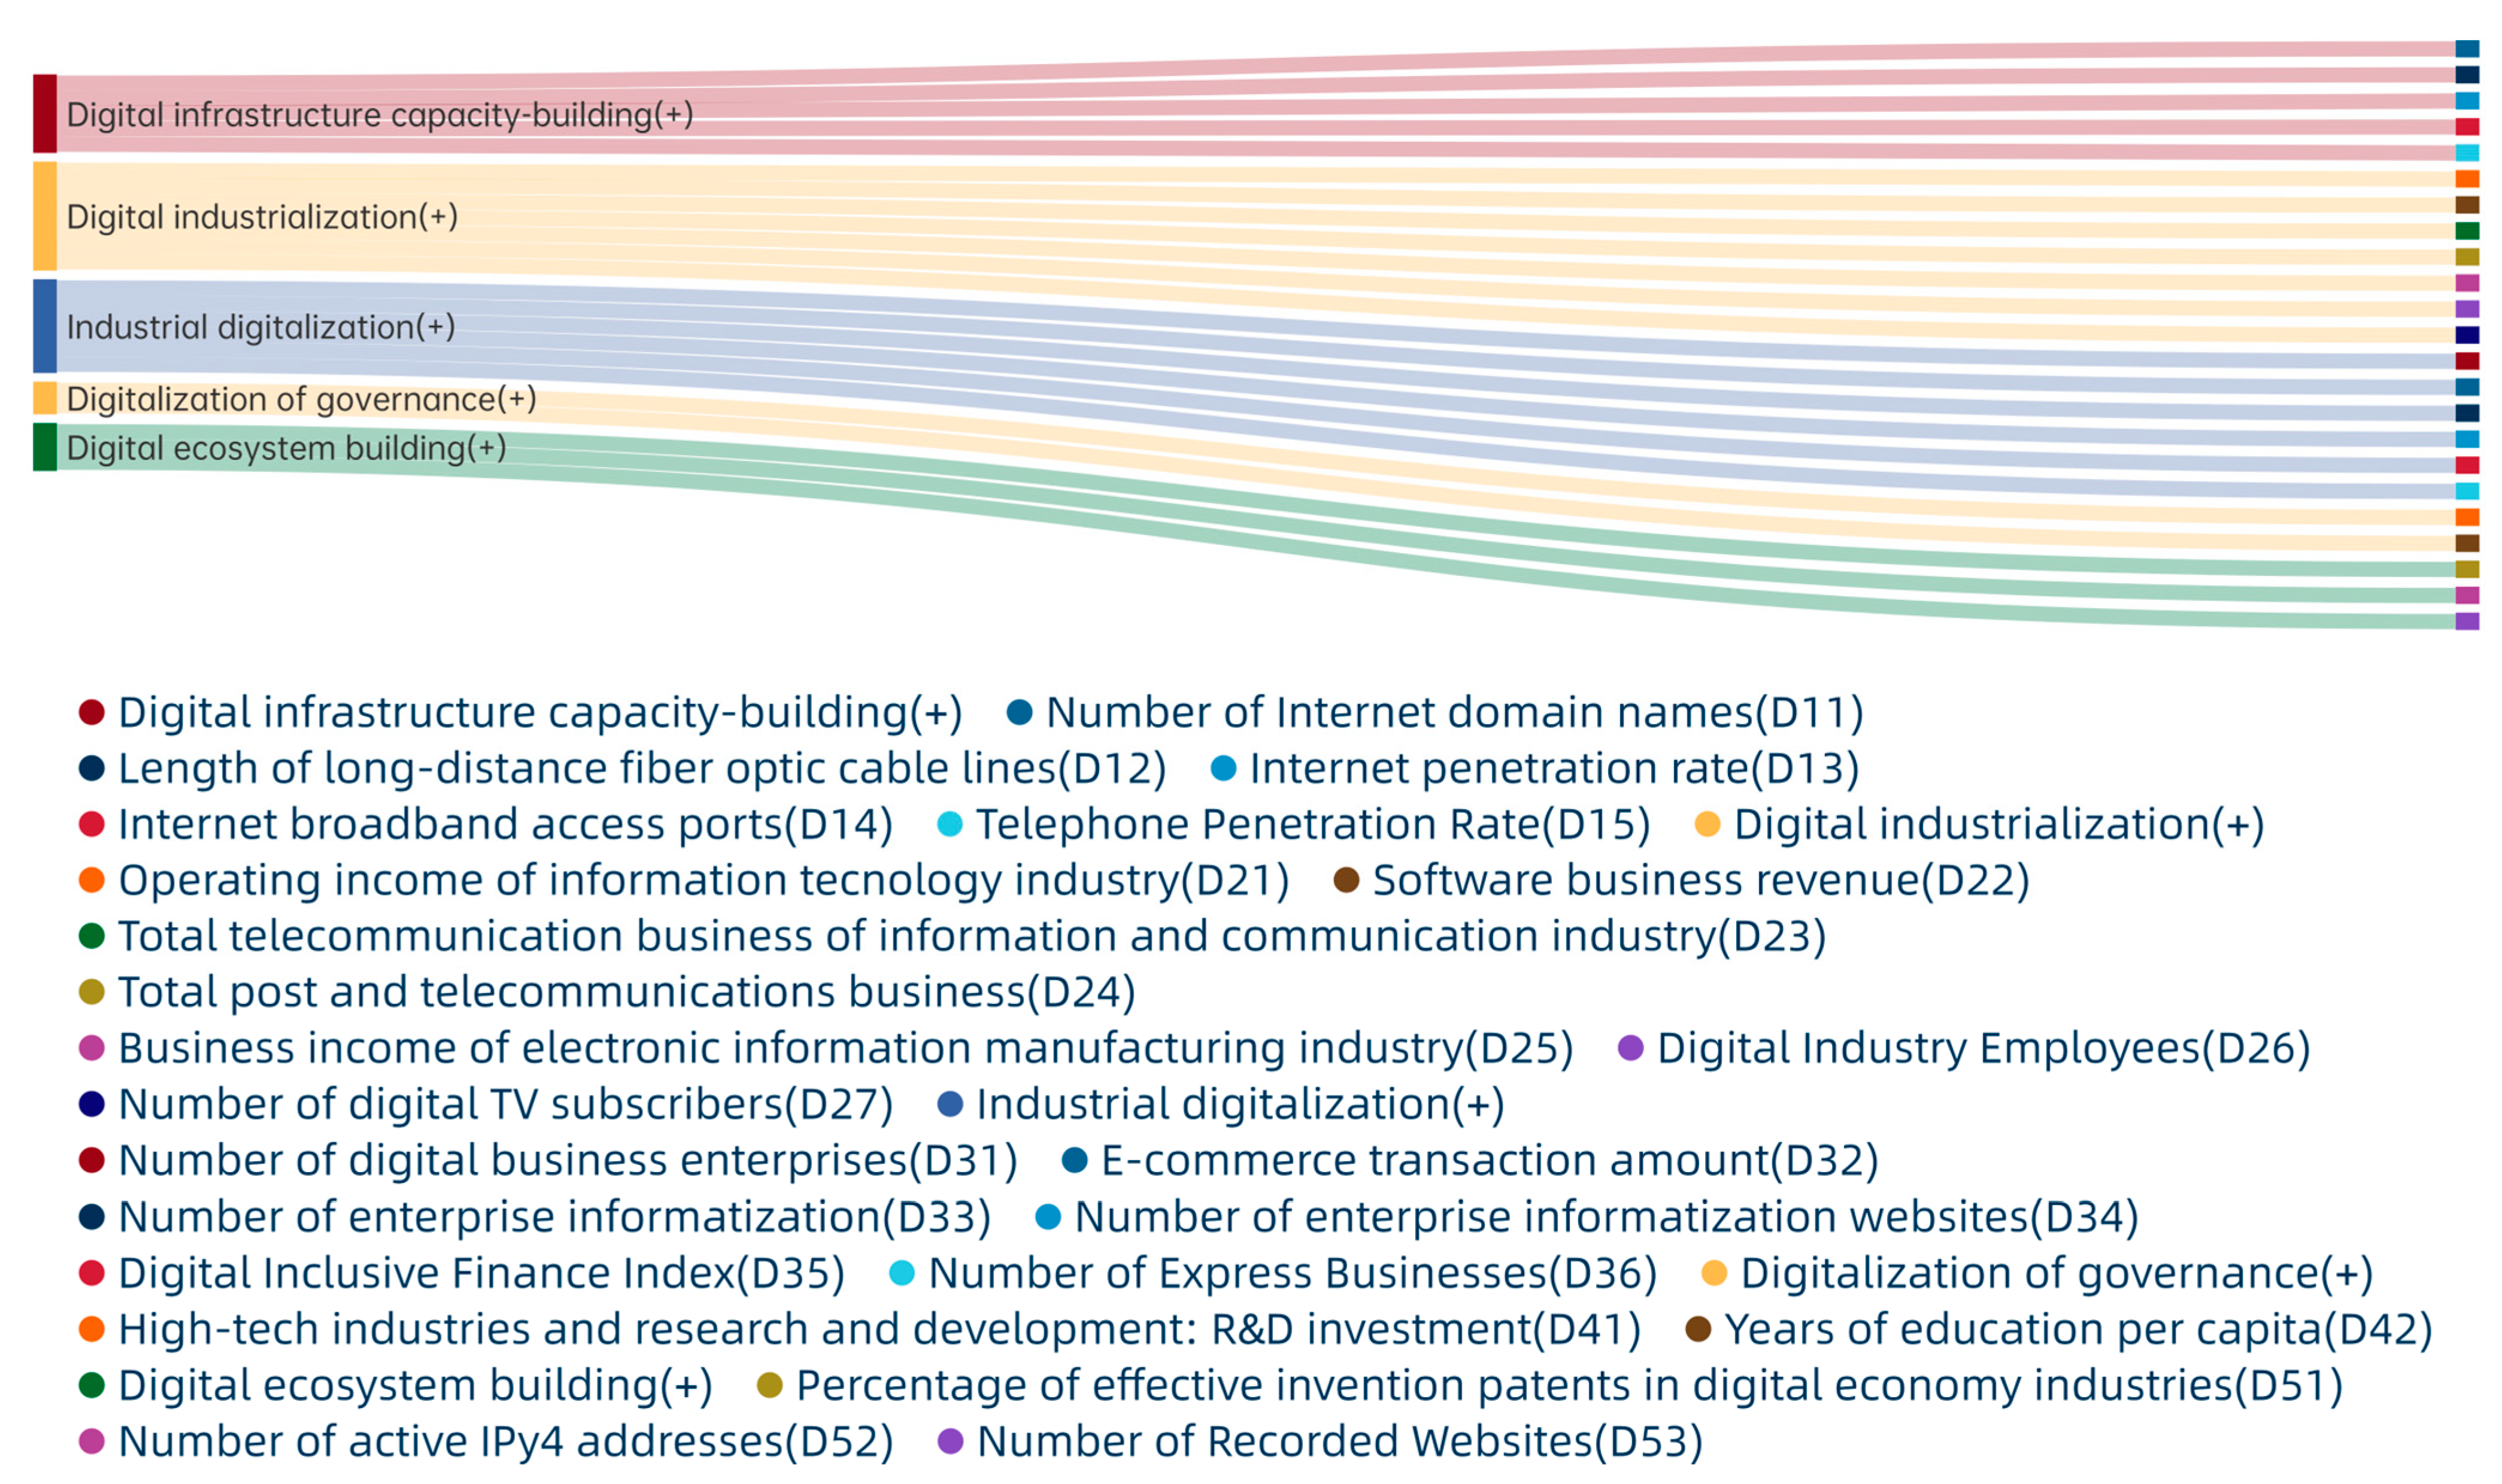
4.1.1. Digital Economy Indicators
4.1.2. Green Economy Indicators
4.1.3. Comprehensive Index
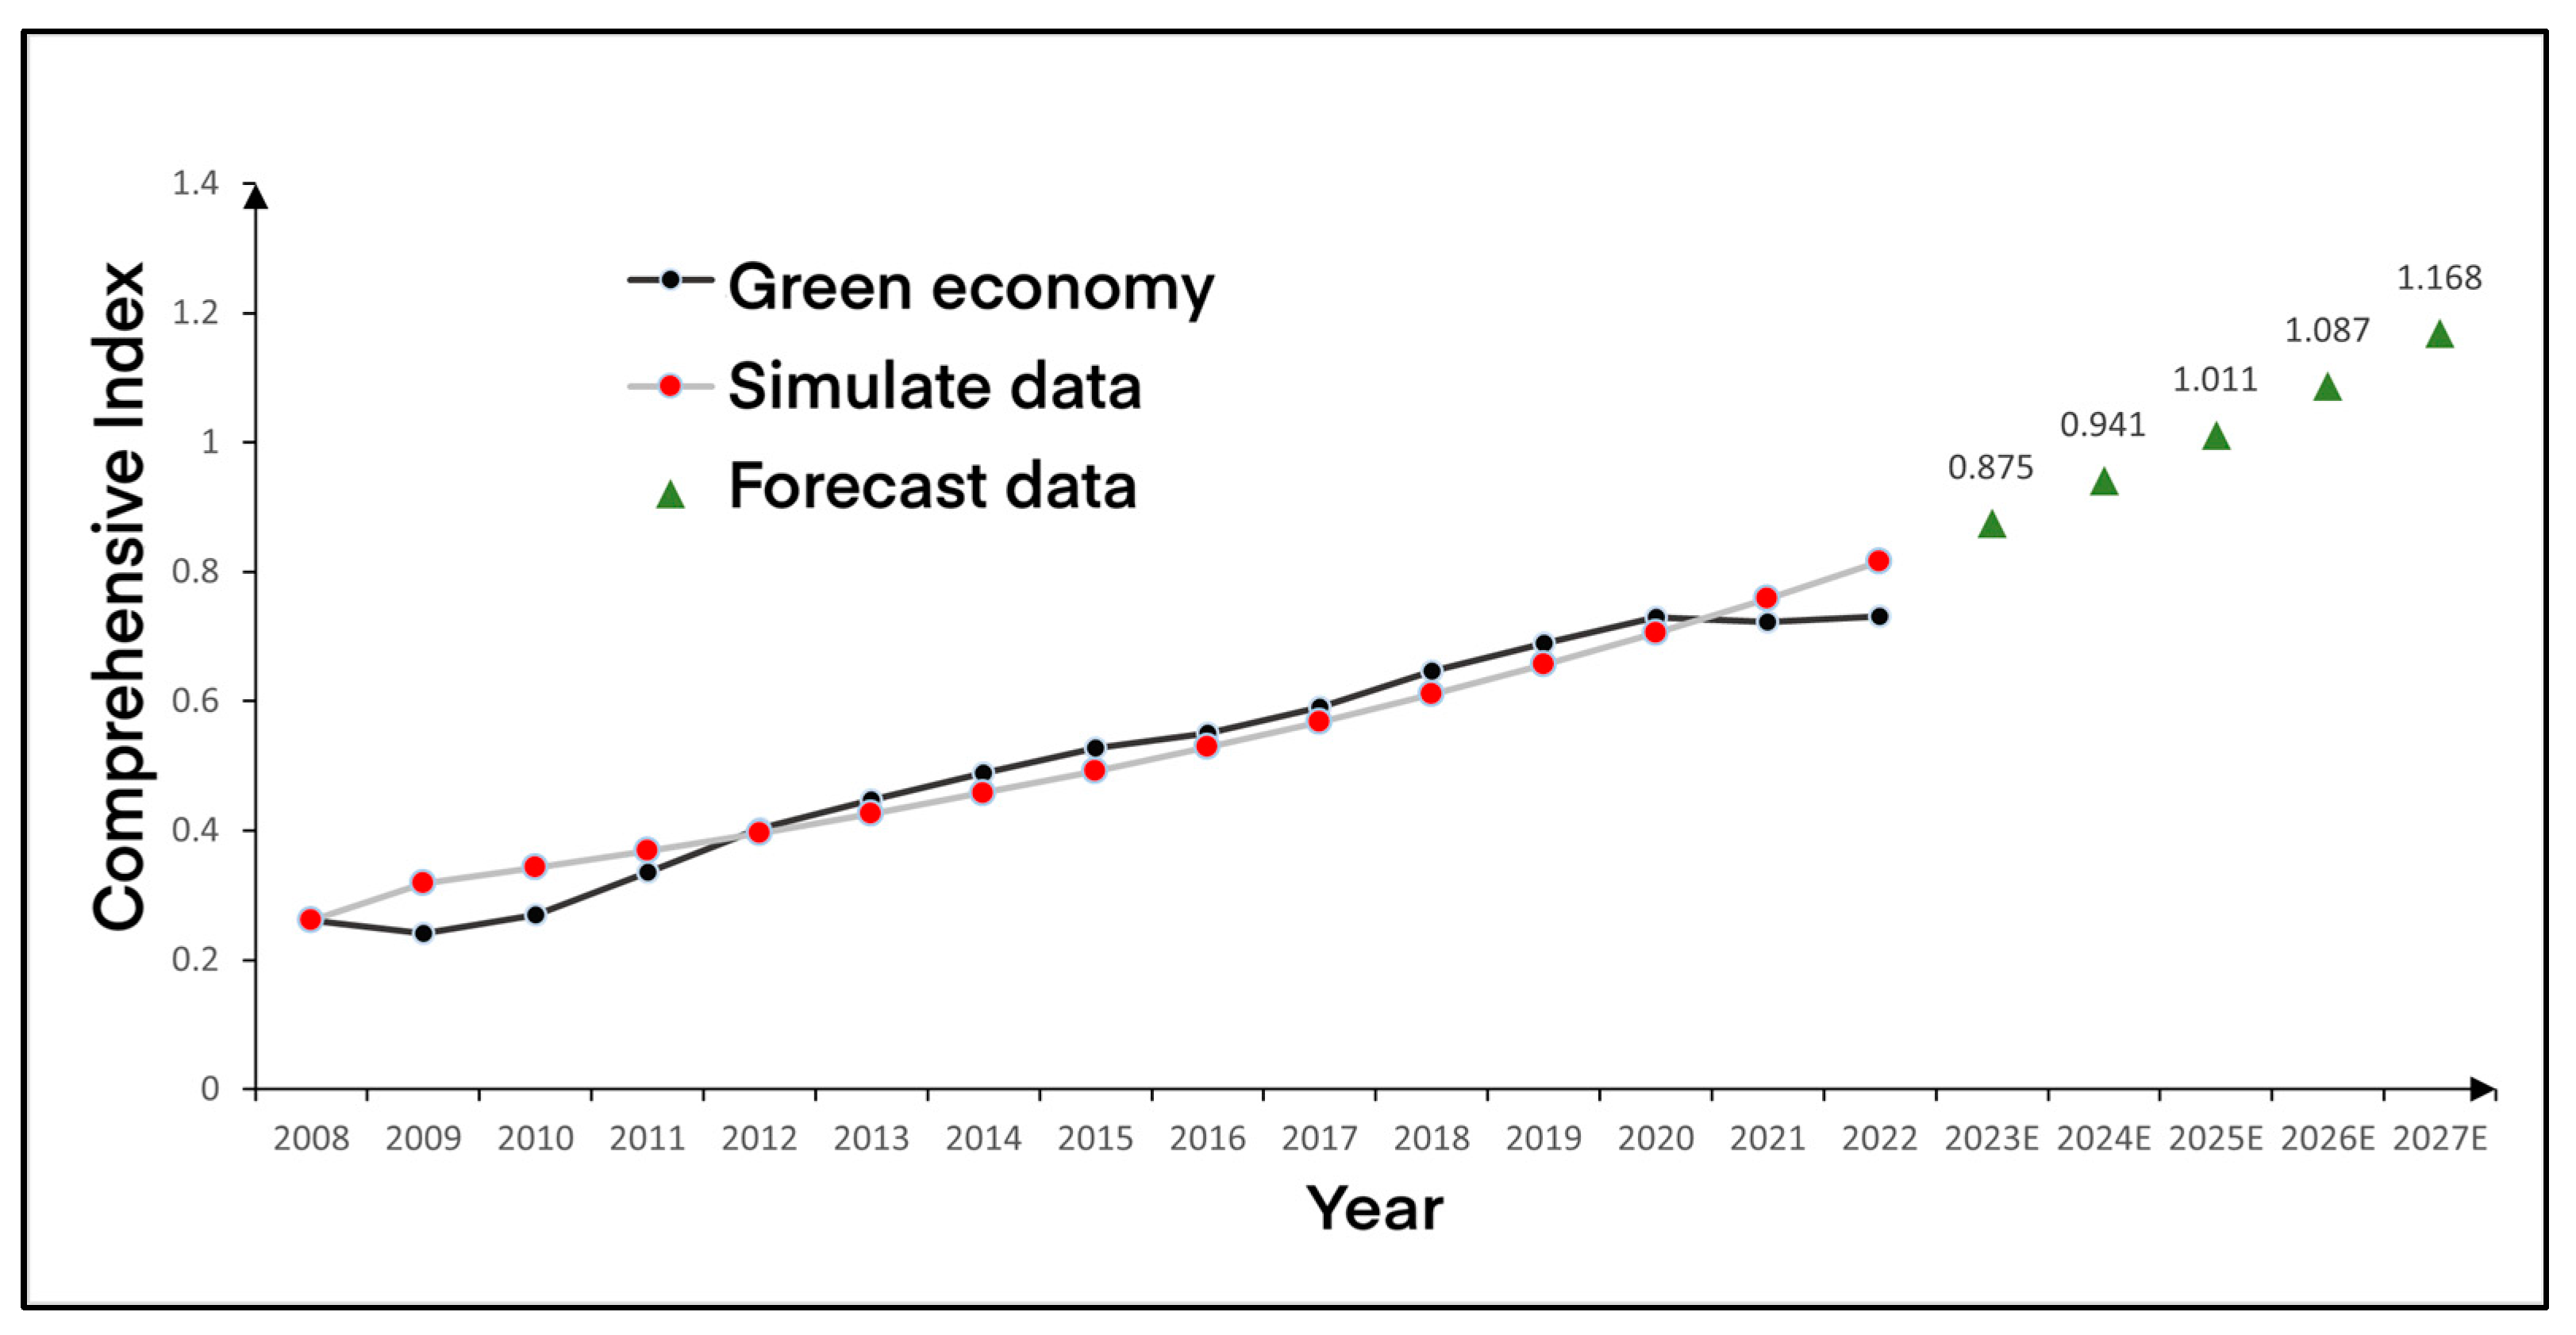
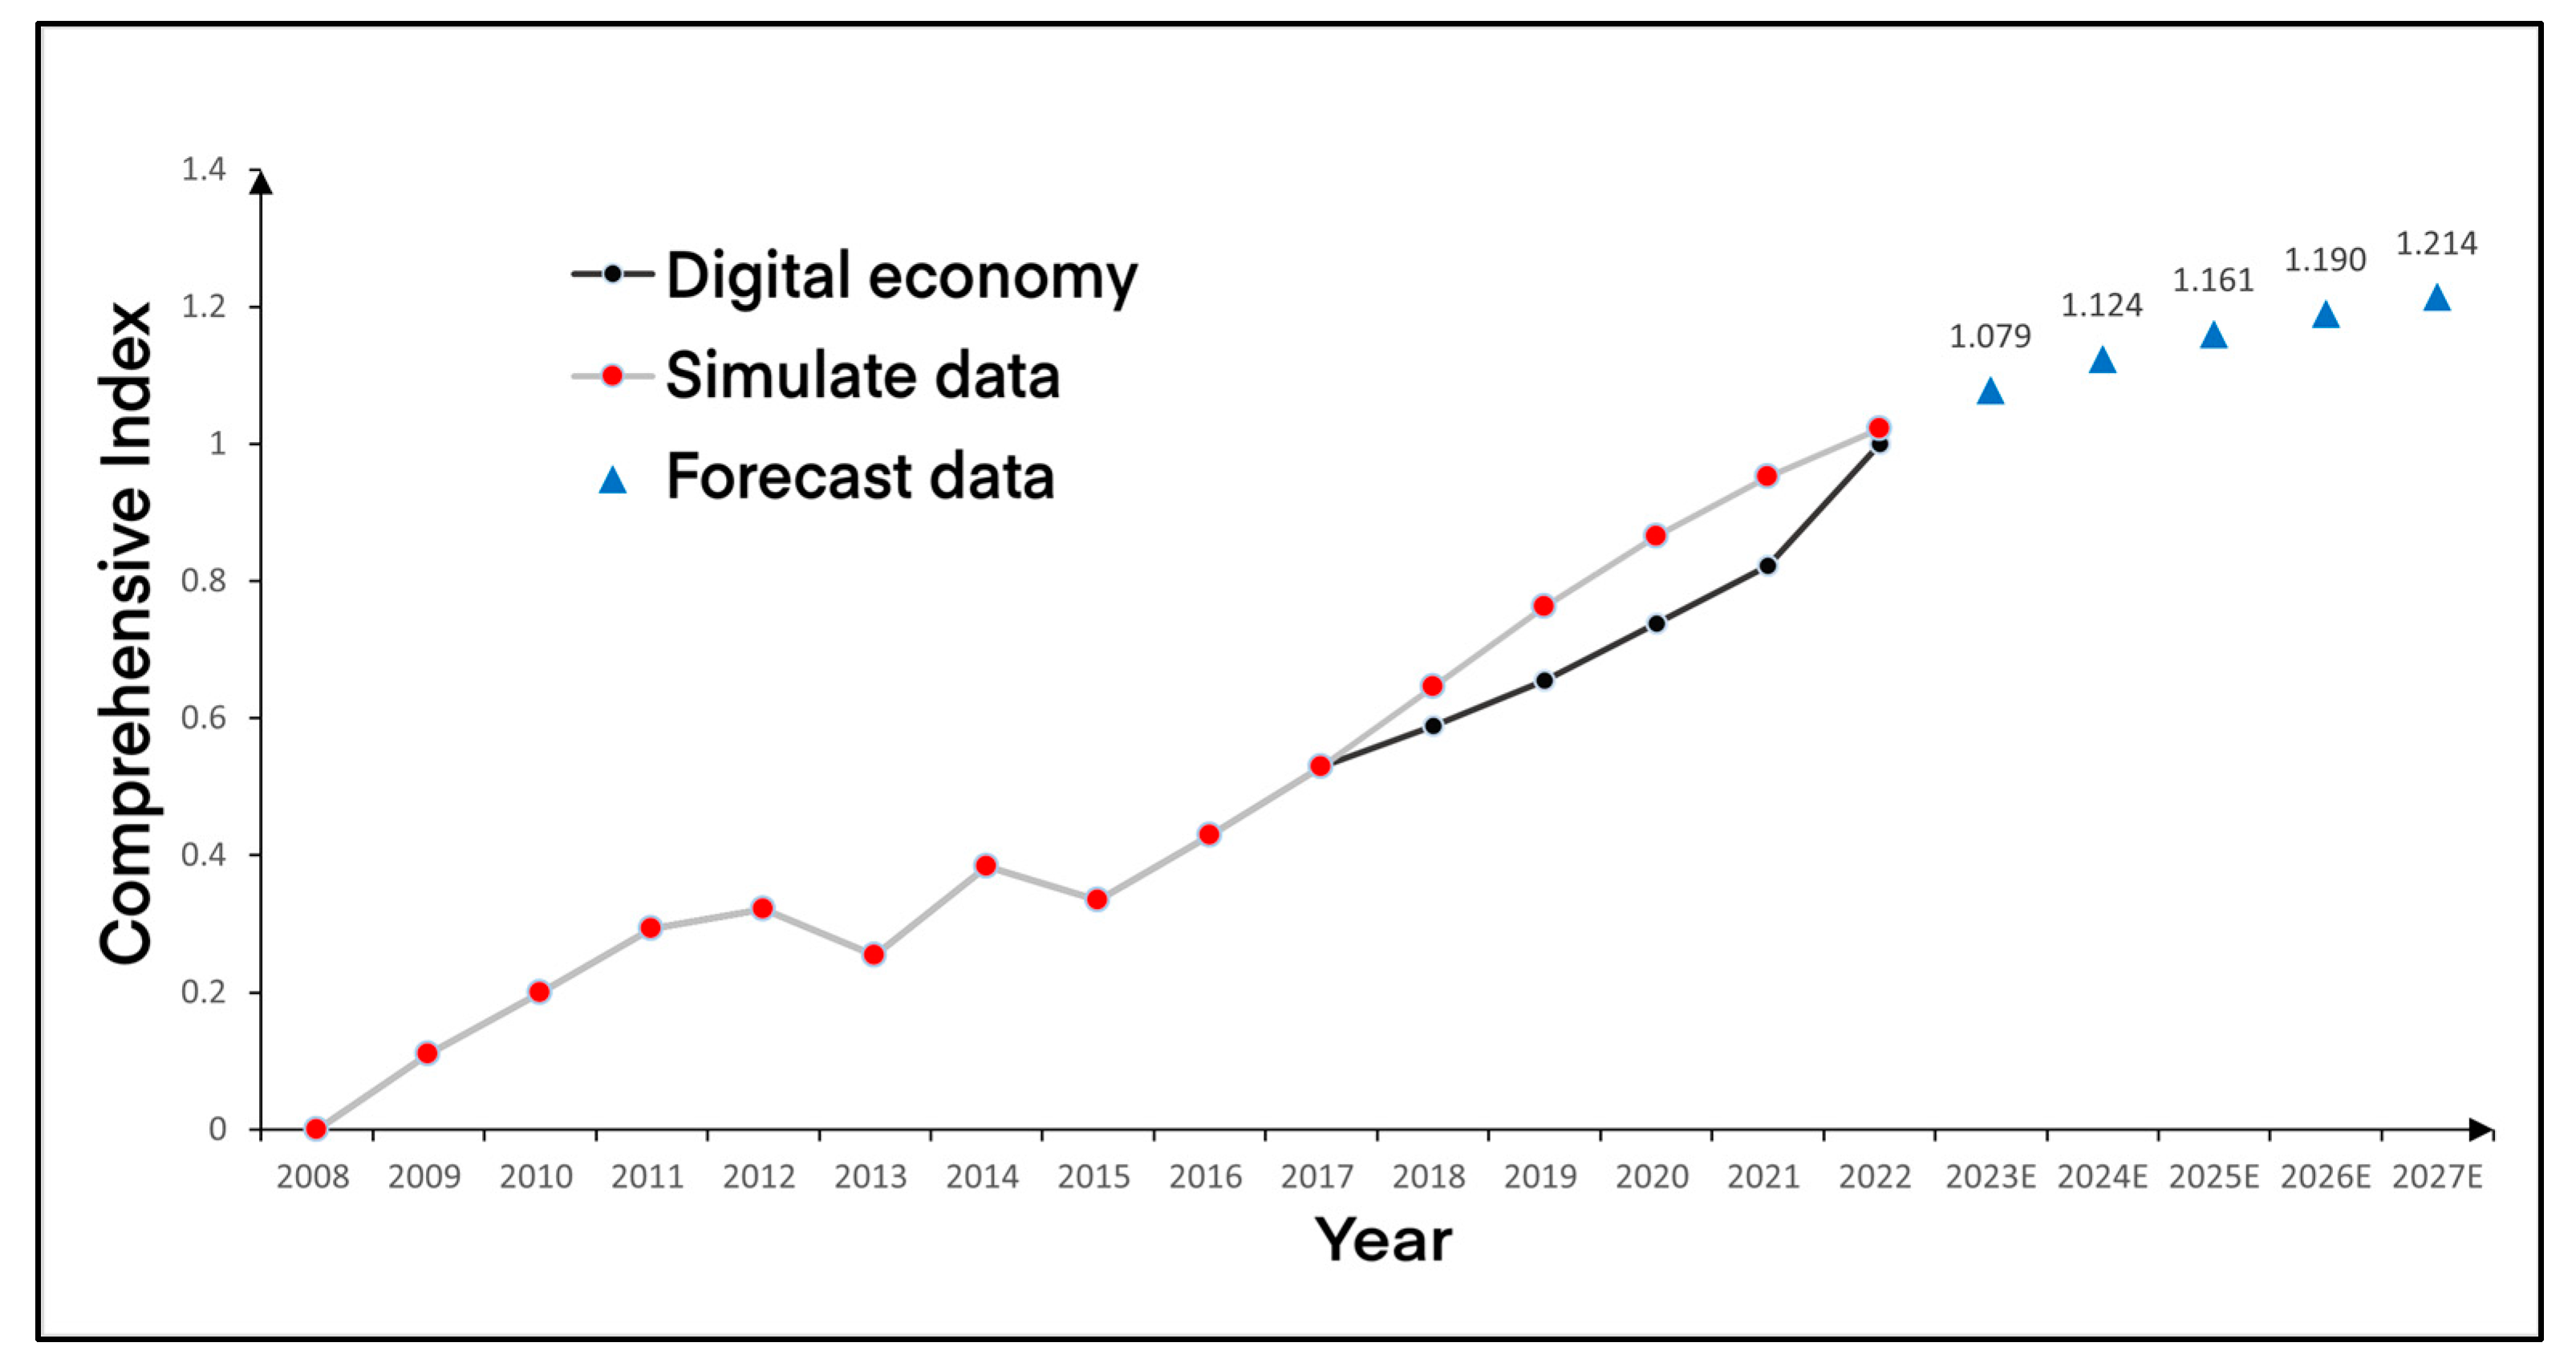
4.2. Green Economy and Digital Economy Forecast
4.3. Green Economy and Digital Economy Synergy
5. Discussion
5.1. Digital Economy and Green Economy Development Index
5.2. Green Economy and Digital Economy Trend Forecast
5.3. Synergistic Evolution Law of the Green Economy and the Digital Economy
5.4. Implications of Synergistic Evolution Trends
5.4.1. Policy Considerations
5.4.2. Industry Dynamics and Structural Adjustment
5.4.3. Global Economic Resilience
6. Limitations and Recommendations
- The organic connection with the “Digital China” strategy should be strengthened and the comprehensive integration of the green economy and the digital economy should be promoted. The development and adoption of digital technologies that optimize the production, distribution, and consumption of renewable energy should be encouraged, such as smart grid management systems, virtual power plants, and energy storage technologies. The investment in science and technology innovation in the field of digital technology and green environmental protection development should be increased, and breakthroughs in key technologies in the green digital field should be accelerated, such as energy-saving computing and AI-driven environmental monitoring. The integrated development of “government, industry, academia, research, and application” should be promoted to accelerate the promotion and application of green digital technologies. The ecosystem for cultivating innovation and entrepreneurship institutions should be improved in the green digital cross-sector and should guide professional investment institutions, third-party service institutions, results-incubation institutions, and other market entities to increase the support and services for startups in the green digital cross-sector field. We also suggest establishing and improving the system of laws, regulations, and standards in the green digital field, lowering the “threshold” and “barriers” for the synergistic development of the digital economy and green economy. Big data analysis and AI-driven insights should be actively utilized to provide an objective basis and strong support for policies and decisions related to environmental protection and sustainable development.
- The “double carbon” development goal should be the focus and the sustainable green development of key digital technologies and infrastructure should be enhanced. Supporting the construction of green data centers, the deployment of smart grids, and the development of energy-efficient broadband networks should be a priority. The proportion of green digital infrastructure should be increased, with digital government construction and digital economy headquarters enterprises as the focus. The characteristics and advantages of energy prices, climate, and geographical location in western China should be considered and energy-intensive data processing infrastructure should be deployed in areas with lower energy prices and better climate conditions to improve the efficiency of spatial allocation for green digital infrastructure development. The cultivation of new engines of economic and industrial development in less developed areas of western China should be promoted. Financial support modes should be introduced for the development of green digital technology and industry to expedite the industrialization and application of related technologies. For indirect financing, mainstream debt financing models should be used at home and abroad and tools such as special bonds, supply chain financing, PPP, asset-backed bonds, corporate bonds, and debt REITs should be adopted to provide financial support for major digital infrastructure projects. For direct financing, industry platform companies should be encouraged to diversify financing through debt-to-equity swaps, preferred shares, warrants, equity REITs, and other methods. Priorities should include strengthening talent cultivation in the field of green digital technology; encouraging research institutes, colleges and universities, and leading enterprises to increase the cultivation and recruitment of high-level talents in this field; improving the training mechanism for professional ability and management skills in green digital technology; and continuously enhancing talent levels.
7. Conclusions
- The deep integration of the green economy and the digital economy is a trend for future development. The synergistic development of these two economic subsystems will strongly drive sustainable economic growth. This growth will be fueled by the continuous expansion of digital technologies like artificial intelligence, machine learning, and the Internet of Things, as well as increased reliance on digital platforms and services. The synergy between the green economy and the digital economy will become more prominent, with them playing vital roles in mutual promotion and support.
- The development level of the green economy and the digital economy will mutually benefit each other and continue to grow steadily. Forecast data suggest that both the digital economy and the green economy will experience growth in the next five years, with the digital economy expected to have a faster growth rate. The growth of the digital economy can contribute to sustainable development and facilitate the transition to a green economy. Meanwhile, the growth rate of the green economy appears relatively stable, with continuous development driven by increased global awareness of environmental issues, policy shifts towards sustainable development, and advancements in renewable energy and clean technologies.
- This paper discusses the suitability of LSTM (long short-term memory), a type of recurrent neural network, for forecasting time series data. It notes that LSTM performs well in matching real results but may not perform as well in forecasting preliminaries. On the other hand, GM (1,1), a grey model, fits the preliminary data better. Therefore, this paper suggests that combining these two methods can lead to more accurate time series predictions.
- This paper predicts that the synergy between the green economy and the digital economy will initially rise but may decline in the future. This decline is attributed to the potential competition for resources, such as investment, labor, and government support, which could hinder the realization of synergies. Regional disparities in growth rates between the two sectors and discrepancies in access to digital infrastructure and skills among different groups may also limit the integration and synergy. Additionally, mismanagement of digital technologies could lead to increased energy consumption and e-waste, negatively impacting the environment and undermining potential synergies.
- This paper concludes by emphasizing the substantial potential for synergies between the digital and green economies. It suggests that future research should focus on collecting sufficient sample data to accurately assess the evolving patterns of synergy between these two economic subsystems. Additionally, exploring the nonlinear relationships and interaction mechanisms between the green and digital economies is deemed crucial. The impact of related measures and policies on the development of these economies should also be considered, and certain factors should be identified to label training samples for LSTM models to enhance research accuracy.
Author Contributions
Funding
Institutional Review Board Statement
Informed Consent Statement
Data Availability Statement
Conflicts of Interest
Appendix A

| Categories | Topic | Authors | Variables | Year | Results | References |
|---|---|---|---|---|---|---|
| Economic Impacts and Sustainable Development | Impact of Internet Development on Energy Consumption | Ren, S.; Hao, Y.; Xu, L.; Ba, N. | Internet Development, Energy Consumption | 2021 | Digital Economy’s Impact | [16] |
| Impact on Manufacturing Green Total Factor Productivity | Hao, X.; Wang, X.; Wu, H.; Hao, Y. | Digital Economy, Manufacturing, Green Total Factor Productivity | 2023 | [48] | ||
| Mechanism of Impact on Green Economic Growth | Wang, J.; Wang, W.; Ran, Q.; et al. | Internet Development, Green Economic Growth | 2022 | [47] | ||
| Role in Enhancing Citizens’ Lives | Delitheou, V.; Meleti, V.; et al. | Smart Cities, Green Economy, Quality of Life | 2019 | [57] | ||
| Transition to Circular Economy | Aldieri, L.; Brahmi, M.; Bruno, B.; Vinci, C.P. | Circular Economy, Innovation, Sharing Economy | 2021 | [62] | ||
| Impact on Economic Development Thresholds | Asongu, S.A.; Odhiambo, N.M. | Green Economy, Economic Development, Sub-Saharan Africa | 2020 | Impact on Economic Development | [22] | |
| Energy Transition, Digital Economy, and Green Economic Growth: Evidence from China | Wang, W.; Yang, X.; Cao, J.; Bu, W.; Dagestani, A.A.; Adebayo, T.S.; Dilanchiev, A.; Ren, S. | Energy Transition, Digital Economy, Green Economic Growth | 2022 | [34] | ||
| Transition to Circular Economy | Aldieri, L.; Brahmi, M.; Bruno, B.; Vinci, C.P. | Circular Economy, Innovation, Sharing Economy | 2021 | [62] | ||
| Effects of Emissions Trading System on Green Total Factor Productivity | Wang, S.; Chen, G.; Han, X. | Emissions Trading System, Green Total Factor Productivity | 2021 | Green Total Factor Productivity | [17] | |
| Factors Influencing Green Total Factor Productivity | Chen, Y.; Miao, J.; Zhu, Z. | Green Total Factor Productivity, Non-Point Source Pollution | 2021 | [44] | ||
| Development of the Metallurgical Industry | Lin, B.; Xu, M. | Green Total Factor Productivity, Carbon Tax | 2019 | [32] | ||
| Green Economy and Sustainable Development: The Economic Impact of Innovation on Employment | Aldieri, L.; Vinci, C.P. | Green Economy, Sustainable Development, Innovation, Employment | 2018 | Impact on Employment | [60] | |
| Is Green Innovation an Opportunity or a Threat to Employment? | Aldieri, L.; Carlucci, F.; Cirà, A.; Ioppolo, G.; Vinci, C.P. | Green Innovation, Employment, Industrialized Areas | 2019 | [61] | ||
| Circular Economy Business Models | Aldieri, L.; Brahmi, M.; Bruno, B.; Vinci, C.P. | Circular Economy, Business Models, Eco-Innovations | 2021 | [62] | ||
| Knowledge Spillovers and Technical Efficiency | Aldieri, L.; Makkonen, T.; Vinci, C.P. | Knowledge Spillovers, Technical Efficiency, Cleaner Production | 2022 | [63] | ||
| Cleaner Production and Employment Effects | Aldieri, L.; Brahmi, M.; Chen, X.; Vinci, C.P. | Cleaner Production, Employment Effects, Agriculture Innovation | 2021 | [64] | ||
| Environment and Green Innovation | Biomass Energy Consumption and Environmental Quality | Zafar, M.W.; Sinha, A.; et al. | Biomass Energy Consumption, Environmental Quality | 2021 | Environmental Impact | [66] |
| Spillover Effects and Nonlinear Correlations | Xu, S.; Yang, C.; et al. | Digital Economy, Environmental Pollution | 2022 | [67] | ||
| Outward Foreign Direct Investment and Green Spillovers | Zhou, Y.; Jiang, J.; Ye, B.; Hou, B. | Outward FDI, Green Spillovers, Provincial Data | 2019 | [21] | ||
| Implementing Eco-Innovations at Production Enterprises | Alenkova, I.V.; Mityakova, O.I.; et al. | Digital Economy, Eco-Innovations, Production Enterprises | 2020 | Green Innovation | [54] | |
| Knowledge Spillovers in Achieving Sustainable Development Goals | Aldieri, L.; Makkonen, T.; Vinci, C.P. | Environmental Innovation, R&D, Sustainable Development Goals | 2022 | [63] | ||
| Impacts on Innovation and Employment | Aldieri, L.; Vinci, C.P. | Green Innovation, Employment, Economic Impact | 2018 | [60] | ||
| Transition to Circular Economy | Aldieri, L.; Brahmi, M.; Bruno, B.; Vinci, C.P. | Circular Economy, Innovation, Sharing Economy | 2021 | Circular Economy | [62] | |
| Green Spillovers and Rural Employment | Unay-Gailhard, İ.; Bojnec, Š. | Green Economy Measures, Rural Employment, Farms | 2019 | [20] | ||
| Robotic Circular Reproduction | Southwest State University; Kolmykova, T.; Merzlyakova, E.; Kilimova, L. | Robotic Circular Reproduction, Economic Growth | 2020 | [50] | ||
| China’s Energy Inefficiency | Wei, C.; Ni, J.; Sheng, M. | Energy Inefficiency, Cross-Country Comparison | 2011 | Energy Efficiency | [15] | |
| Influence of Green Credit on Renewable Energy Investment | He, L.; Zhang, L.; Zhong, Z.; Wang, D.; Wang, F. | Green Credit, Renewable Energy Investment, Green Economy | 2019 | [25] | ||
| Impact on Economic Development Thresholds | Asongu, S.A.; Odhiambo, N.M. | Green Economy, Economic Development, Sub-Saharan Africa | 2020 | [22] | ||
| Knowledge Spillovers in Achieving Sustainable Development Goals | Aldieri, L.; Makkonen, T.; Vinci, C.P. | Environmental Innovation, R&D, Sustainable Development Goals | 2022 | Environmental Sustainability | [63] | |
| Impacts on Innovation and Employment | Aldieri, L.; Vinci, C.P. | Green Innovation, Employment, Economic Impact | 2018 | [60] | ||
| Impact on Economic Development Thresholds | Asongu, S.A.; Odhiambo, N.M. | Green Economy, Economic Development, Sub-Saharan Africa | 2020 | Sustainable Development | [22] | |
| Role in Enhancing Citizens’ Lives | Delitheou, V.; Meleti, V.; et al. | Smart Cities, Green Economy, Quality of Life | 2019 | [57] | ||
| Transition to Circular Economy | Aldieri, L.; Brahmi, M.; Bruno, B.; Vinci, C.P. | Circular Economy, Innovation, Sharing Economy | 2021 | [62] | ||
| Green and Digital Economy for Sustainable Development of Urban Areas | Savchenko, A.B.; Borodina, T.L. | Green Economy, Digital Economy, Sustainable Development | 2020 | Green Innovation and Sustainability | [53] | |
| Digitalization and Policy | Digital Transformation of the Economy | Purnomo, A.; Susanti, T.; et al. | Digital Transformation, Economy, Society | 2022 | Digital Transformation | [30] |
| Building a Better Digital Economy | Geoffrey W.S. Okamoto | Digital Economy, Sustainable Development, Policy | 2021 | [31] | ||
| Recent Situation and Progress in Biorefining Process | Cheng, Y.-S.; Mutrakulcharoen, P.; et al. | Biorefining Process, Lignocellulosic Biomass, Green Economy | 2020 | [27] | ||
| How to Evaluate the Digital Economy Scale and Potential | Chinoracky, R.; Corejova, T. | Digital Economy Scale, Evaluation, Potential | 2021 | [42] | ||
| Developing Digital Economy and Society | Borowiecki, R.; Siuta-Tokarska, B.; et al. | Digital Economy, Digital Convergence, European Union | 2021 | [43] | ||
| Role in Enhancing Citizens’ Lives | Delitheou, V.; Meleti, V.; et al. | Smart Cities, Green Economy, Quality of Life | 2019 | Digitalization | [57] | |
| Impact of Digital Economy on Total Factor Carbon Productivity | Han, D.; Ding, Y.; Shi, Z.; He, Y. | Digital Economy, Total Factor Carbon Productivity, Technology Accumulation | 2022 | [18] | ||
| Impact of Internet Development on Green Economic Growth | Wang, J.; Wang, W.; Ran, Q.; Irfan, M.; Ren, S.; Yang, X.; Wu, H.; Ahmad, M. | Internet Development, Green Economic Growth, Prefecture Cities | 2022 | [47] | ||
| Impact on Economic Development Thresholds | Asongu, S.A.; Odhiambo, N.M. | Green Economy, Economic Development, Sub-Saharan Africa | 2020 | [22] | ||
| Pandemic’s Impact on Global Economy | Ciuriak, D. | Pandemic, Global Economy, Trade | 2020 | Policy Impact | [59] | |
| Impact of New Exchange Rate System on Bangladesh | Khan, M.R. | Exchange Rate System, Bangladesh, Economic Impact | 2022 | [58] | ||
| Improved Framework for Assessing the Green Economy | Pan, W.; Pan, W.; Hu, C.; Tu, H.; Zhao, C.; Yu, D.; Xiong, J.; Zheng, G. | Green Economy Assessment, Framework | 2019 | [19] | ||
| Taxing Polluting Export Goods | Llop, M. | Environmental Taxation, Trade Relations, Economic Impact | 2023 | [36] | ||
| Impact of Green Economy Measures on Rural Employment | Unay-Gailhard, İ.; Bojnec, Š. | Green Economy Measures, Rural Employment, Farms | 2019 | Policy and Regulation | [20] | |
| Digital Trade in a Post-Pandemic Data-Driven Economy | Ciuriak, D. | Digital Trade, Post-Pandemic Economy, Data-Driven Economy | 2020 | [59] | ||
| Environmental Sustainability and its Growth in Malaysia by Elaborating the Green Economy and Environmental Efficiency | Kasayanond, A.; Umam, R.; Jermsittiparsert, K. | Environmental Sustainability, Green Economy, Environmental Efficiency | 2019 | [26] | ||
| Measuring Green Total Factor Productivity of China’s Agricultural Sector | Chen, Y.; Miao, J.; Zhu, Z. | Green Total Factor Productivity, Agriculture, SBM-DEA Model | 2021 | [44] | ||
| Trust in the Context of Digitalization | Baskakova, I. | Trust, Digitalization, Economic Development | 2021 | [41] | ||
| Evaluation and Measurement | Expenditure in the Development of the Digital Economy | Novosibirsk State Technical University; Petrov, S.P.; Maslov, M.P.; et al. | Expenditure, Digital Economy, GDP | 2020 | Measurement and Evaluation | [39] |
| Regional Aspects of Studying the Digital Economy | Strogonova, E.; Novikova, N. | Regional Aspects, Digital Economy, Economic Growth | 2020 | [40] | ||
| Measuring Fair Competition on Digital Platforms | Jürgensmeier, L.; Skiera, B. | Fair Competition, Digital Platforms, Measurement | 2023 | [37] | ||
| Green Spillovers of Outward Foreign Direct Investment | Zhou, Y.; Jiang, J.; Ye, B.; Hou, B. | Outward FDI, Green Spillovers, Provincial Data | 2019 | Spillover Effects | [21] | |
| Heterogeneous Domestic Intermediate Input-Related Carbon Emissions in China’s Exports | Zhen, W.; Qin, Q.; Jiang, L. | Intermediate Input-Related Carbon Emissions, China’s Exports, Domestic Spillovers | 2022 | [68] | ||
| Knowledge Spillovers in Achieving Sustainable Development Goals | Aldieri, L.; Makkonen, T.; Vinci, C.P. | Environmental Innovation, R&D, Sustainable Development Goals | 2022 | [63] | ||
| Assessing the Green Economy in China | Pan, W.; Pan, W.; et al. | Green Economy Assessment, Framework | 2019 | Green Economy Assessment | [19] |
References
- Song, M.; Zheng, C.; Wang, J. The Role of Digital Economy in China’s Sustainable Development in a Post-Pandemic Environment. J. Enterp. Inf. Manag. 2021, 35, 58–77. [Google Scholar] [CrossRef]
- Meng, F.; Zhao, Y. How Does Digital Economy Affect Green Total Factor Productivity at the Industry Level in China: From a Perspective of Global Value Chain. Environ. Sci. Pollut. Res. 2022, 29, 79497–79515. [Google Scholar] [CrossRef]
- Zhang, Z.; Fu, W.K.; Ma, L. The Impact of Digital Economy on Green Development in China. Front. Environ. Sci. 2022, 10, 991278. [Google Scholar] [CrossRef]
- China Issues White Paper on Green Development in New Era. Available online: http://english.scio.gov.cn/whitepapers/2023-01/19/content_85067675.htm (accessed on 17 April 2023).
- Digital Economy Report 2021|UNCTAD. Available online: https://unctad.org/publication/digital-economy-report-2021 (accessed on 21 September 2023).
- Liu, Q. Prospects for China’s Economic Development During the 14th Five-Year Plan Period. In Annual Report on China’s Petroleum, Gas and New Energy Industry (2021); Cai, F., Ma, Y., Jin, Z., Eds.; Current Chinese Economic Report Series; Springer Nature: Singapore, 2022; pp. 3–24. ISBN 978-981-19607-6-5. [Google Scholar]
- Yu, Z.; Liu, S.; Zhu, Z. Has the Digital Economy Reduced Carbon Emissions?: Analysis Based on Panel Data of 278 Cities in China. Int. J. Environ. Res. Public Health 2022, 19, 11814. [Google Scholar] [CrossRef]
- Yang, Y.; Liang, Q. Digital Economy, Environmental Regulation and Green Eco-Efficiency-Empirical Evidence from 285 Cities in China. Front. Environ. Sci. 2023, 11, 1113293. [Google Scholar] [CrossRef]
- Castro, G.D.R.; Fernandez, M.C.G.; Colsa, A.U. Unleashing the Convergence amid Digitalization and Sustainability towards Pursuing the Sustainable Development Goals (SDGs): A Holistic Review. J. Clean. Prod. 2021, 280, 122204. [Google Scholar] [CrossRef]
- De Felice, F.; Petrillo, A. Green Transition: The Frontier of the Digicircular Economy Evidenced from a Systematic Literature Review. Sustainability 2021, 13, 11068. [Google Scholar] [CrossRef]
- Sridhar, A.; Balakrishnan, A.; Jacob, M.M.; Sillanpaa, M.; Dayanandan, N. Global Impact of COVID-19 on Agriculture: Role of Sustainable Agriculture and Digital Farming. Environ. Sci. Pollut. Res. 2023, 30, 42509–42525. [Google Scholar] [CrossRef] [PubMed]
- Carson, R. Silent Spring; Hamish Hamilton: London, UK, 1963. [Google Scholar]
- Pearce, D.W.; Markandya, A.; Barbier, E.B.; Barbier, E. Blueprint for a Green Economy; Earthscan: Oxford, UK, 1989; ISBN 978-1-85383-066-2. [Google Scholar]
- United Nations Environment Programme. Adaptation Gap Report 2022. Available online: http://www.unep.org/resources/adaptation-gap-report-2022 (accessed on 21 September 2023).
- Wei, C.; Ni, J.; Sheng, M. China’s Energy Inefficiency: A Cross-Country Comparison. Soc. Sci. J. 2011, 48, 478–488. [Google Scholar] [CrossRef]
- Ren, S.; Hao, Y.; Xu, L.; Wu, H.; Ba, N. Digitalization and Energy: How Does Internet Development Affect China’s Energy Consumption? Energy Econ. 2021, 98, 105220. [Google Scholar] [CrossRef]
- Wang, S.; Chen, G.; Han, X. An Analysis of the Impact of the Emissions Trading System on the Green Total Factor Productivity Based on the Spatial Difference-in-Differences Approach: The Case of China. Int. J. Environ. Res. Public Health 2021, 18, 9040. [Google Scholar] [CrossRef]
- Han, D.; Ding, Y.; Shi, Z.; He, Y. The Impact of Digital Economy on Total Factor Carbon Productivity: The Threshold Effect of Technology Accumulation. Environ. Sci. Pollut. Res. Int 2022, 29, 55691–55706. [Google Scholar] [CrossRef] [PubMed]
- Pan, W.; Pan, W.; Hu, C.; Tu, H.; Zhao, C.; Yu, D.; Xiong, J.; Zheng, G. Assessing the Green Economy in China: An Improved Framework. J. Clean. Prod. 2019, 209, 680–691. [Google Scholar] [CrossRef]
- Unay-Gailhard, İ.; Bojnec, Š. The Impact of Green Economy Measures on Rural Employment: Green Jobs in Farms. J. Clean. Prod. 2019, 208, 541–551. [Google Scholar] [CrossRef]
- Zhou, Y.; Jiang, J.; Ye, B.; Hou, B. Green Spillovers of Outward Foreign Direct Investment on Home Countries: Evidence from China’s Province-Level Data. J. Clean. Prod. 2019, 215, 829–844. [Google Scholar] [CrossRef]
- Asongu, S.A.; Odhiambo, N.M. Economic Development Thresholds for a Green Economy in Sub-Saharan Africa. Energy Explor. Exploit. 2020, 38, 3–17. [Google Scholar] [CrossRef]
- Liu, Y.; Dong, F. How Technological Innovation Impacts Urban Green Economy Efficiency in Emerging Economies: A Case Study of 278 Chinese Cities. Resour. Conserv. Recycl. 2021, 169, 105534. [Google Scholar] [CrossRef]
- D’Amato, D.; Korhonen, J. Integrating the Green Economy, Circular Economy and Bioeconomy in a Strategic Sustainability Framework. Ecol. Econ. 2021, 188, 107143. [Google Scholar] [CrossRef]
- He, L.; Zhang, L.; Zhong, Z.; Wang, D.; Wang, F. Green Credit, Renewable Energy Investment and Green Economy Development: Empirical Analysis Based on 150 Listed Companies of China. J. Clean. Prod. 2019, 208, 363–372. [Google Scholar] [CrossRef]
- Kasayanond, A.; Umam, R.; Jermsittiparsert, K. Environmental sustainability and its growth in malaysia by elaborating the green economy and environmental efficiency. Int. J. Energy Econ. Policy 2019, 9, 465–473. [Google Scholar] [CrossRef]
- Cheng, Y.-S.; Mutrakulcharoen, P.; Chuetor, S.; Cheenkachorn, K.; Tantayotai, P.; Panakkal, E.J.; Sriariyanun, M. Recent Situation and Progress in Biorefining Process of Lignocellulosic Biomass: Toward Green Economy. Appl. Sci. Eng. Prog. 2020, 13, 299–311. [Google Scholar] [CrossRef]
- Bergius, M.; Benjaminsen, T.A.; Maganga, F.; Buhaug, H. Green Economy, Degradation Narratives, and Land-Use Conflicts in Tanzania. World Dev. 2020, 129, 104850. [Google Scholar] [CrossRef]
- Malikh, O.E.; Konovalova, M.E.; Kuzmina, O.Y.; Michailov, A.M. The Problem of Energy Saving and Its Solution in the Conditions of Formation of a New Model of Economic Development. In Digital Transformation of the Economy: Challenges, Trends and New Opportunities; Ashmarina, S., Mesquita, A., Vochozka, M., Eds.; Springer International Publishing: Cham, Switzerland, 2020; pp. 79–87. [Google Scholar]
- Purnomo, A.; Susanti, T.; Rosyidah, E.; Firdausi, N.; Idhom, M. Digital Economy Research: Thirty-Five Years Insights of Retrospective Review. Procedia Comput. Sci. 2022, 197, 68–75. [Google Scholar] [CrossRef]
- Geoffrey, W.S. Okamoto Building a Better Digital Economy. Available online: https://www.imf.org/en/News/Articles/2021/06/24/sp062421-building-a-better-digital-economy (accessed on 21 September 2023).
- Lin, B.; Xu, M. Exploring the Green Total Factor Productivity of China’s Metallurgical Industry under Carbon Tax: A Perspective on Factor Substitution. J. Clean. Prod. 2019, 233, 1322–1333. [Google Scholar] [CrossRef]
- Li, Z.; Liu, Y. Research on the Spatial Distribution Pattern and Influencing Factors of Digital Economy Development in China. IEEE Access 2021, 9, 63094–63106. [Google Scholar] [CrossRef]
- Wang, W.; Yang, X.; Cao, J.; Bu, W.; Dagestani, A.A.; Adebayo, T.S.; Dilanchiev, A.; Ren, S. Energy Internet, Digital Economy, and Green Economic Growth: Evidence from China. Innov. Green Dev. 2022, 1, 100011. [Google Scholar] [CrossRef]
- Luna, R.E.R.; Martinez, J.L.R. Endogenización como mecanismo evolutivo para la transformación digital de las pymes de turismo de naturaleza. Tendencias 2022, 23, 117–138. [Google Scholar] [CrossRef]
- Llop, M. Environmental Taxation and International Trade in a Tax-Distorted Economy. Economics 2023, 17, 20220038. [Google Scholar] [CrossRef]
- Jürgensmeier, L.; Skiera, B. Measuring Fair Competition on Digital Platforms. arXiv 2023, arXiv:2303.14947. [Google Scholar] [CrossRef]
- Gokhberg, L.; Suslov, A.; Kovaleva, G.; Abdrakhmanova, G.; Leven, E. Expenditure on the Digital Economy: What Is It and How to Measure It? Higher School of Economics Research Paper No. WP BRP 115/STI/2020. Available online: https://ssrn.com/abstract=3736608 (accessed on 21 September 2023).
- Petrov, S.P.; Maslov, M.P.; Karpovich, A.I. Influence of Expenditures in the Development of the Digital Economy on the Volume of Russia’s GDP. J. Appl. Econ. Res. 2020, 19, 419–440. [Google Scholar] [CrossRef]
- Strogonova, E.; Novikova, N. Regional Aspects of Studying the Digital Economy in the System of Economic Growth Drivers. J. New Econ. 2020, 21, 76–93. [Google Scholar] [CrossRef]
- Baskakova, I. Trust As a Factor in the Development of the Economy in the Context of Digitalization. KnE Soc. Sci. 2021, 1, 391–398. [Google Scholar] [CrossRef]
- Chinoracky, R.; Corejova, T. How to Evaluate the Digital Economy Scale and Potential? Entrep. Sustain. Issues 2021, 8, 536–552. [Google Scholar] [CrossRef] [PubMed]
- Borowiecki, R.; Siuta-Tokarska, B.; Maroń, J.; Suder, M.; Thier, A.; Żmija, K. Developing Digital Economy and Society in the Light of the Issue of Digital Convergence of the Markets in the European Union Countries. Energies 2021, 14, 2717. [Google Scholar] [CrossRef]
- Chen, Y.; Miao, J.; Zhu, Z. Measuring Green Total Factor Productivity of China’s Agricultural Sector: A Three-Stage SBM-DEA Model with Non-Point Source Pollution and CO2 Emissions. J. Clean. Prod. 2021, 318, 128543. [Google Scholar] [CrossRef]
- Vukovic, N.; Pobedinsky, V.; Mityagin, S.; Drozhzhin, A.; Mingaleva, Z. A Study on Green Economy Indicators and Modeling: Russian Context. Sustainability 2019, 11, 4629. [Google Scholar] [CrossRef]
- Zhang, W.; Zhou, H.; Chen, J.; Fan, Z. An Empirical Analysis of the Impact of Digital Economy on Manufacturing Green and Low-Carbon Transformation under the Dual-Carbon Background in China. Int. J. Environ. Res. Public Health 2022, 19, 13192. [Google Scholar] [CrossRef] [PubMed]
- Wang, J.; Wang, W.; Ran, Q.; Irfan, M.; Ren, S.; Yang, X.; Wu, H.; Ahmad, M. Analysis of the Mechanism of the Impact of Internet Development on Green Economic Growth: Evidence from 269 Prefecture Cities in China. Environ. Sci. Pollut. Res. Int 2022, 29, 9990–10004. [Google Scholar] [CrossRef]
- Hao, X.; Wang, X.; Wu, H.; Hao, Y. Path to Sustainable Development: Does Digital Economy Matter in Manufacturing Green Total Factor Productivity? Sustain. Dev. 2023, 31, 360–378. [Google Scholar] [CrossRef]
- Yang, G.; Xiang, X.; Deng, F.; Wang, F. Towards High-Quality Development: How Does Digital Economy Impact Low-Carbon Inclusive Development?: Mechanism and Path. Environ. Sci. Pollut. Res. Int. 2023, 30, 41700–41725. [Google Scholar] [CrossRef]
- Kolmykova, T.; Merzlyakova, E.; Kilimova, L. Development of Robotic Circular Reproduction in Ensuring Sustainable Economic Growth. Econ. Ann.-XXI 2020, 186, 12–20. [Google Scholar] [CrossRef]
- Liu, D.; Zhu, X.; Wang, Y. China’s Agricultural Green Total Factor Productivity Based on Carbon Emission: An Analysis of Evolution Trend and Influencing Factors. J. Clean. Prod. 2021, 278, 123692. [Google Scholar] [CrossRef]
- Han, X.; Zhang, J. Business Model Innovation Paths of Manufacturing Oriented towards Green Development in Digital Economy. Int. J. Environ. Res. Public Health 2022, 19, 16454. [Google Scholar] [CrossRef] [PubMed]
- Savchenko, A.B.; Borodina, T.L. Green and Digital Economy for Sustainable Development of Urban Areas. Reg. Res. Russ. 2020, 10, 583–592. [Google Scholar] [CrossRef]
- Alenkova, I.V.; Mityakova, O.I.; Mityakov, S.N.; Ivanov, S.S. Digital Economy: New Opportunities to Implement Eco-Innovations at Production Enterprises. In Proceedings of the III International Scientific and Practical Conference “Digital Economy and Finances” (ISPC-DEF 2020), St. Petersburg, FL, USA, 19–20 March 2020; Atlantis Press: Amsterdam, The Netherlands, 2020; pp. 108–111. [Google Scholar]
- Piao, X.; Cui, X. Assessing China’s Digital Economy and Environmental Sustainability: A Regional Low-Carbon Perspective. In Proceedings of the EGU General Assembly 2020, Online, 4–8 May 2020. EGU2020-12740. [Google Scholar] [CrossRef]
- Nurova, O.; Freze, T. Competitive Advantage of the Sustainable Digital Economy. E3S Web Conf. 2021, 250, 06004. [Google Scholar] [CrossRef]
- Delitheou, V.; Meleti, V.; Athanassopoulos, C.G.E. Green Economy and Smart City. J. Reliab. Intell. Environ. 2019, 5, 235–240. [Google Scholar] [CrossRef]
- Xing, H.; Ren, Z.; Tang, Q. Accelerating the Formation of the New Development Pattern in Northern Anhui with Higher Quality Development of Digital Economy. Mod. Econ. 2020, 11, 2041–2054. [Google Scholar] [CrossRef]
- Ciuriak, D. Digital Trade in a Post-Pandemic Data-Driven Economy. 2020, Volume 7. Available online: http://dx.doi.org/10.2139/ssrn.3617251 (accessed on 21 September 2023).
- Aldieri, L.; Vinci, C.P. Green Economy and Sustainable Development: The Economic Impact of Innovation on Employment. Sustainability 2018, 10, 3541. [Google Scholar] [CrossRef]
- Aldieri, L.; Carlucci, F.; Cirà, A.; Ioppolo, G.; Vinci, C.P. Is Green Innovation an Opportunity or a Threat to Employment? An Empirical Analysis of Three Main Industrialized Areas: The USA, Japan and Europe. J. Clean. Prod. 2019, 214, 758–766. [Google Scholar] [CrossRef]
- Aldieri, L.; Brahmi, M.; Bruno, B.; Vinci, C.P. Circular Economy Business Models: The Complementarities with Sharing Economy and Eco-Innovations Investments. Sustainability 2021, 13, 12438. [Google Scholar] [CrossRef]
- Aldieri, L.; Makkonen, T.; Vinci, C.P. Do Research and Development and Environmental Knowledge Spillovers Facilitate Meeting Sustainable Development Goals for Resource Efficiency? Resour. Policy 2022, 76, 102603. [Google Scholar] [CrossRef]
- Aldieri, L.; Brahmi, M.; Chen, X.; Vinci, C.P. Knowledge Spillovers and Technical Efficiency for Cleaner Production: An Economic Analysis from Agriculture Innovation. J. Clean. Prod. 2021, 320, 128830. [Google Scholar] [CrossRef]
- Gatto, A.; Drago, C.; Panarello, D.; Aldieri, L. Energy Transition in China: Assessing Progress in Sustainable Development and Resilience Directions. Int. Econ. 2023, 8. [Google Scholar] [CrossRef]
- Zafar, M.W.; Sinha, A.; Ahmed, Z.; Qin, Q.; Zaidi, S.A.H. Effects of Biomass Energy Consumption on Environmental Quality: The Role of Education and Technology in Asia-Pacific Economic Cooperation Countries. Renew. Sustain. Energy Rev. 2021, 142, 110868. [Google Scholar] [CrossRef]
- Xu, S.; Yang, C.; Huang, Z.; Failler, P. Interaction between Digital Economy and Environmental Pollution: New Evidence from a Spatial Perspective. Int. J. Environ. Res. Public Health 2022, 19, 5074. [Google Scholar] [CrossRef] [PubMed]
- Zhen, W.; Qin, Q.; Jiang, L. Heterogeneous Domestic Intermediate Input-Related Carbon Emissions in China’s Exports. Environ. Resour. Econ 2022, 81, 453–479. [Google Scholar] [CrossRef]
- Zhang, S.; Ma, X.; Cui, Q. Assessing the Impact of the Digital Economy on Green Total Factor Energy Efficiency in the Post-COVID-19 Era. Front. Energy Res. 2021, 9, 798922. [Google Scholar] [CrossRef]
- Luo, K.; Liu, Y.; Chen, P.-F.; Zeng, M. Assessing the Impact of Digital Economy on Green Development Efficiency in the Yangtze River Economic Belt. Energy Econ. 2022, 112, 106127. [Google Scholar] [CrossRef]
- Meng, B.; Chi, G. New Combined Weighting Model Based on Maximizing the Difference in Evaluation Results and Its Application. Math. Probl. Eng. 2015, 2015, e239634. [Google Scholar] [CrossRef]
- Sahoo, M.; Sahoo, S.; Dhar, A.; Pradhan, B. Effectiveness Evaluation of Objective and Subjective Weighting Methods for Aquifer Vulnerability Assessment in Urban Context. J. Hydrol. 2016, 541, 1303–1315. [Google Scholar] [CrossRef]
- Odu, G. Weighting Methods for Multi-Criteria Decision Making Technique. J. Appl. Sci. Environ. Manag. 2019, 23, 1449. [Google Scholar] [CrossRef]
- Qu, S.; Chen, H.; Shen, Z.; Ma, H. The Performance Evaluation of Management Mode of Small Water Resources Projects. PLoS ONE 2023, 18, e0282357. [Google Scholar] [CrossRef] [PubMed]
- Caticha, A. Information and Entropy. Available online: https://arxiv.org/abs/0710.1068v1 (accessed on 1 September 2023).
- Jakimowicz, A. The Role of Entropy in the Development of Economics. Entropy 2020, 22, 452. [Google Scholar] [CrossRef] [PubMed]
- Scharfenaker, E.; Yang, J. Maximum Entropy Economics. Eur. Phys. J. Spec. Top. 2020, 229, 1577–1590. [Google Scholar] [CrossRef]
- Shamsuzzoha, A.; Piya, S.; Shamsuzzaman, M. Application of Fuzzy TOPSIS Framework for Selecting Complex Project in a Case Company. J. Glob. Oper. Strateg. Sourc. 2021, 14, 528–566. [Google Scholar] [CrossRef]
- Chen, P. A Novel Coordinated TOPSIS Based on Coefficient of Variation. Mathematics 2019, 7, 614. [Google Scholar] [CrossRef]
- Hochreiter, S.; Schmidhuber, J. Long Short-Term Memory. Neural Comput. 1997, 9, 1735–1780. [Google Scholar] [CrossRef]
- Siami-Namini, S.; Namin, A.S. Forecasting Economics and Financial Time Series: ARIMA vs. LSTM. arXiv 2018, arXiv:1803.06386. [Google Scholar]
- Wang, J.; Tang, J.; Guo, K. Green Bond Index Prediction Based on CEEMDAN-LSTM. Front. Energy Res. 2022, 9, 793413. [Google Scholar] [CrossRef]
- Noh, S.-H. Predicting Future Promising Technologies Using LSTM. Informatics 2022, 9, 77. [Google Scholar] [CrossRef]
- Xuemei, L.; Cao, Y.; Wang, J.; Dang, Y.; Kedong, Y. A Summary of Grey Forecasting and Relational Models and Its Applications in Marine Economics and Management. Mar. Econ. Manag. 2019, 2, 87–113. [Google Scholar] [CrossRef]
- Balochian, S.; Baloochian, H. Improving Grey Prediction Model and Its Application in Predicting the Number of Users of a Public Road Transportation System. J. Intell. Syst. 2021, 30, 104–114. [Google Scholar] [CrossRef]
- Deng, J. Introduction to Grey System Theory. J. Grey Syst. 1989, 1, 1–24. [Google Scholar]
- Lin, X.; Zhu, X.; Feng, M.; Han, Y.; Geng, Z. Economy and Carbon Emissions Optimization of Different Countries or Areas in the World Using an Improved Attention Mechanism Based Long Short Term Memory Neural Network. Sci. Total Environ. 2021, 792, 148444. [Google Scholar] [CrossRef] [PubMed]
- Xie, N.; Liu, S. Research on evaluations of several grey relational models adapt to grey relational axioms. J. Syst. Eng. Electron. 2009, 20, 304–309. [Google Scholar]
- Chen, N. Analysis of the Correlation between Cross-Border E-Commerce and Economic Growth Based on Hierarchical Multilevel Gray Evaluation Model. J. Math. 2022, 2022, e8455404. [Google Scholar] [CrossRef]
- Li, X.; Liao, X.; Tan, X.; Wang, H. Using Grey Relational Analysis to Evaluate Resource Configuration and Service Ability for Hospital on Public Private Partnership Model in China. Grey Syst. Theory Appl. 2014, 4, 260–272. [Google Scholar] [CrossRef]
- Patil, A.; Gaurish, W.; Mahesh, G. Grey relation analysis methodology and its application. Res. Rev. Int. J. Multidiscip. 2019, 4, 409–411. [Google Scholar] [CrossRef]
- Merino-Saum, A.; Baldi, M.G.; Gunderson, I.; Oberle, B. Articulating Natural Resources and Sustainable Development Goals through Green Economy Indicators: A Systematic Analysis. Resour. Conserv. Recycl. 2018, 139, 90–103. [Google Scholar] [CrossRef]
- Szeles, M.R.; Simionescu, M. Regional Patterns and Drivers of the EU Digital Economy. Soc. Indic. Res. 2020, 150, 95–119. [Google Scholar] [CrossRef]
- Brockova, K.; Rossokha, V.; Chaban, V.; Zos-Kior, M.; Hnatenko, I.; Rubezhanska, V. Economic mechanism of optimizing the innovation investment program of the development of agro-industrial production. Manag. Theory Stud. Rural Bus. Infrastruct. Dev. 2021, 43, 129–136. [Google Scholar] [CrossRef]
- Adamowicz, M. Green Deal, Green Growth and Green Economy as a Means of Support for Attaining the Sustainable Development Goals. Sustainability 2022, 14, 5901. [Google Scholar] [CrossRef]
- Bikmetova, Z.M.; Degtyareva, V.V.; Makkaeva, R.S.A. Innovative Development of the Digital Economy: A View of Sustainability. In Sustainable Development of Modern Digital Economy: Perspectives from Russian Experiences; Springer International Publishing: Cham, Switzerland, 2021; Available online: https://link.springer.com/chapter/10.1007/978-3-030-70194-9_28 (accessed on 19 April 2023).


| Indicators | CRITIC | Entropy | Combined Weights |
|---|---|---|---|
| G11 | 0.0647 | 0.0625 | 6.36% |
| G12 | 0.0335 | 0.0539 | 4.37% |
| G13 | 0.0865 | 0.0468 | 6.67% |
| G14 | 0.0298 | 0.0507 | 4.03% |
| G21 | 0.0694 | 0.0454 | 5.74% |
| G22 | 0.0659 | 0.0361 | 5.10% |
| G23 | 0.0334 | 0.0486 | 4.10% |
| G24 | 0.0294 | 0.0517 | 4.06% |
| G31 | 0.0299 | 0.0288 | 2.94% |
| G32 | 0.0619 | 0.0400 | 5.10% |
| G33 | 0.0652 | 0.0291 | 4.72% |
| G34 | 0.0436 | 0.0495 | 4.66% |
| G35 | 0.0395 | 0.0289 | 3.42% |
| G36 | 0.0416 | 0.0402 | 4.09% |
| G37 | 0.0858 | 0.0711 | 7.85% |
| G38 | 0.0326 | 0.0517 | 4.22% |
| G41 | 0.0323 | 0.052 | 4.22% |
| G42 | 0.028 | 0.043 | 3.55% |
| G43 | 0.0393 | 0.0427 | 4.10% |
| G44 | 0.0332 | 0.0487 | 4.10% |
| G45 | 0.0288 | 0.0431 | 3.60% |
| G46 | 0.0259 | 0.0351 | 3.05% |
| G51 | 0.0300 | 0.0439 | 3.70% |
| G52 | 0.0356 | 0.0567 | 4.62% |
| G61 | 0.0315 | 0.0553 | 4.34% |
| G62 | 0.0375 | 0.0621 | 4.98% |
| G63 | 0.0315 | 0.0581 | 4.48% |
| G64 | 0.0526 | 0.0392 | 4.59% |
| G65 | 0.0324 | 0.0508 | 4.16% |
| G71 | 0.0664 | 0.0283 | 4.74% |
| G72 | 0.0971 | 0.0333 | 6.52% |
| G73 | 0.0652 | 0.0827 | 7.40% |
| G74 | 0.0938 | 0.0275 | 6.07% |
| G75 | 0.0426 | 0.0245 | 3.36% |
| G76 | 0.0438 | 0.0654 | 5.46% |
| G77 | 0.0605 | 0.0735 | 6.70% |
| G81 | 0.0523 | 0.0509 | 5.16% |
| G82 | 0.0408 | 0.0516 | 4.62% |
| G83 | 0.0800 | 0.0544 | 6.72% |
| G84 | 0.0335 | 0.0506 | 4.21% |
| G85 | 0.0727 | 0.0914 | 8.21% |
| G91 | 0.1527 | 0.0618 | 10.73% |
| G92 | 0.1264 | 0.1053 | 11.59% |
| G93 | 0.1100 | 0.0991 | 10.46% |
| G94 | 0.1217 | 0.2786 | 20.02% |
| G95 | 0.1532 | 0.0584 | 10.58% |
| G96 | 0.1171 | 0.2396 | 17.84% |
| G97 | 0.1191 | 0.1059 | 11.25% |
| G98 | 0.0998 | 0.0513 | 7.56% |
| Indicators | CRITIC | Entropy | Combined Weights |
|---|---|---|---|
| D11 | 0.0474 | 0.041 | 4.42% |
| D12 | 0.0298 | 0.0334 | 3.16% |
| D13 | 0.0290 | 0.0493 | 3.92% |
| D14 | 0.0291 | 0.0501 | 3.96% |
| D15 | 0.0280 | 0.0262 | 2.71% |
| D21 | 0.0326 | 0.0692 | 5.09% |
| D22 | 0.0261 | 0.0436 | 3.49% |
| D23 | 0.0967 | 0.1136 | 10.52% |
| D24 | 0.0869 | 0.0261 | 5.65% |
| D25 | 0.0299 | 0.0369 | 3.34% |
| D26 | 0.0257 | 0.0288 | 2.73% |
| D27 | 0.0499 | 0.0241 | 3.70% |
| D31 | 0.0284 | 0.0444 | 3.64% |
| D32 | 0.0305 | 0.0629 | 4.67% |
| D33 | 0.0271 | 0.0261 | 2.66% |
| D34 | 0.0372 | 0.0233 | 3.03% |
| D35 | 0.0294 | 0.0437 | 3.66% |
| D36 | 0.0401 | 0.0874 | 6.38% |
| D41 | 0.0333 | 0.0605 | 4.69% |
| D42 | 0.0243 | 0.0259 | 2.51% |
| D51 | 0.1299 | 0.0329 | 8.14% |
| D52 | 0.0531 | 0.0203 | 3.67% |
| D53 | 0.0555 | 0.0302 | 4.29% |
| Year | Digital Economy Predict | Forecast Data | Residuals Error | Simulation Error | Green Economy Predict | Forecast Data | Residuals Error | Simulation Error |
|---|---|---|---|---|---|---|---|---|
| 2008 | 0 | 0 | 0 | 0 | 0.261 | 0.261 | 0.000 | 0.000 |
| 2009 | 0.11 | 0.178 | −0.068 | 0.621 | 0.241 | 0.319 | −0.078 | 0.324 |
| 2010 | 0.2 | 0.203 | −0.003 | 0.016 | 0.269 | 0.343 | −0.074 | 0.275 |
| 2011 | 0.293 | 0.231 | 0.062 | 0.210 | 0.336 | 0.369 | −0.033 | 0.097 |
| 2012 | 0.321 | 0.264 | 0.057 | 0.179 | 0.403 | 0.396 | 0.007 | 0.017 |
| 2013 | 0.254 | 0.3 | −0.046 | 0.183 | 0.447 | 0.426 | 0.021 | 0.048 |
| 2014 | 0.384 | 0.342 | 0.042 | 0.109 | 0.489 | 0.458 | 0.031 | 0.064 |
| 2015 | 0.335 | 0.39 | −0.055 | 0.164 | 0.527 | 0.492 | 0.035 | 0.067 |
| 2016 | 0.429 | 0.444 | −0.015 | 0.036 | 0.55 | 0.529 | 0.021 | 0.039 |
| 2017 | 0.529 | 0.506 | 0.023 | 0.043 | 0.591 | 0.568 | 0.023 | 0.039 |
| 2018 | 0.589 | 0.577 | 0.012 | 0.021 | 0.646 | 0.611 | 0.035 | 0.055 |
| 2019 | 0.655 | 0.657 | −0.002 | 0.003 | 0.69 | 0.656 | 0.034 | 0.049 |
| 2020 | 0.738 | 0.749 | −0.011 | 0.014 | 0.729 | 0.705 | 0.024 | 0.033 |
| 2021 | 0.822 | 0.853 | −0.031 | 0.038 | 0.722 | 0.758 | −0.036 | 0.050 |
| 2022 | 1 | 0.972 | 0.028 | 0.028 | 0.731 | 0.815 | −0.084 | 0.114 |
| 2023E | - | 1.107 | - | - | - | 0.875 | - | - |
| 2024E | - | 1.262 | - | - | - | 0.941 | - | - |
| 2025E | - | 1.437 | - | - | - | 1.011 | - | - |
| 2026E | - | 1.638 | - | - | - | 1.087 | - | - |
| 2027E | - | 1.866 | - | - | - | 1.168 | - | - |
| Year | G-Grey Forecast | G-LSTM Forecast | G-Comprehensive Forecast Results | G-Grey Forecast | G-LSTM Forecast | G-Comprehensive Forecast Results |
|---|---|---|---|---|---|---|
| 2023E | 0.875 | 0.715 | 0.860 | 1.107 | 1.079 | 1.104 |
| 2024E | 0.941 | 0.728 | 0.922 | 1.262 | 1.124 | 1.246 |
| 2025E | 1.011 | 0.739 | 0.986 | 1.437 | 1.161 | 1.404 |
| 2026E | 1.087 | 0.748 | 1.056 | 1.638 | 1.190 | 1.585 |
| 2027E | 1.168 | 0.756 | 1.131 | 1.866 | 1.214 | 1.789 |
Disclaimer/Publisher’s Note: The statements, opinions and data contained in all publications are solely those of the individual author(s) and contributor(s) and not of MDPI and/or the editor(s). MDPI and/or the editor(s) disclaim responsibility for any injury to people or property resulting from any ideas, methods, instructions or products referred to in the content. |
© 2023 by the authors. Licensee MDPI, Basel, Switzerland. This article is an open access article distributed under the terms and conditions of the Creative Commons Attribution (CC BY) license (https://creativecommons.org/licenses/by/4.0/).
Share and Cite
Xu, G.; Peng, S.; Li, C.; Chen, X. Synergistic Evolution of China’s Green Economy and Digital Economy Based on LSTM-GM and Grey Absolute Correlation. Sustainability 2023, 15, 14156. https://doi.org/10.3390/su151914156
Xu G, Peng S, Li C, Chen X. Synergistic Evolution of China’s Green Economy and Digital Economy Based on LSTM-GM and Grey Absolute Correlation. Sustainability. 2023; 15(19):14156. https://doi.org/10.3390/su151914156
Chicago/Turabian StyleXu, Guoteng, Shuai Peng, Chengjiang Li, and Xia Chen. 2023. "Synergistic Evolution of China’s Green Economy and Digital Economy Based on LSTM-GM and Grey Absolute Correlation" Sustainability 15, no. 19: 14156. https://doi.org/10.3390/su151914156