Article

How Do Green Investments, Foreign Direct Investment, and Renewable Energy Impact CO2 Emissions? Measuring the Role of Education in E-7 Nations

1
School of Economics, Zhejiang University, Hangzhou 310000, China
2
Hangzhou Finance and Investment Group CO., Ltd., Hangzhou 310000, China
3
Department of Political Science, University of Management and Technology, Lahore 54792, Pakistan
*
Author to whom correspondence should be addressed.
Sustainability 2023, 15(19), 14052; https://doi.org/10.3390/su151914052
Submission received: 22 August 2023 / Revised: 14 September 2023 / Accepted: 19 September 2023 / Published: 22 September 2023

Abstract

:
The COP27 conference establishes fresh objectives for global economies to achieve the goals outlined in the Paris Agreement, which are centered on reducing carbon (CO2) emissions and constraining the rise in global temperatures to 1.5 °C. In this background, this study looks at how education has affected CO2 emissions, the economy, the use of renewable energy, green investments, and foreign direct investment in the E-7 countries from 2000 to 2021. Two unit root tests, CADF and CIPS, were used to gauge the data’s stationarity. The long-run coefficients were identified using the momentum quantile regression approach. The empirical results show a cointegration of the variables. Long-term CO2 emissions are influenced by a variety of factors, including foreign direct investment, economic growth, green investments, and education. The outcomes of reliable statistics provide support for the overall empirical study of groups and the economy. The results also suggest that there is a significant increase in education, leading to a reduction in CO2 emissions across long time periods. Additionally, the E-7 countries should place a high priority on boosting the use of renewable energy and investing in the expansion of higher education for sustainable development. To mitigate the rise in carbon dioxide emissions (CO2em), it is recommended that the governments of the E-7 nations take measures to promote the adoption of green investments. Governments must prioritize their efforts to ensure that green financing policies are able to complement environmental welfare policies and green growth policies.

1. Introduction

The issue of environmental degradation has emerged as a pervasive global concern [1,2]. Consequently, authors have expanded their investigations into environmental studies to mitigate the adverse repercussions and safeguard the integrity of the planet’s ecosystem. In the context of national priorities, the fundamental goal of any nation is to enhance its economic progress (GDP) rate to foster social welfare. In this scenario, the occurrence of swift GDP can lead to the reduction of resources and the exacerbation of the environment [3]. Sustainable GDP in developing nations improves society. Trade, development, foreign direct investment (FDI), and natural resource (NAT) development have been used to achieve this goal. Production increases energy use and CO2 emissions (CO2em). GDP must not harm future generations [4,5].
It is evident that emerging economies such as the E-7 nations (Brazil, India, China, Indonesia, Mexico, Russia, and Turkey) still have a considerable distance to traverse to achieve sustainable development [6]. The rapid economic development of the E-7 countries has positioned them as significant contributors to global decision-making processes. The countries mentioned in the study conducted by [7] represent a significant proportion, exceeding 42% of the global fossil fuel consumption, surpassing the consumption of the G7 countries. Furthermore, as stated in the “Global CO2 Emissions Report 2019”, developed economies experienced an average GDP rate of 1.7% in 2019. However, it is noteworthy that there was a notable decline of 3.2% in total energy-related CO2 emissions during the same period. Nevertheless, it is worth noting that the electric power sector has played a significant role in the reduction of emissions, accounting for approximately 36% of energy-related emissions in developed economies. In contrast, in E7 countries, this sector is responsible for more than 47% of CO2 emissions. Consequently, the E7 nations are assuming a progressively significant role in the global energy market and climate change, encompassing both carbon dioxide emissions and energy consumption. According to [8], the present predicament faced by E7 countries revolves around the identification of dependable and cost-effective energy alternatives to supplant fossil fuel-based energy sources, all the while mitigating the release of greenhouse gas emissions. Accordingly, emission-mitigation measures must be implemented globally considering the alarming rate of increase in global CO2 emissions [9,10]. More crucially, it has been well postulated in the literature [11] that greening certain macroeconomic measures can help to decouple CO2 emissions from economic growth. Purchasing environmentally friendly supplies is crucial in this context. Ref. [12] suggest that any investment associated with equity should be classified as a green investment (GF). The flow of capital is directed, and establishments are encouraged to actively invest in green projects, which are essential for environmental protection, resource conservation, and economic development [13,14].
Environmental degradation is largely attributed to GDP [15,16]. However, conventional wisdom holds that early GDP harms the environment but later restores it [17]. The impact of GDP on climate change has been found to be predominantly negative. However, there are several strategies that can be implemented to mitigate this impact [18,19,20,21]. The paramount consideration lies in the necessity for both individuals and society to collaboratively undertake concerted endeavors to alleviate these effects [22]. The significance of a well-educated society should be acknowledged considering its proactive endeavors to safeguard the environment [23]. Education plays a substantial role in fostering economic development through diverse channels. In broad terms, a society that possesses a high level of education is better equipped to confront a wide range of challenges [24]. Education is society’s most prized tool for learning new skills and adapting to new technologies [25]. Several researchers examined education’s impact on the environment. Ref. [26] found that education is the environmental connection threshold. Secondary education improves environmental quality empirically. Ref. [27] proposed an education level at which nations start to see a significant positive impact on CO2em. Thus, education boosts GDP, technological innovation, and production energy source discovery.
The existing body of research examines the correlation between FDI and GDP, the association between renewable energy (RE) consumption and GDP, and the causal connection among GDP, RE consumption, green investments, and CO2 emissions. Nevertheless, the existing body of research on the moderating role of higher education is relatively scarce. E7 countries exhibit a significant correlation with respect to energy demand, CO2 emissions, and population levels in comparison to other countries globally. However, there is a scarcity of research studies addressing the current situation in these countries. At present, there exists a dearth of comprehensive empirical studies examining the effects of GDP, RE, FDI, and green investments on carbon emissions, while also considering the controlling influence on education within the E-7 countries. Hence, the present study aims to enhance the analysis by incorporating crucial factors pertaining to interconnectivity through the utilization of an E-7 panel dataset spanning the years 2000 to 2021. For analysis, this work uses the MMQR model. MMQR panel estimation examines the relationship concerning variables across multiple quantiles. The technique by Roger Koenker (2001) [28] is generally used to approximate the linkages between several factors at different quantiles. Quantile regression is a statistical method that is resistant to the influence of outliers and generates effective estimates for datasets with heavy tails.
This research yields three primary contributions. Firstly, it employs robust estimators, which are analytically appropriate, in its analysis of panel data. Furthermore, the independent variable “portfolio” exhibits variation that differs from that observed in prior studies. Moreover, a clearly defined experimental model is utilized. This study utilizes up-to-date data to obtain empirical findings, with the aim of helping governments and policymakers in the formulation of effective public policies in E-7 countries. Additionally, this measure will contribute to the enhancement of GDP in these economies.
The structure of this work is as follows: after the introduction, the literature review is in Section 2, while the data and methodology are in Section 3. The results and discussion are in Section 4, and the conclusion is in Section 5.

2. Background Literature

2.1. CO2em and Renewable Energy

Since RE technology is long-lasting and widely available, the authors of [29] recommended using it to reduce environmental degradation. Ref. [29] found that RE reduces environmental degradation and is sustainable. Countries need to increase RE consumption to reduce environmental damage. RE fuels industrialization, potentially improving the environment [30]. RE is more environmentally friendly than fossils [31]. The exponential growth in the utilization of RE sources plays a crucial role in mitigating the adverse environmental consequences [32]. Prior research has examined the relationship between RE consumption and its impact on CO2 emissions, GDP, and environmental pollution [33].
The topic of RE has been extensively discussed and analyzed in various academic studies [34]. For example, Ref. [35] have demonstrated a significant positive relationship between carbon dioxide (CO2) and RE.
In a similar vein, Ref. [36] conducted an empirical examination of the relationship between RE and CO2em in China. The study utilized a dataset spanning the years 1980 to 2016, employing the Environmental Kuznets Curve (EKC) framework. The findings of the study indicate that the implementation of RE leads to a significant reduction in carbon dioxide emissions. Ref. [37] examined RE and CO2em in the countries by using the Fourier autoregressive distributed lag (ARDL) cointegration, and found that RE lowers CO2 in the BRICS economies. Ref. [38] used GS2SLS to examine RE and CO2 emissions from 1995 to 2014, and found that RE predicts CO2 emissions because RE causes them. Ref. [39] used a novel QQ approach to study CO2 and RE in the US. They found that RE reduces CO2 emissions. Finally, Ref. [40] found that RE reduces CO2 emissions in Argentina while non-RE increases them.
While these research studies highlight the significant importance of RE for fostering GDP, several other research studies argue that the utilization of RE sources hinders GDP. Abbasi et al., 2020 and Baz et al., 2021 [41,42] conducted empirical investigations on various groups, including developed and developing economies, across different time periods. Their data analysis indicated that the slower GDP rate in these areas could be attributed to the utilization of RE sources. The relationship has generated conflicting arguments, leading to a renewed examination of this connection in emerging economies like BRICS.

2.2. CO2em and Economic Progress

The increase in global carbon dioxide (CO2) emissions is significantly influenced by recent economic development [43]. The E-7 countries are experiencing a significant transformation in their economic structure, resulting in a detrimental rise in CO2em. Coal is the predominant source of energy in South Africa, thereby presenting a substantial risk to air quality. Similarly, Russia is heavily dependent on the steel, oil, and coal sectors, resulting in a significant escalation of CO2em across the nation. Russia is positioned as the fifth highest emitter of greenhouse gases per capita globally.
Numerous contemporary studies have investigated the correlation between GDP and CO2em. Hence, the empirical findings exhibit inconsistency when considering various factors such as the countries under investigation, the timeframe of the study, the approaches employed, and the techniques utilized. Ref. [44] utilized the wavelet method to investigate the relationship between CO2em and economic progress. A positive linkage was observed between the levels of CO2 emissions in Indonesia and the country’s economic development. Similarly, Ref. [45] gathered data spanning from 1971 to 2016 to analyze the influence of CO2em on the GDP of China. The researchers discovered that there is a positive correlation between GDP and CO2em across quantiles (0.1–0.95) when employing the QQR technique. This suggests that the rapid GDP in China has detrimental effects on the environment. In a similar vein, Ref. [46] conducted a study utilizing data spanning from 1971 to 2017. They employed a unique two-gap methodology to examine the relationship between GDP and CO2 emissions in Turkey. The researchers discovered that the pro-growth policy implemented in Turkey is responsible for the environmental degradation observed within the nation.
Furthermore, Ref. [47] utilized frequency domain causality and innovative two-gap methodologies to examine the relationship between CO2em and GDP in Mexico. The findings demonstrate a positive correlation between the growth of Mexico’s economy and the escalation of environmental degradation within the country. In contrast, several research findings indicate a negative correlation between GDP and CO2em. Ref. [48] utilized a novel quantile-on-quantile methodology to investigate the association between GDP and CO2 emissions in Sweden, using a dataset spanning the years 1965 to 2019. The researchers discovered that the economic expansion observed in Sweden is associated with a reduction in CO2em, suggesting the presence of sustainable growth within the nation.

2.3. CO2em and Green Investments

The term “green investments (GF)” refers to services and goods that have an impact on the environment. According to [49], the implementation of GF has been found to reduce energy limitations, leading to favorable outcomes in terms of CO2em and economic progress. Countries across the globe have commenced allocating financial resources towards diverse green initiatives to facilitate the realization of green GDP. The implementation of these initiatives is closely linked to the preservation of the environment and the achievement of desired outcomes [50]. Ref. [51] proposes the implementation of various advanced technologies to ensure sustainable development. The implementation of green financing for diverse projects can facilitate stakeholders in allocating their research and development funds towards matters pertaining to environmental sustainability [52]. Additionally, the implementation of green financing can help mitigate the financial constraints, enabling stakeholders to make investments in sustainable practices.
GF facilities can help private firms meet these goals [53]. Thus, green financing may make balancing economic development and environmental protection harder. Although important, the relationship between GF and environmental degradation is unexplored. Stakeholders (regulators/governments/organizations) who profit from environmental policies may strategically participate in green financing. Stakeholders must understand GF’s benefits. Green financing may depend on environmental improvement [54]. Ref. [55] predicted that GF could reduce fossil fuel consumption by 2.5% by 2030. They also found that RE will generate 46% of global electricity. The authors of [56] used a fixed-effects model to study the association between digital finance and innovation in urban areas utilizing city-level panel data collected in 268 Chinese cities from 2011 to 2019. They found that urban innovation can be effectively increased by digital finance, yet there are notable variations in several areas. Moreover, towns with varying degrees of commercial attractiveness exhibit varied effects of financial technology on urban innovation. The promotional effect of digital money on urban innovation is moderated by the availability of traditional finance. Moreover, in [57] the authors developed a comprehensive measurement for assessing the level of corporate environmental responsibility (CER) engagement. This measurement is utilized to investigate the correlation between CER engagement and firm value. Additionally, the researchers aimed to explore the potential mediating role of corporate innovation in this relationship. The study was conducted using a sample of 496 companies listed on China’s A-share market, spanning the period from 2008 to 2016. The findings indicate that the implementation of environmental rules by enterprises initially leads to a decrease in firm value. However, at a certain threshold, the adoption of these policies begins to have a beneficial impact on firm value. Furthermore, it is worth noting that corporate innovation serves as a mediator in the correlation between corporate environmental responsibility (CER) and business value. The implementation of corporate innovation initiatives has been found to have a greater positive impact on the overall value of organizations that possess a Corporate Entrepreneurship Readiness (CER) compared to firms that lack such readiness.
GF includes any production-efficiency-boosting expenditure. Unexpectedly little research has been done on the association between GF and the environment. The impact of GF on CO2 emissions and RE, however, is rarely highlighted in research. For instance, GF significantly affects sustainable development [58]. According to [59], CO2 emissions are decreased by private investment in environmentally friendly projects. Additionally, such investment aids developing nations in embracing a green mindset [60]. According to [61], the contemporary media landscape has the potential to incentivize environmentally detrimental firms to address the expectations of their stakeholders and make substantial advancements in their adoption of sustainable technology. The utilization of diverse environmental regulatory instruments, such as pollution charges and environmental protection subsidies, can have a collective positive impact on the advancement of green technological innovation within corporations. This is achieved through the combined influence of pushback and compensation effects. Furthermore, the implementation of effective environmental regulation tools can strengthen the relationship between the government and enterprises, and enhance the preparedness of heavily polluting enterprises in terms of resources and dynamic capabilities to effectively address public opinion crises. Consequently, this can serve as a moderating factor in the promotion of new media environments, ultimately fostering corporate green technological innovation. Additionally, the impact of the digital economy on national-level industrial eco-efficiency is predominantly positive, with a decrease in marginal returns. The impact of the internet economy on industrial eco-efficiency exhibits considerable variation across different regions. The impact of the digital economy on corporate eco-efficiency is found to be notably good in eastern regions, but it is observed to be detrimental in western regions. The impact of the digital economy on corporate eco-efficiency in China is shown to be negligible, suggesting the presence of digital isolation [62]. The concept of green finance encompasses various interconnected principles. This work provides a concise description of the global events that have contributed to the evolution of green finance, the common forms and instruments utilized in this field, the regulatory framework and issuance process associated with these instruments, and the diverse international agencies and organizations involved in the development and implementation of green finance schemes for specific beneficiary projects [63].

2.4. CO2em and FDI

In a recent study by [64], it has been proposed that world economics aims to enhance its economic prospects through the adoption of a multidimensional approach to globalization. Financial globalization and GDP are closely associated with various forms of globalization.
Hence, it can be argued that financial globalization is accountable for the concurrent escalation of GDP and environmental degradation, as evidenced by the increased influx of FDI [65]. According to [66], financial globalization emerges as a prominent factor in the examination of environmental quality. Nevertheless, it is worth noting that financial investments can serve as a catalyst for industrialization, which in turn may result in adverse environmental consequences such as increased degradation and pollution [67].
In [68], among other recent studies, the authors contend that FDI promotes GDP. Additionally, it generates employment opportunities and makes international technology transfers easier. Moreover, international trade activities raise CO2 emissions globally despite environmental agreements [69]. Furthermore, many nations that support financial globalization strategies to achieve globalization-driven GDP view the global FDI data as a significant predictor of CO2 emissions). However, one of the major worries about FDI investments is the potential harm to environmental quality [70]. Since the negative impacts of FDI investments on environmental degradation are disregarded, the economic prospects associated with FDI investments are not maintainable [71]. FDI inflow, mostly via technology routes, positively impacts the climate [72]. Ref. [72] found that FDI boosts GDP and reduces CO2em. Current research shows that GDP and energy use degrade the environment, but RE and trade via FDI may mitigate these effects.
More usage of RE and FDI information reduce environmental pollution in the American and Asian regions. Ref. [73] conducted an empirical investigation of the association between FDI and environment in China. They found that GDP brought on by FDI enhances the environment by reducing fossil fuel consumption and increasing efficiency. Therefore, one can discuss the economic impact of FDI information on the environment.

2.5. CO2em and Education

Because education has so many implications for the advancement of knowledge and technology, many people think that the growth of a nation is inversely correlated with the caliber of its education arrangement. Previous findings from research studies already conducted represent two distinct areas of investigation.
While the later feature of the research work bases the positive effect of education in lowering CO2em, the first aspect emphasizes performances that create high CO2em. The first group of proponents argues that because higher education institutions offer a wide range of academic activities, education is to blame for rising CO2em.
Ref. [74] conducted a recent study in Spain wherein they developed a metric to quantify emission activities within a university campus. The study conducted by the researchers revealed that the average CO2em produced by individuals attending educational institutions in the United States amounted to approximately 41 metric tons per person, specifically attributed to transportation activities on campus. Ref. [75] conducted a study in Spain utilizing a dataset spanning from 2011 to 2014. Their findings revealed a consistent trend in CO2 emissions, with approximately 0.55t CO2 attributed to various on-campus activities within higher education institutions. Ref. [76] argue that the implementation of online education is imperative to mitigate CO2 emissions within the higher education sector, thereby reducing the global and regional carbon footprint. This phenomenon occurs because of the significant carbon dioxide emissions stemming from the frequent transportation undertaken by employees and students within the Dutch institutions under examination. The average CO2em per person resulting from housing, mobility, air transportation, food, and consumption were approximately 10.9 metric tons of CO2. Nevertheless, the heat emissions produced by students were minimal.
The 2nd part of the investigation confirms education’s positive impact on CO2 emissions using various methods tailored to individual nations. Ref. [77] estimated China’s education’s CO2 emissions percentage. Higher education affects national and regional environments along with other demographic structures. In another Chinese region, higher education was negatively correlated with CO2 emissions. The ratio was calculated from the 6+ student percentage. Ref. [78] examined education, environmental pollution, and poverty in 22 developing countries using panel data. Their results show that education reduced the negative impacts of the environment. Ref. [79] found that a year of environmental programs reduced CO2em by 2.86 tons. They stressed environmental efforts.
After discussing the literature review, it is evident that very few studies investigated the impacts of education, renewable energy, and green investment on CO2 emissions in E-7 countries. Most of studies have considered human capital and very few of them consider education expenditures for other regions. Therefore, to contribute to the literature and for updated evidence, this work adds education as a moderator in the linkages of green investment, renewable energy, FDI, GDP, and CO2 emissions in E-7 nations.

2.6. Theoretical Framework

This study investigates a variety of factors, including economic growth, educational spending, energy from renewable sources, green investments, and foreign direct investment, that affect CO2 emissions. CO2 emissions are typically positively impacted by economic growth. High-growth economies frequently see rising income levels among their citizens, which encourages more consumption and ultimately raises CO2 emissions. Economies are expanding their economic activity by utilizing renewable and non-renewable energy. These economic activities are making different countries increase FDI. These activities are contaminating the air quality [80]. Environmental awareness is among the fundamental factors that can speed up the carbon neutrality process. Through education, environmental awareness can be spread and pollution can be controlled [81]. For instance, Ref. [82] looked at how education significantly lowers CO2 emissions in society. Furthermore, a proposed research model [83] revealed a significant relationship between GF and CO2 emissions. According to a research model [24], RE lowers CO2 emissions at both the governmental and personal levels. The promotion and advancement of GDP in emerging economies, such as the E-7 countries, is greatly aided by FDI.
The research model shows that, among other factors, GDP encourages business expansion and FDI in an economy. According to [84], FDI helps the industrial sector expand and opens job opportunities that increase demand for skilled workers. The government places significant emphasis on allocating resources towards the advancement of education, spanning from primary to tertiary institutions, as well as research facilities and vocational training centers. This strategic investment aims to address the increasing demand for proficient workers in both domestic and international corporations [85]. Broadly speaking, the phenomenon of large-scale expansion elucidates certain energy-economic activities that incur considerably higher costs. This scenario pertains to domains characterized by a substantial increase in both the expansion of educational institutions and the enrollment of students.
For instance, E-7 member nations frequently encounter such experiences. Infrastructure development includes these endeavors as well as the formation and administration of educational services, dorms for students and teachers, and office buildings. Mobility activities can also include staff and student travel to and from classes on or off campus, as well as trips for food, shopping, and medical attention. As was already mentioned, the consumption of non-RE during campus operations significantly raises the carbon footprint.
The acquisition of advanced knowledge, skills, and technologies through education plays a crucial role in facilitating the process of economic development. This, in turn, creates an enabling environment for the adoption of sustainable practices, including the increased utilization of renewable energy sources and the implementation of green financing mechanisms. The expansion of educational standards typically necessitates the allocation of financial resources and the provision of incentives to support innovative and competitive research endeavors aimed at developing alternative energy models, advanced technologies, and patents. The conceptual framework of this work is shown in Figure 1.

3. Data and Methodology

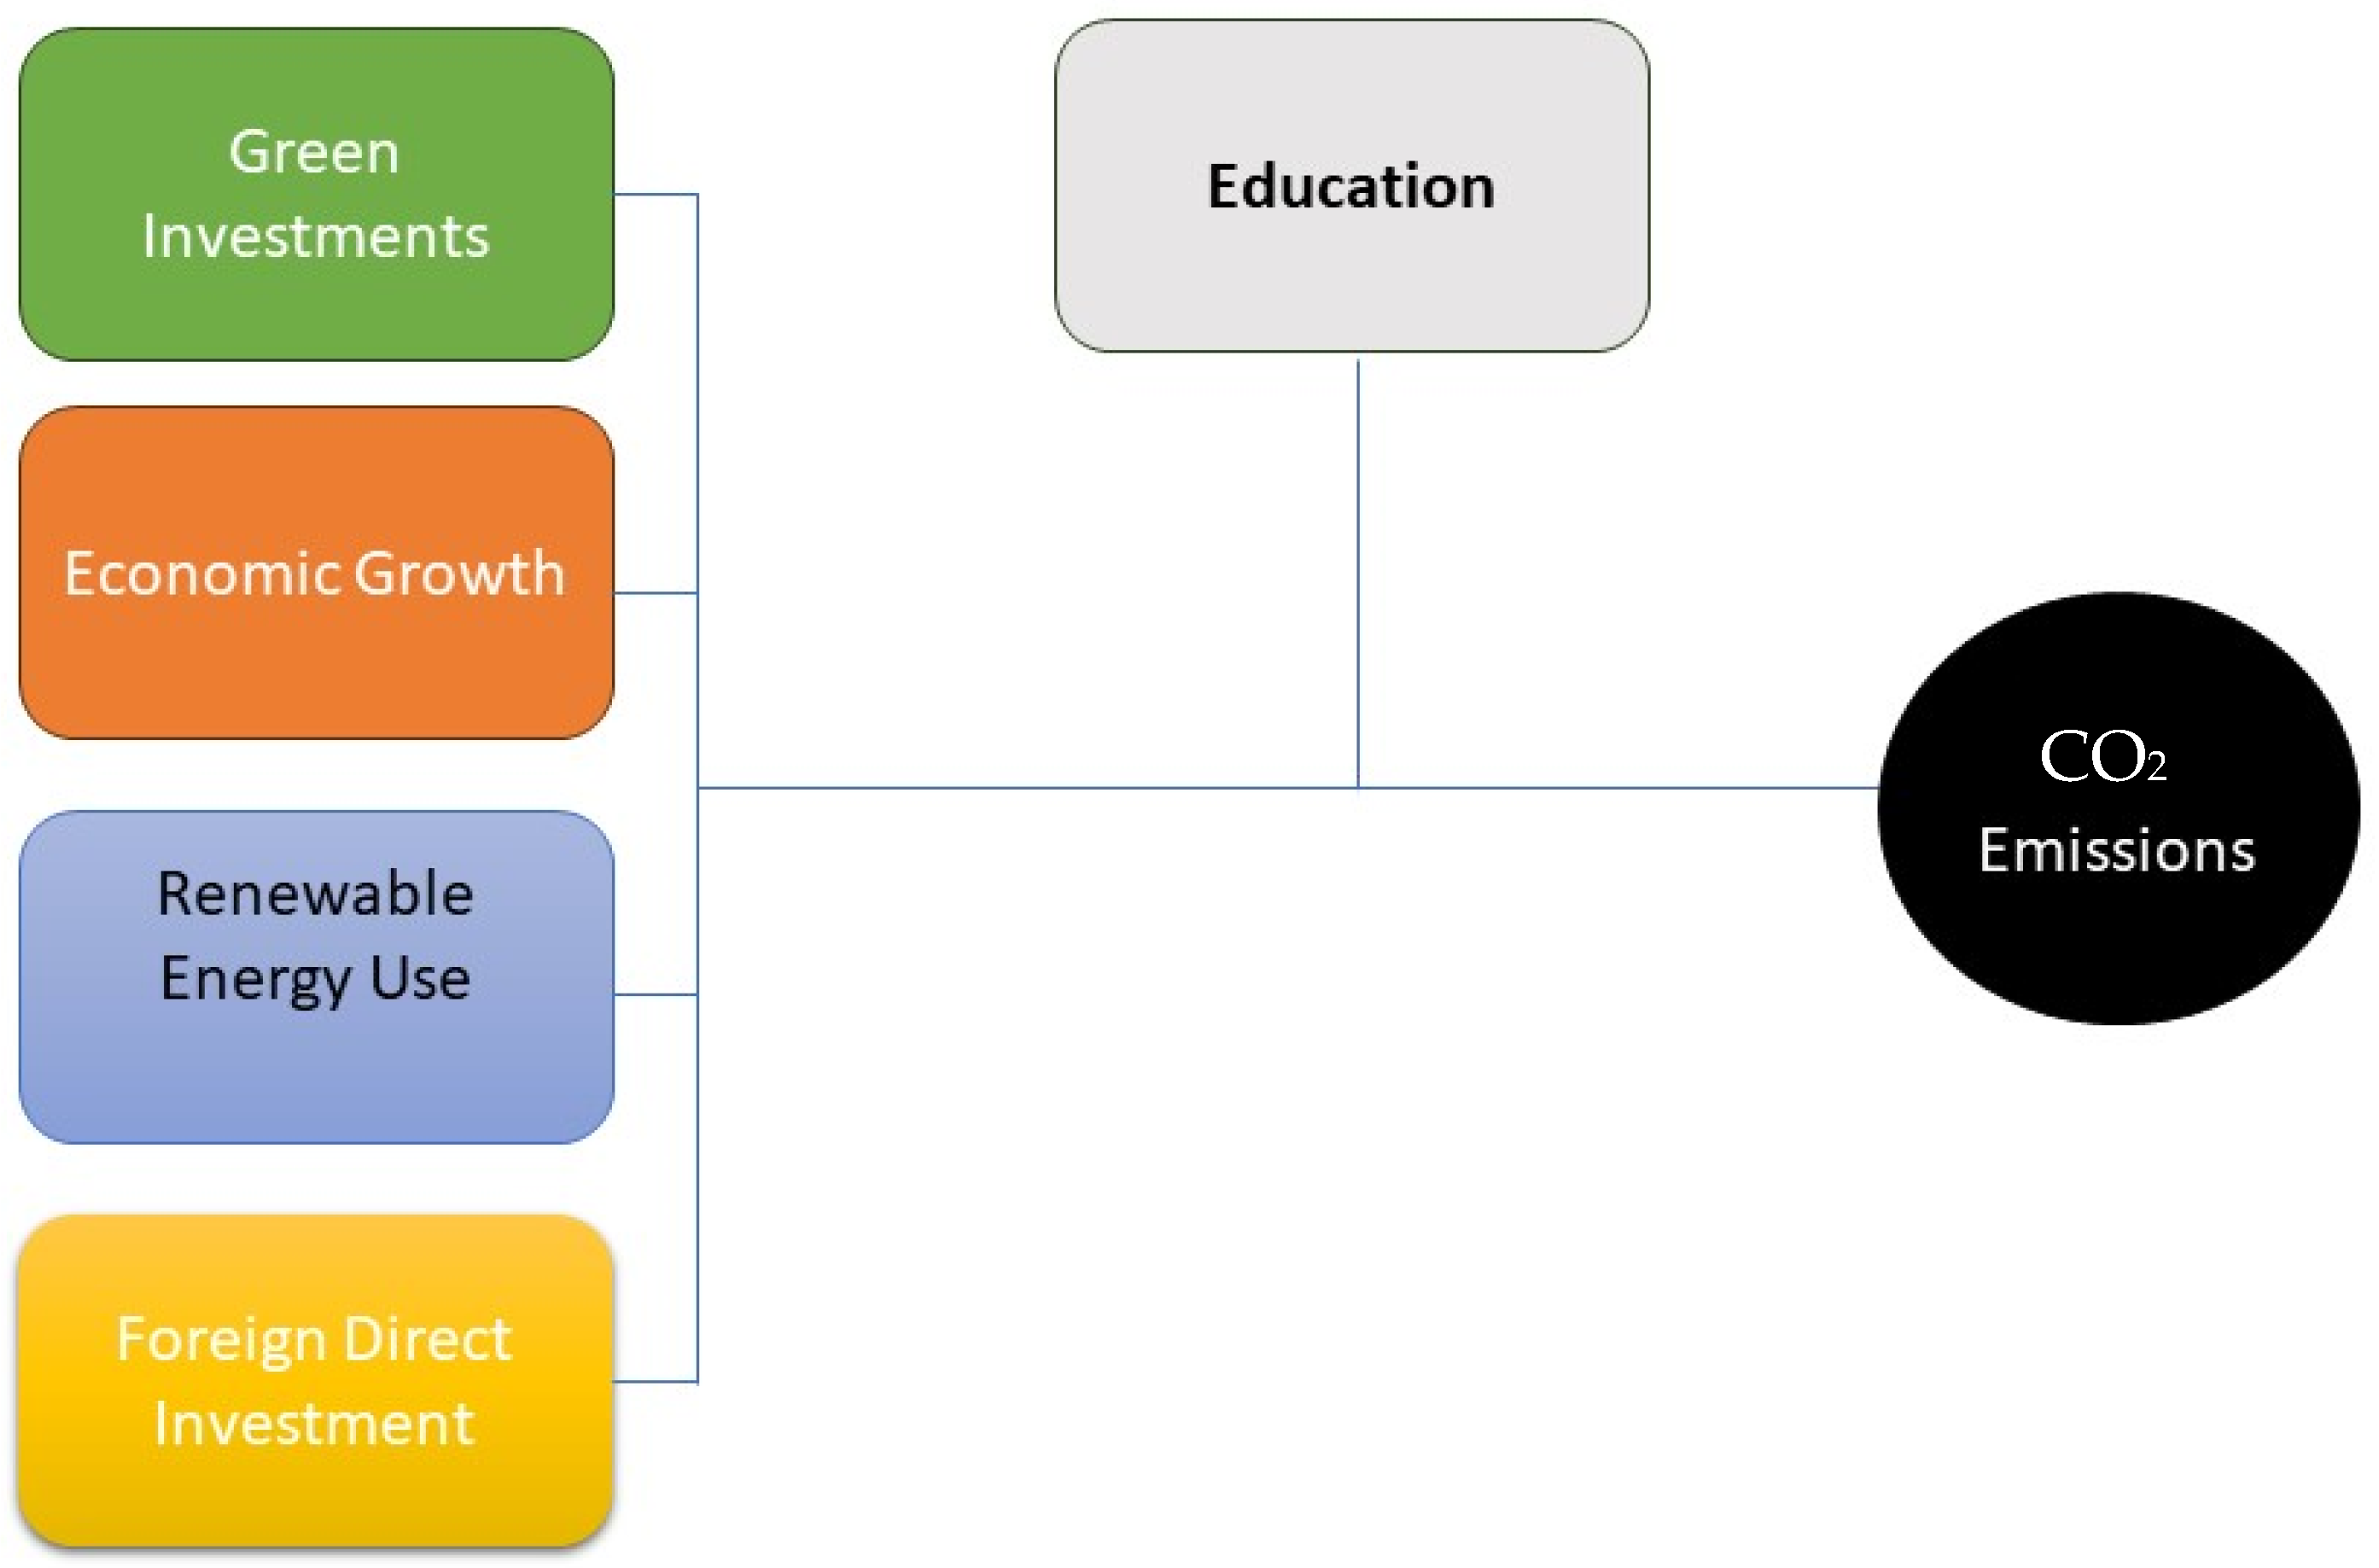
Incorporating the moderating effect of education in the E-7 countries, the underlying research work examines the relationship between economic growth, renewable energy consumption, green investments, foreign direct investment, and CO2em. The E-7 sample shows significant CO2em, and some of these nations are major carbon emitters, which is why the E-7 economies were chosen for investigation. Because there were available data from 2000 to 2021, we used balanced panel data. Economic growth (estimated as GDP per capita), renewable energy consumption (renewable energy consumption as % of total final energy consumption), green investments (a composite index via principal component analysis using the variables of number of patents, energy efficiency, and renewable energy), and foreign direct investment (FDI) are all listed as independent variables. This work follows the work of [86] to construct an index of GF. As a dependent variable, CO2 emissions are included and are expressed as tons of CO2 per capita.
In the analysis, the role of education is used as a moderating variable. Researchers have used a variety of proxies to estimate economic growth based on prior research. Several well-known studies, including [87,88], contend that while many factors influence a nation’s economic growth, GDP per capita can be regarded as a highly reliable indicator. Studies such as [89,90,91] provided guidance for the choice of additional variables and the use of proxy measures. The information for the proposed variables was gathered from several reliable sources. For example, the World Bank’s database was chosen to gather information on FDI information, government spending on education, and GDP per capita. Since the dataset on education contains missing observations, we must first identify these values before we can use a statistical model. These missing values in the dataset are located using the confidence interval method. This method examines each value as it moves from the first to the last element in a sequential order and identifies the observations that are missing. Then, using the mean and standard error of the available observations, it determines the confidence interval using the confidence interval technique. The median of the confidence interval is then used to replace the missing values. The data, their units and sources are mentioned in Table 1.

Methodology

The interdependence among cross-sectional units has garnered significant attention in contemporary literature, resulting in numerous empirical investigations. The reason for this is that residuals exhibit a lack of independence within the actual context. Therefore, interdependence is inherent. The regional economies that are in the E-7 exhibit cross-border interconnections across various domains, including political, economic, social, environmental, and financial spheres. The correlation implies that any empirical inquiry conducted on these economies must consider the presence of cross-sectional dependence (CD). Equation (1) is proposed for the purpose of investigating the CD in the data.
C D T M = T N N 1 2 1 2 ρ ¯ N
The correlation between the parameters is represented by ρN over the time interval T. Furthermore, an inquiry into the heterogeneity present in the slope coefficient has been carried out using the Pesaran and Yamagata (2008) test, which is a revised variant of Swamy’s (1970) test [93]. Equation (2) has been proposed in this context.
Δ ~ A S H = ( N ) 1 2 2 k ( T k 1 ) T + 1 1 2 1 N S ~ 2 k
In the context being discussed, N is used to represent the cross-sectional units, while K is utilized to denote the explanatory variables. Upon conducting an examination of the heterogeneity present in the slope coefficients, analysis has been carried out to determine the order of integration between the variables using both the cross-sectionally augmented IPS (CIPS) test and the cointegration augmented Dickey–Fuller (CADF) test. Nonetheless, it is imperative for researchers to give considerable attention to the matter of outcomes during regression estimation.
Hence, the present research has utilized the stationarity test, wherein the cointegration augmented Dickey–Fuller (CADF) test has been elucidated in Equation (3) of this study.
Δ Y i , t = γ i + γ i Y i , t 1 + γ i X ¯ t 1 + l = 0 p γ i l Δ Y t l ¯ + l = 1 p γ i l Δ Y i , t l + ε i t
The lagged parameter denoted as Yt−1 and the initial difference of Yt−1 is represented by ΔYt−1. The computation of CIPS statistics involves the determination of the mean of CADF, which is elucidated in the following equation:
C I P S ^ = 1 N i = 1 n C A D F i
Subsequently, an examination of the cointegrated relationship among the specified factors, namely, renewable energy, GDP, education, and green investments was carried out using Westerlund’s cointegration test. After confirming the cointegration, this work moves forward to apply a novel nonlinear econometric method, namely, the Method of Moments Quantile Regression (MMQR) by [94]. Traditional linear econometric methods have only focused on modelling the mean of panel data, rather than the conditional distribution [95]. In contrast, MMQR panel estimation examines the relationship concerning variables across multiple quantiles. The technique by Roger Koenker (2005) [96] is generally used to approximate the linkages between several factors at different quantiles. Quantile regression is a statistical method that is resistant to the influence of outliers and generates effective estimates for datasets with heavy tails. According to [97], the method maintains consistency even when multicollinearity is present. However, it should be noted that the quantile regression model exhibits a limitation in its ability to ensure noncrossing outcomes for a multitude of percentiles, which may lead to an inaccurate representation of the response distribution. Considering the context, it is recommended to utilize MMQR owing to a multitude of factors. The model yields consistent results even in the presence of unobserved endogeneity and heterogeneity across the cross-sections. The MMQR methodology allows for the conditional and heterogeneous influence of ecological footprint determinants to impact the distribution’s quantiles. This approach proves advantageous in cases where explanatory variables exhibit high correlation and endogenous behavior.
This method works for high-kurtosis nonlinear datasets. It captures data dynamics endogenously, making it better than other nonlinear modelling methods [98]. Since parameters depend on response variable location, MMQR allows for asymmetric variable location. Partial-parametric modelling structures like MMQR are ideal for dealing with asymmetry, heterogeneity, and endogeneity producing estimates across numerous quantiles [99]. The amended location-scale definition for conditional quantiles Q(X) is
y i t = β i + X i t α + δ i + U i t γ c i t
The probability (p) can be expressed as P(δi + Uitγ > 0) = 1, where (β, α, δ, γ) are the assessed factors (βi, δi), i = 1, …N, that confirm the fixed effects of individual i. Here, U represents a chosen j-vector element of X that accounts for difference transformation in the equation, denoted as Ul = Ul(X), l = 1, …….j. Furthermore, it can be observed that Xit denotes an equivalent distribution for a given individual at a distinct point in time (T). Assuming identical distribution at an individual level (i) for time (T), Zit is impertinent to Xit, Machado and Silva (2019) [94] instants conditions. The model can be expressed in its quantile in the following manner:
Q τ τ X = β i + δ i p ( τ ) + X i t α + U i t γ p
The variables EDU, FDI, GDP, GF, and RE are represented as Xit, while Qτ(τ/X) denotes the dependent factor Yit, which is the CO2, conditioned on fundamental quantiles and placed as the independent factor. The notation βi(τ) = βi + δip(τ) is used to denote the quantile τi for an individual. The parameter attains a fixed state and exhibits significant heterogeneous effects, thereby enabling the quantile model τth to manifest through q(τ) derived from the linearity problem.
m i n q i t π τ W i t ϑ i t + Z i t θ q
The check function, denoted by the equation above, is
π τ ( A ) = ( τ 1 ) A I { A 0 } + T A I { A > 0 }

4. Results and Discussion

This work estimates the panel data of E-7 nations. The descriptive statistics are presented in Table 2.
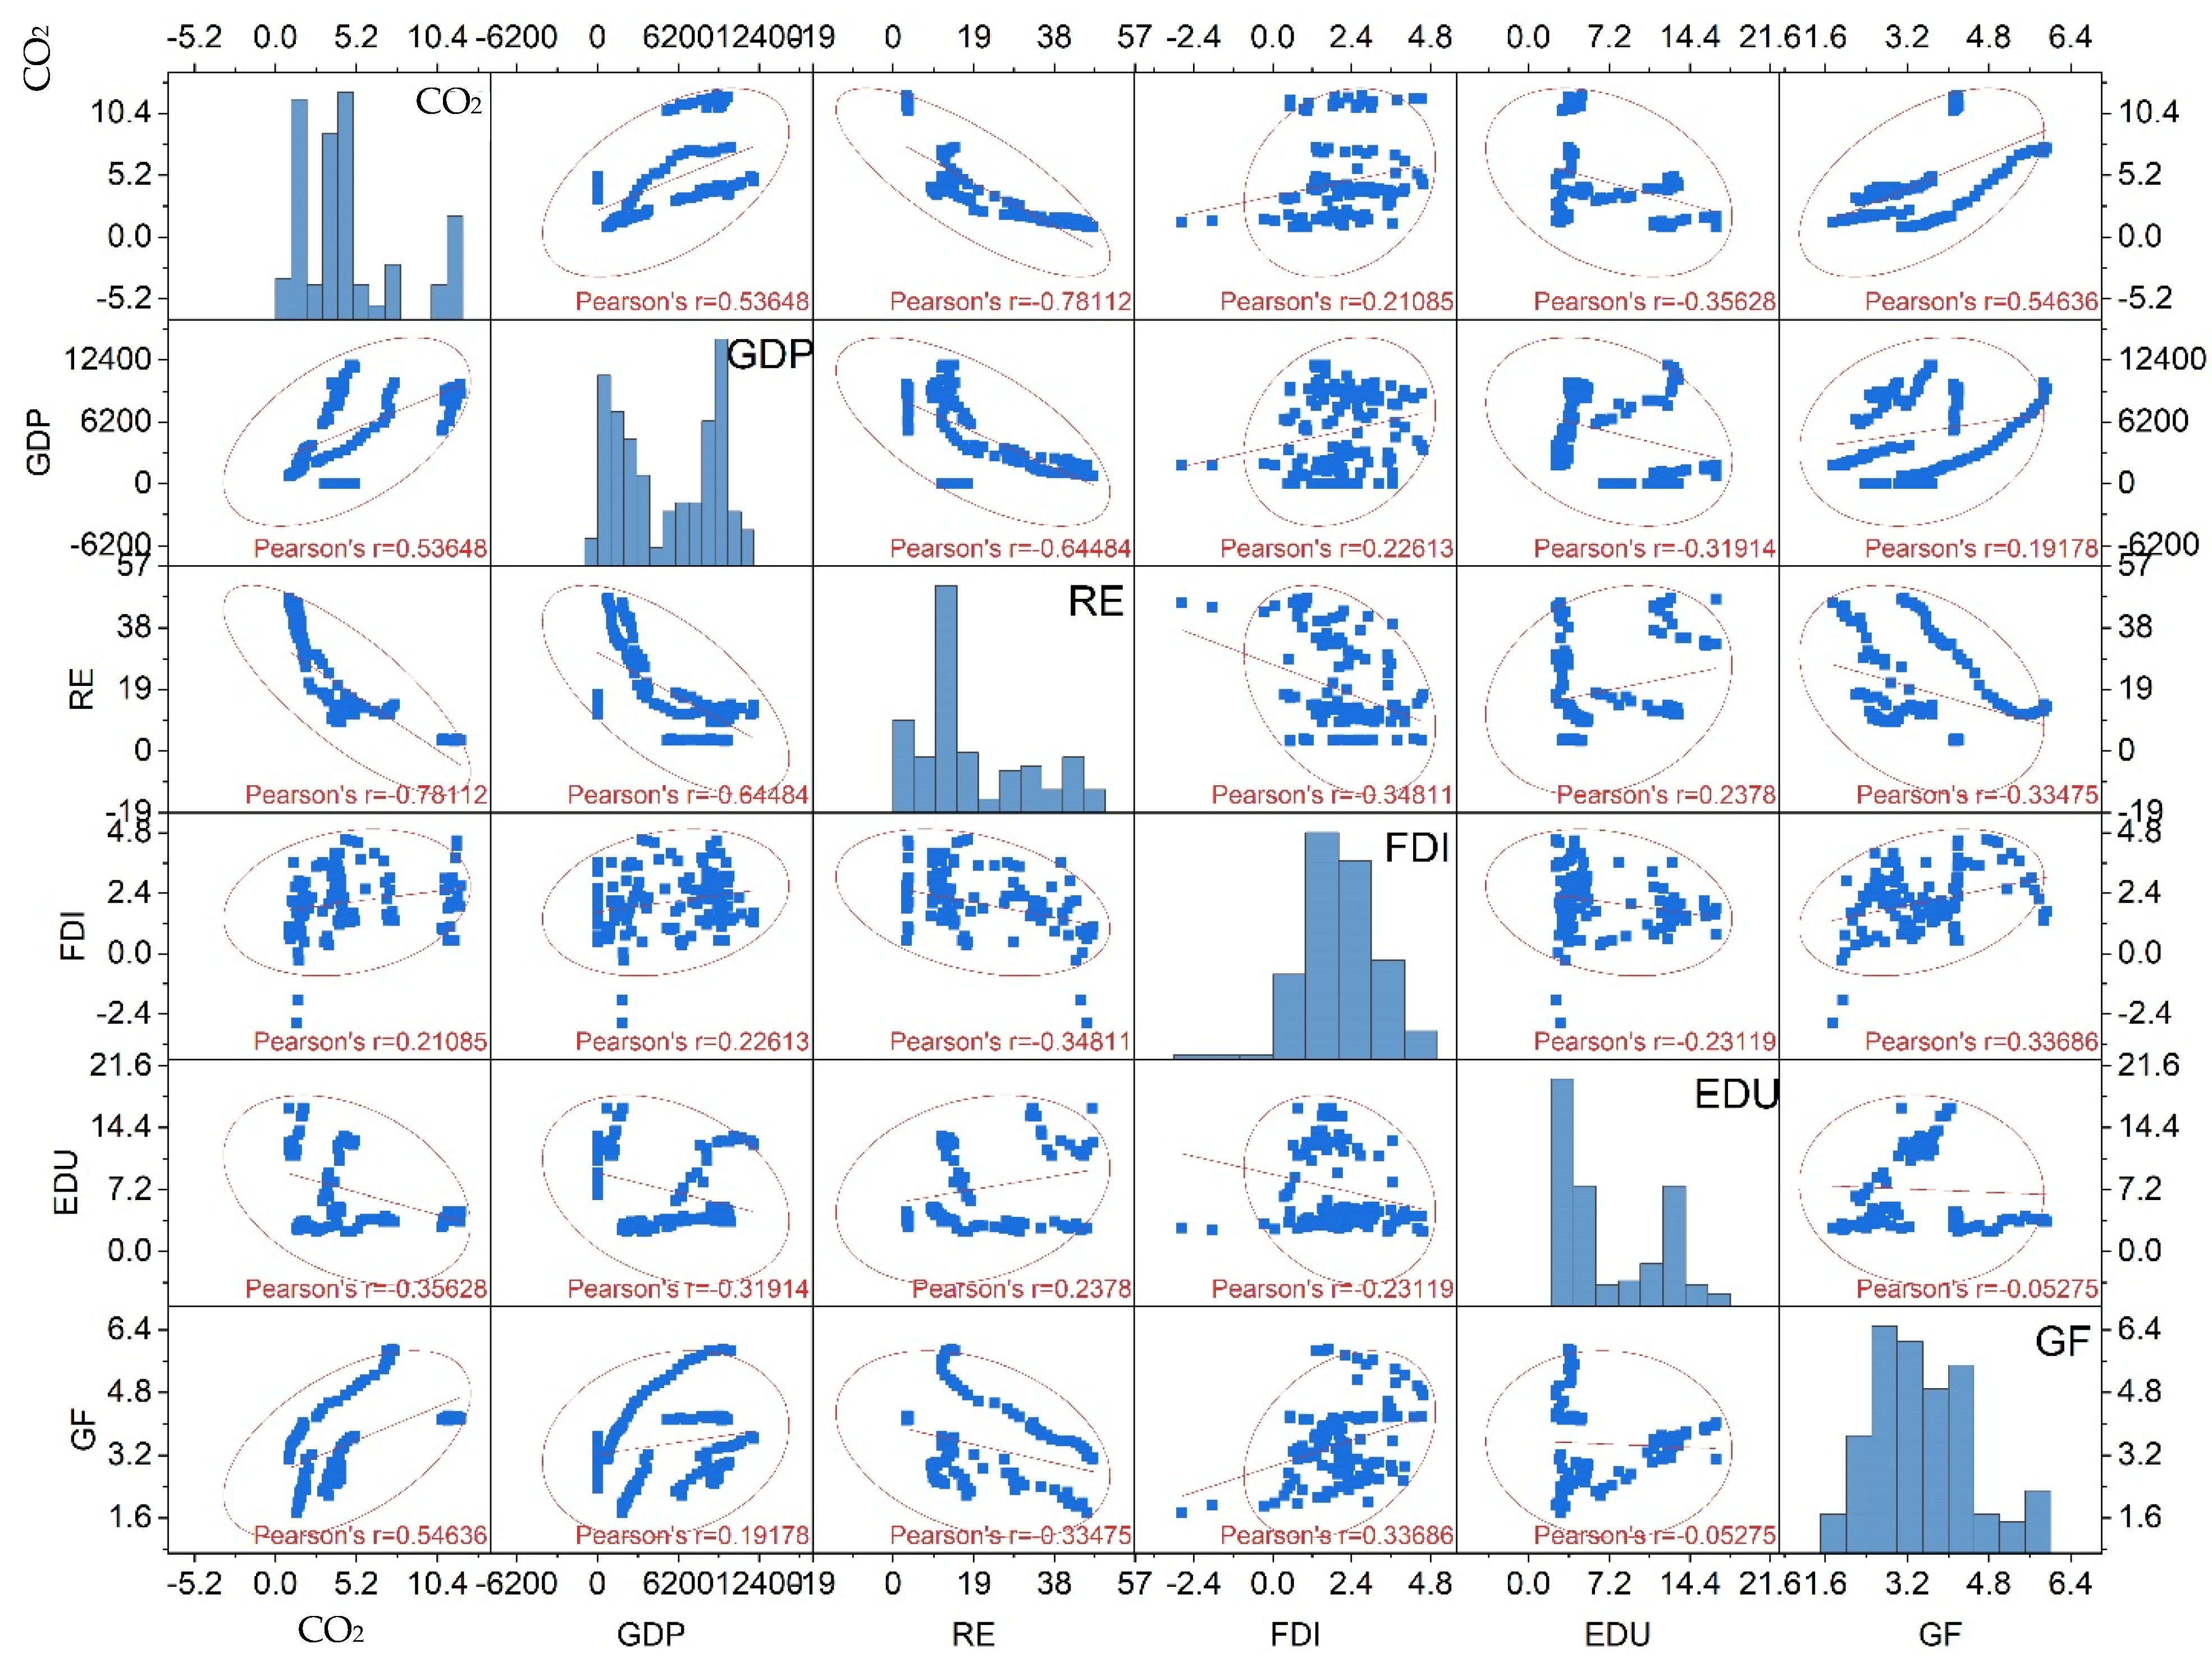
Table 2 shows that GDP has the highest mean and FDI has the lowest mean. CO2em has a maximum value of 11.89 and a minimum value of 0.89. RE has a maximum value of 47.11 and a minimum value of 3.18. The graphical form of the descriptive statistics is in Figure 2.
The next step is to find out the cross-sectional dependence (CD) in the panel data of the E-7 nations. The CD test provides the data description and ensures the applicability of subsequent tests. Table 3 provides the results, and it shows that all the variables are having CD at the 1% level.
The next step is to know the order of integration of the variables. Some variables may be integrated at level, and some may be at first difference. For this purpose, this work applies the CIPS and CADF unit tests. These tests are better than the first unit root tests of [100]. Table 4 shows the findings of both unit root tests.
Table 4 shows that all the variables (CO2, GDP, RE, GF, FDI, and EDU) are cointegrated at first difference. The next step is to know the slope property of the panel data. Table 5 shows that the panel data are heterogeneous.
Before the long run analysis, it is essential to conduct a cointegration test. For this purpose, this work uses Westerlund’s test [101]. This test provides robust results while considering the CD in the panel data.
Table 6 shows that the panel data are cointegrated because group and panel values are significant at 1% level. The coefficient values in the panel data further make it possible to know the long-run coefficient values. For the long-run analysis, this work applies the MMQR approach. This method provides the impacts of independent variables on the dependent factor along different quantiles. Next the MMQR results are in Table 7.
At all quantiles of CO2 emissions, the estimated coefficient of GDP exhibits a significant positive relationship. The observed trend indicates a positive correlation between the impact of GDP and CO2em, whereby a higher quantile level corresponds to a higher impact of GDP. Specifically, when CO2em is situated at a higher quantile level, the effect of GDP is also observed to be higher. This finding aligns with the research conducted by [67,102,103,104]. The subtext of this statement is that the E-7 nations have experienced positive effects on their economy’s core sectors, including farming, manufacturing, and transportation. Another potential factor to consider is that GDP may stimulate economic activity through the promotion of investment, purchasing, consumption, and energy use, thus leading to a rise in pollution levels [105].
The impact of RE is negative at all quantiles of CO2em. This impact is lowering from the 25th to the 90th quantiles. RE is mostly generated from wind, hydro, and solar energy. These energies do not consume fossils and, therefore, do not harm the climate. These results are in line with the findings of [106].
As far as the impact of GF on CO2em is concerned, our analysis shows that GF is environmentally friendly. This is not an alarming situation for E7 countries because the GF has been able to lower environmental pollution, and it is not a contributing factor towards CO2em. This work constructed the GF as an index composed of the three factors of energy efficiency, RE, and number of patents in E-7 nations. This implies that the allocation of resources towards environmentally friendly initiatives has played a role in reducing CO2 emissions, thereby enhancing the overall climate conditions inside the nation.
The result also suggests that the E-7’s GF policies are aligned with its objective of transitioning towards a low-carbon economy. An alternative hypothesis posits that the energy expenses incurred by industrial and other enterprises in the E-7 countries could be substantial. According to the research conducted by [107], companies exhibit reluctance towards adopting green technologies, such as green energy, when the energy costs in a particular country are relatively cheap. Entities that incur higher energy costs place a greater emphasis on considering the impact of green initiatives in their decision-making processes, in contrast to entities with lower energy expenditures. The research findings support the legitimacy theory, which argues that corporations should adhere to policies, regulations, and conventions that contribute to environmental sustainability, as evidenced by the negative correlation between GF and CO2 emissions. Based on this disclosure, it may be inferred that businesses in the E-7 countries adhered to this principle by allocating resources towards the adoption of ecologically sustainable energy sources, machinery, and technology, among other relevant measures. The findings of [108,109,110] support the conclusions of this study. However, the findings of [111,112] differ from those mentioned above.
FDI is showing negative signs in all quantiles. This impact is continuously increasing. This means that FDI is suitable to lower the CO2em in E-7 countries. FDI enables new opportunities for the other developed nations to invest in host countries. It further makes it possible to import efficient technologies from other developed nations into the host countries. These technologies contribute to the lowering of the environmental pollution. The role of education is also friendly in all quantiles. This means that education expenditures are lowering CO2em in all quantiles, but this impact is lowering while moving to higher quantiles. Education expenditures create opportunities to educate people and to spread environmental awareness. This awareness further encourages citizens to adopt sustainable ways of life. This result is in line with the findings of [49].

Robustness Check

To check the validity of the MMQR results, this work applies the CCEMG methodology and takes environmental technologies (ENT) as a proxy of green investment. ENT are mainly crafted to deal with environmental pollution and are an authentic variable to measure green investments [113]. These data have been obtained from OECD. This method is efficient in providing robust results while incorporating the CD in the panel data. Table 8 shows that RE, GDP, FDI, and EDU impact negatively. This means that these factors are environmentally friendly in the E-7 nations. Green investments are increasing CO2em. These results are in line with the MMQR results.

5. Conclusions and Policy Suggestions

This research investigates the relationship between carbon dioxide (CO2) emissions, economic growth, renewable energy consumption (RE), green investments (GF), and foreign direct investment (FDI) in the context of higher education in the E-7 countries from 2000 to 2021. The stationarity of the data was assessed through the utilization of three distinct unit root tests. The results of the cointegration analysis indicate the existence of a cointegrating relationship among the variables. The MMQR model was utilized to examine the long-term dynamic relationships among the variables. The findings of the MMQR study indicate that there exists a negative relationship between economic growth, renewable energy (RE), foreign direct investment (FDI), and education (EDU) on the reduction of carbon dioxide (CO2) emissions over an extended period. However, it is worth noting that green investments have the potential to contribute to an increase in CO2 emissions. The findings of this study provide several significant recommendations for policymakers and governments to address the reduction of CO2 emissions while simultaneously promoting sustainable economic growth. Initially, it is imperative for the E-7 economies to allocate a significant proportion of their financial resources towards the advancement of education. There is a need to expand vocational institutions and other educational facilities to accommodate the growing population. In addition to this, it is imperative for governments to give precedence to the establishment of research and development institutions. Through this approach, a multitude of individuals possessing exceptional qualifications will ultimately devise a resolution aimed at mitigating carbon dioxide emissions, facilitated by advancements in technology.
It is important to encourage the use of renewable energy sources like hydrogen, biofuel, biomass, solar, wind, and others as a means of reducing or eliminating our excessive reliance on fossil fuels for economic purposes. Economic incentives that support green services can be encouraged, such as tax waivers or discounted tax rates on goods and services. To secure a sufficient transition to 100% energy from renewable sources, as envisaged by the bulk of recent environmental treaties, the governments should specifically support renewable energy.
Similarly, encouraging investment in innovations, research, and development helps sustain the carbon-mitigating roles of green technology. The governments ought to encourage financial institutions that finance green projects and permit the private sector to participate more in these initiatives. It is difficult to overstate the importance of education in endogenizing advances in technology. Therefore, the governments of the different E7 economies ought to focus more on the education system, especially by reforming and creating curricula that foster the development of creative ideas and skilled labor.
Furthermore, collaboration between the government and policymakers should be undertaken to enact diverse taxation policies with the aim of regulating CO2 emissions within the environment. The achievement of environmental sustainability can be attained through the expansion of renewable energy sources, as opposed to non-renewable sources, in both product manufacturing and power generation [114]. E-7 countries should consider implementing policies centered around a system of rewards and penalties to address the issue of environmental degradation. It is imperative for the governments of these nations to acknowledge and incentivize businesses and industries that comply with governmental regulations and employ environmentally sustainable energy sources to meet their production requirements. To mitigate the rise in carbon dioxide emissions, it is recommended that the governments of the E-7 nations take measures to promote the adoption of green investments. Governments must prioritize their efforts to ensure that green financing policies are able to complement environmental welfare policies and green growth policies. Finally, it is imperative for the E-7 nations to optimize the utilization of FDI within their respective economies. To ensure long-term economic sustainability, it is imperative for the governments of the E-7 countries to implement stringent regulatory measures to monitor and control the activities of multinational corporations within their jurisdictions. This approach aims to mitigate environmental degradation and foster the advancement of sustainable development.
Alongside these contributions, this work has some limitations that should be addressed by upcoming research. This work adopts an index of renewable energy, patents, and energy efficiency. Future research can incorporate other proxies of green finance with the application of other robust methodologies of CS-ARDL in different regions. Moreover, other important variables such as institutional quality, financial development, and economic policy uncertainty can be included in the model.

Author Contributions

P.X. conducted the analysis and revised the paper. J.Z. curated the data with theoretical additions and proofread the paper. U.M. wrote the initial version of manuscript. All authors have read and agreed to the published version of the manuscript.

Funding

This research received no external funding.

Institutional Review Board Statement

Not applicable.

Informed Consent Statement

Not applicable.

Data Availability Statement

Data will be available on request.

Conflicts of Interest

The authors declare no conflict of interest.

References

  1. Jiskani, I.M.; Cai, Q.; Zhou, W.; Ali Shah, S.A. Green and Climate-Smart Mining: A Framework to Analyze Open-Pit Mines for Cleaner Mineral Production. Resour. Policy 2021, 71, 102007. [Google Scholar] [CrossRef]
  2. Ahmed, Z.; Ahmad, M.; Murshed, M.; Ibrahim Shah, M.; Mahmood, H.; Abbas, S. How Do Green Energy Technology Investments, Technological Innovation, and Trade Globalization Enhance Green Energy Supply and Stimulate Environmental Sustainability in the G7 Countries? Gondwana Res. 2022, 112, 105–115. [Google Scholar] [CrossRef]
  3. Wang, Y.; Shah, S.A.A.; Zhou, P. City-Level Environmental Performance in China. Energy Ecol. Environ. 2018, 3, 149–161. [Google Scholar] [CrossRef]
  4. Li, Y.; Wang, X.; Imran, A.; Aslam, M.U.; Mehmood, U. Analyzing the Contribution of Renewable Energy and Natural Resources for Sustainability in G-20 Countries: How Gross Capital Formation Impacts Ecological Footprints. Heliyon 2023, 9, e18882. [Google Scholar] [CrossRef]
  5. Sun, Y.; Tian, W.; Mehmood, U.; Zhang, X.; Tariq, S. How Do Natural Resources, Urbanization, and Institutional Quality Meet with Ecological Footprints in the Presence of Income Inequality and Human Capital in the next Eleven Countries? Resour. Policy 2023, 85, 104007. [Google Scholar] [CrossRef]
  6. Ahmad, M.; Ahmed, Z.; Akbar, S.; Alvarado, R. Towards Environmental Sustainability in E−7 Countries: Assessing the Roles of Natural Resources, Economic Growth, Country Risk, and Energy Transition. Resour. Policy 2023, 82, 103486. [Google Scholar] [CrossRef]
  7. Dong, K.; Dong, X.; Jiang, Q. How Renewable Energy Consumption Lower Global CO2 Emissions? Evidence from Countries with Different Income Levels. World Econ. 2020, 43, 1665–1698. [Google Scholar] [CrossRef]
  8. Jaforullah, M.; King, A. Does the Use of Renewable Energy Sources Mitigate CO2 Emissions? A Reassessment of the US Evidence. Energy Econ. 2015, 49, 711–717. [Google Scholar] [CrossRef]
  9. Murshed, M.; Tanha, M.M. Oil Price Shocks and Renewable Energy Transition: Empirical Evidence from Net Oil-Importing South Asian Economies. Energy Ecol. Environ. 2021, 6, 183–203. [Google Scholar] [CrossRef]
  10. Musah, M.; Kong, Y.; Mensah, I.A.; Antwi, S.K.; Osei, A.A.; Donkor, M. Modelling the Connection between Energy Consumption and Carbon Emissions in North Africa: Evidence from Panel Models Robust to Cross-Sectional Dependence and Slope Heterogeneity. Environ. Dev. Sustain. 2021, 23, 15225–15239. [Google Scholar] [CrossRef]
  11. Wang, Q.; Su, M.; Li, R.; Ponce, P. The Effects of Energy Prices, Urbanization and Economic Growth on Energy Consumption per Capita in 186 Countries. J. Clean. Prod. 2019, 225, 1017–1032. [Google Scholar] [CrossRef]
  12. Michael, E.; Porter, C.; van der, L. Toward a New Conception of the Environment-Competitiveness Relationship on JSTOR. Available online: https://www.jstor.org/stable/2138392 (accessed on 19 July 2023).
  13. Li, C.; Gan, Y. The Spatial Spillover Effects of Green Finance on Ecological Environment—Empirical Research Based on Spatial Econometric Model. Environ. Sci. Pollut. Res. 2021, 28, 5651–5665. [Google Scholar] [CrossRef] [PubMed]
  14. Löffler, K.U.; Petreski, A.; Stephan, A. Drivers of Green Bond Issuance and New Evidence on the “Greenium”. Eurasian Econ. Rev. 2021, 11, 1–24. [Google Scholar] [CrossRef]
  15. Lu, Y.; Ahmad, M.; Zhang, H.; Guo, J. Effects of Science and Technology Finance on Green Total Factor Productivity in China: Insights from an Empirical Spatial Durbin Model. J. Knowl. Econ. 2023. [Google Scholar] [CrossRef]
  16. Olaoye, O. Environmental Quality, Energy Consumption and Economic Growth: Evidence from Selected African Countries. Green Low-Carbon Econ. 2023. [Google Scholar] [CrossRef]
  17. Tamazian, A.; Chousa, J.P.; Vadlamannati, K.C. Does Higher Economic and Financial Development Lead to Environmental Degradation: Evidence from BRIC Countries. Energy Policy 2009, 37, 246–253. [Google Scholar] [CrossRef]
  18. Nekrasov, S.A.; Egorova, N.E. Coordination of the Development of Renewable Energy and Small Business as a Mechanism for Ensuring the Sustainable Development of Russia. Green Low-Carbon Econ. 2023. [Google Scholar] [CrossRef]
  19. Yang, W.; Zhang, N. Does the Carbon Emissions Trading Scheme Improve Carbon Total Factor Productivity? Evidence from Chinese Cities. Green Low-Carbon Econ. 2023. [Google Scholar] [CrossRef]
  20. Zhang, H.; Sun, X.; Ahmad, M.; Wang, X. Heterogeneous Impacts of Carbon Emission Trading on Green Innovation: Firm-Level in China. Energy Environ. 2023. [Google Scholar] [CrossRef]
  21. Meng, X.; Li, T.; Ahmad, M.; Qiao, G.; Bai, Y. Capital Formation, Green Innovation, Renewable Energy Consumption and Environmental Quality: Do Environmental Regulations Matter? Int. J. Environ. Res. Public Health 2022, 19, 13562. [Google Scholar] [CrossRef]
  22. Ahmad, M.; Ahmed, Z.; Yang, X.; Can, M. Natural Resources Depletion, Financial Risk, and Human Well-Being: What Is the Role of Green Innovation and Economic Globalization? Soc. Indic. Res. 2023, 167, 269–288. [Google Scholar] [CrossRef] [PubMed]
  23. Zhu, Y.; Zafar, S.M.; Salahodjaev, R. Mitigations Pathways towards Sustainable Development: Assessing the Influence of Higher Education on Environmental Quality in BRICS Economies. Environ. Sci. Pollut. Res. 2022, 29, 86851–86858. [Google Scholar] [CrossRef] [PubMed]
  24. Younis, I.; Naz, A.; Shah, S.A.A.; Nadeem, M.; Longsheng, C. Impact of Stock Market, Renewable Energy Consumption and Urbanization on Environmental Degradation: New Evidence from BRICS Countries. Environ. Sci. Pollut. Res. 2021, 28, 31549–31565. [Google Scholar] [CrossRef] [PubMed]
  25. Ahmad, M.; Jabeen, G.; Shah, S.A.A.; Rehman, A.; Ahmad, F.; Işik, C. Assessing Long- and Short-Run Dynamic Interplay among Balance of Trade, Aggregate Economic Output, Real Exchange Rate, and CO2 Emissions in Pakistan. Environ. Dev. Sustain. 2022, 24, 7283–7323. [Google Scholar] [CrossRef]
  26. Zafar, M.W.; Shahbaz, M.; Sinha, A.; Sengupta, T.; Qin, Q. How Renewable Energy Consumption Contribute to Environmental Quality? The Role of Education in OECD Countries. J. Clean. Prod. 2020, 268, 122149. [Google Scholar] [CrossRef]
  27. Balaguer, J.; Cantavella, M. The Role of Education in the Environmental Kuznets Curve. Evidence from Australian Data. Energy Econ. 2018, 70, 289–296. [Google Scholar] [CrossRef]
  28. Koenker, R.; Hallock, K.F. Quantile Regression. J. Econ. Perspect. 2001, 15, 143–156. [Google Scholar] [CrossRef]
  29. Hu, H.; Xie, N.; Fang, D.; Zhang, X. The Role of Renewable Energy Consumption and Commercial Services Trade in Carbon Dioxide Reduction: Evidence from 25 Developing Countries. Appl. Energy 2018, 211, 1229–1244. [Google Scholar] [CrossRef]
  30. Cheng, C.; Ren, X.; Wang, Z.; Yan, C. Heterogeneous Impacts of Renewable Energy and Environmental Patents on CO2 Emission—Evidence from the BRIICS. Sci. Total Environ. 2019, 668, 1328–1338. [Google Scholar] [CrossRef]
  31. Dong, K.; Sun, R.; Hochman, G. Do Natural Gas and Renewable Energy Consumption Lead to Less CO2 Emission? Empirical Evidence from a Panel of BRICS Countries. Energy 2017, 141, 1466–1478. [Google Scholar] [CrossRef]
  32. Ali Shah, S.A.; Longsheng, C.; Solangi, Y.A.; Ahmad, M.; Ali, S. Energy Trilemma Based Prioritization of Waste-to-Energy Technologies: Implications for Post-COVID-19 Green Economic Recovery in Pakistan. J. Clean. Prod. 2021, 284, 124729. [Google Scholar] [CrossRef]
  33. Xu, L.; Shah, S.A.A.; Zameer, H.; Solangi, Y.A. Evaluating Renewable Energy Sources for Implementing the Hydrogen Economy in Pakistan: A Two-Stage Fuzzy MCDM Approach. Environ. Sci. Pollut. Res. 2019, 26, 33202–33215. [Google Scholar] [CrossRef] [PubMed]
  34. Solangi, Y.A.; Shah, S.A.A.; Zameer, H.; Ikram, M.; Saracoglu, B.O. Assessing the Solar PV Power Project Site Selection in Pakistan: Based on AHP-Fuzzy VIKOR Approach. Environ. Sci. Pollut. Res. 2019, 26, 30286–30302. [Google Scholar] [CrossRef] [PubMed]
  35. Kirikkaleli, D.; Adebayo, T.S. Do Renewable Energy Consumption and Financial Development Matter for Environmental Sustainability? New Global Evidence. Sustain. Dev. 2021, 29, 583–594. [Google Scholar] [CrossRef]
  36. Pata, U.K. Renewable and Non-Renewable Energy Consumption, Economic Complexity, CO2 Emissions, and Ecological Footprint in the USA: Testing the EKC Hypothesis with a Structural Break. Environ. Sci. Pollut. Res. 2021, 28, 846–861. [Google Scholar] [CrossRef]
  37. Pata, U.K.; Aydin, M. Testing the EKC Hypothesis for the Top Six Hydropower Energy-Consuming Countries: Evidence from Fourier Bootstrap ARDL Procedure. J. Clean. Prod. 2020, 264, 121699. [Google Scholar] [CrossRef]
  38. Radmehr, R.; Henneberry, S.R.; Shayanmehr, S. Renewable Energy Consumption, CO2 Emissions, and Economic Growth Nexus: A Simultaneity Spatial Modeling Analysis of EU Countries. Struct. Chang. Econ. Dyn. 2021, 57, 13–27. [Google Scholar] [CrossRef]
  39. Sharif, A.; Bhattacharya, M.; Afshan, S.; Shahbaz, M. Disaggregated Renewable Energy Sources in Mitigating CO2 Emissions: New Evidence from the USA Using Quantile Regressions. Environ. Sci. Pollut. Res. 2021, 28, 57582–57601. [Google Scholar] [CrossRef]
  40. Yuping, L.; Ramzan, M.; Xincheng, L.; Murshed, M.; Awosusi, A.A.; BAH, S.I.; Adebayo, T.S. Determinants of Carbon Emissions in Argentina: The Roles of Renewable Energy Consumption and Globalization. Energy Rep. 2021, 7, 4747–4760. [Google Scholar] [CrossRef]
  41. Abbasi, K.; Jiao, Z.; Shahbaz, M.; Khan, A. Asymmetric Impact of Renewable and Non-Renewable Energy on Economic Growth in Pakistan: New Evidence from a Nonlinear Analysis. Energy Explor. Exploit. 2020, 38, 1946–1967. [Google Scholar] [CrossRef]
  42. Baz, K.; Cheng, J.; Xu, D.; Abbas, K.; Ali, I.; Ali, H.; Fang, C. Asymmetric Impact of Fossil Fuel and Renewable Energy Consumption on Economic Growth: A Nonlinear Technique. Energy 2021, 226, 120357. [Google Scholar] [CrossRef]
  43. Longsheng, C.; Ali Shah, S.A.; Solangi, Y.A.; Ahmad, M.; Ali, S. An Integrated SWOT-Multi-Criteria Analysis of Implementing Sustainable Waste-to-Energy in Pakistan. Renew. Energy 2022, 195, 1438–1453. [Google Scholar] [CrossRef]
  44. Adebayo, T.S.; Akinsola, G.D.; Kirikkaleli, D.; Bekun, F.V.; Umarbeyli, S.; Osemeahon, O.S. Economic Performance of Indonesia amidst CO2 Emissions and Agriculture: A Time Series Analysis. Environ. Sci. Pollut. Res. 2021, 28, 47942–47956. [Google Scholar] [CrossRef]
  45. Alola, A.A.; Adebayo, T.S.; Onifade, S.T. Examining the Dynamics of Ecological Footprint in China with Spectral Granger Causality and Quantile-on-Quantile Approaches. Int. J. Sustain. Dev. World Ecol. 2022, 29, 263–276. [Google Scholar] [CrossRef]
  46. Kirikkaleli, D.; Adebayo, T.S.; Khan, Z.; Ali, S. Does Globalization Matter for Ecological Footprint in Turkey? Evidence from Dual Adjustment Approach. Environ. Sci. Pollut. Res. 2021, 28, 14009–14017. [Google Scholar] [CrossRef]
  47. He, X.; Adebayo, T.S.; Kirikkaleli, D.; Umar, M. Consumption-Based Carbon Emissions in Mexico: An Analysis Using the Dual Adjustment Approach. Sustain. Prod. Consum. 2021, 27, 947–957. [Google Scholar] [CrossRef]
  48. Adebayo, T.S.; Rjoub, H.; Akinsola, G.D.; Oladipupo, S.D. The Asymmetric Effects of Renewable Energy Consumption and Trade Openness on Carbon Emissions in Sweden: New Evidence from Quantile-on-Quantile Regression Approach. Environ. Sci. Pollut. Res. 2022, 29, 1875–1886. [Google Scholar] [CrossRef]
  49. Ping, S.; Shah, S.A.A. Green Finance, Renewable Energy, Financial Development, FDI, and CO2 Nexus under the Impact of Higher Education. Environ. Sci. Pollut. Res. 2022, 30, 33524–33541. [Google Scholar] [CrossRef]
  50. Musaad, A.S.O.; Zhuo, Z.; Siyal, Z.A.; Shaikh, G.M.; Shah, S.A.A.; Solangi, Y.A.; Musaad, A.O.O. An Integrated Multi-Criteria Decision Support Framework for the Selection of Suppliers in Small and Medium Enterprises Based on Green Innovation Ability. Processes 2020, 8, 418. [Google Scholar] [CrossRef]
  51. Al Harazi, A.K.; Zhang, W.; Shah, S.A.A.; Al Asbahi, A.A.M.H.; Al Harazi, Y.K.; Alwan, S.Y. Multidimensional Study of Factors Influencing Sustainable Construction Adoption in Yemen: Insights for Implementing Sustainable Practices. Environ. Sci. Pollut. Res. 2022, 30, 20650–20672. [Google Scholar] [CrossRef]
  52. Xu, L.; Wang, Y.; Shah, S.A.A.; Zameer, H.; Solangi, Y.A.; Walasai, G.D.; Siyal, Z.A. Siyal Economic Viability and Environmental Efficiency Analysis of Hydrogen Production Processes for the Decarbonization of Energy Systems. Processes 2019, 7, 494. [Google Scholar] [CrossRef]
  53. Taghizadeh-Hesary, F.; Yoshino, N. The Way to Induce Private Participation in Green Finance and Investment. Financ. Res. Lett. 2019, 31, 98–103. [Google Scholar] [CrossRef]
  54. del Río González, P. The Empirical Analysis of the Determinants for Environmental Technological Change: A Research Agenda. Ecol. Econ. 2009, 68, 861–878. [Google Scholar] [CrossRef]
  55. Glomsrød, S.; Wei, T. Business as Unusual: The Implications of Fossil Divestment and Green Bonds for Financial Flows, Economic Growth and Energy Market. Energy Sustain. Dev. 2018, 44, 1–10. [Google Scholar] [CrossRef]
  56. Li, Z.; Chen, H.; Mo, B. Can Digital Finance Promote Urban Innovation? Evidence from China. Borsa Istanbul Rev. 2023, 23, 285–296. [Google Scholar] [CrossRef]
  57. Li, Z.; Liao, G.; Albitar, K. Does Corporate Environmental Responsibility Engagement Affect Firm Value? The Mediating Role of Corporate Innovation. Bus. Strateg. Environ. 2020, 29, 1045–1055. [Google Scholar] [CrossRef]
  58. Sachs, J.D.; Woo, W.T.; Yoshino, N.; Taghizadeh-Hesary, F. Importance of Green Finance for Achieving Sustainable Development Goals and Energy Security. In Handbook of Green Finance: Energy Security and Sustainable Development; Springer: Singapore, 2019; pp. 3–12. [Google Scholar] [CrossRef]
  59. Azhgaliyeva, D.; Kapsaplyamova, Z.; Low, L. Policies for Unlocking Green Finance; Asian Development Bank Institute: Tokyo, Japan, 2018; ISBN 8133593557. [Google Scholar]
  60. Jiskani, I.M.; Shah, S.A.A.; Qingxiang, C.; Zhou, W.; Lu, X. A Multi-Criteria Based SWOT Analysis of Sustainable Planning for Mining and Mineral Industry in Pakistan. Arab. J. Geosci. 2020, 13, 1108. [Google Scholar] [CrossRef]
  61. Li, Z.; Huang, Z.; Su, Y. New Media Environment, Environmental Regulation and Corporate Green Technology Innovation:Evidence from China. Energy Econ. 2023, 119, 106545. [Google Scholar] [CrossRef]
  62. Liu, L.; Liu, M. How Does the Digital Economy Affect Industrial Eco-Efficiency? Empirical Evidence from China. Data Sci. Financ. Econ. 2022, 2, 371–390. [Google Scholar] [CrossRef]
  63. Bhattacharyya, R. Green Finance for Energy Transition, Climate Action and Sustainable Development: Overview of Concepts, Applications, Implementation and Challenges. Green Financ. 2021, 4, 1–35. [Google Scholar] [CrossRef]
  64. Qin, L.; Raheem, S.; Murshed, M.; Miao, X.; Khan, Z.; Kirikkaleli, D. Does Financial Inclusion Limit Carbon Dioxide Emissions? Analyzing the Role of Globalization and Renewable Electricity Output. Sustain. Dev. 2021, 29, 1138–1154. [Google Scholar] [CrossRef]
  65. Murshed, M.; Elheddad, M.; Ahmed, R.; Bassim, M.; Than, E.T. Foreign Direct Investments, Renewable Electricity Output, and Ecological Footprints: Do Financial Globalization Facilitate Renewable Energy Transition and Environmental Welfare in Bangladesh? Asia-Pacific Financ. Mark. 2022, 29, 33–78. [Google Scholar] [CrossRef]
  66. Yang, B.; Jahanger, A.; Usman, M.; Khan, M.A. The Dynamic Linkage between Globalization, Financial Development, Energy Utilization, and Environmental Sustainability in GCC Countries. Environ. Sci. Pollut. Res. 2021, 28, 16568–16588. [Google Scholar] [CrossRef] [PubMed]
  67. Baloch, M.A.; Zhang, J.; Iqbal, K.; Iqbal, Z. The Effect of Financial Development on Ecological Footprint in BRI Countries: Evidence from Panel Data Estimation. Environ. Sci. Pollut. Res. 2019, 26, 6199–6208. [Google Scholar] [CrossRef]
  68. Chishti, M.Z.; Ahmed, Z.; Murshed, M.; Namkambe, H.H.; Ulucak, R. The Asymmetric Associations between Foreign Direct Investment Inflows, Terrorism, CO2 Emissions, and Economic Growth: A Tale of Two Shocks. Environ. Sci. Pollut. Res. 2021, 28, 69253–69271. [Google Scholar] [CrossRef]
  69. Wang, Q.; Zhang, F. The Effects of Trade Openness on Decoupling Carbon Emissions from Economic Growth—Evidence from 182 Countries. J. Clean. Prod. 2021, 279, 123838. [Google Scholar] [CrossRef] [PubMed]
  70. Khan, M.A.; Ozturk, I. Examining Foreign Direct Investment and Environmental Pollution Linkage in Asia. Environ. Sci. Pollut. Res. 2020, 27, 7244–7255. [Google Scholar] [CrossRef] [PubMed]
  71. Balsalobre-Lorente, D.; Gokmenoglu, K.K.; Taspinar, N.; Cantos-Cantos, J.M. An Approach to the Pollution Haven and Pollution Halo Hypotheses in MINT Countries. Environ. Sci. Pollut. Res. 2019, 26, 23010–23026. [Google Scholar] [CrossRef]
  72. Duan, Y.; Jiang, X. Pollution Haven or Pollution Halo? A Re-Evaluation on the Role of Multinational Enterprises in Global CO2 Emissions. Energy Econ. 2021, 97, 105181. [Google Scholar] [CrossRef]
  73. Lahiani, A. Is Financial Development Good for the Environment? An Asymmetric Analysis with CO2 Emissions in China. Environ. Sci. Pollut. Res. 2020, 27, 7901–7909. [Google Scholar] [CrossRef]
  74. Yañez, P.; Sinha, A.; Vásquez, M. Carbon Footprint Estimation in a University Campus: Evaluation and Insights. Sustainability 2019, 12, 181. [Google Scholar] [CrossRef]
  75. Parra, G.; Checa, M.; Mesa-Barrionuevo, C.R.; Ruiz-Reyes, N.; Guerrero, F. Evaluación de La Huella Ecológica En La Universidad de Jaén, Una Herramienta Para La Gestión Sostenible. Obs. Medioambient. 1970, 21, 233–246. [Google Scholar] [CrossRef]
  76. Versteijlen, M.; Perez Salgado, F.; Janssen Groesbeek, M.; Counotte, A. Pros and Cons of Online Education as a Measure to Reduce Carbon Emissions in Higher Education in the Netherlands. Curr. Opin. Environ. Sustain. 2017, 28, 80–89. [Google Scholar] [CrossRef]
  77. Li, S.; Zhou, C. What Are the Impacts of Demographic Structure on CO2 Emissions? A Regional Analysis in China via Heterogeneous Panel Estimates. Sci. Total Environ. 2019, 650, 2021–2031. [Google Scholar] [CrossRef]
  78. Subramaniam, Y.; Masron, T.A. Education, Methane Emission and Poverty in Developing Countries. J. Environ. Econ. Policy 2020, 9, 355–369. [Google Scholar] [CrossRef]
  79. Cordero, E.C.; Centeno, D.; Todd, A.M. The Role of Climate Change Education on Individual Lifetime Carbon Emissions. PLoS ONE 2020, 15, e0206266. [Google Scholar] [CrossRef]
  80. Li, L.; Chen, Q.; Mehmood, U. Analyzing the Validity of Load Capability Curve: How Economic Complexity, Renewable Energy, R&D, and Communication Technologies Take Their Part in G-20 Countries. Environ. Sci. Pollut. Res. 2023, 30, 92068–92083. [Google Scholar] [CrossRef]
  81. Samour, A.; Mehmood, U.; Radulescu, M.; Budu, R.A.; Nitu, R.M. Examining the Role of Renewable Energy, Technological Innovation, and the Insurance Market in Environmental Sustainability in the United States: A Step toward COP26 Targets. Energies 2023, 16, 6138. [Google Scholar] [CrossRef]
  82. Zaman, Q.U.Z.; Wang, Z.; Zaman, S.; Rasool, S.F. Investigating the Nexus between Education Expenditure, Female Employers, Renewable Energy Consumption and CO2 Emission: Evidence from China. J. Clean. Prod. 2021, 312, 127824. [Google Scholar] [CrossRef]
  83. Wang, X.; Wang, Q. Research on the impact of green finance on the upgrading of China’s regional industrial structure from the perspective of sustainable development. Resour. Policy 2021, 74, 102436. [Google Scholar] [CrossRef]
  84. Ahmad, M.; Chandio, A.A.; Solangi, Y.A.; Shah, S.A.A.; Shahzad, F.; Rehman, A.; Jabeen, G. Dynamic Interactive Links among Sustainable Energy Investment, Air Pollution, and Sustainable Development in Regional China. Environ. Sci. Pollut. Res. 2021, 28, 1502–1518. [Google Scholar] [CrossRef] [PubMed]
  85. Ahmad, M.; Rehman, A.; Shah, S.A.A.; Solangi, Y.A.; Chandio, A.A.; Jabeen, G. Stylized Heterogeneous Dynamic Links among Healthcare Expenditures, Land Urbanization, and CO2 Emissions across Economic Development Levels. Sci. Total Environ. 2021, 753, 142228. [Google Scholar] [CrossRef] [PubMed]
  86. Musah, M.; Owusu-Akomeah, M.; Kumah, E.A.; Mensah, I.A.; Nyeadi, J.D.; Murshed, M.; Alfred, M. Green Investments, Financial Development, and Environmental Quality in Ghana: Evidence from the Novel Dynamic ARDL Simulations Approach. Environ. Sci. Pollut. Res. 2022, 29, 31972–32001. [Google Scholar] [CrossRef] [PubMed]
  87. Shahbaz, M.; Hye, Q.M.A.; Tiwari, A.K.; Leitão, N.C. Economic Growth, Energy Consumption, Financial Development, International Trade and CO2 Emissions in Indonesia. Renew. Sustain. Energy Rev. 2013, 25, 109–121. [Google Scholar] [CrossRef]
  88. Ozturk, I.; Aslan, A.; Kalyoncu, H. Energy Consumption and Economic Growth Relationship: Evidence from Panel Data for Low and Middle Income Countries. Energy Policy 2010, 38, 4422–4428. [Google Scholar] [CrossRef]
  89. Usman, A.; Ozturk, I.; Ullah, S.; Hassan, A. Does ICT Have Symmetric or Asymmetric Effects on CO2 Emissions? Evidence from Selected Asian Economies. Technol. Soc. 2021, 67, 101692. [Google Scholar] [CrossRef]
  90. Rao, D.T.; Sethi, N.; Dash, D.P.; Bhujabal, P. Foreign Aid, FDI and Economic Growth in South-East Asia and South Asia. Glob. Bus. Rev. 2023, 24, 31–47. [Google Scholar] [CrossRef]
  91. Khan, M.A.; Riaz, H.; Ahmed, M.; Saeed, A. Does Green Finance Really Deliver What Is Expected? An Empirical Perspective. Borsa Istanb. Rev. 2022, 22, 586–593. [Google Scholar] [CrossRef]
  92. OECD Environmental Policy—Environmental Tax—OECD Data. Available online: https://data.oecd.org/envpolicy/environmental-tax.htm (accessed on 21 July 2023).
  93. Swamy, P.A.V.B. Efficient Inference in a Random Coefficient Regression Model. Econometrica 1970, 38, 311. [Google Scholar] [CrossRef]
  94. Machado, J.A.F.; Santos Silva, J.M.C. Quantiles via Moments. J. Econom. 2019, 213, 145–173. [Google Scholar] [CrossRef]
  95. Dogan, N.; Sahbaz, T.; Diracoglu, D. Effects of Mobilization Treatment on Sacroiliac Joint Dysfunction Syndrome. Rev. Assoc. Med. Bras. 2021, 67, 1003–1009. [Google Scholar] [CrossRef]
  96. Koenker, R. Quantile Regression; Cambridge University Press: Cambridge, UK, 2005; pp. 1–349. [Google Scholar] [CrossRef]
  97. Binder, M.; Coad, A. From Average Joe’s Happiness to Miserable Jane and Cheerful John: Using Quantile Regressions to Analyze the Full Subjective Well-Being Distribution. J. Econ. Behav. Organ. 2011, 79, 275–290. [Google Scholar] [CrossRef]
  98. Shin, Y.; Yu, B.; Greenwood-Nimmo, M. Modelling Asymmetric Cointegration and Dynamic Multipliers in a Nonlinear ARDL Framework. SSRN Electron. J. 2011, 5, 281–314. [Google Scholar] [CrossRef]
  99. Li, N.; Wu, D. Nexus between Natural Resource and Economic Development: How Green Innovation and Financial Inclusion Create Sustainable Growth in BRICS Region? Resour. Policy 2023, 85, 103883. [Google Scholar] [CrossRef]
  100. Levin, A.; Lin, C.-F.; James Chu, C.-S. Unit Root Tests in Panel Data: Asymptotic and Finite-Sample Properties. J. Econom. 2002, 108, 1–24. [Google Scholar] [CrossRef]
  101. Westerlund, J. New Simple Tests for Panel Cointegration. Econom. Rev. 2005, 24, 297–316. [Google Scholar] [CrossRef]
  102. Khan, A.; Chenggang, Y.; Hussain, J.; Bano, S. Does Energy Consumption, Financial Development, and Investment Contribute to Ecological Footprints in BRI Regions? Environ. Sci. Pollut. Res. 2019, 26, 36952–36966. [Google Scholar] [CrossRef] [PubMed]
  103. Ahmad, M.; Khattak, S.I.; Khan, A.; Rahman, Z.U. Innovation, Foreign Direct Investment (FDI), and the Energy–Pollution–Growth Nexus in OECD Region: A Simultaneous Equation Modeling Approach. Environ. Ecol. Stat. 2020, 27, 203–232. [Google Scholar] [CrossRef]
  104. Ahmad, M.; Jiang, P.; Majeed, A.; Raza, M.Y. Does Financial Development and Foreign Direct Investment Improve Environmental Quality? Evidence from Belt and Road Countries. Environ. Sci. Pollut. Res. 2020, 27, 23586–23601. [Google Scholar] [CrossRef]
  105. Baloch, M.A.; Danish. The nexus between renewable energy, income inequality, and consumption-based CO2 emissions: An empirical investigation. Sustain. Dev. 2022, 30, 1268–1277. [Google Scholar] [CrossRef]
  106. Ali, S.; Yan, Q.; Razzaq, A.; Khan, I.; Irfan, M. Modeling Factors of Biogas Technology Adoption: A Roadmap towards Environmental Sustainability and Green Revolution. Environ. Sci. Pollut. Res. 2022, 30, 11838–11860. [Google Scholar] [CrossRef] [PubMed]
  107. Stucki, T. Which Firms Benefit from Investments in Green Energy Technologies?—The Effect of Energy Costs. Res. Policy 2019, 48, 546–555. [Google Scholar] [CrossRef]
  108. Murshed, M.; Ferdaus, J.; Rashid, S.; Tanha, M.M.; Islam, M.J. The Environmental Kuznets Curve Hypothesis for Deforestation in Bangladesh: An ARDL Analysis with Multiple Structural Breaks. Energy Ecol. Environ. 2021, 6, 111–132. [Google Scholar] [CrossRef]
  109. Ahmad, M.; Khan, Z.; Rahman, Z.U.; Khattak, S.I.; Khan, Z.U. Can Innovation Shocks Determine CO2 Emissions (CO2e) in the OECD Economies? A New Perspective. Econ. Innov. New Technol. 2021, 30, 89–109. [Google Scholar] [CrossRef]
  110. Khattak, S.I.; Ahmad, M. The Cyclical Impact of Green and Sustainable Technology Research on Carbon Dioxide Emissions in BRICS Economies. Environ. Sci. Pollut. Res. 2022, 29, 22687–22707. [Google Scholar] [CrossRef] [PubMed]
  111. Wan, Y.; Sheng, N. Clarifying the Relationship among Green Investment, Clean Energy Consumption, Carbon Emissions, and Economic Growth: A Provincial Panel Analysis of China. Environ. Sci. Pollut. Res. 2022, 29, 9038–9052. [Google Scholar] [CrossRef]
  112. Raghutla, C.; Shahbaz, M.; Chittedi, K.R.; Jiao, Z. Financing Clean Energy Projects: New Empirical Evidence from Major Investment Countries. Renew. Energy 2021, 169, 231–241. [Google Scholar] [CrossRef]
  113. Zhang, M.; Wong, W.-K.; Kim Oanh, T.T.; Muda, I.; Islam, S.; Hishan, S.S.; Abduvaxitovna, S.Z. Regulating Environmental Pollution through Natural Resources and Technology Innovation: Revisiting the Environment Kuznet Curve in China through Quantile-Based ARDL Estimations. Resour. Policy 2023, 85, 103788. [Google Scholar] [CrossRef]
  114. Shah, S.A.A.; Solangi, Y.A. A sustainable solution for electricity crisis in Pakistan: Opportunities, barriers, and policy implications for 100% renewable energy. Environ. Sci. Pollut. Res. 2019, 26, 29687–29703. [Google Scholar] [CrossRef]
Figure 1. Graphical form of the study.
Sustainability 15 14052 g001
Figure 2. Scatter Plot.
Sustainability 15 14052 g002
Table 1. Variables and their sources.
ParametersSymbolUnitSource
CO2 emissionsCO2CO2 emissions metric tons per capitaWDI
Economic progressGDPGDP per capita constant (2015)WDI
Renewable energyRERenewable energy % of total energy useWDI
Green investmentsGFA composite index via principal component analysis using the variables of number of patents, energy efficiency, and renewable energyWDI
Foreign direct investmentFDIForeign direct investment inflows % of GDPWDI
EducationEDUEducation expenditures by government (% of government expenditures)WDI
Environmental technologyENTPatents on environmental technology[92]
Table 2. Descriptive statistics.
CO2EDUFDIGDPGFRE
Mean4.6253127.2445161.9939585301.8848.07016718.46964
Median3.9851114.7733901.9292705471.3077.89072013.62875
Maximum11.8849616.730514.55425411938.7813.6347247.11000
Minimum0.8837472.390000−2.757440−7.1382514.0136773.180000
Std. Dev.3.1697554.4769891.1286763908.7362.22763212.58527
Skewness1.1122240.645260−0.3385140.0203650.6610600.854173
Kurtosis3.2030811.8580714.7964091.4511633.1172712.550081
Jarque–Bera32.0153919.0539423.6483215.4035611.3045920.02562
Probability0.0000000.0000730.0000070.0004520.0035090.000045
Table 3. CD test.
Table 3. CD test.
VariableTest Statistics
CO210.56 a
GDP13.96 a
RE14.66 a
GF15.54 a
FDI5.61 a
EDU10.20 a
Note: a explains the level of significance at 1%.
Table 4. Unit root tests.
Variable CADF TestCIPS
At Level1st DifferenceAt Level1st Difference
l n C O 2 −1.858−2.938 a−1.994−3.863 a
l n G D P t −1.224−3.493 a−2.505−3.493 a
l n R E t −2.709−3.176 a−2.543−4.083 a
l n G F t −1.519−3.569 a−2.357−5.533 a
l n F D I t −3.515−5.070 a−3.786−5.554 a
l n E D U t −2.943−4.259 a−3.241−5.430 a
Note: a explains the level of significance at 1%.
Table 5. Slope test.
Valuep Value
Delta2.508 b0.012
adj3.238 a0.001
Note: a and b explain the level of significance at 1% and 5%.
Table 6. Westerlund test.
StatValueZ Valuep Value
Gt−4.671 a−5.6220.000
Ga−5.1043.1680.999
Pt−13.618 a−6.7900.000
Pa−5.6591.7960.964
Note: a explains the level of significance at 1%.
Table 7. MMQR results.
Quantiles
VariableLocation Scale0.250.500.750.90
GDP0.070 ***0.026 ***0.013 ***0.015 **0.034 *0.054 *
RE−0.165 ***0.092 *−0.158 ***−0.161 ***−0.181 ***−0.181 ***
GF−1.025 ***−0.235 *−1.069 ***−1.143 ***−1.484 ***−0.625 ***
FDI−0.559 *−0.034 **−0.532 *−0.543 *−0.593 **−0.617 *
EDU−0.151 ***−0.096 ***−0.076 ***−0.106 ***−0.246 ***−0.315 **
Note. ***, **, and * indicate the level of significance at 1%, 5%, and 10%, respectively.
Table 8. CCEMG.
Table 8. CCEMG.
VariableCoefficientZ-Valuep-Value
GDP0.155 *1.810.071
RE−0.140 ***−2.770.006
GF−1.838 ***−2.690.007
FDI−0.066 **−1.980.048
EDU−0.037 *−1.610.091
Note. ***, **, and * indicate the significance of level at 1%, 5%, and 10%, respectively.
Disclaimer/Publisher’s Note: The statements, opinions and data contained in all publications are solely those of the individual author(s) and contributor(s) and not of MDPI and/or the editor(s). MDPI and/or the editor(s) disclaim responsibility for any injury to people or property resulting from any ideas, methods, instructions or products referred to in the content.

