
Building Information Modeling Applications in Energy-Efficient Refurbishment of Existing Building Stock: A Case Study


Abstract
:1. Introduction
2. Aims and Objectives
- To explore the potential of BIM-based energy performance analysis;
- To compare the effectiveness of different retrofit scenarios for existing housing stock;
- To use BIM in conjunction with simulation tools;
- To analyze the cost efficiency and financial feasibility of different retrofit strategies.
3. Literature Review
4. Materials and Methods
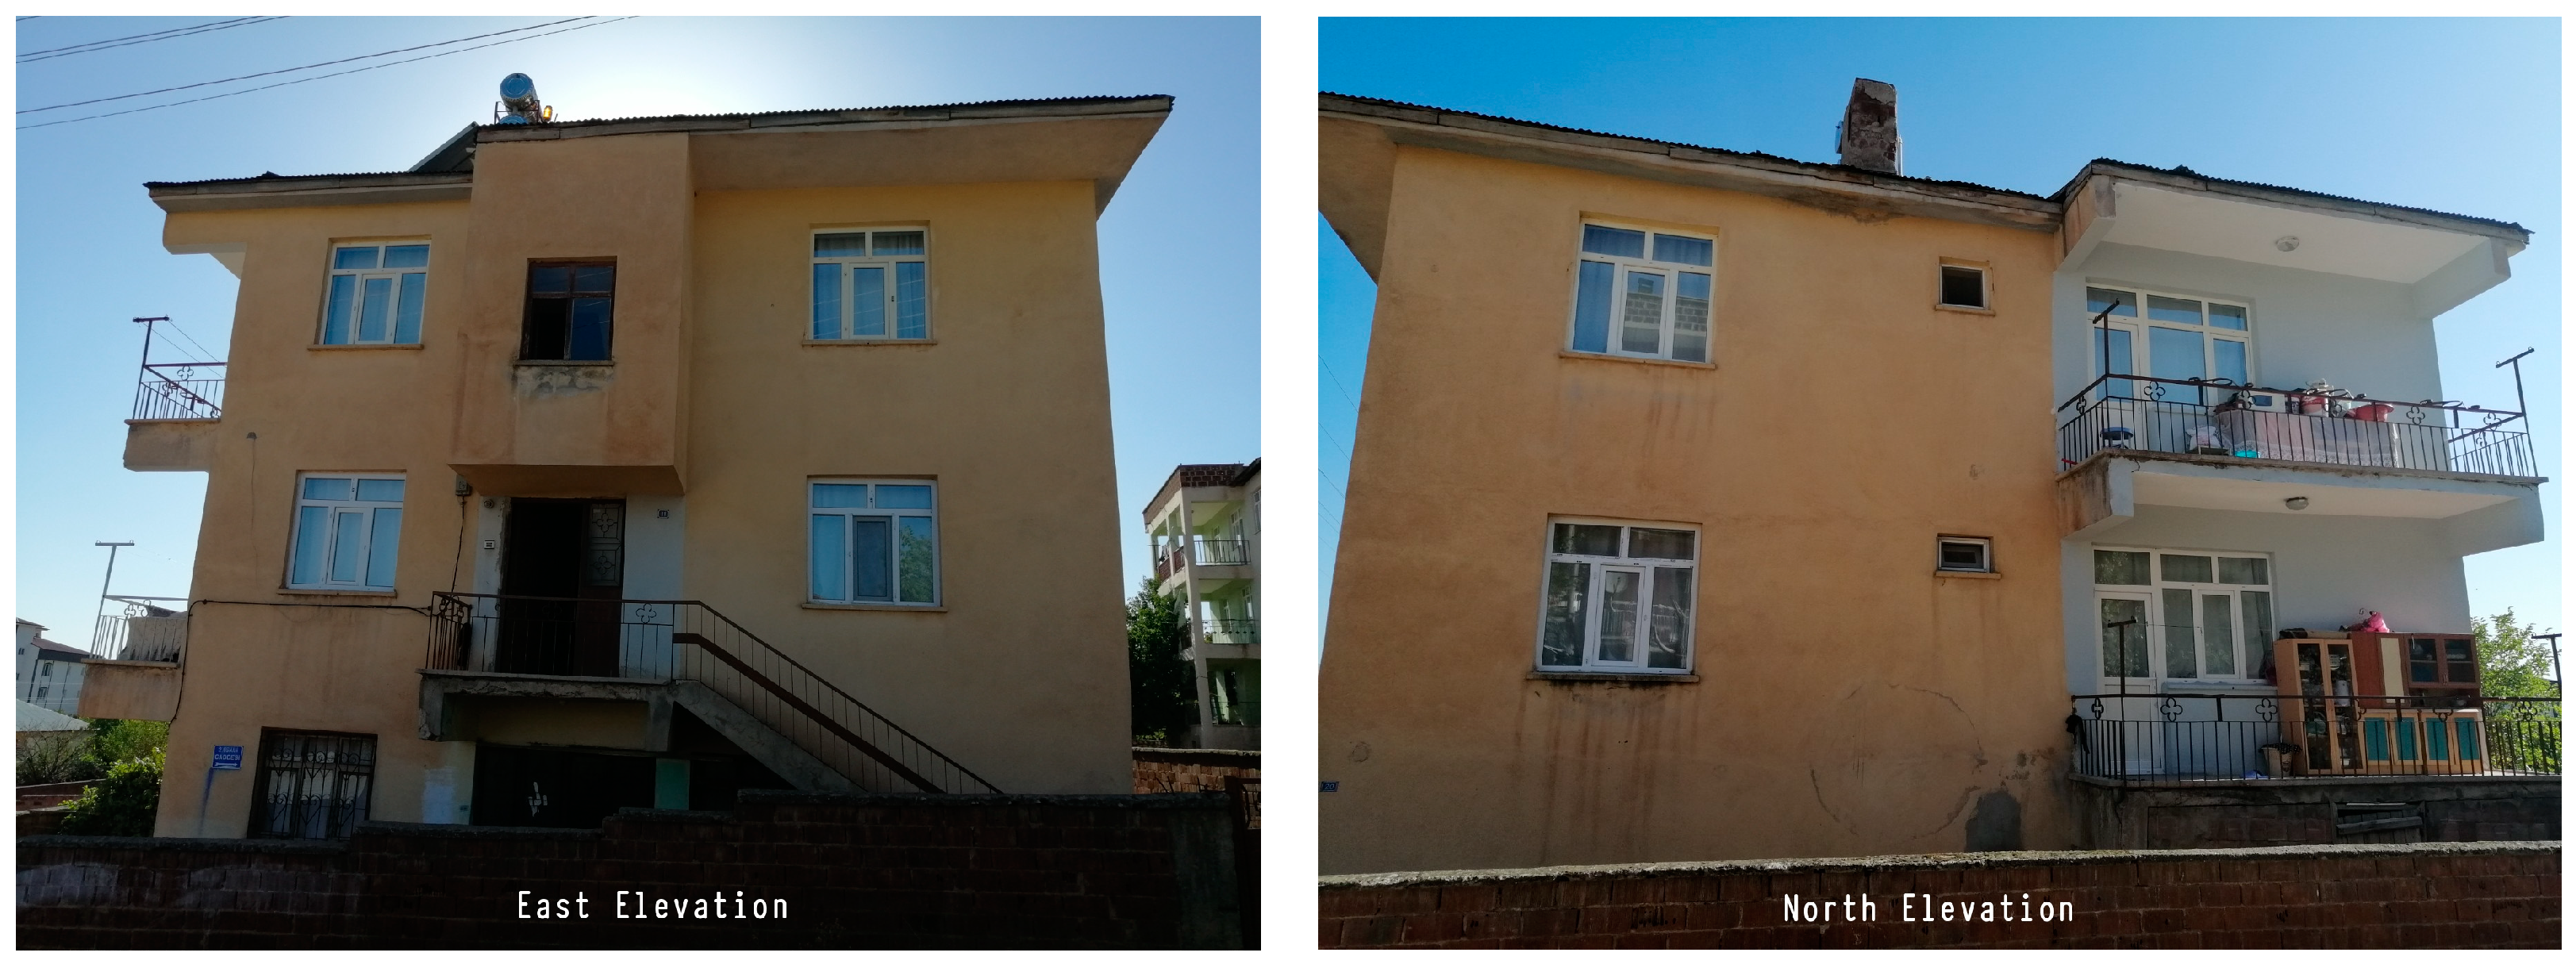
4.1. A Case Study
4.2. Identification of Retrofit Scenarios
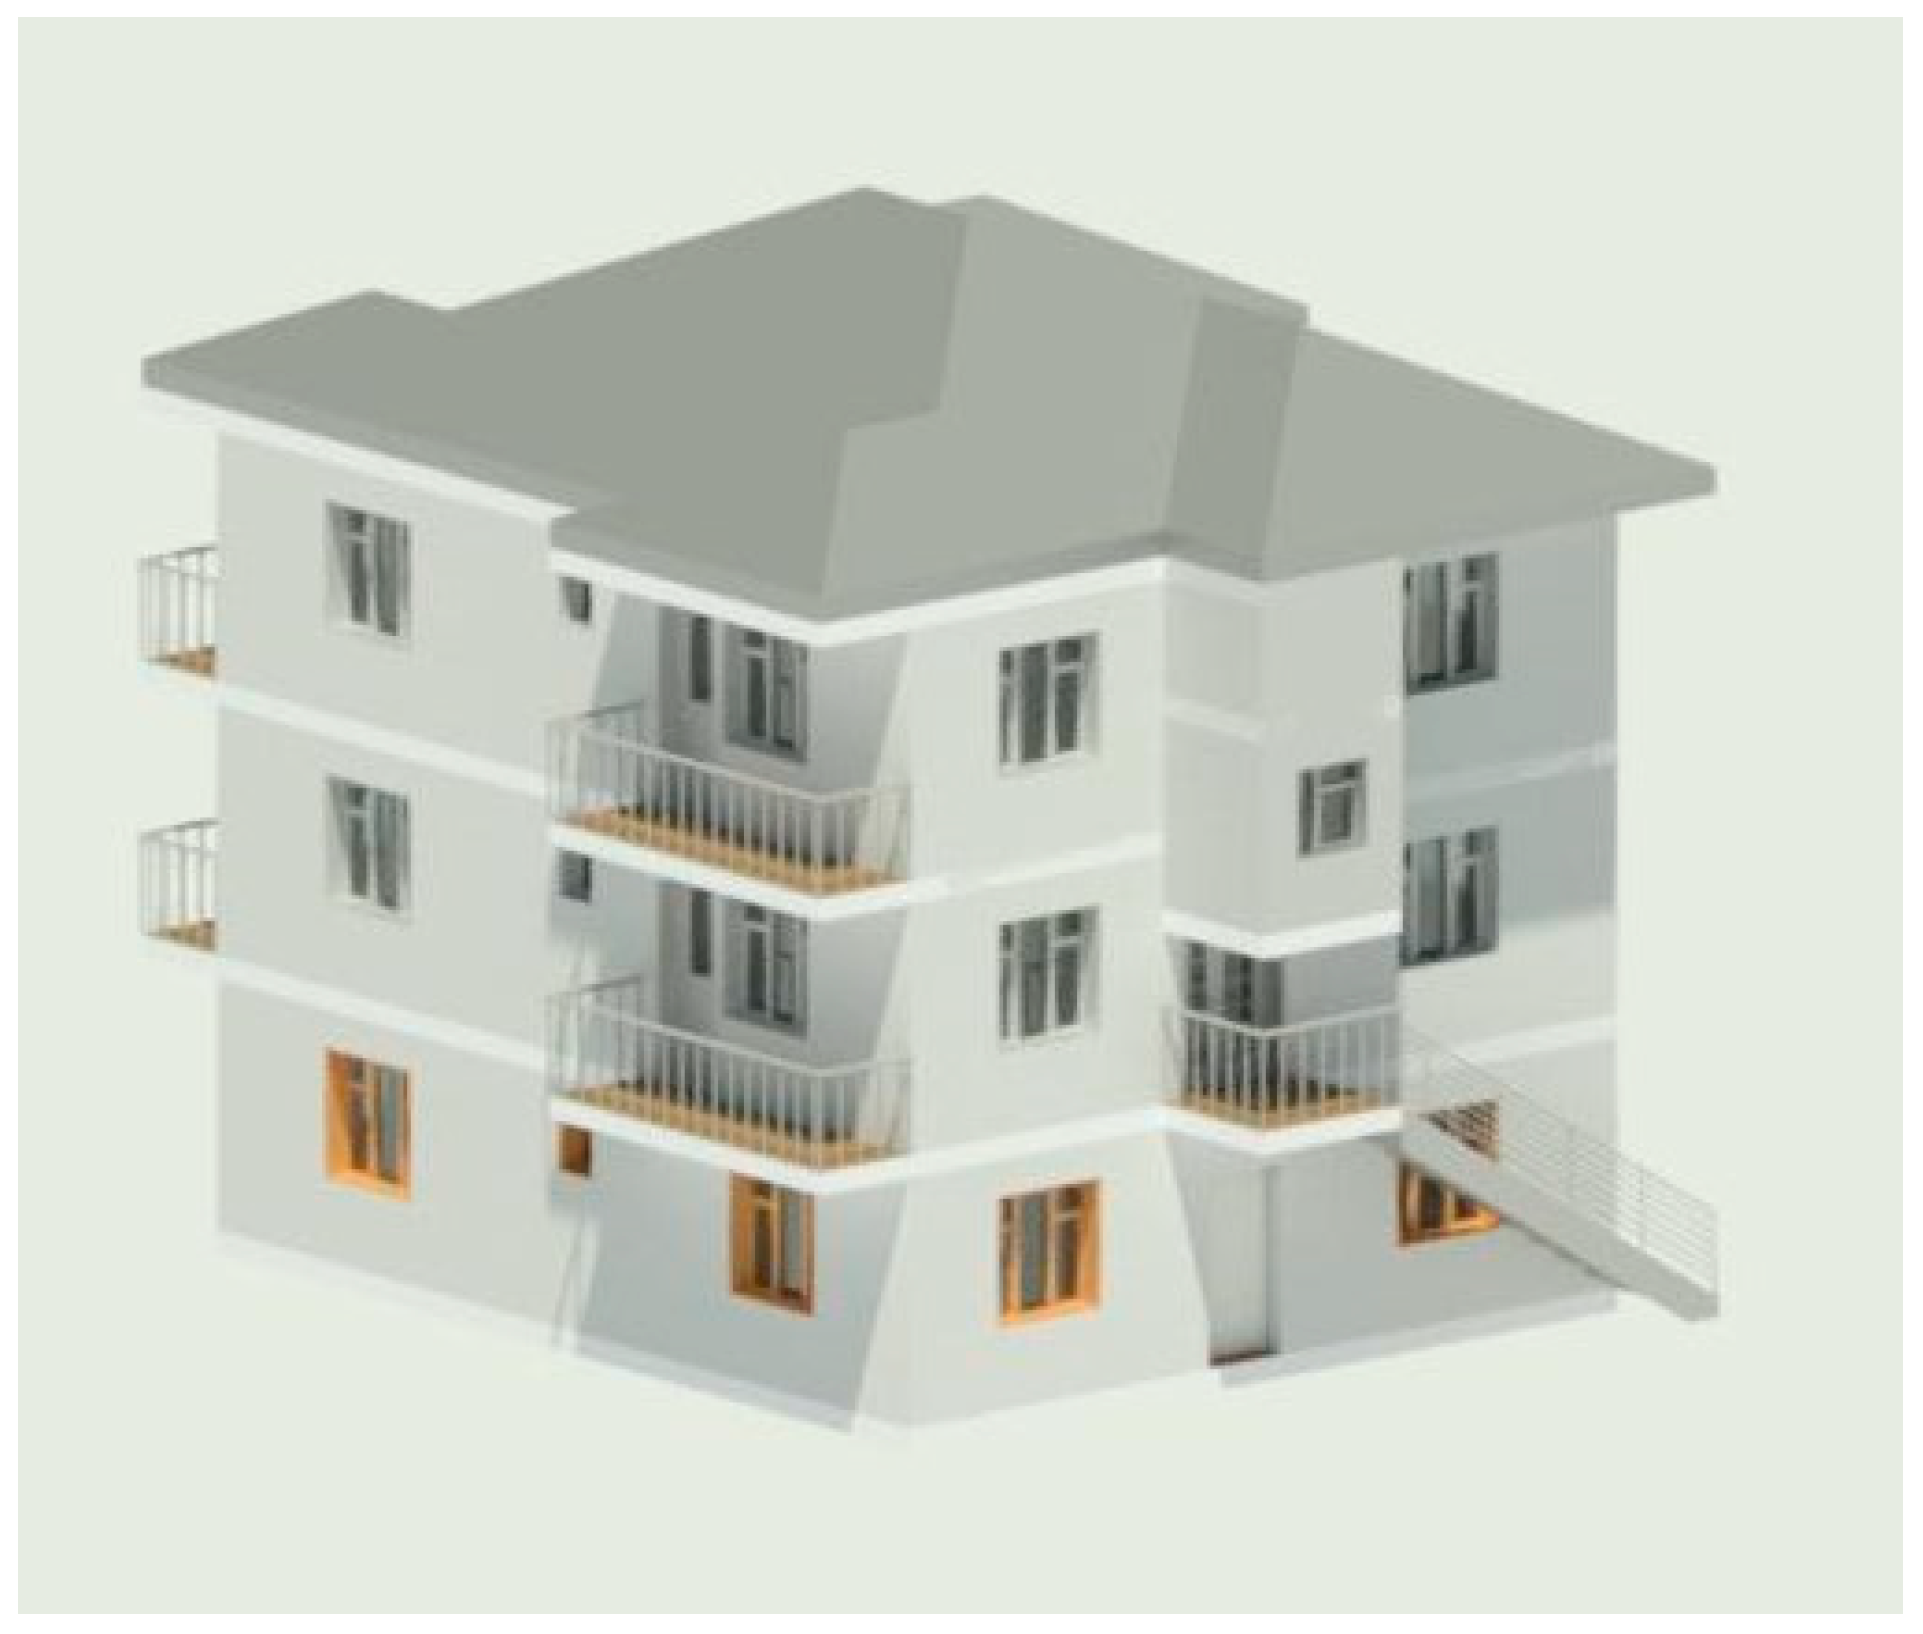
4.3. Development of the BIM Model
4.4. Energy Simulation in Green Building Studio
5. Results
5.1. Analysis of the Existing Case
5.2. Analysis of the Retrofit Scenarios
5.2.1. The Impact of the Wall Material on Energy Performance
5.2.2. The Impact of Roofing Material on Energy Performance
5.2.3. The Impact of Insulation Material/Thickness on Energy Performance
5.2.4. The Impact of Glazing on Energy Performance
5.2.5. The Impact of Lighting Power Density on Energy Performance
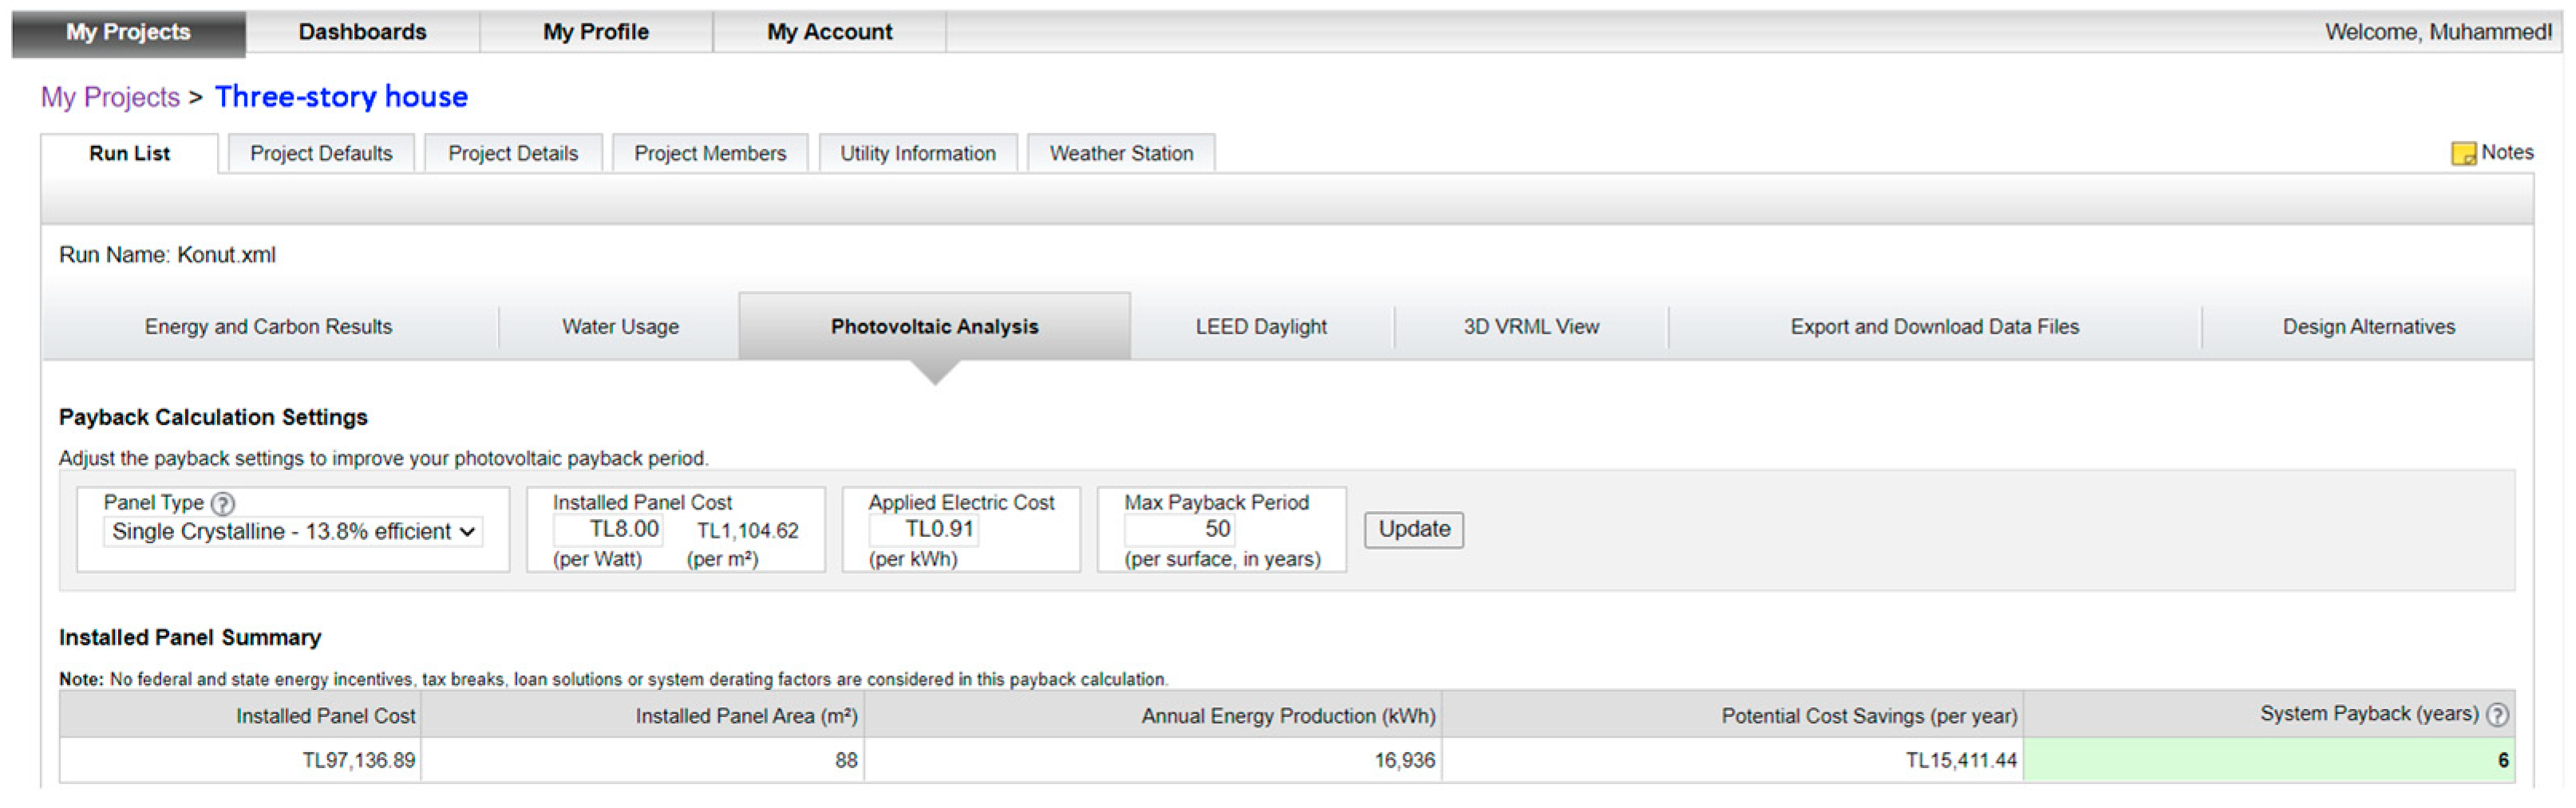
5.2.6. The Impact of Photovoltaic Panels on Energy Performance
5.3. Analysis of 192 Alternative Scenarios
6. Discussion
6.1. Economic Analysis of Retrofit Scenarios
6.2. Validation of Results
6.3. Contribution of the Research, Limitations, and Future Work
- One of the main obstacles to upgrading existing buildings in Turkey relates to the lack of available documentation as the building regulations were not enforced properly. In this research, the data were manually captured using measurement equipment, which requires considerable time investments. Therefore, further research is needed to explore the effectiveness of other techniques, such as laser scanning.
- The cumbersome interoperability between BIM and energy simulation tools leads to significant time investments. In this study, after the development of each retrofit scenario in BIM, the model had to be re-exported in gbXML format, resulting in numerous files. There is a crucial need for seamless and real-time connection between BIM and energy simulation tools
- A significant disparity between the computational results of GBS and real utility bills has been identified for electricity consumption. Further research is needed to evaluate the reliability of the results generated from GBS and compare them with other energy simulation software.
- In this study, a case study was conducted on a low-rise residential building to test the BIM-based retrofitting approach. Future studies can be carried out on different contexts, typologies, scales, user groups, and climate zones.
7. Conclusions
Author Contributions
Funding
Data Availability Statement
Conflicts of Interest
References
- A&T Bank. 2021 Faaliyet Raporu. Turkey. 2021. Available online: https://www.atbank.com.tr/tr/yillik-faaliyet-raporlari-1 (accessed on 10 September 2021).
- KPMG. KPMG Perspektifinden İnşaat Sektörüne Bakış. Turkey. 2021. Available online: https://kpmg.com/tr/tr/home/gorusler/2021/08/2021-kpmg-perspektifinden-insaat-sektorune-bakis.html (accessed on 10 September 2021).
- Koç, A.; Yağlı, H.; Koç, Y.; Uğurlu, İ. Dünyada ve Türkiye’de Enerji Görünümünün Genel Değerlendirilmesi. Mühendis Ve Makina 2018, 59, 86–114. Available online: https://dergipark.org.tr/en/pub/muhendismakina/issue/48388/614281 (accessed on 10 September 2021).
- Koç, E.; Kaya, K. Enerji Kaynaklari–Yenilenebilir Enerji Durumu. Mühendis Ve Makina 2015, 56, 36–47. Available online: https://dergipark.org.tr/en/pub/muhendismakina/issue/54338/736171 (accessed on 10 September 2021).
- Erdem, K.O.Ç.; Şenel, M.C. Dünyada ve Türkiye’de enerji durumu-genel değerlendirme. Mühendis Ve Makina 2013, 54, 32–44. [Google Scholar]
- Koç, E.; Kaplan, E. Dünyada ve Türkiye’de Genel Enerji Durumu-I Dünya Değerlendirmesi. Termodinamik Dergisi 2008, 187, 70–80. [Google Scholar]
- Dean, B.; Dulac, J.; Petrichenko, K.; Graham, P. Global Status Report 2016: Towards Zero-Emission Efficient and Resilient Buildings; APO: Hawthorn, Australia, 2016. [Google Scholar]
- Savaşkan, M.O. Yüksek Enerji Performanslı Konut Yapıları İçin Bım Tabanlı Bir Açık Kaynak Bilgi Sistemi Modeli. Doctoral Thesis, Fen Bilimleri Enstitüsü, Nilufer, Turkey, 2015. [Google Scholar]
- Energy, B.P. Statistical Review of World Energy globally consistent data on world energy markets and authoritative publications in the field of energy. BP Energy Outlook 2021, 70, 8–20. [Google Scholar]
- Carvalho, J.P.; Bragança, L.; Mateus, R. Optimising building sustainability assessment using BIM. Autom. Constr. 2019, 102, 170–182. [Google Scholar] [CrossRef]
- Zimmermann, R.K.; Skjelmose, O.; Jensen, K.G.; Jensen, K.K.; Birgisdottir, H. Categorizing building certification systems according to the definition of sustainable building. IOP Conf. Ser. Mater. Sci. Eng. 2019, 471, 092060. [Google Scholar] [CrossRef]
- Çelik, E. Yeşil Bina Sertifika Sistemlerinin Incelenmesi Türkiye’de Uygulanabilirliklerinin Değerlendirilmesi. Doctoral Thesis, Fen Bilimleri Enstitüsü, Nilufer, Turkey, 2009. [Google Scholar]
- Şimşek, E.P. Sürdürülebilirlik Bağlamında Yeşil Bina Olma Kriterleri “Kağıthane Ofispark Projesi Örneği”. Doctoral Thesis, Fen Bilimleri Enstitüsü, Nilufer, Turkey, 2012. [Google Scholar]
- Erdede, S.B.; Erdede, B.; Bektaş, S. Sürdürülebilir yeşil binalar ve sertifika sistemlerinin değerlendirilmesi. In Proceedings of the Uzaktan Algılama-Cbs Sempozyumu (UZAL-CBS 2014), Istanbul, Turkey, 14–17 October 2014. [Google Scholar]
- Erdede, S.B.; Bektaş, S. Türkiye için yeşil bina sertifika sistemi gerekliliği. In Proceedings of the 2nd International Symposium on Innovative Approaches in Scientific Studies, Samsun, Turkey, 30 November 2018; pp. 138–143. [Google Scholar]
- Azhar, S.; Nadeem, A.; Mok, J.Y.; Leung, B.H. Building Information Modeling (BIM): A new paradigm for visual interactive modeling and simulation for construction projects. In Proceedings of the First International Conference on Construction in Developing Countries 2008, Karachi, Pakistan, 4–5 August 2008; Volume 1, pp. 435–446. [Google Scholar]
- Azhar, S. Building information modeling (BIM): Trends, benefits, risks, and challenges for the AEC industry. Leadersh. Manag. Eng. 2011, 11, 241–252. [Google Scholar] [CrossRef]
- Glick, S.; Guggemos, A. IPD and BIM: Benefits and opportunities for regulatory agencies. In Proceedings of the 45th ASC National Conference, Gainesville, FL, USA, 1–4 April 2009; Volume 2. [Google Scholar]
- Ahmed, W.; Asif, M. BIM-based techno-economic assessment of energy retrofitting residential buildings in hot humid climate. Energy Build. 2020, 227, 110406. [Google Scholar] [CrossRef]
- Scherer, R.J.; Katranuschkov, P. BIMification: How to create and use BIM for retrofitting. Adv. Eng. Inform. 2018, 38, 54–66. [Google Scholar] [CrossRef]
- Taha, F.F.; Hatem, W.A.; Jasim, N.A. Utilizing BIM technology to improve sustainability analyses for Iraqi Construction Projects. Asian J. Civ. Eng. 2020, 21, 1205–1215. [Google Scholar] [CrossRef]
- Abhinaya, K.S.; Kumar, V.P.; Krishnaraj, L. Assessment and remodelling of a conventional building into a green building using BIM. Int. J. Renew. Energy Res. (IJRER) 2017, 7, 1675–1681. [Google Scholar] [CrossRef]
- Ahsan, M.M.; Zulqernain, M.; Ahmad, H.; Wajid, B.A.; Shahzad, S.; Hussain, M. Reducing the operational energy consumption in buildings by passive cooling techniques using building information modelling tools. Int. J. Renew. Energy Res. (IJRER) 2019, 9, 343–353. [Google Scholar] [CrossRef]
- Kim, S.; Zadeh, P.A.; Staub-French, S.; Froese, T.; Cavka, B.T. Assessment of the impact of window size, position and orientation on building energy load using BIM. Procedia Eng. 2016, 145, 1424–1431. [Google Scholar] [CrossRef]
- Habibi, S.; Obonyo, E.A.; Memari, A.M. Design and development of energy efficient re-roofing solutions. Renew. Energy 2020, 151, 1209–1219. [Google Scholar] [CrossRef]
- Egwunatum, S.; Joseph-Akwara, E.; Akaigwe, R. Optimizing energy consumption in building designs using building information model (BIM). Slovak J. Civ. Eng. 2016, 24, 19–28. [Google Scholar] [CrossRef]
- Abanda, F.H.; Byers, L. An investigation of the impact of building orientation on energy consumption in a domestic building using emerging BIM (Building Information Modelling). Energy 2016, 97, 517–527. [Google Scholar] [CrossRef]
- He, Q.; Ng, S.T.; Hossain, M.U.; Skitmore, M. Energy-efficient window retrofit for high-rise residential buildings in different climatic zones of China. Sustainability 2019, 11, 6473. [Google Scholar] [CrossRef]
- Jeon, J.; Lee, J.; Ham, Y. Quantifying the impact of building envelope condition on energy use. Build. Res. Inf. 2019, 47, 404–420. [Google Scholar] [CrossRef]
- Mimarobot. Available online: https://mimarobot.com/hesap/ (accessed on 17 November 2021).
- Available online: https://santiyede.com/2020-yili-insaat-birim-fiyatlari/ (accessed on 19 November 2021).
- Available online: https://www.birimfiyat.net/ (accessed on 19 November 2021).
- Ryan, E.M.; Sanquist, T.F. Validation of building energy modeling tools under idealized and realistic conditions. Energy Build. 2012, 47, 375–382. [Google Scholar] [CrossRef]
- Reeves, T.; Olbina, S.; Issa, R. Validation of building energy modeling tools: Ecotect™, green building Studio™ and IES™. In Proceedings of the 2012 Winter Simulation Conference (WSC), Berlin, Germany, 9–12 December 2012; pp. 1–12. [Google Scholar] [CrossRef]
- Maamari, F.; Andersen, M.; de Boer, J.; Carroll, W.L.; Dumortier, D.; Greenup, P. Experimental validation of simulation methods for bi-directional transmission properties at the daylighting performance level. Energy Build. 2006, 38, 878–889. [Google Scholar] [CrossRef]


| Element | Description | |
|---|---|---|
| Typology | House | |
| Location | Kovancilar, Elazig, Turkey | |
| Occupants | 9 | |
| Total area | 254 m2 | |
| Total floors | 3 | |
| Orientation | North–south | |
| Floor height | 2.8 m | |
| Window-to-wall ratio | South | 15% |
| North | 11% | |
| East | 15% | |
| West | 25% | |
| Exterior walls | Layers | Paint, 1.5 cm plaster, 30 cm brick, 1.5 cm plaster, paint |
| U-value | 1.58 W/m2-K | |
| Interior walls | Layers | Paint, 1.5 cm plaster, 15 cm brick, 1.5 cm plaster, paint |
| U-value | 2.33 W/m2-K | |
| Roof | Layers | Timber structure, corrugated iron roofing |
| U-value | 0.70 W/m2-K | |
| Ground floor | Layers | 2 cm timber flooring, 5 cm concrete slab topping, concrete slab 30 cm |
| U-value | 1.82 W/m2-K | |
| Interior floors | Layers | 2 cm timber flooring, 5 cm concrete slab topping, concrete slab 15 cm, 1.5 cm plaster, paint |
| U-value | 2.48 W/m2-K | |
| Glazing | Single glass | U-value: 3.13 W/m2-K |
| Double glass | U-value: 6.70 W/m2-K | |
| Shading | None | |
| Lighting | Type | Light-emitting diodes (LED) |
| Power density | 10.76 W/m2 | |
| Heating | Natural gas hydronic heating | |
| Air conditioning | None | |
| Retrofit Element | Existing | Proposed |
|---|---|---|
| Wall | Brick (exterior U-value: 1.58 W/m2-K; interior U-value: 2.33 W/m2-K) | Pumice (exterior U-value: 0.66 W/m2-K; interior U-value: 0.98 W/m2-K); Aerated concrete (exterior U-value: 0.36 W/m2-K; interior U-value: 0.53 W/m2-K) |
| Roofing | Corrugated iron (U-value: 0.70 W/m2-K) | Slate (U-value: 0.69 W/m2-K); Tile (U-value: 0.67 W/m2-K); Shingle (U-value: 0.65 W/m2-K); Wood shake (U-value: 0.54 W/m2-K) |
| Insulation | None | Stone wool (6 cm U-value: 0.43 W/m2-K, 8 cm U-value: 0.34 W/m2-K); Glass wool (6 cm U-value: 0.41 W/m2-K, 8 cm U-value: 0.33 W/m2-K); Expanded polystyrene (EPS) (6 cm U-value: 0.38 W/m2-K, 8 cm U-value: 0.30 W/m2-K); Extruded polystyrene (XPS) (6 cm U-value: 0.35 W/m2-K, 8 cm U-value: 0.28 W/m2-K) |
| Glazing | Single glazing (U-value: 6.70 W/m2-K; SHGC: 0.19) Double glazing (U-value: 3.13 W/m2-K; SHGC: 0.21) | Low E double glazing (U-value: 2.10 W/m2-K; SHGC: 0.24); Uncoated double glazing (U-value: 1.99 W/m2-K; SHGC: 0.62); Triple glazing (U-value: 1.53 W/m2-K; SHGC: 0.68) |
| Lighting power density (LPD) | 10.76 W/m2 | 0 W/m2; 2.15 W/m2; 4.31 W/m2; 6.46 W/m2; 8.61 W/m2; 12.92 W/m2; 15.07 W/m2; 17.22 W/m2; 19.38 W/m2; 21.53 W/m2; 26.91 W/m2; 32.29 W/m2; 43.06 W/m2; 53.82 W/m2 |
| Photovoltaic panels | None | Single crystalline—13.8% efficient |
| Scenario | Annual Fuel Consumption (MJ) | Annual Electricity Consumption (kWh) | Annual Energy Cost (TL) | Lifecycle Energy Cost (TL) | Energy Use Intensity (MJ/m2/Year) | Annual Carbon Emissions (mg) |
|---|---|---|---|---|---|---|
| Existing case | 241,021 | 26,147 | 34,210 | 465,974 | 1320.7 | 12.0 |
| Scenario | Annual Fuel Consumption (MJ) | Annual Electricity Consumption (kWh) | Annual Energy Cost (TL) | Lifecycle Energy Cost (TL) | Energy Use Intensity (MJ/m2/Year) | Annual Carbon Emissions (mg) |
|---|---|---|---|---|---|---|
| Brick | 241,021 | 26,147 | 34,210 | 465,974 | 1320.7 | 12.0 |
| Pumice | 194,947 | 25,484 | 31,616 | 430,629 | 1129.7 | 9.7 |
| Aerated concrete | 173,529 | 25,184 | 30,417 | 414,307 | 1041.1 | 8.7 |
| Scenario | Annual Fuel Consumption (MJ) | Annual Electricity Consumption (kWh) | Annual Energy Cost (TL) | Lifecycle Energy Cost (TL) | Energy Use Intensity (MJ/m2/Year) | Annual Carbon Emissions (mg) |
|---|---|---|---|---|---|---|
| Corrugated iron | 241,021 | 26,147 | 34,210 | 465,974 | 1320.7 | 12.0 |
| Slate | 240,924 | 26,144 | 34,203 | 465,879 | 1320.3 | 12.0 |
| Tile | 240,850 | 26,137 | 34,194 | 465,755 | 1319.9 | 12.0 |
| Shingle | 240,674 | 26,136 | 34,186 | 465,638 | 1319.2 | 12.0 |
| Wood shake | 239,693 | 26,110 | 34,120 | 464,739 | 1314.9 | 12.0 |
| Scenario | Annual Fuel Consumption (MJ) | Annual Electricity Consumption (kWh) | Annual Energy Cost (TL) | Lifecycle Energy Cost (TL) | Energy Use Intensity (MJ/m2/Year) | Annual Carbon Emissions (mg) |
|---|---|---|---|---|---|---|
| No insulation | 241,021 | 26,147 | 34,210 | 465,974 | 1320.7 | 12.0 |
| Stone wool—6 cm | 184,021 | 25,152 | 30,842 | 420,086 | 1088.2 | 9.2 |
| Stone wool—8 cm | 178,321 | 25,016 | 30,472 | 415,045 | 1067.5 | 8.9 |
| Glass wool—6 cm | 182.877 | 25,139 | 30,780 | 419,251 | 1083.5 | 9.1 |
| Glass wool—8 cm | 177,287 | 25,005 | 30,416 | 414,294 | 1063.2 | 8.8 |
| EPS—6 cm | 181,051 | 25,118 | 30,683 | 417,921 | 1075.9 | 9.0 |
| EPS—8 cm | 175,654 | 24,987 | 30,330 | 413,111 | 1056.5 | 8.8 |
| XPS—6 cm | 179,000 | 25,097 | 30,579 | 416,502 | 1067.9 | 8.9 |
| XPS—8 cm | 173,911 | 24,968 | 30,237 | 411,850 | 1049.3 | 8.7 |
| Scenario | Annual Fuel Consumption (MJ) | Annual Electricity Consumption (kWh) | Annual Energy Cost (TL) | Lifecycle Energy Cost (TL) | Energy Use Intensity (MJ/m2/Year) | Annual Carbon Emissions (mg) |
|---|---|---|---|---|---|---|
| Single glazing + double glazing | 241,021 | 26,147 | 34,210 | 465,974 | 1320.7 | 12.0 |
| Low E double glazing | 217,711 | 26,309 | 33,551 | 454,266 | 1231.1 | 10.9 |
| Uncoated double glazing | 182,694 | 28,212 | 33,568 | 457,225 | 1120.1 | 9.1 |
| Triple glazing | 172,557 | 28,674 | 33,551 | 456,991 | 1086.8 | 8.6 |
| Scenario | Annual Fuel Consumption (MJ) | Annual Electricity Consumption (kWh) | Annual Energy Cost (TL) | Lifecycle Energy Cost (TL) | Energy Use Intensity (MJ/m2/Year) | Annual Carbon Emissions (Mg) |
|---|---|---|---|---|---|---|
| 10.76 W/m2 | 241,021 | 26,147 | 34,210 | 465,974 | 1320.7 | 12.0 |
| 8.61 W/m2 | 246,960 | 24,021 | 32,532 | 443,121 | 1313.9 | 12.3 |
| 6.46 W/m2 | 252,968 | 21,897 | 30,860 | 420,341 | 1307.5 | 12.6 |
| 4.31 W/m2 | 259,042 | 19,737 | 29,156 | 397,138 | 1300.8 | 12.9 |
| 2.15 W/m2 | 265,150 | 17,622 | 27,495 | 374,521 | 1294.8 | 13.2 |
| 0 W/m2 | 271,300 | 15,452 | 25,787 | 351,255 | 1288.3 | 13.5 |
| 12.92 W/m2 | 235,123 | 28,279 | 35,896 | 488,928 | 1327.7 | 11.7 |
| 15.07 W/m2 | 229,301 | 30,413 | 37,586 | 511,952 | 1335.0 | 11.4 |
| 17.22 W/m2 | 223,569 | 32,551 | 39,284 | 535,077 | 1342.8 | 11.1 |
| 19.38 W/m2 | 217,882 | 34,692 | 40,987 | 558,266 | 1350.7 | 10.9 |
| 21.53 W/m2 | 212,238 | 36,838 | 42,695 | 581,533 | 1358.9 | 10.6 |
| 26.91 W/m2 | 198,273 | 42,217 | 46,987 | 639,987 | 1380.2 | 9.9 |
| 32.29 W/m2 | 184,768 | 47,613 | 51,313 | 698,910 | 1403.5 | 9.2 |
| 43.06 W/m2 | 159,498 | 58,457 | 60,089 | 818,437 | 1457.8 | 8.0 |
| 53.82 W/m2 | 136,434 | 69,428 | 69,076 | 940,832 | 1522.6 | 6.8 |
| Scenario | Annual Fuel Consumption (MJ) | Annual Electricity Consumption (kWh) | Annual Energy Cost (TL) | Lifecycle Energy Cost (TL) | Energy Use Intensity (MJ/m2/Year) | Annual Carbon Emissions (mg) |
|---|---|---|---|---|---|---|
| Aerated concrete + Wood shake + XPS 8 cm + Triple glazing | 92,287 | 27,952 | 29,425 | 400,775 | 767.3 | 4.6 |
| Aerated concrete + Wood shake + XPS 8 cm + Low E glazing | 128,632 | 24,912 | 28,229 | 384,500 | 868.4 | 6.4 |
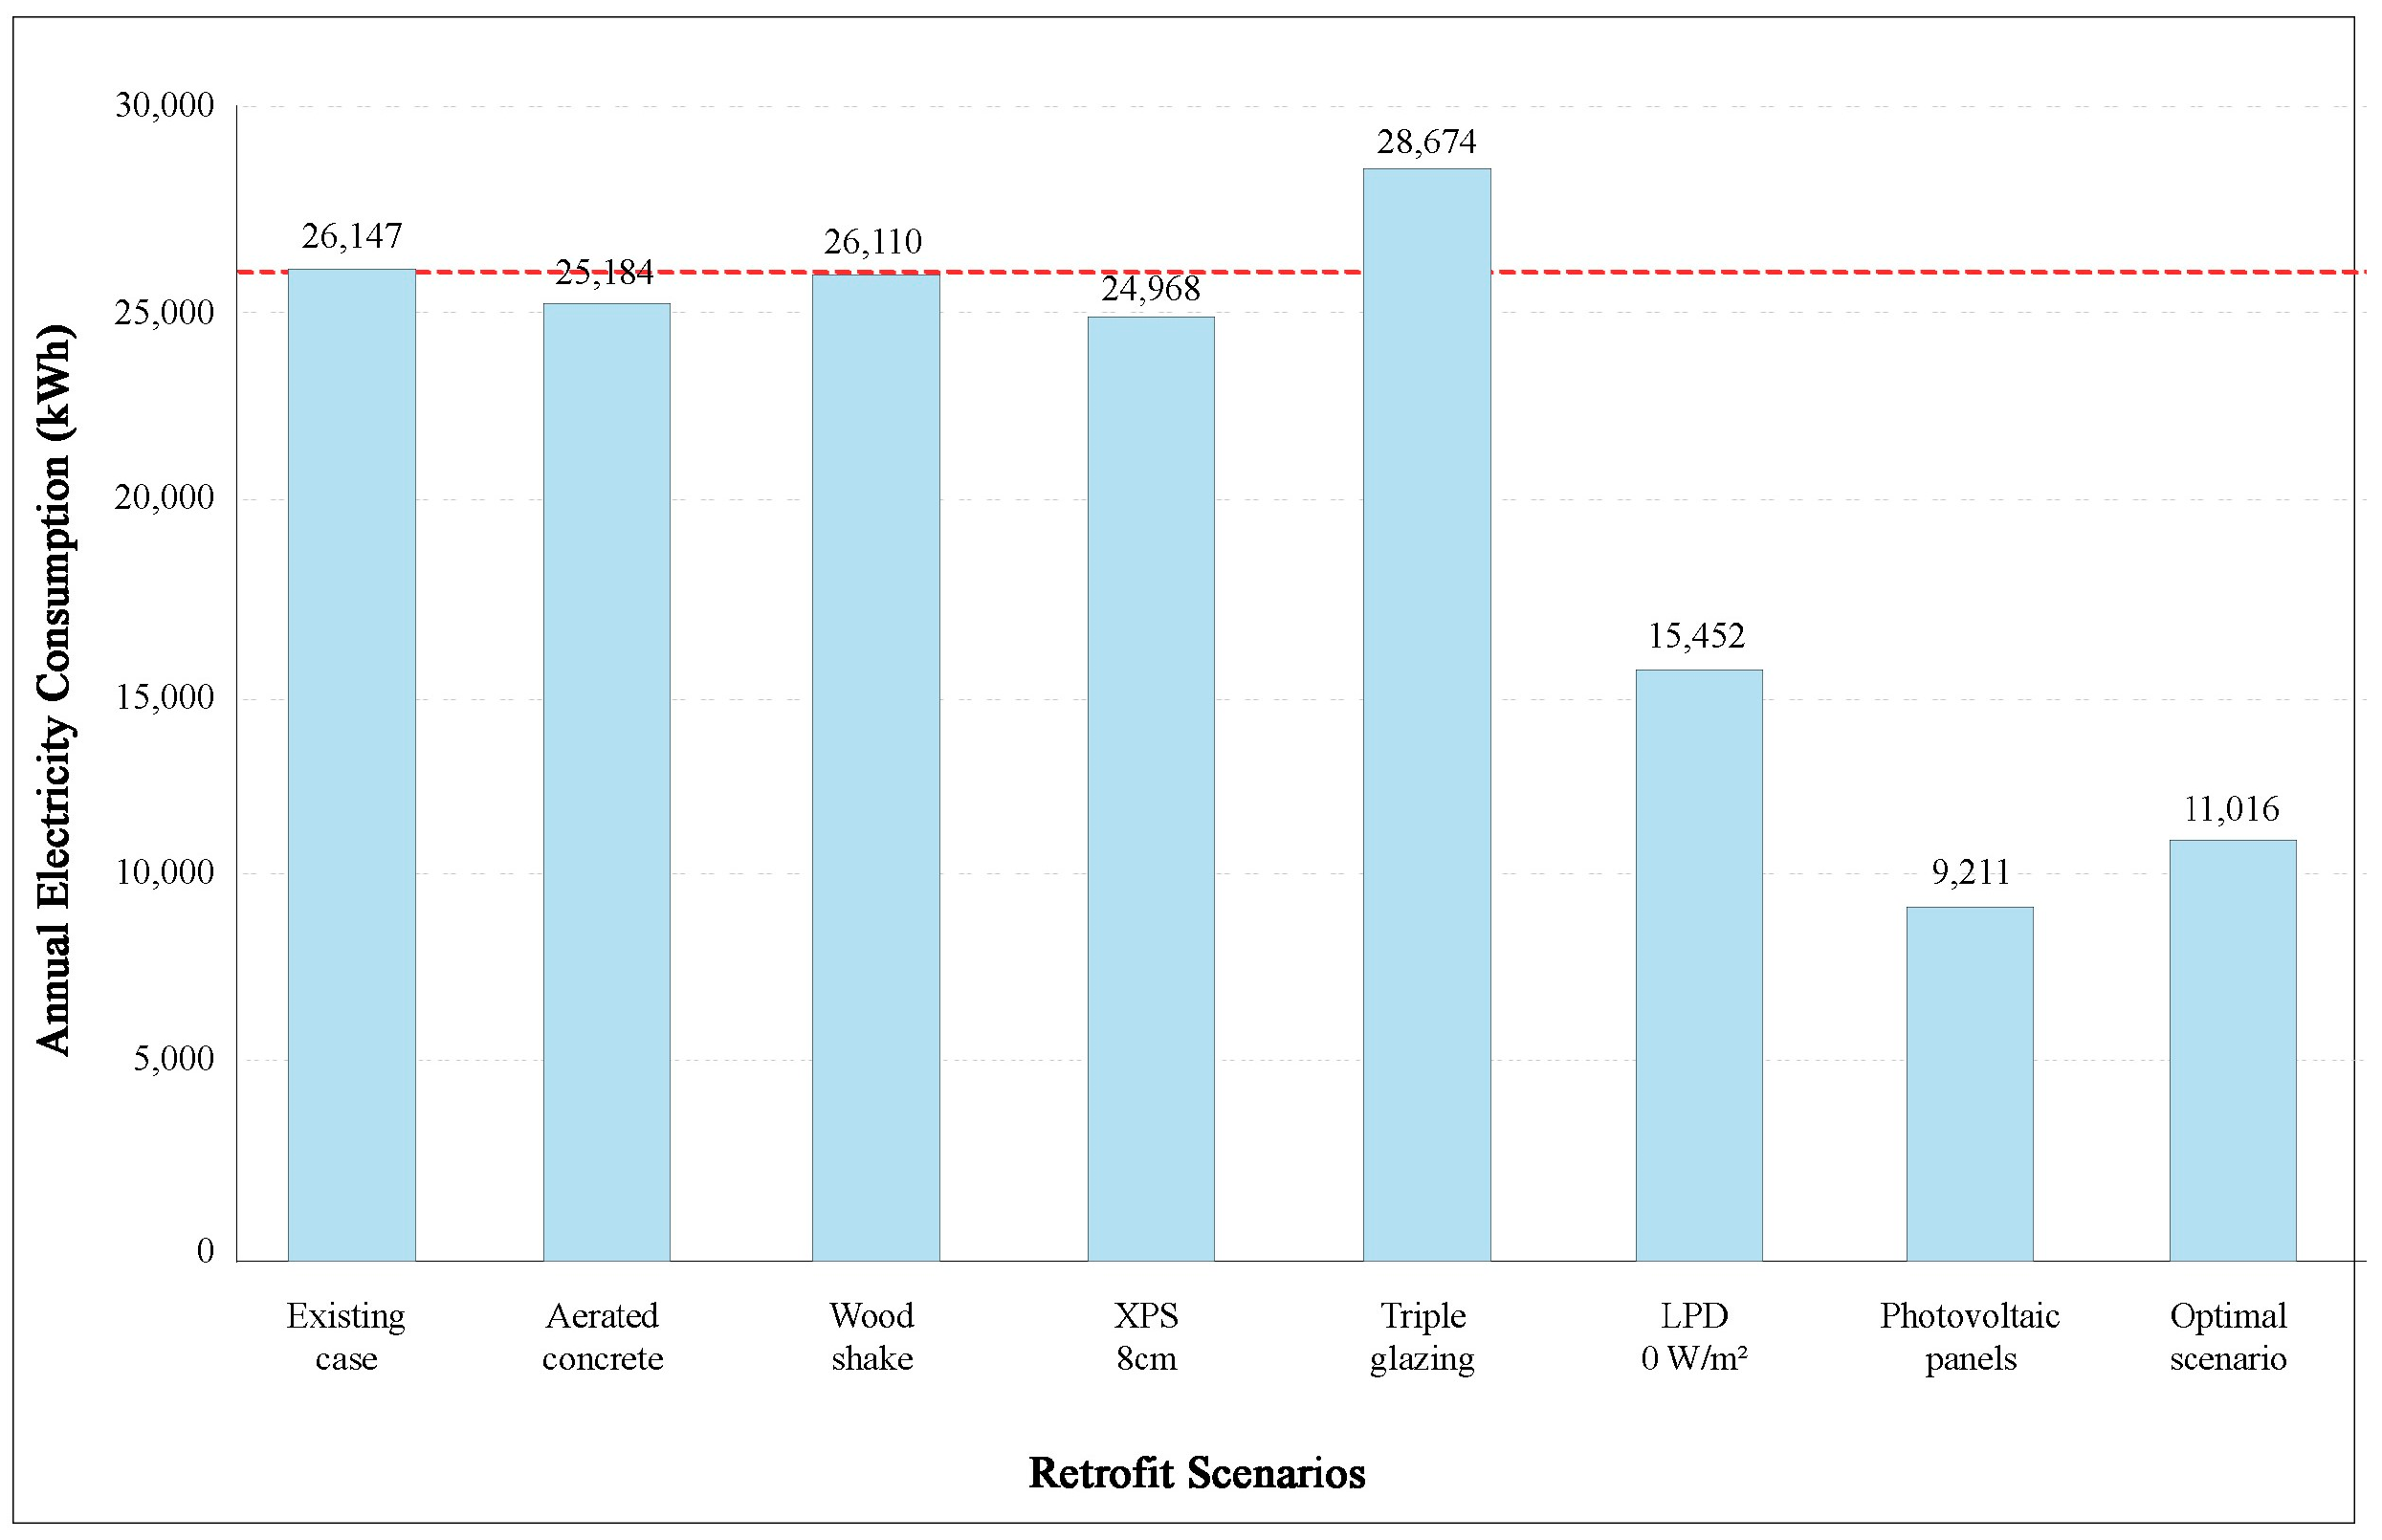
| Scenario | Annual Fuel Consumption (MJ) | Annual Electricity Consumption (kWh) | Annual Energy Cost (TL) | Lifecycle Energy Cost (TL) | Energy Use Intensity (MJ/m2/Year) | Annual Carbon Emissions (mg) |
|---|---|---|---|---|---|---|
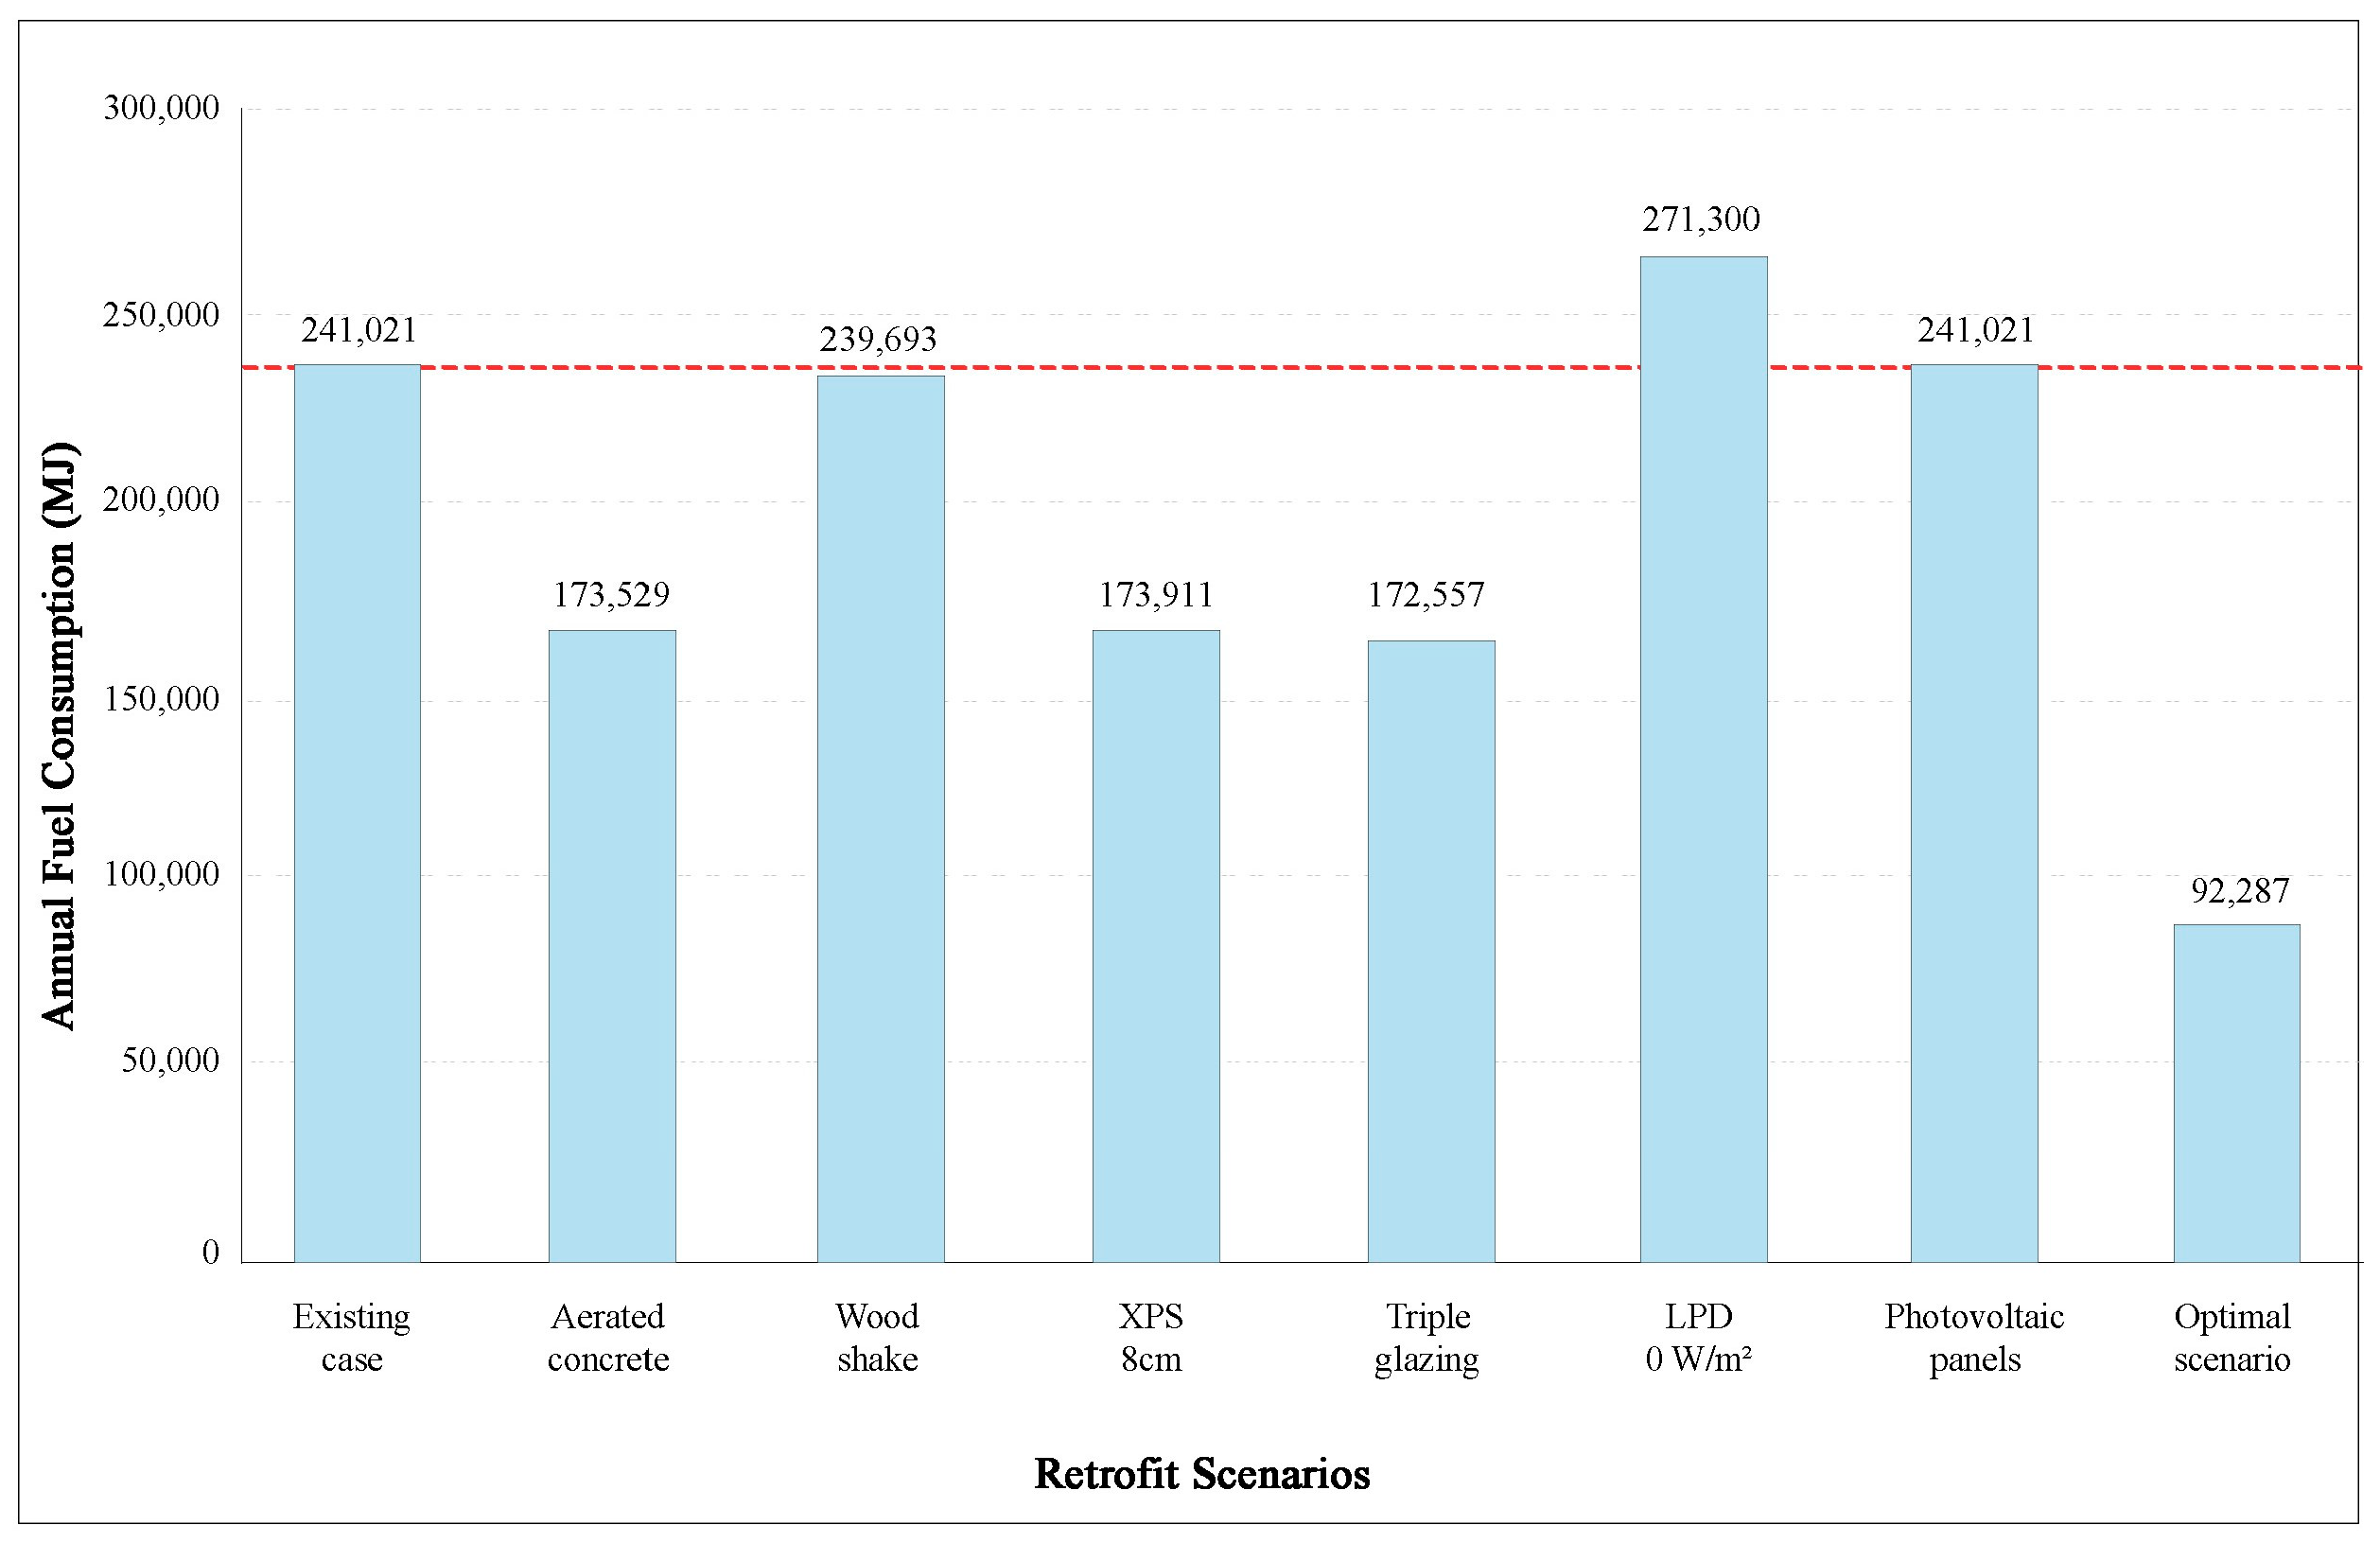
| Existing case | 241,021 | 26,147 | 34,210 | 465,974 | 1320.7 | 12.0 |
| Aerated concrete | 173,529 | 25,184 | 30,417 | 414,307 | 1041.1 | 8.7 |
| Wood shake | 239,693 | 26,110 | 34,120 | 464,739 | 1314.9 | 12.0 |
| XPS—8 cm | 173,911 | 24,968 | 30,237 | 411,850 | 1049.3 | 8.7 |
| Triple glazing | 172,557 | 28,674 | 33,551 | 456,991 | 1086.8 | 8.6 |
| LPD—0 W/m2 | 271,300 | 15,452 | 25,787 | 351,255 | 1288.3 | 13.5 |
| Photovoltaic panels | 241,021 | 9211 | 18,022 | 245,459 | 1079.4 | 12.0 |
| Optimal scenario | 92,287 | 11,016 | 13,715 | 186,798 | 519.4 | 4.6 |
| Retrofit Scenario | Quantity | Cost of Material and Labor (TL) | Total Cost (TL) | |
|---|---|---|---|---|
| Aerated concrete walls | Demolition of the brick walls | 558 m2 | 20 | 11,160 |
| Building aerated concrete walls | 558 m2 | 80 | 44,640 | |
| Gypsum plaster + paint | 690 m2 | 26 | 17,940 | |
| Cement plaster + paint | 320 m2 | 82 | 26,240 | |
| Total | 99,980 | |||
| Wood shake roofing | Removing the corrugated iron roof sheet | 153 m2 | 32 | 4900 |
| Installing wood shake roofing | 153 m2 | 150 | 22,950 | |
| Total | 27,850 | |||
| Triple window glazing | Removing the existing windows | 55 m2 | 14.5 | 800 |
| Installing the new windows with triple glazing | 55 m2 | 310 | 17,050 | |
| Total | 17,850 | |||
| 8 cm XPS insulation | Insulating the exterior walls | 320 m2 | 92 | 29,440 |
| LPD—0 W/m2 | Replacing lighting fixtures | 56 items | 50 | 2800 |
| Photovoltaic panels | Installing photovoltaic panels | 88 m2 | 1104 | 97,130 |
| Total | 275,050 TL | |||
| Annual Fuel Consumption (MJ) | Annual Fuel Cost (TL) | Annual Electricity Consumption (kWh) | Annual Electricity Cost (TL) | |
|---|---|---|---|---|
| GBS | 241,021 | 10,417 | 26,147 | 23,793 |
| Utility bills | 216,496 | 9360 | 6593 | 6000 |
Disclaimer/Publisher’s Note: The statements, opinions and data contained in all publications are solely those of the individual author(s) and contributor(s) and not of MDPI and/or the editor(s). MDPI and/or the editor(s) disclaim responsibility for any injury to people or property resulting from any ideas, methods, instructions or products referred to in the content. |
© 2023 by the authors. Licensee MDPI, Basel, Switzerland. This article is an open access article distributed under the terms and conditions of the Creative Commons Attribution (CC BY) license (https://creativecommons.org/licenses/by/4.0/).
Share and Cite
Yildirim, M.; Polat, H. Building Information Modeling Applications in Energy-Efficient Refurbishment of Existing Building Stock: A Case Study. Sustainability 2023, 15, 13600. https://doi.org/10.3390/su151813600
Yildirim M, Polat H. Building Information Modeling Applications in Energy-Efficient Refurbishment of Existing Building Stock: A Case Study. Sustainability. 2023; 15(18):13600. https://doi.org/10.3390/su151813600
Chicago/Turabian StyleYildirim, Muhammed, and Hasan Polat. 2023. "Building Information Modeling Applications in Energy-Efficient Refurbishment of Existing Building Stock: A Case Study" Sustainability 15, no. 18: 13600. https://doi.org/10.3390/su151813600