

Evaluation and Differentiation Analysis of China’s Construction of Ecological Civilization from the Perspective of Collaboration: Using China’s Representative Region as an Example
Abstract
:1. Introduction
1.1. Background
1.2. Literature Review
1.3. Article Structure
2. Materials and Methods
2.1. Data Sources
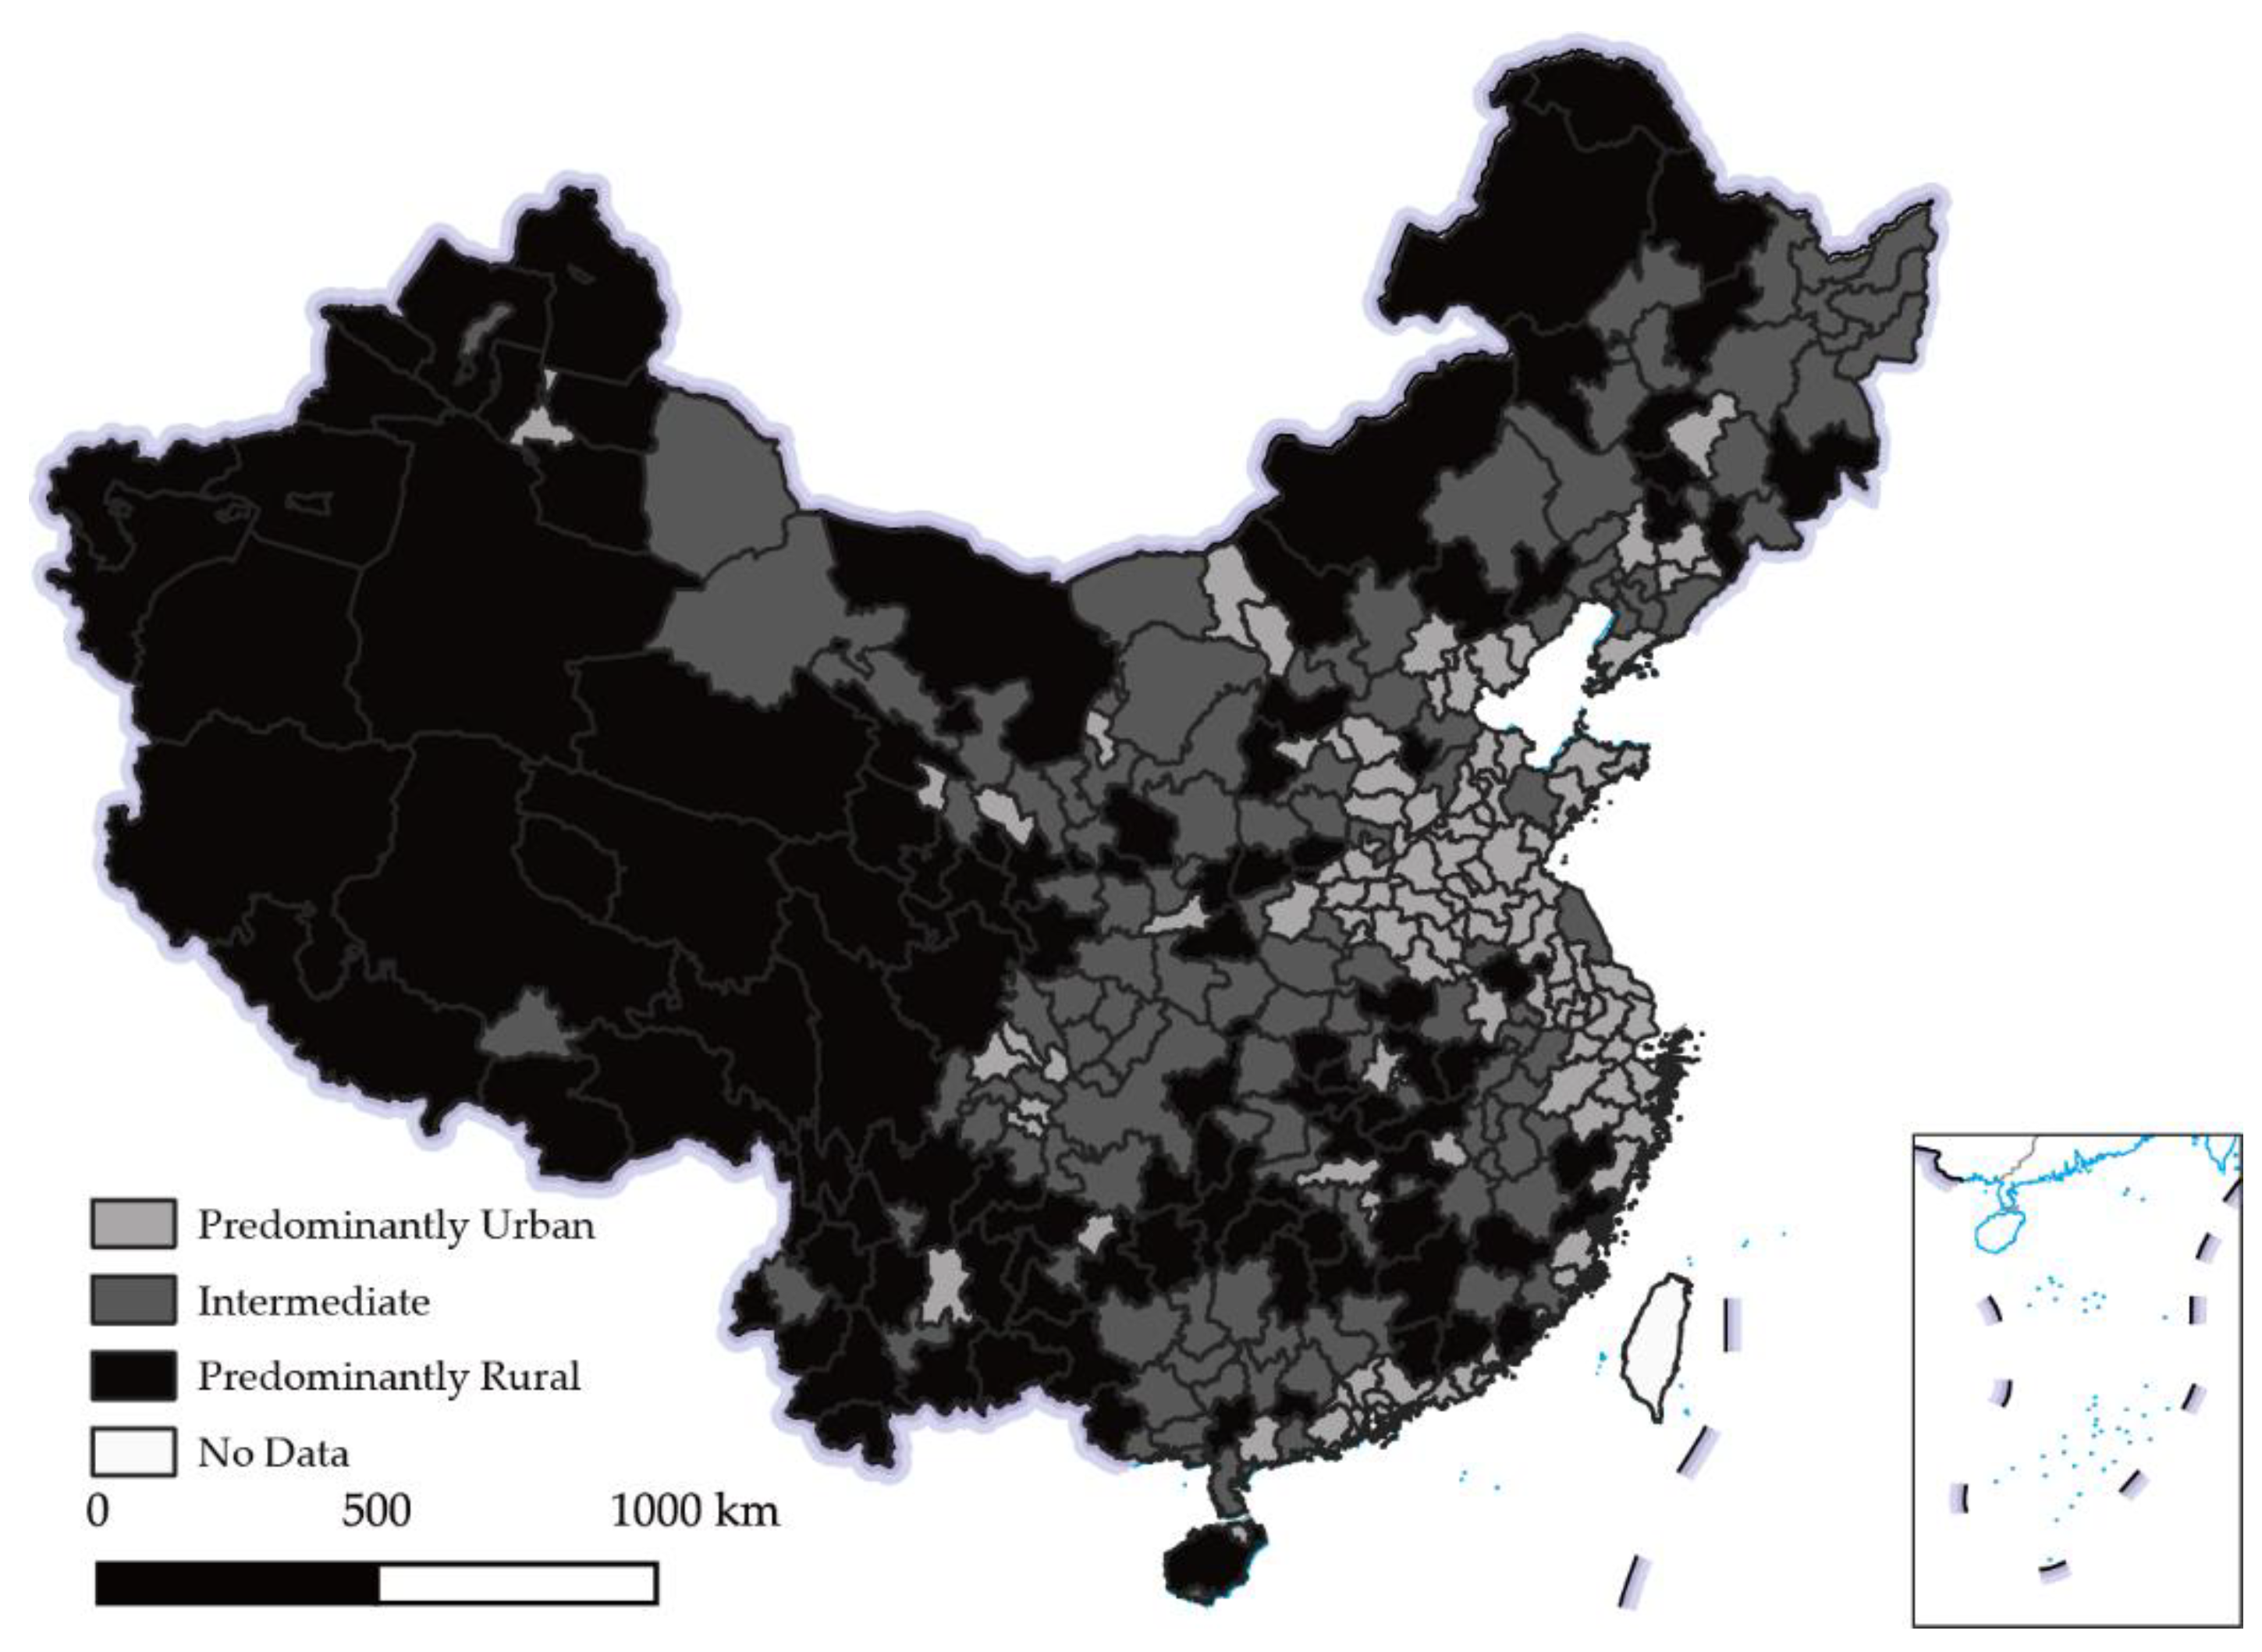
2.2. Urban and Rural Type Division and Research Area Determination
2.2.1. OECD Urban–Rural Division
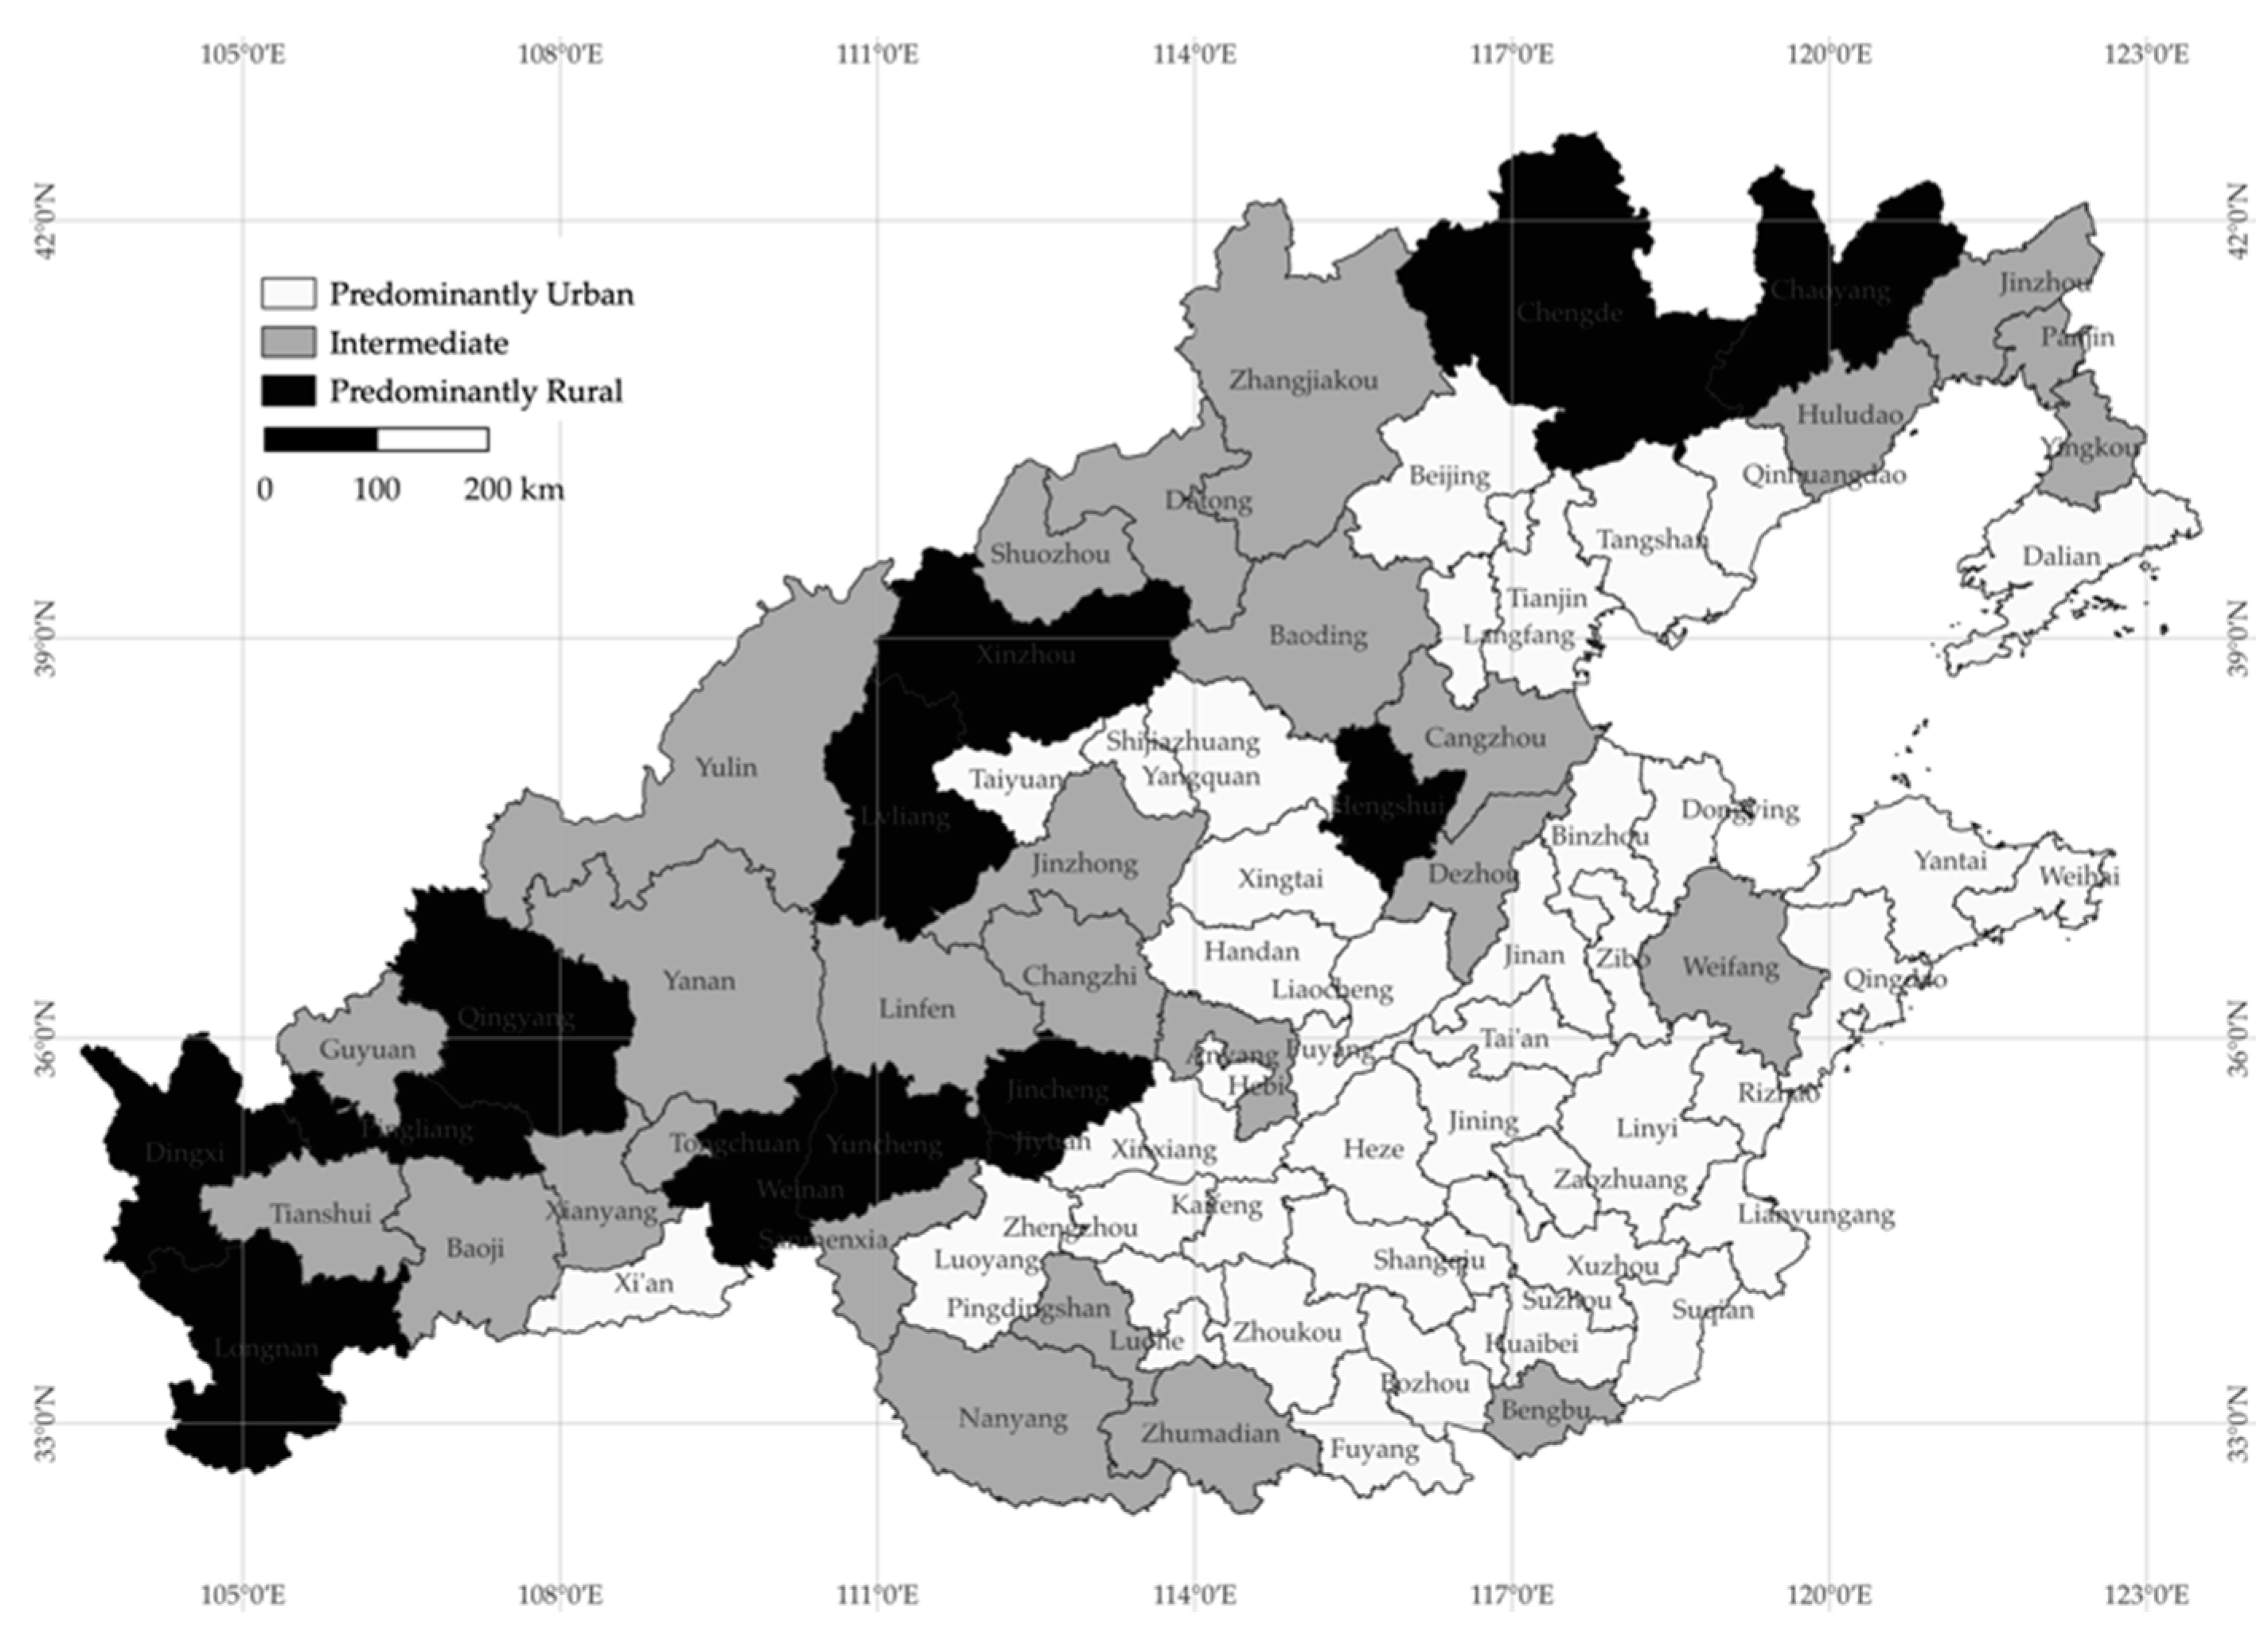
2.2.2. Study Area Determination
2.2.3. Overview of the Study Area
2.3. Construction of the Evaluation Index System for Construction of Ecological Civilization
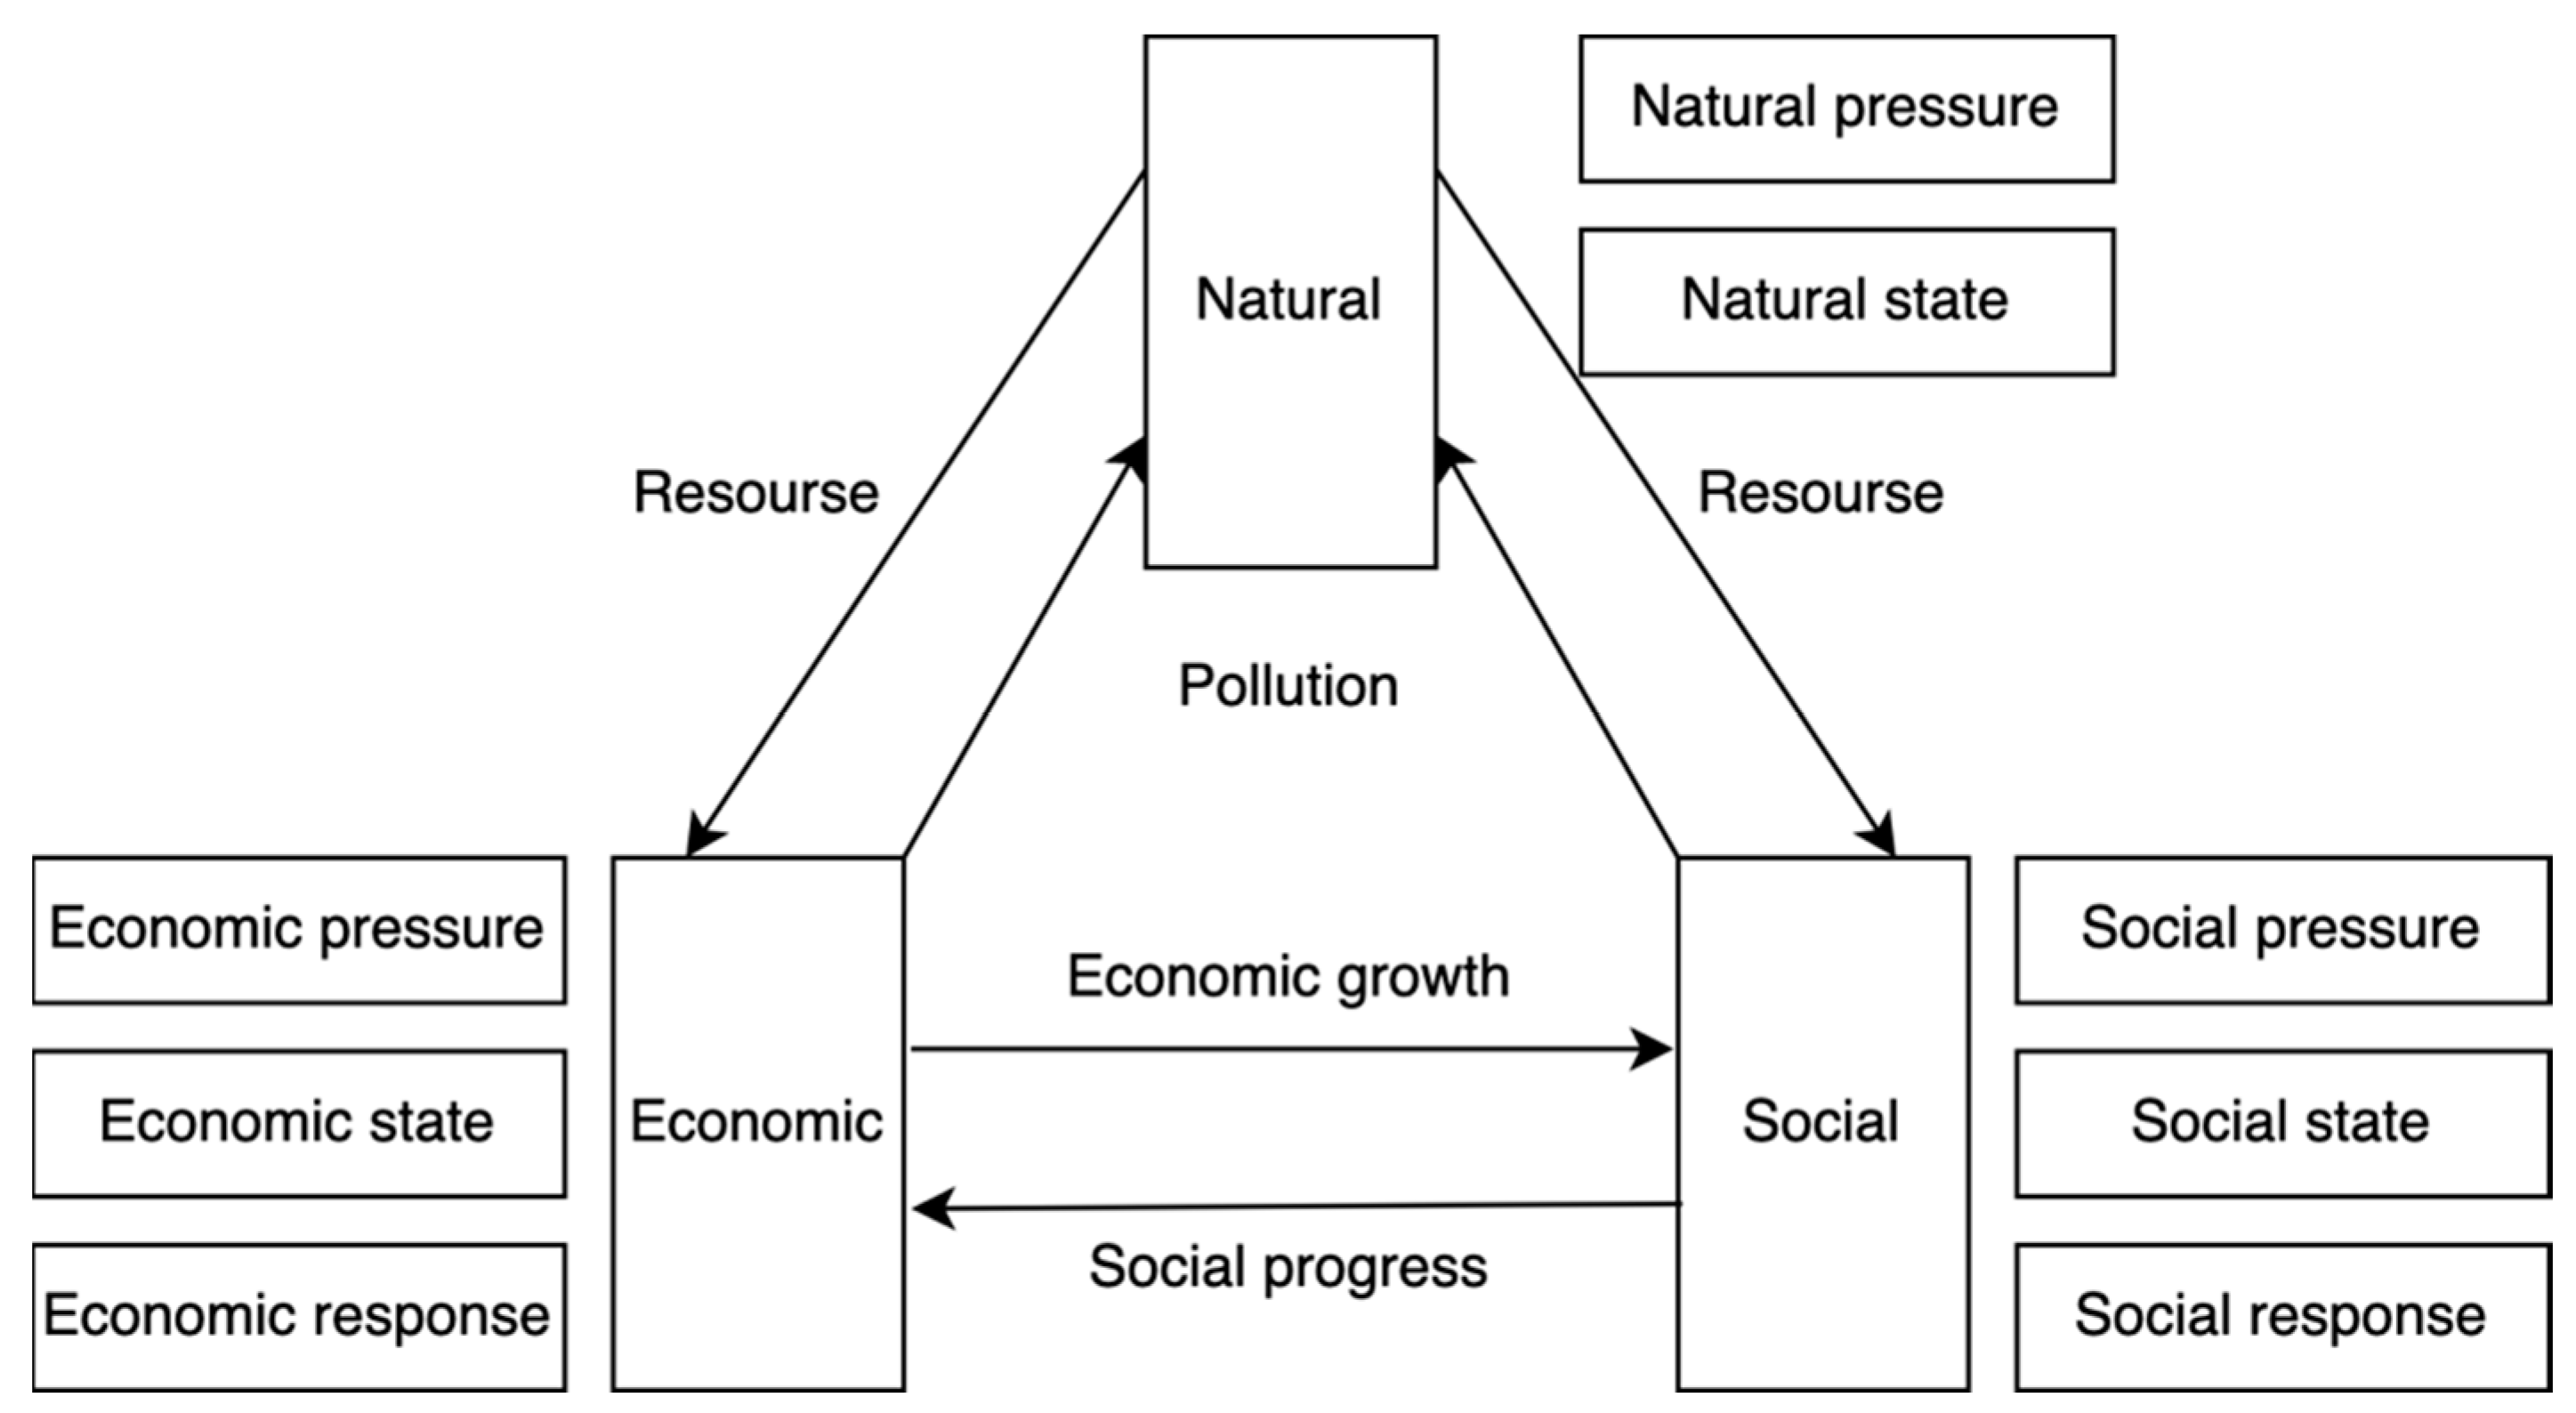
2.3.1. Multivariate System Action Relationship
2.3.2. Indicator Selection
2.4. Calculation Methods and Results of Some Indicators
2.4.1. Proportion of Space Areas for Ecological–Production–Living Types Based on CNLUCC
2.4.2. Ecosystem Service Value
2.5. Research Methods
2.5.1. Improved Entropy Method
2.5.2. Coupling Coordination Degree Model
2.5.3. Spatial Analysis Tools
2.5.4. Thiel Index
TI = ∑ (Di/DI) × ln [(Di/DI)/(Ei/EI)],
TR = ∑ (Di/DR) × ln [(Di/DR)/(Ei/ER)]
TI = ∑ (Di/DI) × ln [(Di/DI)/(1/I)],
TR = ∑ (Di/DR) × ln [(Di/DR)/(1/R)]
3. Results
3.1. Evaluation of the Coordinated Development of Construction of Ecological Civilization in Social–Economic–Natural Multisystem
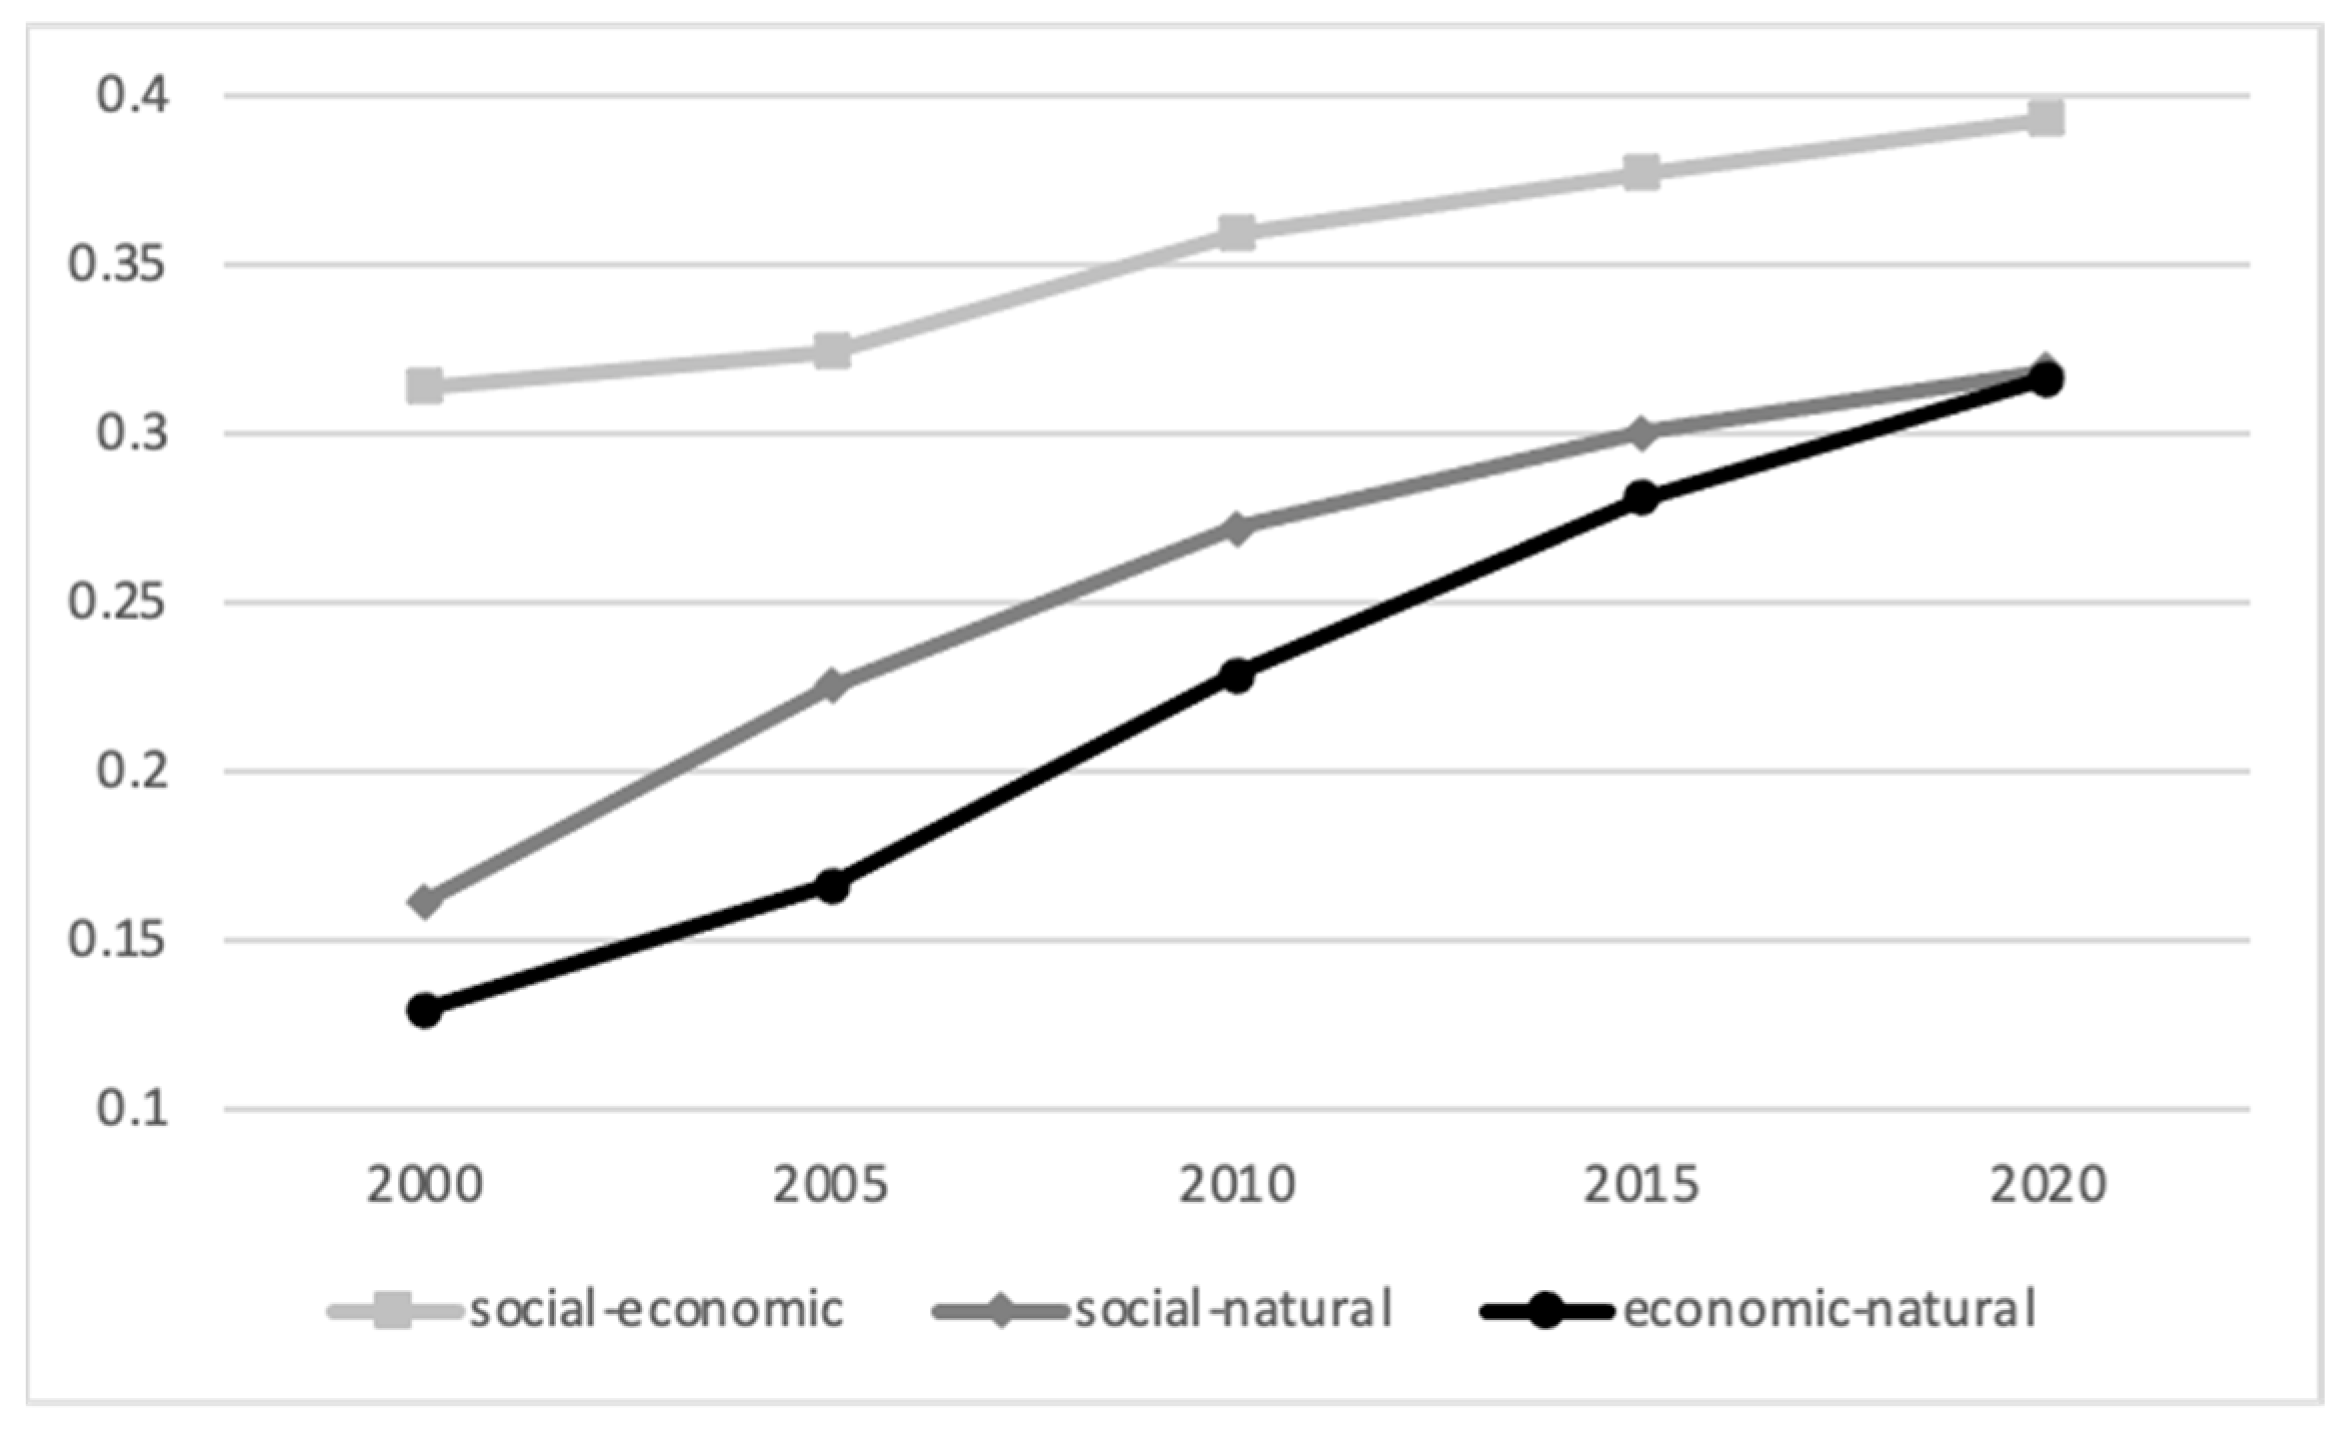
3.1.1. Analysis of the Coordinated Development of Construction of Ecological Civilization in the Dual System
3.1.2. Analysis of the Coordinated Development Coefficient of Construction of Ecological Civilization in Social–Economic–Natural Multisystem Construction
3.1.3. Analysis of the Characteristics of the Coordinated Development of Multiple Systems in the Construction of Ecological Civilization
3.2. Analysis of Spatial Properties of Multiple Systems Coupled and Coordinated in the Construction of Ecological Civilization
3.2.1. Global Spatial Autocorrelation
3.2.2. Local Spatial Autocorrelation
3.2.3. Spatial Distribution
3.3. Analysis of Urban–Rural Differences in the Coordinated Development Coefficient of Construction of Ecological Civilization
3.3.1. Analysis of Urban–Rural Differences in Social–Economic Dual System
3.3.2. Analysis of Urban–Rural Differences in Social–Economic–Natural Construction of Ecological Civilization in Multisystem
4. Conclusions and Policy Recommendations
4.1. Conclusions
4.2. Policy Recommendations
5. Discussion
Author Contributions
Funding
Institutional Review Board Statement
Data Availability Statement
Conflicts of Interest
Appendix A
Appendix B
References
- Full Text of the Report to the 20th National Congress of the Communist Party of China. Available online: https://english.www.gov.cn/news/topnews/202210/25/content_WS6357df20c6d0a757729e1bfc.html (accessed on 5 July 2023).
- Foster, J.B. The Earth-System Crisis and Ecological Civilization: A Marxian View. Int. Crit. Thought 2017, 7, 439–458. [Google Scholar] [CrossRef]
- Peng, B.; Yan, W.; Wei, G.; Wan, A. Evolution and interaction of construction of ecological civilization pattern from the perspective of path dependence–based on the panel data of Jiangsu Province, China. Environ. Dev. Sustain. 2022, 24, 12226–12247. [Google Scholar] [CrossRef]
- Wang, R.; Li, F.; Hu, D.; Li, B.L. Understanding eco-complexity: Social-Economic-Natural Complex Ecosystem approach. Ecol. Complex. 2011, 8, 15–29. [Google Scholar] [CrossRef]
- Velenturf, A.P.M.; Purnell, P. Principles for a sustainable circular economy. Sustain. Prod. Consum. 2021, 27, 1437–1457. [Google Scholar] [CrossRef]
- Tiwari, P.; Sadeghi, J.K.; Eseonu, C. A sustainable lean production framework with a case implementation: Practice-based view theory. J. Clean. Prod. 2020, 277, 123078. [Google Scholar] [CrossRef]
- Li, W.; Yi, P. Assessment of city sustainability-Coupling coordinated development among economy, society and environment. J. Clean. Prod. 2020, 256, 120453. [Google Scholar] [CrossRef]
- Wang, R.; Zhou, T.; Hu, D.; Li, F.; Liu, J. Cultivating eco-sustainability: Social–economic–natural complex ecosystem case studies in China. Ecol. Complex. 2011, 8, 273–283. [Google Scholar] [CrossRef]
- Liu, Y.; Li, H.; An, H.; Guan, J.; Shi, J.; Han, X. Are the environmental impacts, resource flows and economic benefits proportional? Analysis of key global trade routes based on the steel life cycle. Ecol. Indic. 2021, 122, 107306. [Google Scholar] [CrossRef]
- Fan, Y.; Fang, C.; Zhang, Q. Coupling coordinated development between social economy and ecological environment in Chinese provincial capital cities-assessment and policy implications. J. Clean. Prod. 2019, 229, 289–298. [Google Scholar] [CrossRef]
- Liu, Y.; Suk, S.; Cai, Y. Spatial and temporal changes in the coupling of ecological environment and tourism development: The case of Kyushu, Japan. Environ. Res. Lett. 2023, 18, 014004. [Google Scholar] [CrossRef]
- Liu, Y.; Suk, S. Coupling and Coordinating Relationship between Tourism Economy and Ecological Environment—A Case Study of Nagasaki Prefecture, Japan. Int. J. Environ. Res. Public Health 2021, 18, 12818. [Google Scholar] [CrossRef] [PubMed]
- Chen, C.; Qiao, Z.; Sun, H. The Coupling Coordination Degree Measurement of Society-Economy-Ecosystem of Regional National Forest Park in Heilongjiang Province. Tech. Gaz. 2021, 28, 779–785. [Google Scholar]
- Luo, D.; Liang, L.; Wang, Z.; Chen, L.; Zhang, F. Exploration of coupling effects in the Economy–Society–Environment system in urban areas: Case study of the Yangtze River Delta Urban Agglomeration. Ecol. Indic. 2021, 128, 107858. [Google Scholar]
- Chu, N.; Zhang, P.; Wu, X. Spatiotemporal evolution characteristics of urbanization and its coupling coordination degree in Russia—Perspectives from the population, economy, society, and eco-environment. Environ. Sci. Pollut. Res. 2022, 29, 61334–61351. [Google Scholar] [CrossRef]
- Feng, Z.; Chen, Z.; Cai, H.; Yang, Z. Evaluation of the Sustainable Development of the Social-Economic-Natural Compound Ecosystem in the Guangdong-Hong Kong-Macao Greater Bay Area Urban Agglomeration (China): Based on Complex Network Analysis. Front. Environ. Sci. 2022, 10, 938450. [Google Scholar] [CrossRef]
- Zhao, Y.; Hou, P.; Jiang, J.; Zhai, J.; Chen, Y.; Wang, Y.; Bai, J.; Zhang, B.; Xu, H. Coordination Study on Ecological and Economic Coupling of the Yellow River Basin. Int. J. Environ. Res. Public Health 2021, 18, 10664. [Google Scholar] [CrossRef]
- He, X.; Wu, L.; Shen, G.; Peng, X.; Huang, L. A Spatiotemporal Analysis of Ecological–Economic Coupling Coordination in the Chengdu–Chongqing Urban Agglomeration. Land 2023, 12, 1378. [Google Scholar] [CrossRef]
- Bianco, V.; Proskuryakova, L.; Starodubtseva, A. Energy inequality in the Eurasian Economic Union. Renew. Sustain. Energy Rev. 2021, 146, 111155. [Google Scholar] [CrossRef]
- Li, Z.; Deng, X.; Zhang, Y. Evaluation and convergence analysis of socio-economic vulnerability to natural hazards of Belt and Road Initiative countries. J. Clean. Prod. 2021, 282, 125406. [Google Scholar] [CrossRef]
- Yang, W.; Li, D. Spatio-temporal evolution of ecological environment quality in China from a concept of strong sustainability. Environ. Sci. Pollut. Res. 2022, 29, 28769–28787. [Google Scholar] [CrossRef]
- Cui, Y.; Khan, S.U.; Sauer, J.; Zhao, M. Exploring the spatiotemporal heterogeneity and influencing factors of agricultural carbon footprint and carbon footprint intensity: Embodying carbon sink effect. Sci. Total Environ. 2022, 846, 157507. [Google Scholar] [CrossRef] [PubMed]
- Du, B.; Wang, Y.; He, J.; Li, W.; Chen, X. Spatio-Temporal Characteristics and Obstacle Factors of the Urban-Rural Integration of China’s Shrinking Cities in the Context of Sustainable Development. Sustainability 2021, 13, 4203. [Google Scholar] [CrossRef]
- Chen, L.; Shen, W. Spatiotemporal differentiation of urban-rural income disparity and its driving force in the Yangtze River Economic Belt during 2000- 2017. PLoS ONE 2021, 16, e0245961. [Google Scholar] [CrossRef]
- Xu, X.; Liu, J.; Zhang, S.; Li, R.; Yan, C.; Wu, S. China’s Multi-Period Land Use Land Cover Remote Sensing Monitoring Dataset (CNLUCC). Data Registration and Publishing System of the Resource and Environmental Science Data Center of the Chinese Academy of Sciences. Available online: https://www.resdc.cn/doi/doi.aspx?DOIid=54 (accessed on 15 August 2023).
- Zhao, H.; Jiang, X.; Gu, B.; Wang, K. Evaluation and Functional Zoning of the Ecological Environment in Urban Space—A Case Study of Taizhou, China. Sustainability 2022, 14, 6619. [Google Scholar] [CrossRef]
- Zhu, S.; Li, D.; Feng, H.; Zhang, N. The influencing factors and mechanisms for urban flood resilience in China: From the perspective of social-economic-natural complex ecosystem. Ecol. Indic. 2023, 147, 109959. [Google Scholar] [CrossRef]
- Fu, B. Promoting Geography for Sustainability. Geogr. Sustain. 2020, 1, 1–7. [Google Scholar] [CrossRef]
- He, Y.; Wang, W.; Chen, Y.; Yan, H. Assessing spatio-temporal patterns and driving force of ecosystem service value in the main urban area of Guangzhou. Sci. Rep. 2021, 11, 3027. [Google Scholar] [CrossRef]
- Zhai, R.; Zhang, C.; Li, W.; Zhang, X.; Li, X. Evaluation of Driving Forces of Land Use and Land Cover Change in New England Area by a Mixed Method. ISPRS Int. J. Geo-Inf. 2020, 9, 350. [Google Scholar] [CrossRef]
- Liu, W.; Wu, W.; Thakuriah, P.; Wang, J. The geography of human activity and land use: A big data approach. Cities 2020, 97, 102523. [Google Scholar] [CrossRef]
- Dong, Y.; Zhou, Y.; Zhang, L.; Gu, Y.; Sutrisno, D. Intensive land-use is associated with development status in port cities of Southeast Asia. Environ. Res. Lett. 2023, 18, 044006. [Google Scholar] [CrossRef]
- Tang, J.; Li, Y.; Cui, S.; Xu, L.; Ding, S.; Nie, W. Linking land-use change, landscape patterns, and ecosystem services in a coastal watershed of southeastern China. Glob. Ecol. Conserv. 2020, 23, e01177. [Google Scholar] [CrossRef]
- Fan, Y.; Yu, G.; He, Z.; Yu, H.; Bai, R.; Yang, L.; Wu, D. Entropies of the Chinese Land Use/Cover Change from 1990 to 2010 at a County Level. Entropy 2017, 19, 51. [Google Scholar] [CrossRef]
- Zhao, H.; Xu, X.; Tang, J.; Wang, Z.; Miao, C. Understanding the key factors and future trends of ecosystem service value to support the decision management in the cluster cities around the Yellow River floodplain area. Ecol. Indic. 2023, 154, 110544. [Google Scholar] [CrossRef]
- He, Y.; Zhang, H. Comprehensive Evaluation of the Provincial Sustainable Tourismization Level in China and Its Temporal and Spatial Differences. Sustainability 2021, 13, 10475. [Google Scholar] [CrossRef]
- Tu, D.; Cal, Y.; Liu, M. Coupling coordination analysis and spatiotemporal heterogeneity between ecosystem services and new-type urbanization: A case study of the Yangtze River Economic Belt in China. Ecol. Indic. 2023, 154, 110535. [Google Scholar] [CrossRef]
- Xie, H.; Li, Z.; Xu, Y. Study on the Coupling and Coordination Relationship between Gross Ecosystem Product (GEP) and Regional Economic System: A Case Study of Jiangxi Province. Land 2022, 11, 1540. [Google Scholar] [CrossRef]
- Moran, P.A.P. Notes on continuous stochastic phenomena. Biometrika 1950, 37, 17–23. [Google Scholar] [CrossRef]
- Anselin, L. Local Indicators of Spatial Association—LISA. Geogr. Anal. 1995, 27, 93–115. [Google Scholar] [CrossRef]
- Yuill, R.S. The Standard Deviational Ellipse; An Updated Tool for Spatial Description. Geogr. Ann. 1971, 53, 28–39. [Google Scholar] [CrossRef]
- Tveite, H. The QGIS Standard Deviational Ellipse Plugin. Available online: http://plugins.qgis.org/plugins/SDEllipse/ (accessed on 15 August 2023).


| Target Layer | Order Parameter Layer | Indicators | Units | Index Direction |
|---|---|---|---|---|
| Social | Social pressure | Ratio of Living Space | % | + |
| Growth of Population | % | - | ||
| Electricity Consumption by Society | Million kW·h | - | ||
| Social state | Higher Education Enrolment | Person | + | |
| Number of Beds in Health Institutions | Bed | + | ||
| Collections of Public Libraries | 1000 copies | + | ||
| Social response | Number of Buses and Trolley Buses in Operation | Unit | + | |
| Centralized Treatment Rate of Sewage Treatment Plants | % | + | ||
| Rate of Domestic Garbage Harmless Treatment | % | + | ||
| Economic | Economic pressure | Ratio of Production Space | % | - |
| Number of Industrial Enterprises above Designated Size | Unit | - | ||
| Gross Regional Product Growth Rate | % | + | ||
| Economic state | Total Retail Sales of Consumer Goods | 10,000 CNY | + | |
| Per Capita Disposable Income of Urban Households | CNY | + | ||
| Per Capita Disposable Income of Rural Households | CNY | + | ||
| Economic response | The Proportion of Tertiary Industry in GDP | % | + | |
| Expenditure for Science and Technology | 10,000 CNY | + | ||
| Total Power of Agricultural Machinery | 10,000 kW | + | ||
| Natural | Natural pressure | Total Volume of Sulphur Dioxide Emission by Industry | Ton | - |
| Total Volume of Industrial Waste Water Discharge | 10,000 tons | - | ||
| Consumption of Chemical Fertilizers | Ton | - | ||
| Natural state | Ecosystem Service Value | CNY | + | |
| SHEI | - | + | ||
| CONTAG | % | + |
| Ecological–Production–Living Spaces | CNLUCC Classification |
|---|---|
| Production space | 11 Paddy Field, 12 Dry Land, 53 Other Built-up Land |
| Living space | 51 Urban Built-up, 52 Rural Settlements |
| Ecological space | 21 Forest, 22 Shrub, 23 Woods, 24 Other Woodland, 31 Dense Grass, 32 Moderate Grass, 33 Sparse Grass, 41 Stream and Rivers, 42 Lakes, 43 Reservoir and Ponds, 44 Permanent Ice and Snow, 45 Beach and Shore, 46 Bottomland, 61 Sandy Land, 62 Gobi, 63 Salina, 64 Swampland, 65 Bare Soil, 66 Bare Rock, 67 Others |
| Year | Indicators | Production Space | Living Space | Living Space |
|---|---|---|---|---|
| 2000 | Area/104 km2 | 54.82 | 7.09 | 42.55 |
| Ratio/% | 52.08 | 6.78 | 40.73 | |
| 2005 | Area/104 km2 | 54.29 | 7.48 | 42.69 |
| Ratio/% | 51.97 | 7.16 | 40.87 | |
| 2010 | Area/104 km2 | 53.4 | 9.1 | 42.05 |
| Ratio/% | 51.08 | 8.7 | 40.22 | |
| 2015 | Area/104 km2 | 53.1 | 9.47 | 42 |
| Ratio/% | 50.78 | 9.05 | 40.16 | |
| 2020 | Area/104 km2 | 52.35 | 9.7 | 42.56 |
| Ratio/% | 50.05 | 9.27 | 40.68 | |
| 2000–2005 | Land Use Dynamic Degree/% | −0.19 | 1.12 | 0.07 |
| Land Use Dynamic Degree/% | −0.33 | 4.32 | −0.3 | |
| 2005–2010 | Land Use dynamic Degree/% | −0.11 | 0.81 | −0.03 |
| Land Use Dynamic Degree/% | −0.29 | 0.48 | 0.26 | |
| 2010–2015 | Area/104 km2 | 54.82 | 7.09 | 42.55 |
| Ratio/% | 52.08 | 6.78 | 40.73 | |
| 2015–2020 | Area/104 km2 | 54.29 | 7.48 | 42.69 |
| Ratio/% | 51.97 | 7.16 | 40.87 |
| Ecosystem Classification | First Class | Farmland | Forest Land | Grassland | Wetland | Bare Land | |
|---|---|---|---|---|---|---|---|
| Second Class | Dry Land | Paddy Field | |||||
| Provisioning services | Food | 1160.60 | 1856.96 | 344.77 | 409.62 | 894.35 | 6.83 |
| Materials | 546.17 | 122.89 | 791.94 | 607.61 | 498.38 | 20.48 | |
| Water | 27.31 | −3591.04 | 409.62 | 334.53 | 7427.86 | 13.65 | |
| Regulating services | Air quality regulation | 914.83 | 1515.61 | 2604.53 | 2123.22 | 1822.83 | 88.75 |
| Climate regulation | 491.55 | 778.29 | 7793.11 | 5618.68 | 4021.15 | 68.27 | |
| Waste treatment | 136.54 | 232.12 | 2283.66 | 1856.96 | 6246.77 | 279.91 | |
| Regulation of water flows | 368.66 | 3713.93 | 5099.82 | 4116.73 | 86,342.01 | 163.85 | |
| Support Services | Soil conservation | 1406.38 | 13.65 | 3171.18 | 2587.46 | 2211.97 | |
| Maintenance of soil fertility | 163.85 | 259.43 | 242.36 | 197.99 | 170.68 | ||
| Maintain biodiversity | 177.50 | 286.74 | 2887.85 | 2355.34 | 7113.81 | ||
| Cultural services | Provide aesthetic landscape sum | 81.92 | 122.89 | 1266.42 | 1037.72 | 4519.52 | |
| 2000 | 2005 | 2010 | 2015 | 2020 | |
|---|---|---|---|---|---|
| Moran’s I | 0.263 | 0.337 | 0.327 | 0.291 | 0.255 |
| p-value | 0.001 | 0.001 | 0.001 | 0.001 | 0.001 |
| Categories | 2000 | 2020 |
|---|---|---|
| High–high | Tianjin, Cangzhou, Langfang, Yantai, Weifang, Tai’an, Linyi | Tianjin, Langfang, Yantai, Weifang |
| Low–low | Jincheng, Yuncheng, Linfen, Xianyang, Yan’an, Yulin, Tianshui, Pingliang, Qingyang, Dingxi, Longnan, Guyuan | Jincheng, Yuncheng, Linfen, Yan’an, Yulin, Tianshui, Pingliang, Qingyang, Dingxi, Longnan, Guyuan |
| Low–high | Chengde, Binzhou | Chengde, Rizhao |
| High–low | Taiyuan | Taiyuan |
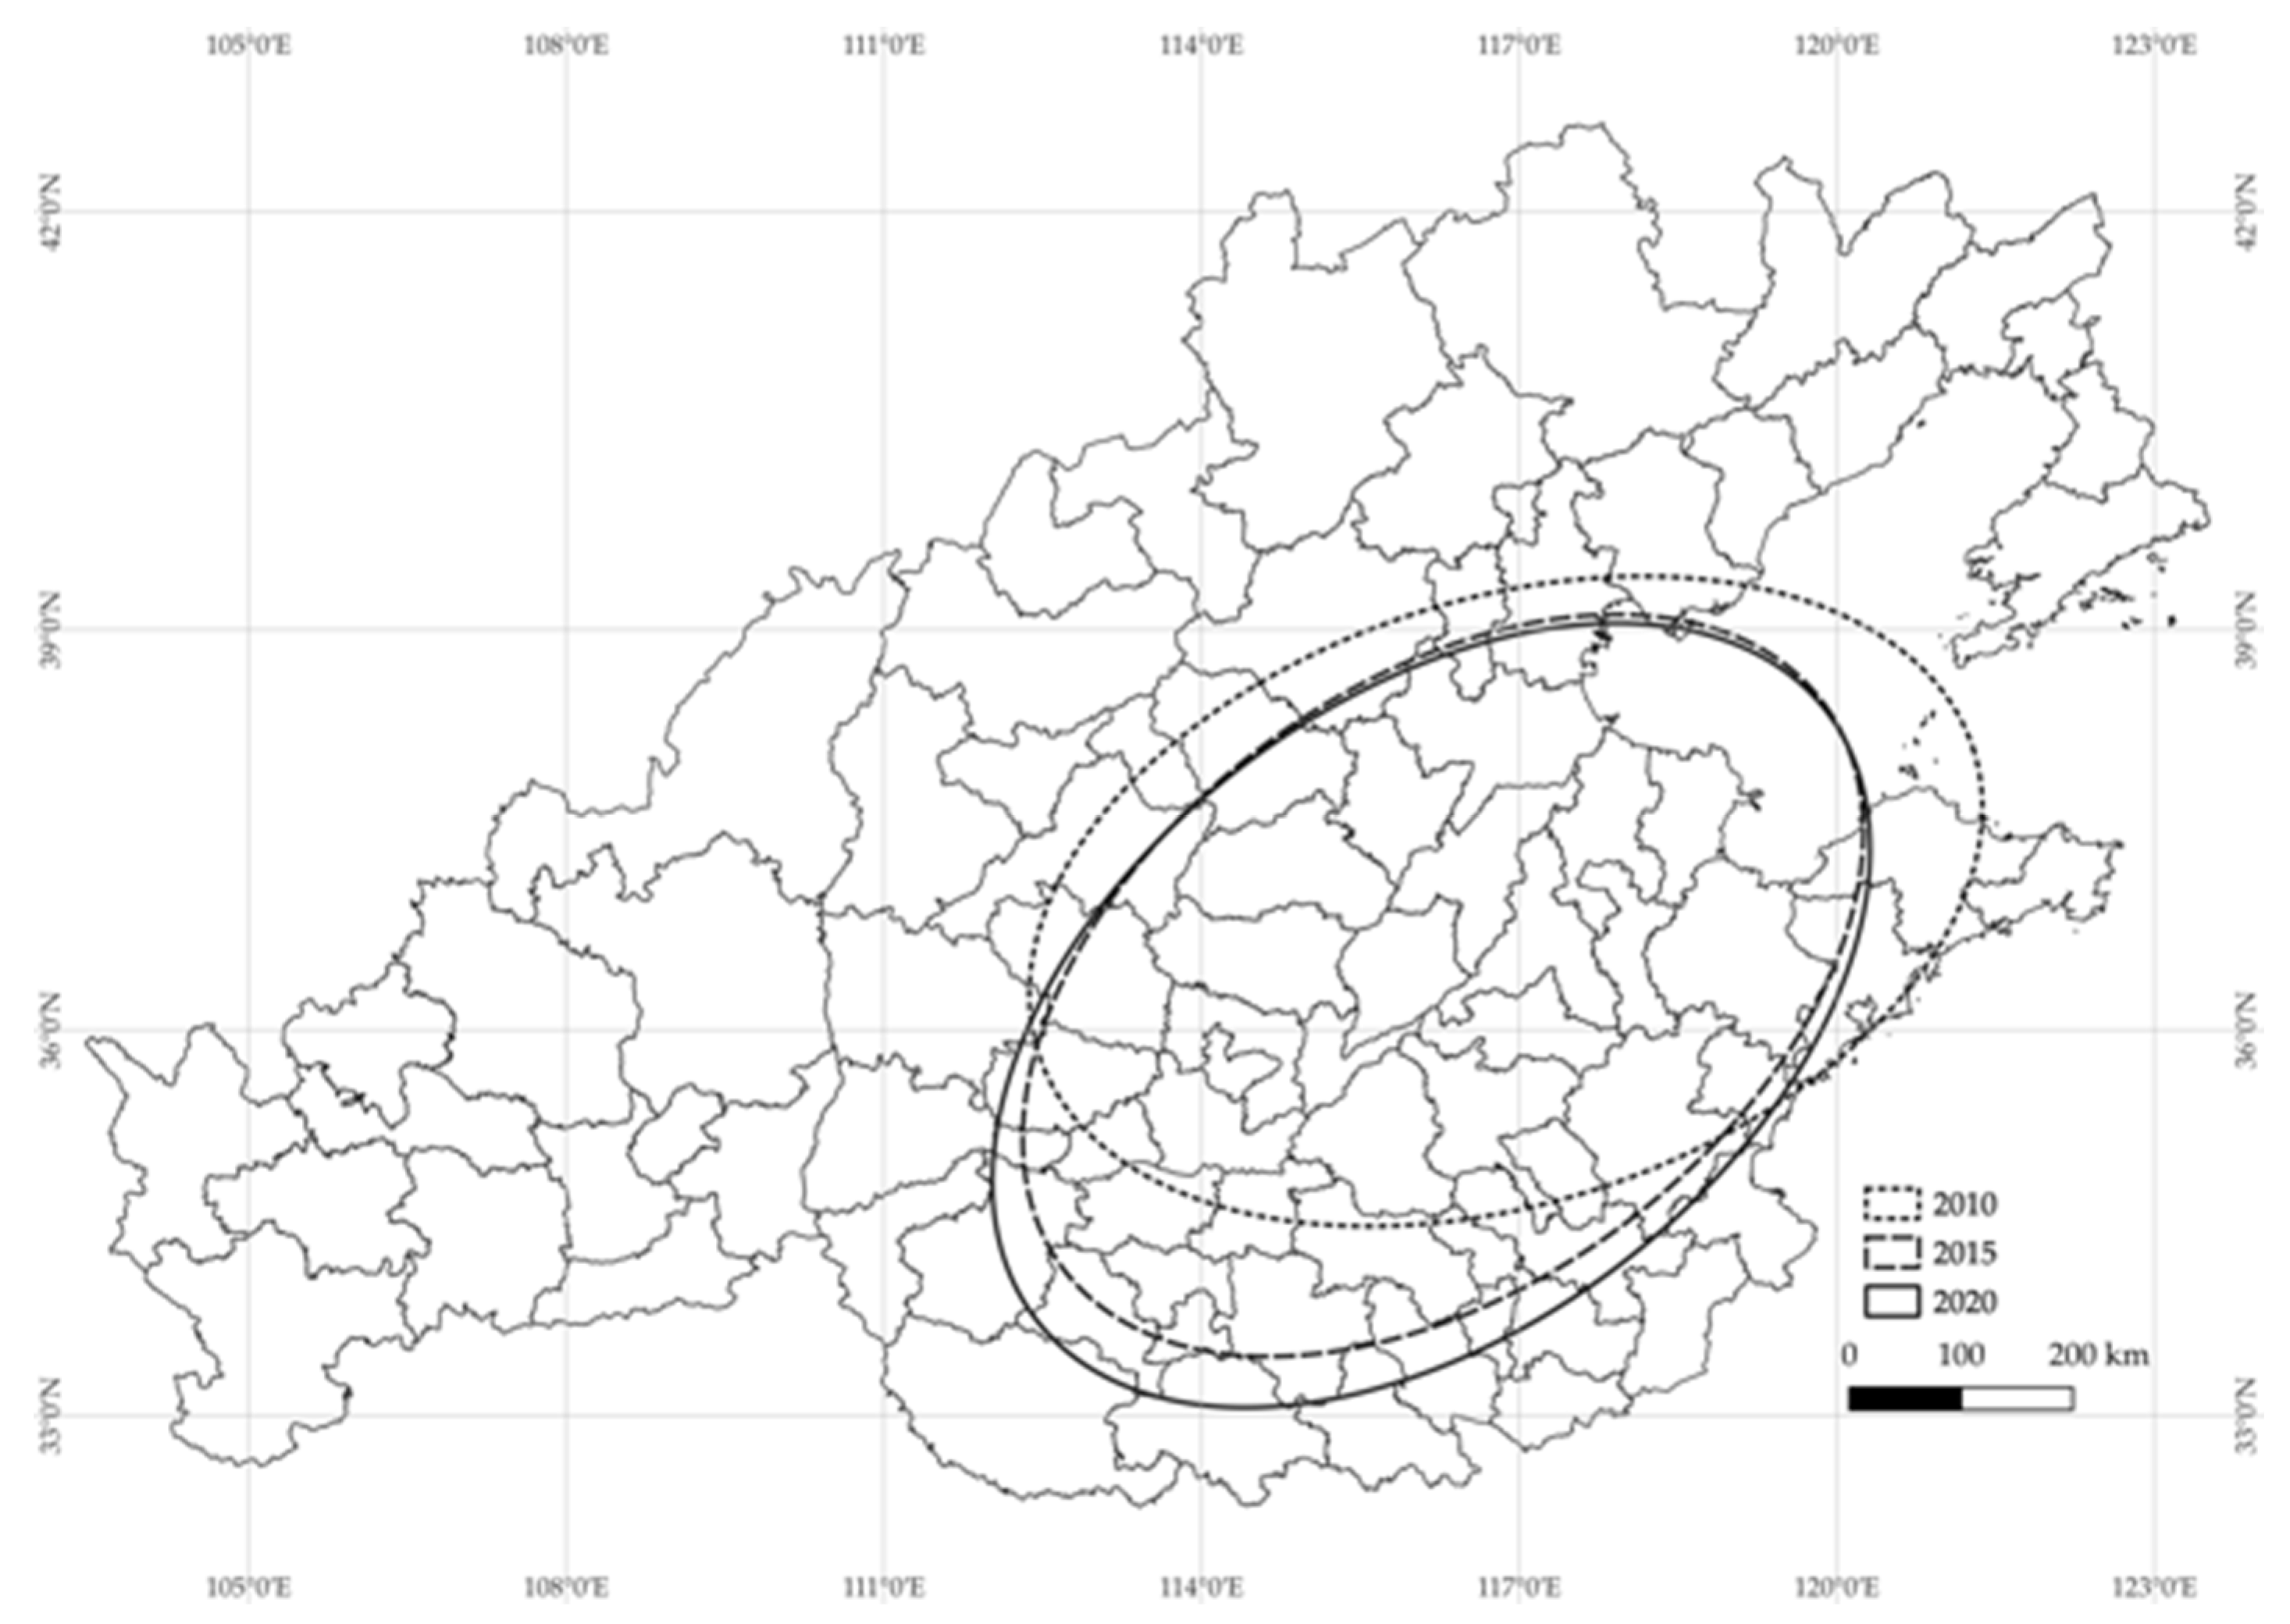
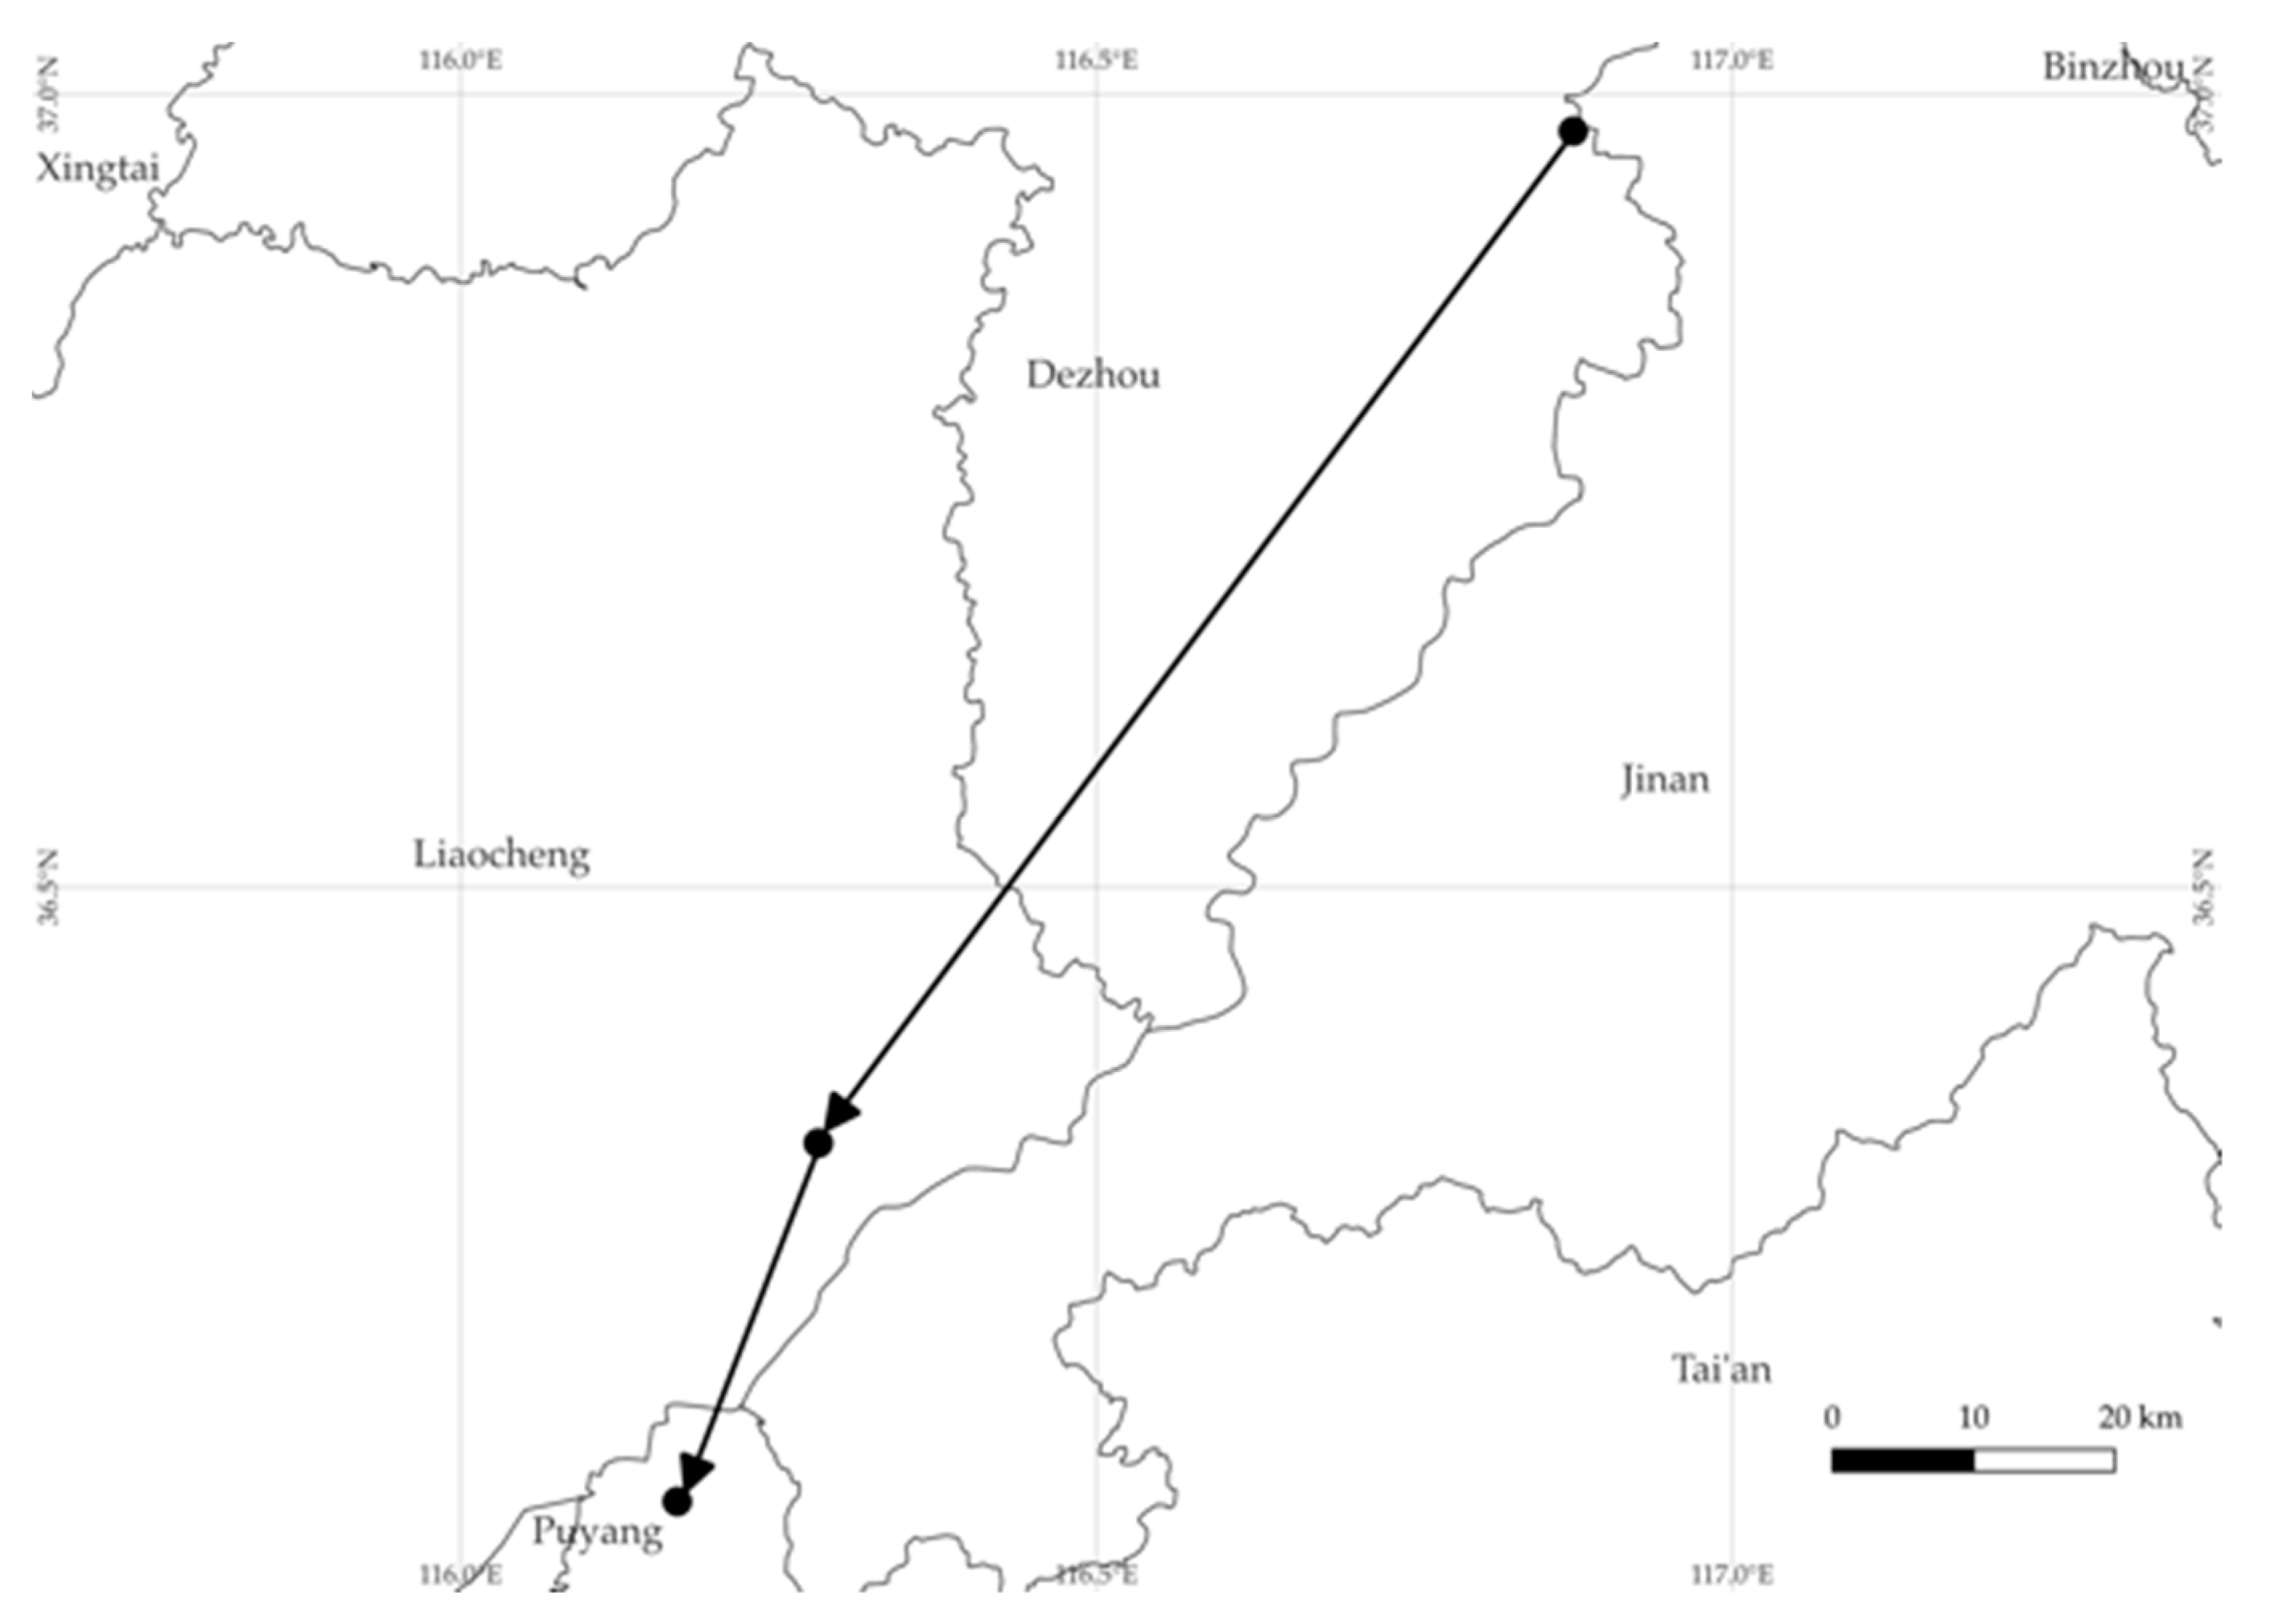
| Years | Mean x and Mean y | Majorsd/km | Minorsd/km | Area/km2 | Eccentricity/° |
|---|---|---|---|---|---|
| 2010 | 116.8751° E, 36.9766° N | 516.87 | 317.35 | 515,311.01 | 71.9 |
| 2015 | 116.2814° E, 36.3381° N | 498.22 | 315.06 | 493,134.205 | 53.41 |
| 2020 | 116.1703° E, 36.1110° N | 524.36 | 328.82 | 541,682.736 | 52.44 |
| Weight | Total | Between Urban and Rural | Within Urban and Rural | Predominantly Urban | Intermediate | Predominantly Rural |
|---|---|---|---|---|---|---|
| Ecosystem Service Value | 0.19 | 0.01 (0.07) | 0.17 (0.93) | 0.2 (0.52) | 0.17 (0.29) | 0.17 (0.13) |
| Total Volume of Industrial Waste Water Discharge | 0.57 | 0.26 (0.45) | 0.31 (0.55) | 0.36 (0.31) | 0.26 (0.14) | 0.38 (0.09) |
| Weight | Total | Between Urban and Rural | Within Urban and Rural | Predominantly Urban | Intermediate | Predominantly Rural |
|---|---|---|---|---|---|---|
| Social–economic–natural | 0.05 | 0.01 (0.23) | 0.04 (0.77) | 0.02 (0.35) | 0.01 (0.26) | 0.01 (0.17) |
Disclaimer/Publisher’s Note: The statements, opinions and data contained in all publications are solely those of the individual author(s) and contributor(s) and not of MDPI and/or the editor(s). MDPI and/or the editor(s) disclaim responsibility for any injury to people or property resulting from any ideas, methods, instructions or products referred to in the content. |
© 2023 by the authors. Licensee MDPI, Basel, Switzerland. This article is an open access article distributed under the terms and conditions of the Creative Commons Attribution (CC BY) license (https://creativecommons.org/licenses/by/4.0/).
Share and Cite
Zhou, X.; Wang, J. Evaluation and Differentiation Analysis of China’s Construction of Ecological Civilization from the Perspective of Collaboration: Using China’s Representative Region as an Example. Sustainability 2023, 15, 13403. https://doi.org/10.3390/su151813403
Zhou X, Wang J. Evaluation and Differentiation Analysis of China’s Construction of Ecological Civilization from the Perspective of Collaboration: Using China’s Representative Region as an Example. Sustainability. 2023; 15(18):13403. https://doi.org/10.3390/su151813403
Chicago/Turabian StyleZhou, Xue, and Jiapeng Wang. 2023. "Evaluation and Differentiation Analysis of China’s Construction of Ecological Civilization from the Perspective of Collaboration: Using China’s Representative Region as an Example" Sustainability 15, no. 18: 13403. https://doi.org/10.3390/su151813403